 D. H. Souza
 M. Parra
 I. del Rio
 A. O. Sawakuchi
 F. N. Pupim
 J. S. Hernández-González
 S. Gomez
95% of researchers rate our articles as excellent or good
Learn more about the work of our research integrity team to safeguard the quality of each article we publish.
Find out more
ORIGINAL RESEARCH article
Front. Earth Sci. , 23 March 2022
Sec. Quaternary Science, Geomorphology and Paleoenvironment
Volume 10 - 2022 | https://doi.org/10.3389/feart.2022.808718
This article is part of the Research Topic Landscape Evolution of the Tropical Regions: Dates, Rates and Beyond View all 7 articles
The Tatacoa Desert (TD) is a Cenozoic basin between the Central and Eastern Cordilleras in the southern Colombian Andes. Its sparse vegetation and Badlands morphology resemble a semi-arid environment, despite receiving ∼1,300 mm of mean annual precipitation. Based on optically stimulated luminescence dating in two fluvial terraces and drainage morphometric analysis, we propose that such “aridification” was imposed by a drainage reorganization during the Late Pleistocene. No river coming from the neighboring mountains flows into the TD. This makes the Tatacoa rivers unable to balance the evapotranspiration effect, causing a surficial water deficit. A fluvial terrace (TAT-2) works as a divide between the Tatacoa catchments and the Cabrera River, the latter coming from the Eastern Cordillera and bounding the TD towards the north. Paleocurrent measurements on its sedimentary lithic clasts point to a W-NW-directed flow into the TD. Thus, OSL ages around 74.1 ± 7.0 ka in this terrace suggest the TD was drained by an Eastern Cordillera catchment during the Late Pleistocene. At the western end of the TD, a dissected fluvial terrace (TAT-1) lying 80 m above the Magdalena River ages between 6.3 ± 1.5 and 7.7 ± 1.5 ka, representing the Holocene incision rates of 10.8 ± 0.3 mm/y. Coupled OSL data and river longitudinal profile analysis show a high susceptibility to erosion of the Tatacoa rocks and estimate incision rates ranging from 2–5 mm/y to 10–20 mm/y within the TD. The higher rates are concentrated along knickpoints related to anticlines and thrust faults. Thus, a northward shift of the Cabrera River and a westward migration of the Magdalena Valley have drastically reduced the surficial water availability in the Tatacoa and the development of vegetation, increasing erodibility. Potential climatic and tectonic drivers include 1) terrace accumulation during the wet periods of Marine Isotope Stage 5A and 1; 2) fault-induced incision of the Magdalena River in the NW, which would have favored northward migration of tributaries such as the Cabrera River; and 3) activity on the Baraya thrust fault, which would have prevented rivers from the Eastern Cordillera to enter the desert.
The Tatacoa Desert (TD) lies between ∼3.2 and 2.3°N L in the Upper Magdalena Valley, a Cenozoic intermontane basin between the Central and Eastern Cordillera in the Andes of Southern Colombia (Figure 1). Its highly erodible interbedded sandstone and mudstone rocks of the Middle Miocene Honda Group coupled with a semi-arid environment yield a scenario of Badlands that attracts tourists worldwide. Interestingly, such a semi-arid environment that forms a tropical dry forest (Hermelin, 2016) marked by cactus vegetation, reptiles, and small rodents occurs despite ∼1,300 mm of mean annual precipitation (Figure 1C), which in part is due to intense evapotranspiration, estimated to be >1,600 mm/y (IDEAM, 2012).
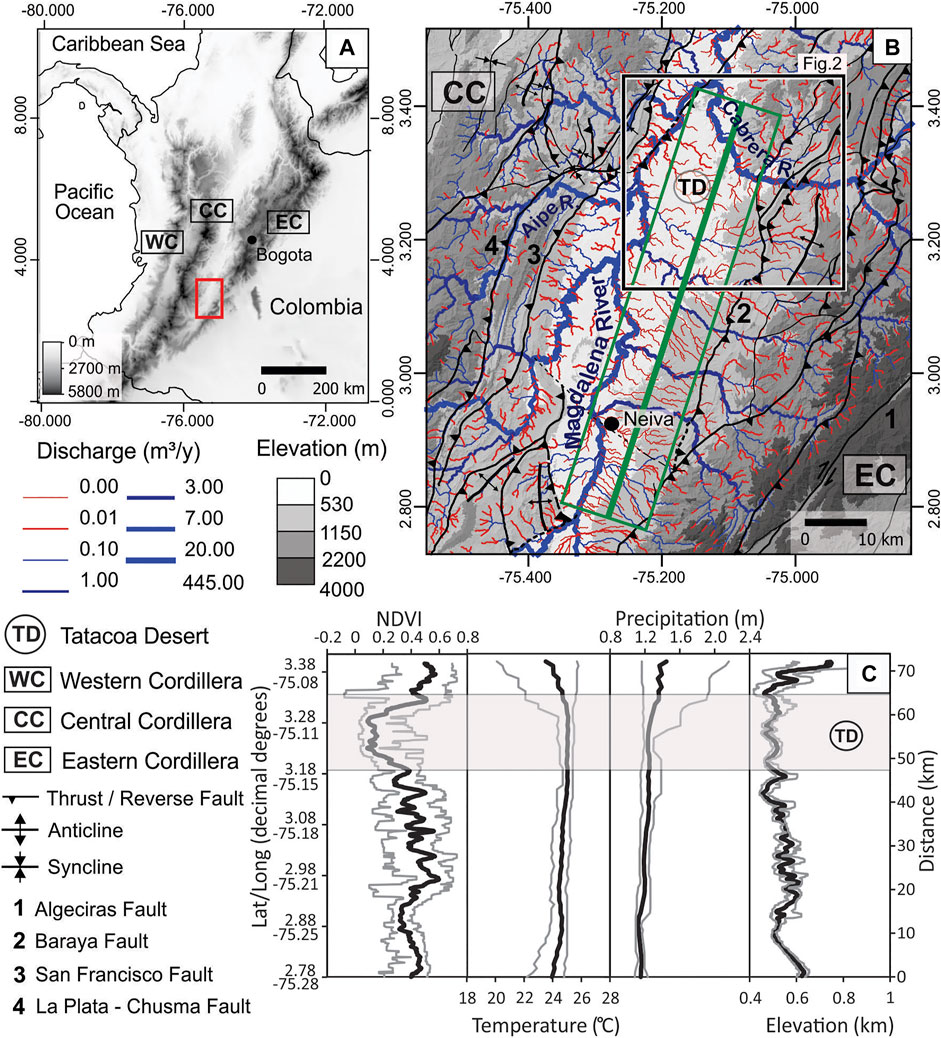
FIGURE 1. Location and regional context of the Tatacoa Desert: (A) topographic map showing the location of the study area within the Colombian Andes; (B) close-up view of the Upper Magdalena Valley. The location of a 20 km wide, along-strike swath profile is shown by the green rectangle. A proxy for discharge was estimated by considering the drainage area, the mean annual precipitation, and the potential evapotranspiration index. The black square is the location of Figure 2; and (C) variation of vegetation (NDVI index (Supplementary Figure S1) from Copernicus Copernicus Sentinel data, 2021), mean annual temperature, and mean annual precipitation (Chelsea database—Karger et al. (2017; 2017)) along the Upper Magdalena Valley. The thick black lines indicate the mean values across the swath profile; the gray lines correspond to the minimum and maximum values. It is noted that the swath profile is inclined to NNE, the coordinates refer to the thick green line in the center of the rectangle in (B). See supplementary material for further information on the NDVI and discharge calculation. DEM data from German Aerospace Center-TanDEM-X, 2019.
A different environment during the Middle Miocene is recorded by the sedimentary rocks of the Honda Group that crop out in the area: the TD area was a wet tropical forest inserted in a fluvial valley with eastward flowing meandering and anastomosing rivers that were fed by the elevated Central Cordillera (Guerrero, 1997; Anderson et al., 2016). This context is supported by the rich fossil archives including vertebrate fossils typical of freshwater aquatic environments such as fish, turtles, and crocodiles (Madden et al., 1997), as well as the fossils of monkeys, bats, and birds, typical of tropical forests (Kay and Madden, 1997). Thus, the depositional environment of the Honda Group could be comparable to the current eastern Colombia foreland Llanos Basin, where large eastward flowing meandering systems occur under a region in which annual precipitation exceeds 2000 mm (Guerrero, 1997). Such environmental shifts must have occurred anytime between ∼10 Ma and the recent past. A possible contributing mechanism for such a change is the uplift of the Eastern Cordillera (EC) (Mora et al., 2006; Parra et al., 2009; Horton et al., 2010), as this mountain range retains and diverts part of the moisture from the lower-altitude easterly winds (Kalnay et al., 1996; Saylor et al., 2009). In addition, the EC uplift also changed the hydrological configuration of the Magdalena Basin, isolating it from the Amazon basin and, hence, leading to the current northward general flow of the Magdalena River (Guerrero, 1997; Hoorn et al., 2010; Anderson et al., 2016).
The current general tropical wet–dry climate with savannah-like vegetation was progressively established along the Upper Magdalena Valley concomitantly with the Eastern Cordillera. Notably, in the Tatacoa area, the vegetation becomes sparser, resembling a completely semi-arid environment, even though the climatic conditions of the TD do not significantly change from other areas of the Upper Magdalena Valley (Figure 1C and Supplementary Figure S1). Therefore, additional explanations are needed for the local “aridification” of the Tatacoa environment, here understood as the vegetation type and its scarcity, as well as the formation of Badlands despite considerable precipitation. Explanations can include local neotectonics, lithology, chemical and physical erosion, and drainage system dynamics. Recently, Dill et al. (2020) explained the evolution and zonation of the Tatacoa Badlands through a “fight for dominance” of drainage systems at the edge of the Badlands due to neotectonics and base level change. This leads to a split of surface and groundwater fluxes, with implications for the erosional processes and vegetation distribution, whereby the Cabrera River concentrates the surface water fed by the Eastern Cordillera headwaters whilst a hydric deficit dominates the Tatacoa catchments (Figure 1B). If the TD erosional dynamics is related to its drainage system relationship with neighbor catchments, its genesis or longevity can be investigated by preserved fluvial terraces and the morphometric relationships between the local catchments. River terraces occur at different levels along the TD, pointing to aggradation and incision episodes during Quaternary, but without available ages. Dated terraces on the Northern Andes from Peru to Venezuela at the eastern Andean margin point to incision rates higher than 1 mm/y since Late Pleistocene, related to the deformation and uplift of the mountain ranges, as well as to Quaternary climatic changes (Guzman et al., 2013; Veloza et al., 2015; Baby et al., 2020; Viveen et al., 2020; Viveen et al., 2020). At the western foothills of the Colombian Eastern Cordillera, few available data record high episodic massive flux of sediments via debris flow from the high mountains in the last 38 ky (Hoyos et al., 2015) and incision rates of 0.07 mm/y estimated by 10Be depth profile dating in alluvial terraces (Struth et al., 2020). In addition, morphometric analysis has been used to document a continuous drainage rearrangement along the Colombian Eastern Cordillera following its topographic growth (Struth et al., 2016, 2020; Siravo et al., 2021). Based on these regional data and the hydrological dynamics of TD, we hypothesize that the TD formation must have resulted from a likely recent (Late Pleistocene) drainage system reorganization following a shift to the north of the Cabrera River, which caused a reduction of the TD drainage area and discharge. Thus, we performed optically stimulated luminescence dating in two fluvial terraces and river profile analysis intending to respond to the following questions: 1. Has there been a significant drainage network rearrangement surrounding the TD, or it is a long-term feature? 2. When did this rearrangement happen? 3. What caused this rearrangement? 4. How has this affected the environmental change and the landscape evolution of the tropical dry forest?
The Upper Magdalena Valley (UMV) occupies a 15–40 km wide structural depression bounded with the Central and Eastern Cordilleras respectively by the west-dipping La Plata—Chusma Thrust System to the west and the east-dipping Baraya Thrust to the east (Guerrero, 1997) (Figure 1B). At a latitude of 3.2 and 2.3°N , within the UMV, the Tatacoa Desert (400–500 m a.s.l.) has an area of ∼192 km2 which is delimited by the Magdalena River to the W and NW and by two of its tributaries coming from the Eastern Cordillera, the Cabrera River to the NE, and the Las Lajas Creek to the SE-S. The TD developed over the Middle Miocene sedimentary rocks of the Honda Group (Figure 2). This group unconformably overlies the Jurassic Saldaña Formation, and the Lower Cretaceous to Oligocene strata from the Caballos Formation, and the Villeta and Gualanday Groups (Guerrero, 1997; Montes et al., 2021). The Honda Group has an average thickness of ∼1,250 m and it is subdivided into the Middle Miocene La Victoria and Villavieja formations. To the south of the TD, the Honda Group is covered by the Late Miocene to Pliocene Huila Group (Gigante and Neiva Formations), and by Pleistocene alluvial fan deposits (Velandia et al., 2001) (Supplementary Figure S2).
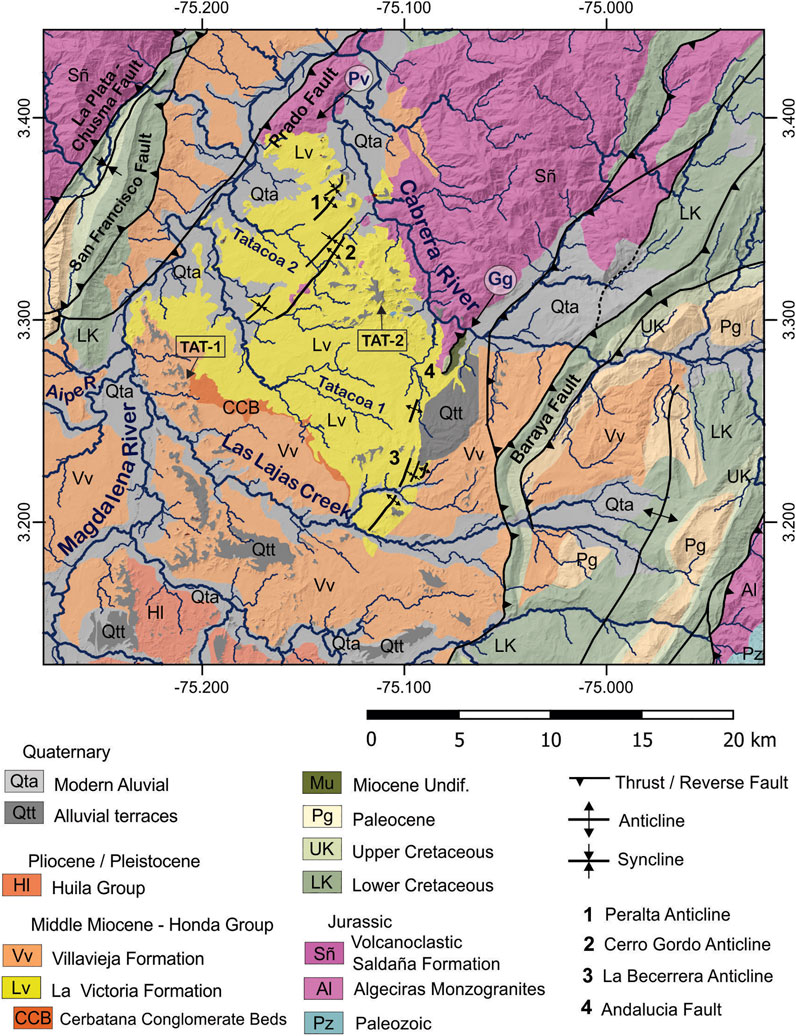
FIGURE 2. Simplified geological map of the Tatacoa Desert and the location of the fluvial terraces sampled for optically stimulated luminescence dating (TAT-1 and 2). Modified from Gómez et al. (2015) and Montes et al. (2021). Pv is a palleovaley and Gg is the Gorge of the Cabrera River. For a regional overview, a stratigraphic column of the Upper Magdalena Valley, simplified from Terraza–Melo et al. (2019) is shown in Supplementary Figure S2.
The Honda Group is composed of interlayered fining-upward sequences of light gray volcanic litharenite, reddish-brown mudstone, greenish-gray mudstone, and minor conglomerate (Guerrero, 1997). Sediment accumulation occurred without major hiatuses between 14.9 and 11.5 Ma (Flynn et al., 1997; Anderson et al., 2016; Montes et al., 2021), mainly under a meandering fluvial system flowing to the east and southeast into the Amazon basin. The only change to a braided fluvial system is recorded in the upper La Victoria unit, at the Cerbatana Conglomerates Bed (CBB), reflecting a sudden increase in sedimentation rate (Guerrero, 1997; Montes et al., 2021). The CCB is a ∼9 m-thick conglomeratic horizon constituted by coarse pebbles to cobbles of metaquartzite, igneous rocks, and chert deposited in a short period between 12.93 ± 0.23 Ma (U-PB detrital zircon ages—Montes et al., 2021) and 12.512 ± 0.102 Ma (Flynn et al., 1997) (Figure 2).
Westerly paleocurrents and abundance of volcanic lithic fragments have been used to infer a major source area for La Victoria Formation in the Central Cordillera (Guerrero, 1997); however, as detrital zircons have ages matching those of magmatic rocks located to the west of the Central Cordillera, in the Cauca Valley and the Panama–Choco Montes et al., 2021 suggested a lowland passage across the Central Cordillera during accumulation of the Honda Group. After 12.5 Ma, during the deposition of the Villavieja Formation, a source area variation has been suggested based on a shift to easterly paleocurrents (Guerrero, 1997) and massive occurrence of U–Pb Precambrian detrital zircon ages, that could be a characteristic of the Garzón Massif of the Eastern Cordillera (Anderson et al., 2016). These changes have been related to the progressive uplift of the Eastern Cordillera, which sometime after the Late Miocene eventually closed the basin in its eastern side and lead to the current northward flow of the Magdalena River (Anderson et al., 2016).
Pre-middle Miocene contractional deformation of the TD area is documented by the structural relationships of the Andalucia fault. This NE–SW striking, east verging fault juxtaposes the Jurassic Saldaña and Cretaceous strata along its hanging wall against undifferentiated Miocene rocks (Figure 2) (Montes et al., 2021). A few kilometers farther to the south of the Cabrera River, deformation is accommodated by folding and the Andalucia fault is a blind thrust, which points to limited shortening in the last 13 My. Folding of the Honda Group has formed three NE-trending anticlines in the study area: La Peralta, Cerro Gordo, and La Becerra anticlines (Montes et al., 2021) (Figure 2). Growth strata in the La Victoria Formation document that folding was concomitant with sediment accumulation during the Middle Miocene. Farther to the east, the east-dipping Baraya Thrust has uplifted Cretaceous rocks in its hanging wall and put them in contact against the Miocene strata of the Villavieja and La Victoria Formations, attesting to major post-Miocene activity (Figure 2).
Currently, transpressive deformation in the southern sector of the North Andean Block (NAB) is partitioned between strike-slip and dip-slip faults, which in the region are mainly distributed in the La Plata–Chusma Thrust System and the Algeciras Dextral Strike-Slip Fault System (Veloza et al., 2012; Mora-Páez et al., 2016). There are no available slip rates in the TD and even at the scale of the UMV, the rates remain elusive (Diederix et al., 2020). However, the regional GPS-derived velocity field indicates that the mean NAB shortening rates (4.3 mm/y) are lower than the margin-parallel block motion (8.1 mm/y) (Mora-Páez et al., 2019). Thus, seismicity in the last 3 decades is not only highly concentrated along with the Algeciras Fault System (Diederix et al., 2020), but also in the western splay reverse faults that branch off the Algeciras Fault, as Altamira, Rivera, and Baraya faults (Supplementary Figure S3) (INGEOMINAS - Servicio Geologico Colombiano (SGC Colombia, 1993). Within the TD, earthquake events are distributed around the described NE anticlines, the Prado Fault, and at a high concentration at south and southeastern of the TD, around the Magdalena channel (Supplementary Figure S3). The magnitude of the TD earthquakes is no higher than 3.5 MI and few events are deeper than 18 km.
The TD is characterized by Badlands morphology (Dill et al., 2020) whereby the highly erodible Honda Group strata are freshly exposed with no intervening regolith and poorly developed soil. Vegetation is sparse (Figure 1C, Supplementary Figure S1) and mainly composed of thorn–scrub acacia and wood cactus (Guerrero, 1997). The TD has an average precipitation of ∼1,300 mm per year under a mean annual temperature of 27°C (IDEAM, 2012). Two rainy seasons between March and May and October and December are interspersed by two dry seasons between January and February and July and September, the latter receiving less than 70 mm of precipitation. This bimodal pattern of rainy and dry seasons results from the north-south migration of Intertropical Convergence Zone (ITCZ) position along the year (Poveda et al., 2006). Despite the contrast with vegetation (Figure 1C and Supplementary Figure S1), these conditions would make Tatacoa to be classified as tropical wet and dry or savanna climate (Peel et al., 2007).
Flat unconsolidated alluvial deposits are preserved at hilltops, marking the highest elevations along the Tatacoa Desert. They are generally composed of clast boulders within a characteristically red, muddy/sandy matrix. These deposits are resistant to erosion, acting as a protection cape to the underlying rock (Montes et al., 2021). Floating cobbles eroded from the terraces occur covering the hillslopes below the deposits. At the eastern margin of the Magdalena River, a set of such terraces stretches parallel to this river. Here, the TAT-1 terrace is located ∼2.5 km from the Magdalena River, at 460 m a.s.l., that is, 80 m above the river (Table 1; Figures 2, 4). It consists of a 1-m of gravel-supported deposit. The clasts are imbricated and variable in size, ranging mainly from pebble to cobble (Figure 4D). The dip ranges from 17° to 44° (Supplementary Table S5). Two samples (TAT-1A and TAT-1B) were collected for optically stimulated luminescence (OSL) dating. They were collected at depths of 0.5 and 1.0 m, respectively, and a few meters laterally apart from each other. These sampling points were chosen in places where the clasts are a little more spaced, and a layer of sand was available to be sampled.
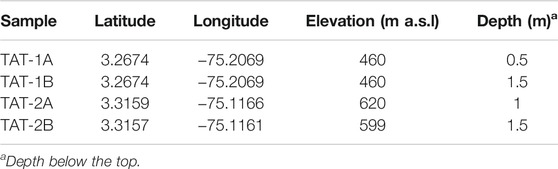
TABLE 1. Location of dated samples.
At the eastern end of the desert, a second sampled terrace (TAT-2) is locally known as “Mesa Alta”, lying ∼2.5 km west of the Cabrera River (Table 1; Figures 2, 5A,B,I). Although highly dissected and with irregular geometry, the TAT-2 terrace has a maximum dimension of ∼1.5 km × 1 km, and a flat hilltop of around 630 m a.s.l, which is 200 m above the course of the Cabrera River. The deposit is up to 10 m thick (Figures 5J,L), composed of imbricated clasts with dipping ranging from 4° to 45° (Supplementary Table S5). Three main layers can be distinguishable in several parts of Mesa Alta, although with slight variation in thickness. The first 0.5–1 m from the surface is a gravel-supported deposit dominated by cobbles. From 0.5–1 to 1–2 m depths, the gravel-supported deposit becomes dominated by granules. Below, the basal layer of the deposit, up to 8 m, is a composite by variable size clasts within a muddy/sandy matrix. In this layer, boulders can reach up to 400 mm. (Fig. 5L). Two sites located 60 m apart were sampled at depths of 1–1.5 m deep below the terrace top (Figures 5B,D,H). Both samples are at the top of the matrix-supported layer. TAT-2A is at 599 m and TAT-2B is at 616 m a.s.l (Table 1).
All the OSL samples were taken by hammering 20-cm-long aluminum tubes with 6 cm of diameter into the previously cleaned wall of the terrace. When removed, both ends of the tube were sealed to prevent light exposure. Also, the bulk sediment around the OSL sample was collected for dose rate estimation. In addition, at each site and in neighboring terraces, provenance analyses were conducted using paleocurrent determinations through measurements of imbricate clasts and cross-bedding (DeCelles et al., 1983). Modal gravel compositions were obtained through the identification of 50–100 clasts from each terrace, using an equally spaced grid (Howard, 1993). Controlling points of neighbor terraces of TAT-1 (C-1 and C-2, Figure 4A) and another sector of TAT-2 (C-3, Figure 5A) were visited to complement the field analysis.
OSL dating was performed in quartz sand grains. The preparation of quartz concentrates for equivalent dose (De) measurements followed standard procedures (Aitken, 1985). Samples were wet sieved to isolate the 180–250 µm fraction and treated with H2O2 and HCl (10%) to eliminate organic matter and carbonates, respectively. Quartz grains concentration was performed using lithium metatungstate solutions with densities of 2.62 and 2.75 g/cm3 to separate quartz from feldspars and heavy minerals, respectively. Quartz concentrates were then treated with HF at 38% for 40 min to eliminate the outer rind of quartz grains affected by alpha irradiation and remnant feldspar. The single-aliquot regenerative (SAR) dose protocol (Murray and Wintle, 2003) was used for De estimation in quartz grains (protocol in Supplementary Table S1). Luminescence measurements were carried out in a Lexsyg Smart reader system (Freiburg Instruments) equipped with a90Sr/90Y beta source, delivering a dose rate of 0.116 ± 0.010 Gy/s. Stimulation was made using blue LEDs (470 ± 20 nm) at 90% maximum power density (∼40 mW/cm2). Quartz OSL emissions were recorded in the UV spectra through a Hoya U340 detection filter. The OSL signal was calculated from the first 0.8 s of stimulation, and the last 10 s were used as background. Feldspar contamination was checked and tested for infrared stimulated luminescence signals (Duller, 2003). Only aliquots with recuperation values below 5%, recycling ratios within 10% of unity, and natural OSL signals three standard deviations higher than background were accepted. Dose recovery tests were performed in aliquots of the TAT 2A sample for preheating temperatures of 200, 220, and 240°C for a dose of 45 Gy (Supplementary Table S2). A pulse annealing test (Fan et al., 2011) for preheating temperatures between 180 and 340°C in steps of 20°C and for a given dose of 26 Gy was applied to check the thermal stability of the quartz and discard possible sources of De underestimation. De values of each sample were then calculated using the Central Age Model and the Minimum Age Model (CAM and MAM, respectively; Galbraith and Roberts, 2012).
For radiation dose rate estimation, concentrations of U, Th, and K were determined through high-resolution gamma-ray spectrometry using a high purity germanium detector (Canberra Instruments, relative efficiency of 55% and energy resolution of 2.1 KeV) encased in an ultralow background shield. Around 300 g of sediment from each sample were placed in sealed plastic containers and stored for at least 21 days to allow for radon rebalancing before gamma-ray spectrometry. U, Th, and K concentrations were converted to dose rates using factors proposed by Guérin et al. (2011). Water content was determined by weighing the sample before and after drying it in an oven at 60°C for 24 h. The cosmic dose rate contribution was calculated using the sample depth, elevation, latitude, and longitude as described by Prescott and Hutton (1994) (Supplementary Table S3).
The amount of incision is defined as the difference between the mean elevation of the flat top polygon of the terraces and the mean elevation for a segment of the reference river. This segment must be long enough to encompass all the lengths of the terraces, making sure it is representative of the incision of the river about the terrace. For the TAT-1 terrace, the reference channel was a ∼4.5 km segment of the Magdalena River, which flows parallel to the terraces (Figures 2, 4A). For TAT-2, a ∼5.5 km-long segment of the Cabrera River was used as reference (Figures 2, 5A). Mean elevation of the terraces and the channels were computed from a TanDEM-X 12 m image German Aerospace Center-TanDEM-X, 2019, and the error is the standard deviation. Consideration of the OSL ages used for estimating the incision rates and the reliability of the rivers chosen as reference is discussed in session 4.1.
The stream power models for bedrock river incision, given their simplicity and easy application, have been extensively used to constrain local conditions as erosion rates, uplift, climate, rock properties, etc. (Howard, 1994; Whipple and Tucker 1999). The simplest model states that the elevation change over time (dz/dt) results from the difference between uplift (U) and incision (E):
where E is
where A is the drainage area (a proxy for discharge); dz/dx is the local slope; K is the erosional coefficient (which can include rock properties and climate condition), and m and n are constants. If a river reaches its topographical steady state, dz/dt = 0 and U = E; then, by solving it for slope,
where ks is the steepness index and m/n is recognized as the concavity index (θ) (Flint, 1974). Both metrics are extracted from the regression of dz/dx and A log-plots, and they are broadly used to estimate the spatial variation of E and U. A reference m/n (θref) is often used to normalize ks (normalized steepness index—ksn) (Wobus et al., 2006) so that rivers of different scales can be compared.
Based on Eqs 1b, 2a the chi analysis (integral method) was first developed to minimize the effects of the noise in a DEM-derived slope and area data (Perron and Royden, 2013). It breaks down the slope (dz/dx) into 2 variables and rearranges Eq. 2a in a way that elevation (z) at each point of the profile (x) is a function of the integration of the drainage area (A) in the upstream direction from an arbitrary base level (zb).
For convenience, a reference area (A0) is usually introduced, such that both sides of Eq. 3a have units of length and the integrand, referred to as the coordinate chi (χ). (Eq. 3b) is dimensionless. The integration of only A assumes that U and K are constants in the profile. Basically, Eq. 3a is a linear function that transforms the river profile into a straight line. It is noted that the inclination of this line (Eq. 3a) is a coefficient proportional to the ksn (Eq. 2b).
This coefficient is also recognized as a dimensionless proxy for U (U*), independent of previous knowledge of K (Goren et al., 2014; Fox et al., 2015). The U* coefficient can be extracted simply by regressing elevation data with χ (the called χ-plot), the latter calculated according to (Eq. 3b). In abstract, if trunk and tributaries are subjected to the same external factors (U and K), they should be co-linear in the χ-plot, as the U* (ksn) is homogeneous. Thus, deviation from a straight line indicates the variation of U and K in space or transient signals derived from changes in the base level (zb) (Willett et al., 2014; Fox et al., 2015; Whipple et al., 2017).
Last, if proven that a certain knickpoint in the river profile records the upstream propagation of a base level fall or a U change, the χ is also proportional to time when this change occurred.
where τ is the response time for perturbations to propagate from a river outlet to a point x (Rosenbloom and Anderson, 1994). Eq. 5b assumes that the constant n = 1 (see Eq. 1b) and such that the incision rate is linear in the local slope (Goren et al., 2014); also, it places the erosional coefficient (K) out from integration in Eq. 5a, assuming that it is homogeneous, making
To extract a drainage network and to compute the χ value we used the 12 m resolution DEM (German Aerospace Center-TanDEM-X, 2019). The drainage network was extracted from standard routines available on Topotoolbox 2 (Schwanghart and Scherler, 2014). The threshold drainage area was set at 106 m2. The χ was computed by the chitransform tool from the Topotoolbox 2.1. The reference base level zb was chosen a few kilometers downstream of the Magdalena and Cabrera rivers confluence, in a way that all drainage shares the same outlet point. We use a reference θref of 0.41 since it was the optimal value that we found for the Upper Magdalena catchment. This value was approximated through the mnoptim tool within Topotoolbox and checked with independent estimates of χ at several m/n values within a range of 0.0001–1 (Supplementary Table S6 and Supplementary Figure S6). Finally, A0 is set to 1, thus the slope coefficient of the χ-plot (U*) equals the ksn index (Eq. 4), such that, this metric will be referred to as ksn in the following text. Thus, the ksn was extracted in two ways: 1) the mean ksn of a catchment or a single channel was calculated by regressing elevation data with χ; 2) local ksn for channel segments was calculated from the derivatives of the χ-plot.
Contrasting χ-values at the water divide in neighboring catchments have been interpreted as indicators for drainage network reorganization and divide migration (Willett et al., 2014; Yang et al., 2015). In river capture events, the lower-χ catchment (with higher erosional potential, defined by the ksn index) acts as an aggressor “stealing” areas from the neighbor catchments with higher χ values. However, such interpretation relies on homogeneous uplift and erodibility (U and K in Eqs 2a–2ca–cEqs 2a–2c) (Willett et al., 2014; and; Whipple et al., 2017). Thus, for a more robust identification of disequilibrium and divide migration direction, it is recommended the usage of χ-map together with metrics related directly to the divide relief (the called Gilbert metrics) (Whipple et al., 2017; Forte and Whipple, 2018). Here, we use the divide asymmetry index (DAI), calculated from the DIVIDEobj tool within the Topotoolbox 2 (Scherler and Schwanghart, 2020a and b). This tool extracts and orders a drainage divide network; then, the hillslope relief (HR) is computed as the difference in elevation between a given point of the divide and the nearest headwater, defined by a fixed threshold drainage area (106 m2, the same used to extract the drainage network). The DAI index is calculated as the difference between HR in a pair of hillslopes sharing the same divide
The DAI ranges from 0 (symmetric divide) to 1 (asymmetric). Besides the asymmetry magnitude, the output includes the orientation of the divide migration, based on the across-divide difference of HR.
We explored the spatial variation of incision along two internal catchments in the desert, referred to here as Tatacoa 1 and 2 (Figures 6, 8), and the Las Lajas catchment, which besides defining the southern boundary of the desert, crosses the main tectonic structures in the area. The incision is extracted by the variation of ksn along with the χ profiles. Since the topographic steady-state (E = U in Eq. 1a) is violated when there is a deviation of the straight line in the χ—plot (Willett et al., 2014), we prefer to use the term incision instead of uplift. To have a reference model for homogeneous sub-catchments, we perform a linear regression from the χ-values and elevation data to find a polynomial (degree 3–5) that best fits the data (the error is the root-mean-square deviation), and then the ksn is extracted in equidistant points from the derivative of the polynomial.
To calibrate the incision rates, one needs to define a coefficient K (Eqs 5a–5b). For this purpose, we use OSL-derived incision rates for TAT-1 terrace (Supplementary Table S4); and two ksn values extracted from χ-plots including: 1) Data of 2 Tatacoa internal catchments, which are entirely draining the La Victoria Formation; and 2) Data from the catchments of Las Lajas Creek lower tributaries, downstream of the Baraya Fault, which mainly drains the Villavieja Formation and a small part of La Victoria Fm (Supplementary Figure S7). The selected tributaries exclude older rocks in the upstream of the Baraya Fault; thus, the K coefficient should be representative of the rocks of the Honda Group (Figure 2 and Supplementary Figure S7, Supplementary Table S7). We assume these catchments have been affected and adapted to the incision of the Magdalena River, in a way that the ksn and θref relationship (Eqs 2a–2ca–cEqs 2a–2c, 3a, 3b, 4, 5a, 5b) averages both the equilibrium state and the response to perturbations of this drainage network. By calculating K (from Eq. 4), we assume n = 1, such that the incision rate is linear in the local slope.
Equivalent doses (De) were estimated by using preheating of 240°C, following dose recovery tests. Three experiments were performed at this temperature, and they yield a calculated-to-given dose ratio between 1.04 and 1.06, which were the closest to unity among the temperatures tested (Supplementary Table S2). Besides, such a high temperature was chosen to minimize thermally unstable OSL components. The quartz OSL signal has a minor decrease until preheated to 240°C (Supplementary Figure S4), although ∼7% of the signal can be lost between 200° and 240°C. Overall, the quartz aliquots show fast decaying OSL curves (Figure 3). The TAT-1 samples have a limited amount of quartz; however, 13 of the 23 aliquots for TAT-1A and 7 of 11 aliquots for TAT-1B were accepted for equivalent dose estimation, which are 56 and 64% of the aliquots, respectively (Table 2). In the quartz-rich TAT-2 deposit, 28 of 40 aliquots (70%) were used for the analysis of the TAT-2A sample, although these aliquots show OSL signal in saturation (see below). For the TAT-2B sample, 13 of 40 aliquots (33%) were suitable for dating. Rejected aliquots were mainly due to recycling ratios higher than 10% of unity.
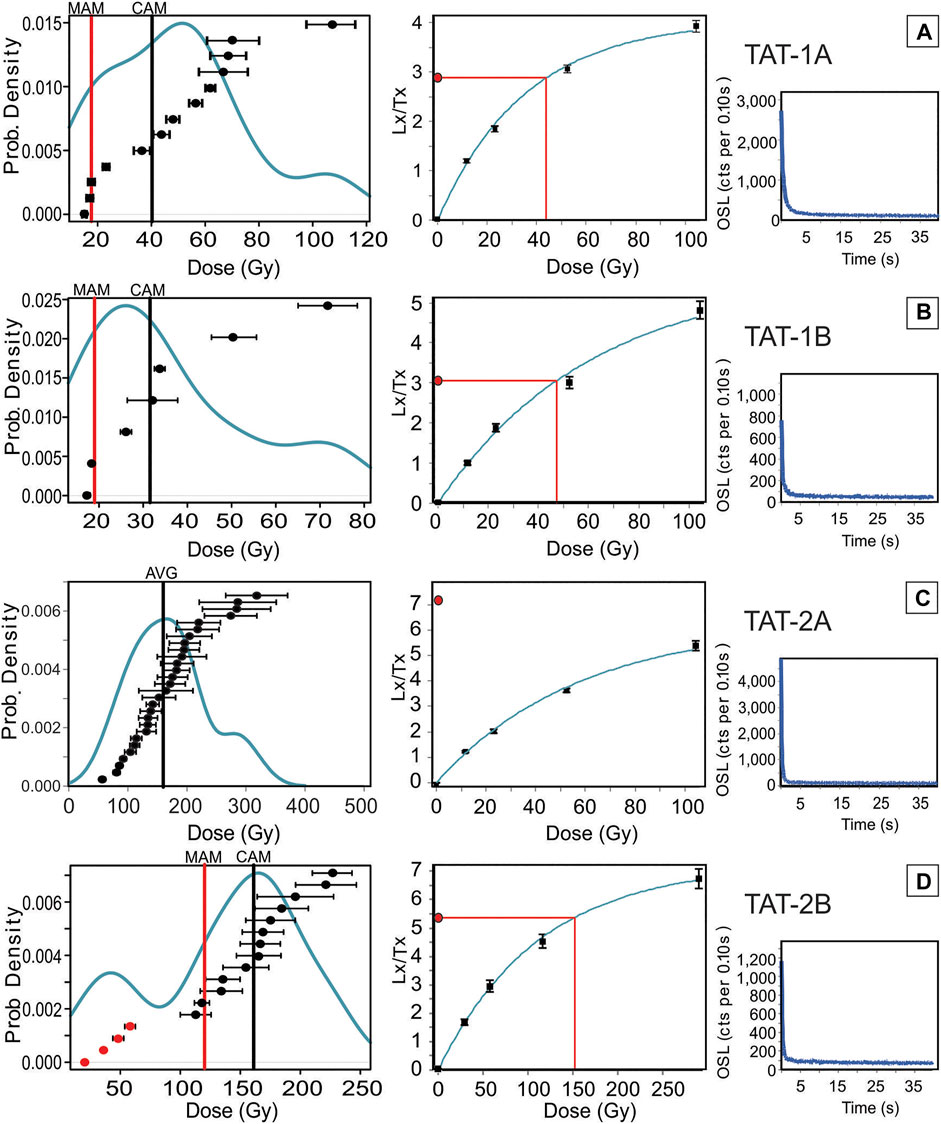
FIGURE 3. OSL data of the samples: (A) TAT 1A; (B) TAT 1B; (C) TAT 2A; and (D) TAT 2B. Graphs on the left show equivalent dose (De) distributions for the dated samples, except for (C), where the 2D0 distribution is shown; at the center the dose-response curves for a representative quartz aliquot in each sample; and on the right, the natural OSL decay curve. The red circles in (D) are outliers aliquots. MAM is the Minimum Age Model and CAM is the Central Age Model; in (C), the average (AVG) is shown for the 2D0 distribution.
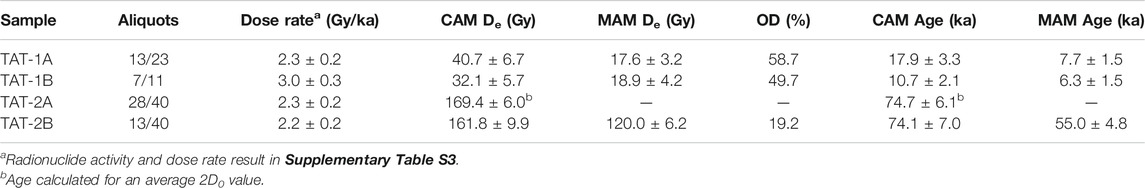
TABLE 2. Results of optically stimulated luminescence dating.
The TAT-1A and B samples have a Central Age Model (CAM) De of 40.7 ± 6.7 Gy and 32.1 ± 5.7 Gy, respectively. Together with the dose rates of 2.3 ± 0.2 Gy/ky and 3.0 ± 0.3 Gy/ky (Supplementary Table S3), the calculated CAM ages are 17.8 ± 3.3 ka and 10.7 ± 2.3 ka (Table 2). The ages are stratigraphically inverted (Table 1), and they do not overlap within a 1-sigma error. Overdispersion is relatively high (50 and 59%), pointing to partially bleached or post-depositional mixed sediments, as commonly observed in fluvial deposits experiencing fast transport and deposition (Murray et al., 2012). Also, the De distribution in these samples has the modal deflected to the lower values (Figures 3A,B). Thus, we also calculated the ages using the Minimum Age Model (MAM) and obtained MAM De values of 17.6 ± 3.2 Gy for TAT-1A and 18.9 ± 4.2 Gy for TAT-2B. The resulting MAM ages of 7.7 ± 1.5 ka and 6.3 ± 1.5 ka do overlap within 1-sigma error. Considering the possibility of partial beaching, the MAM ages will be considered as the most likely age of deposition.
In the TAT-2A sample, 28 of 40 aliquots yielded De values over-saturation levels (Figure 3B). Saturation is defined by the 2D0 value, which corresponds to the onset of the saturation dose level in the dose-response curve (Wintle and Murray, 2006). The TAT-2A 2D0 values occur between 57 and 318 Gy. Besides, few aliquots (n = 5) have non-saturated OSL signals, all having De values lower than 100.0 Gy (Supplementary Figure S5A). Given the better consistency and representativity of the saturated group, the saturation point (2D0) for all aliquots were averaged (169.4 ± 6.0 Gy) to calculate a minimum age for the sample. Together with the dose rate of 2.3 ± 0.2 Gy/a (Supplementary Table S3), the minimum age calculated is 74.6 ± 6.1 ka (Table 2). The non-saturated aliquots likely result from sediment infiltration in the deposit, common in old gravel deposits with cobbles and boulders, although fading effect could also be considered. TAT-2B also shows a disconnected small set (n = 4) of accepted De which would make the overdispersion to be 68%; under the considerations made for TAT-2A, they are considered outliers (Figure 3D and Supplementary Figure S5B). The CAM De and dose rate of TAT 2B are 161.1 ± 9.9 Gy and 2.2 ± 0.2 Gy/ka (Supplementary Table S3), respectively, which give a CAM age of 74.1 ± 7.0 ka (Table 2). The MAM age also was calculated, resulting in 55.0 ± 4.8 ka; however, as there is a strong modal peak near the CAM De value of ∼161 Gy (Figure 3D), which also very closely correspond to that used for the calculation of the TAT-2A minimum age, the CAM is likely to be representative of the reliable deposition age.
To calculate the TAT-1 incision rate, we considered the TAT-1A MAM age of 7.7 ± 1.5 ka in the uppermost sample of the profile, which overlaps with the error of the MAM age of the underlying sample TAT-1B (Table 1, 2 and Figures 4A,B). From a total incision of 78.4 ± 4 m of the Magdalena River about the TAT-1 terrace, the calculated incision rate is 10.2 ± 2.1 mm/y (Supplementary Table S4). For the TAT-2 terrace, we took the TAT-2B CAM age of 74.1 ± 7.0 ka as a reference. Although the TAT-2B was sampled deeper in the profile than TAT-2A, this sample is located at a higher elevation in the terrace, closer to the flat top. Besides, rather than TAT-2A that yields a minimum age due to the saturated aliquots, the TAT-2B had enough accepted aliquots to estimate a CAM age (Table 1 and 2; Figures 5A,B). With a total incision of 206.4 ± 7.4 m, the TAT-2 incision rate is 2.8 ± 0.3 mm/y (Supplementary Table S4). There is an increase of up to 3.6 times of TAT-1 about TAT-2 site.
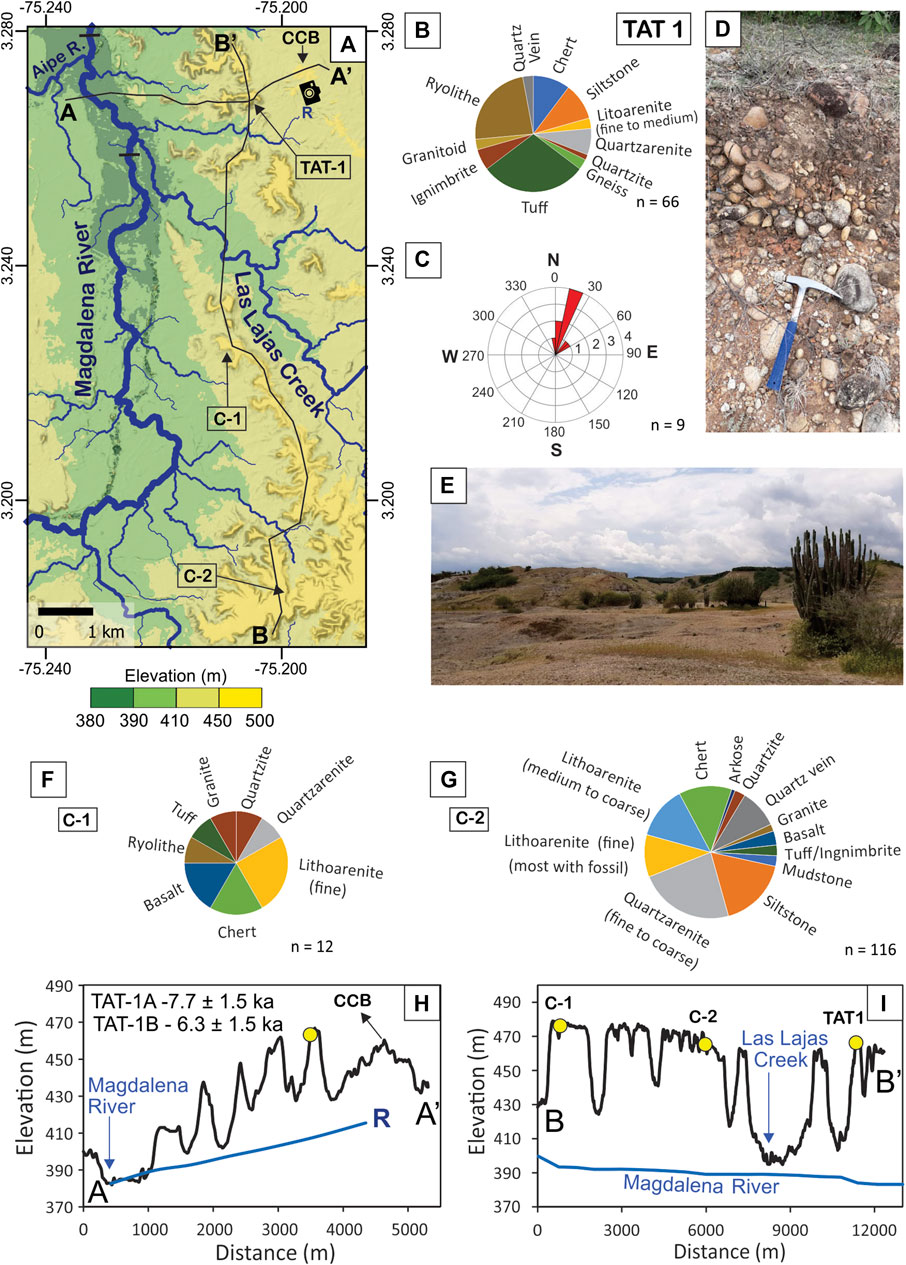
FIGURE 4. Detail of the TAT-1 sampling site. (A) Digital elevation model (TanDEM-X),12 m; shaded areas are hillslopes higher than 25°. The two small traces (black lines) across the Magdalena River near the A-A profile delimit the segment used to extract the river mean elevation for incision rates calculation. CCB is the outcropping of Cerbatana Conglomerate Beds; (B) modal gravel composition for locality TAT-1; (C) paleocurrent direction for TAT-1 (raw data in Supplementary Table S5); (D) picture with detail of the −1.2 m thick deposit; (E) picture with a view from the NE of the terraces (picture location shown in (A), (F) modal gravel composition for the controlling point C-1; (G) modal gravel composition for the controlling point C-2; (H) topographic A-A′ profile and a reference river profile; the sample location (yellow dot) and OSL-ages are shown; and (I) topographic B-B′ profile and a reference river profile, with sample location and OSL-ages shown.
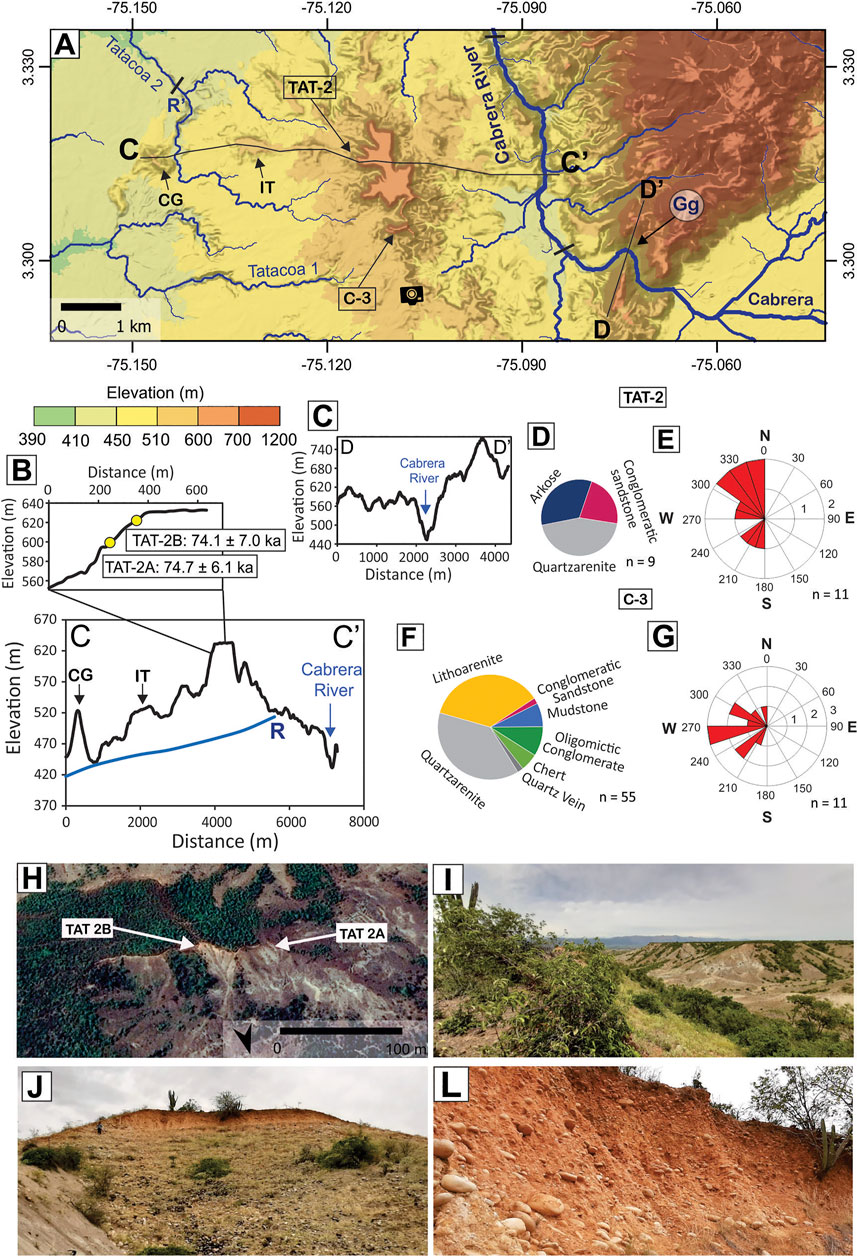
FIGURE 5. Detail of the TAT-2 sampling site. (A) Digital elevation model (TanDEM-X, 12 m); shaded areas are hillslopes higher than 25°. The two small traces in the Cabrera River limit the segment used to extract river mean elevation for the calculation of incision rates; IT is an intermediate terrace level, CG is the Saldaña Formation rocks outcropping along the Cerro Gordo Anticline (see Figure 2); and Gg is the Cabrera River Gorge; (B) topographic C-C′ profile and a reference river profile, in detail, sample elevation and OSL-ages, not that the TAT-2A is a minimum age (average 2D0 value). (C) topographic D-D′ profile; (D) modal gravel composition for the controlling point TAT-2; (E) paleocurrent direction for TAT 2 (raw data in Supplementary Table S5); (F) modal gravel composition for the controlling point C-3; (G) paleocurrent direction for C-3; (H) aerial image with samples location, source: Google Earth; (I) picture with a view from S of the terrace (location shown in map); (J) picture with a panoramic view of the controlling point C-3; and (L) picture with detail of the -∼7 m thick deposit of the controlling point C-3.
The TAT-1 terrace is inserted in a context of terraces disposed along the eastern margin of Magdalena River, deposited on the clayey to sandy layers of the Villavieja Formation (Figures 2, 4A). Nevertheless, they are clast rich, ranging in size from granule to boulders, and polymictic, including abundant volcanic and sedimentary lithic clasts, as well as some plutonic and metamorphic rocks (Figures 4B,D). The terraces share the same topographic level, decreasing the elevation from south to north smoothly, following the Magdalena River thalweg profile (Figure 4I). They are dissected by eastern Magdalena tributaries, some of which come from the Eastern Cordillera, as the Las Lajas Creek (Figures 2, 4A,H,I). By considering this spatial and topographical distribution, as well as the recent deposition (∼6–8 ka—Table 2), this set of terraces likely record a paleo-level of the Magdalena River and its tributaries’ alluvial plain. In addition, the paleocurrents determinations in TAT-1 point to the NNW flow direction in accordance with the main direction of Magdalena River (Figure 1C, Supplementary Table S5). The clast content of the terraces presents heterogeneity in rock types (Figures 4B,F,G), which could be representative of the variety of source areas. Besides the Central and Eastern Cordillera source areas, the Magdalena River catchment includes exposures of the upper Miocene Huila and Gigante formations before reaching the Honda Group rocks (Supplementary Figure S2). Conversely to the Honda Group, these younger formations can also account for pebble-sized clasts of sedimentary, metamorphic (sourced from Garzon Massif), and igneous nature (van der Wiel, 1991). Although the clast content and diversity are similar in all visited terraces (Figures 4A,B,F,G), their proportion changes significantly: sedimentary rocks are dominant at the controlling point C-2 (Figure 4G), representing 93% of the clasts, whilst volcanic and subvolcanic becomes dominant at TAT-1 (Figure 4B), representing 60% of the clasts. Sedimentary rocks are also abundant in TAT-1, constituting ∼30% of the clasts. This difference in proportion likely reflects local contributions. The dominance of sedimentary rocks in locality C-2 likely results from the interaction of Magdalena River with the Eastern Cordillera Rivers flowing on Paleogene to Cretaceous sedimentary layers (Fuquen and Osorno, 2002) (Supplementary Figure S2). At the sampling locality TAT-1, the enrichment of volcanic fragments is likely due to contributions either from the Saldaña Formation (Ferreira et al., 2002) derived from the Aipe River, coming from Central Cordillera (Figures 1, 2, 4A and Supplementary Figure S2), or from the Cerbatana Conglomerate Bed (CCB) (Guerrero, 1997), which crops out a few hundred meters east of the terrace (Figures 4A,H). The data, together with the OSL ages suggest that after 5–9 ka ago (Table 2), the alluvial plain of Magdalena River and its tributaries has changed its position from the TAT-1 site to the west (Figure 2). Currently, at the southwestern part of the Tatacoa Desert, the set of terraces to which TAT-1 belongs separate the driest part of the desert from the Magdalena alluvial plain (Figure 2).
Farther to the east, the higher, flat terrace (“Mesa Alta”—TAT-2) lies on the La Victoria Formation. This terrace is surrounded by low elevation terraces with steeper slopes, interspersed by the current drainage system (Figures 2, 5A,B). This radial pattern of an incision around the terrace suggests that the abandonment of TAT-2 occurred from a channel deactivation instead of a simple incision pulse or lateral channel migration, as it was for the Magdalena River. Potential reasons for deactivation can be a river shift in direction due to the capture or growth of a topographic barrier by folding (Geach et al., 2015). Besides the OSL sample sites, a controlling point C-3 in the Mesa Alta was studied for clast composition and paleocurrent measurement (Figure 5A, Supplementary Table S5). Unlike the polymictic character of the Magdalena margin terraces (Figure 4), the clasts of these deposits are almost entirely composed of sedimentary rocks, namely, mudstones, quartzarenites, lithoarenites, chert, and conglomerates; some vein quartz also occurs (Figure 5F). Although no systematic clast counting has been done in the Tat-02 site, field inspection of 9 clasts indicated the same composition as C-3 point (Figure 5D). The lack of volcanic fragments in the field inspection and the clast counting makes the possibility of Honda Group rocks reworking to be unlikely. A direct source area for these rocks is the sedimentary layers of the Eastern Cordillera. Mudstones, sandstones, and conglomerates in high variety are ubiquitous in the Paleogene and Cretaceous units as the Seca, Hondita, and Caballos formations. Likewise, chert is present in the Cretaceous Olini group (Fuquen and Osorno, 2002) (Supplementary Figure S2). Paleocurrent determinations in TAT-02 and C-3, although slightly dispersed, consistently point to westward directions toward the Magdalena Valley. These directions differ from the N current direction of Cabrera River and they are similar to the directions observed in Tatacoa 1 and 2 catchments (Figures 5A,E,G), as well as with the Cabrera River direction before its shift to the north at ∼ −75.08 Long. (Figure 5A). This is suggestive of a paleo connection between Tatacoa and Cabrera catchments. Thus, the source area, the paleocurrents, and the radial pattern of terrace abandonment suggest that the “Mesa Alta” landform is a record of the ancient Cabrera River, which, following the OSL ages (Table 2; Figure 5B), drained the TD area into the Magdalena River before 74 ka. The migration to the north of the Cabrera River, abandoning the TD should be happening sometime after this age.
Th The χ-value pattern around the TD (Figure 6A) shows contrasting values at the drainage divide between the Tatacoa and the Cabrera catchments, with the latter having lower values. This pattern is observed to the south of the desert, where despite an increase in the Cabrera χ-values, they are still lower than those from the Las Lajas catchment (Figure 6A). Thus, the Cabrera basin appears to act as an aggressor, capturing areas from the Tatacoa area and Las Lajas catchment.
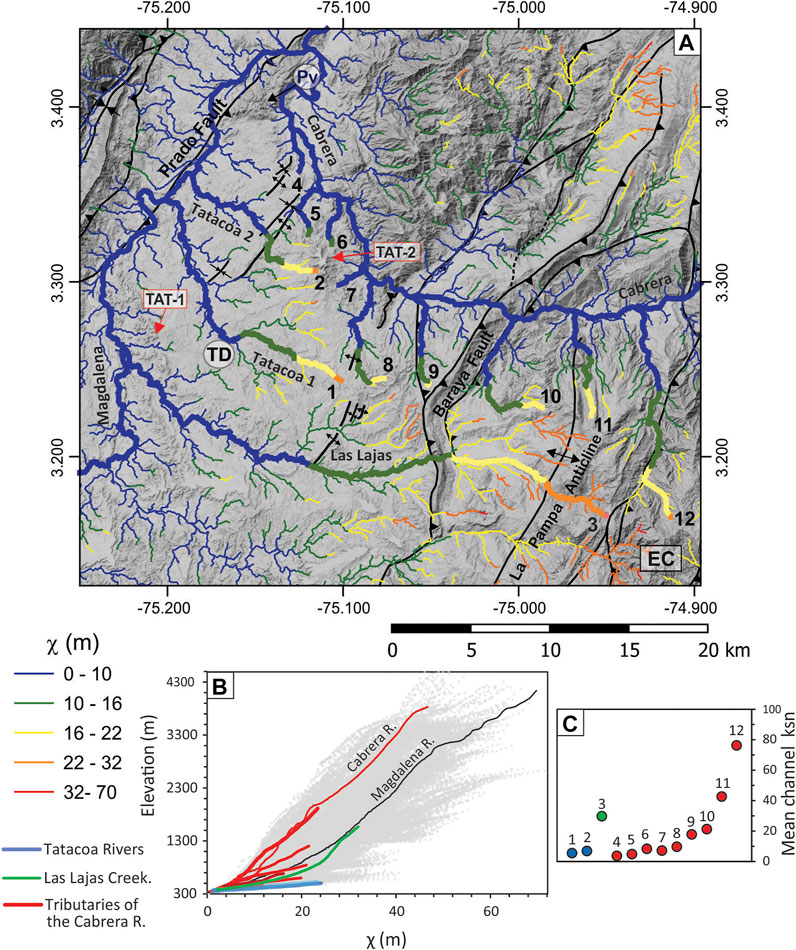
FIGURE 6. (A) χ—map in a TanDEM-X derived composite hill shade and slope image. TD is the Tatacoa Desert; EC is the Eastern Cordillera; and Pv is the paleo valley; (B) χ-plot of Upper Magdalena catchment, upstream of the Magdalena, and Cabrera confluence. Gray lines correspond to channels from the entire basin data and colored lines are the thick channels highlighted in (A); and (C) ksn values of the highlighted channels in (B), the numbers correspond to the channels shown in (A).
Alternatively, the χ—values could have been affected by variable uplift (U) and erodibility (K). In the Tatacoa 2, Las Lajas, and Cabrera catchments the χ-values change across thrust faults and anticlines, reflecting likely topographic compartmentation under differential uplift (Figure 6A). This is also illustrated by the local ksn (Figure 7), which increases subtle east of the Cerro Gordo (Tatacoa 2) and La Becerrera (Las Lajas) anticlines, and significantly east of the Baraya Fault. Within the Upper Magdalena basin, the Tatacoa rivers display the flattest pattern in the χ–plot (6B), therefore having the lowest mean ksn (Figure 6C). On the other end, the Cabrera River is steeper (Figure 6B), and its tributaries have progressively high mean ksn as they are located away from the TD and close to the Eastern Cordillera (Figures 6A,C), which is also highlighted by the local ksn (Figure 7). The Las Lajas Creek also follows this trend, whereby its χ-values are deflected upward toward the east (Figure 6B). The abrupt increase after coordinate 25 m in the χ axis occurs across the La Pampa Anticline. In addition, the Paleogene and Cretaceous rocks crop out around χ ∼25 m, instead of the Honda Group, which occurs dominantly in the flattest downstream sector of Las Lajas (Figure 2). Thus, the ksn increase to the east seems to be related to the presence of more deformed and less erodible rocks from the Eastern Cordillera. In the following sections, we further evaluate the catchments disequilibrium and the differential uplift/erodibility hypotheses.
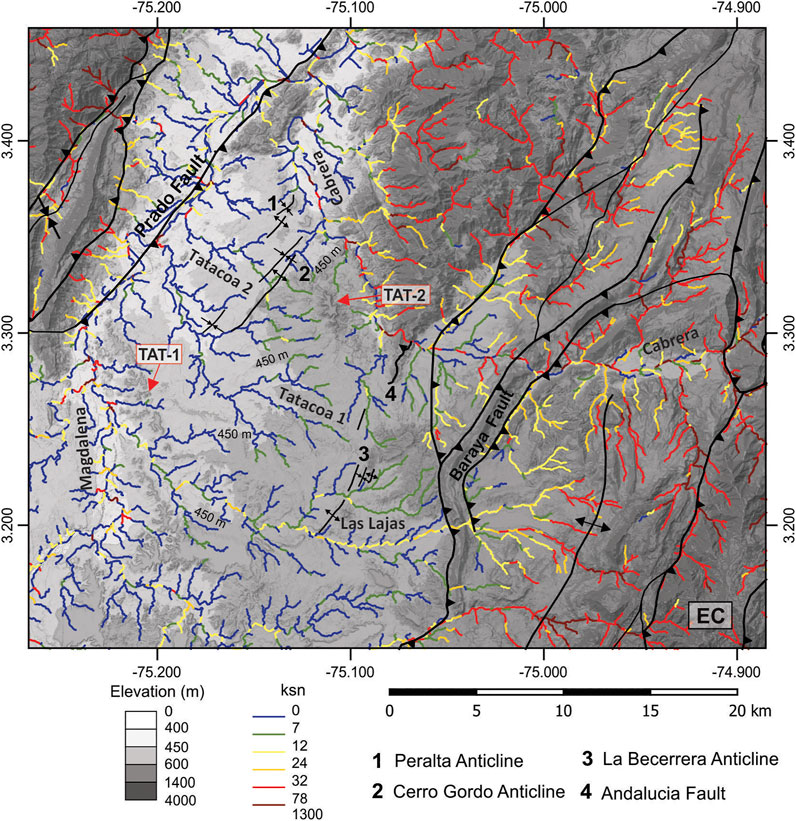
FIGURE 7. Ksn map TanDEM-X hypsometric map. TD is the Tatacoa Desert and EC is the Eastern Cordillera. The height of 450 m is highlighted by labels. This height is punctuated by a subtle increase in ksn (knickpoints) and outlines the upstream propagation of incision after the Magdalena terraces (e.g. TAT-1) abandonment. It is noted that in Tatacoa 2 catchment the incision advance is stopped at Cerro Gordo Anticline.
A low divide asymmetry index (DAI< 0.2) characterizes the Tatacoa/Cabrera divide and, contrary to the shown by the χ-values, the Tatacoa catchments seem to be advancing towards the Cabrera network (b positions in Figure 8A). This pattern changes around the preserved alluvial terraces of Mesa Alta (TAT -2, Figure 8—position a), where the Cabrera catchment advances against Tatacoa. In fact, the entire central section of the panel (position a), is a suspended relict block being consumed by erosion along its edges not only by the Cabrera catchments, but also by sub-catchments from Tatacoa (see position a1). The consumption speed of this block must be relativized in relation to the DAI values, as terraces with greater resistance to erosion contribute to delay the migration of the divide, which leads to an increase in the relief and preservation of the block (Montes et al., 2021).
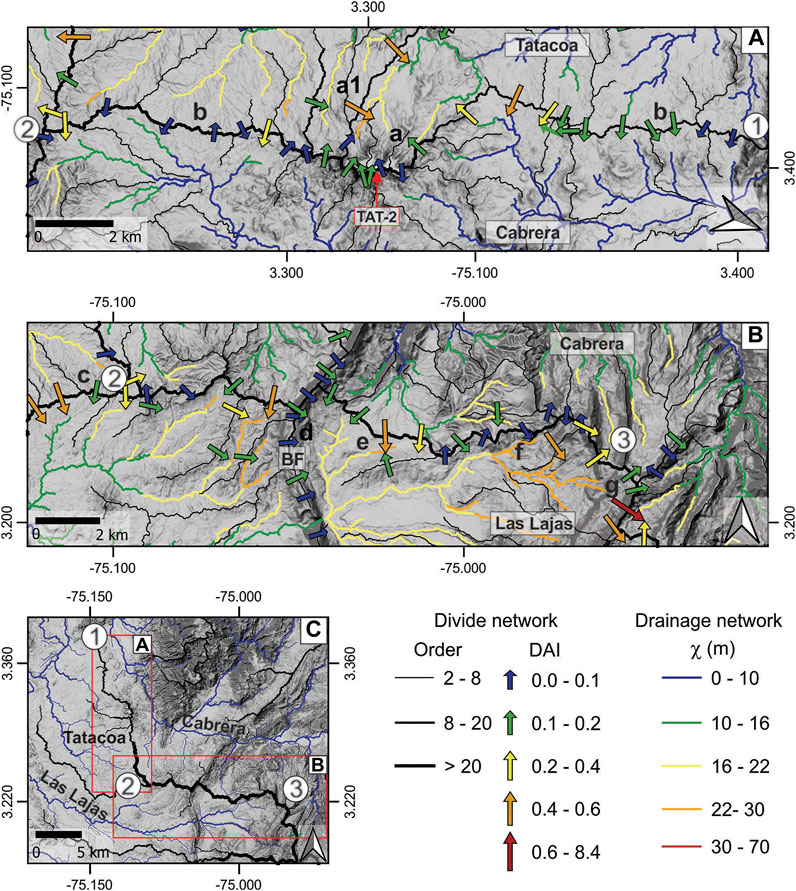
FIGURE 8. Across-divide metrics in the drainage divide between the Cabrera catchment and the Tatacoa drainage system (A) and between the Cabrera and the Las Lajas catchments (B) It is noted that (A) is rotated 110° clockwise. BF is the Baraya Fault. The small letters are reference positions to follow the discussion along with the text. The metrics are the divide asymmetry index (DAI), for the divide network; and the χ-values for the drainage network. The arrows point toward the divide migration (from the higher relief side into the lower one). (C) The relative position of the divides and main rivers; the divide network is the black line, and the drainage network is the blue lines. The numbers are reference points to locate the divide position in (A,B).
The general low DAI values and the subtle advance of the Tatacoa against the Cabrera in position b (Figure 8A) mean that the divide has already reached an equilibrium point after the Cabrera River changed its course to the north and abandoned the Tatacoa area (see Section 4.1.3). Thus, in a context of similarly erodible substrate of the Honda Group, the preservation of contrasting χ-values among the catchments favors the hypothesis of differences in uplift rates or change in erodibility driven by an increase in vegetation in the Cabrera catchment. Additionally, the higher χ-values in the Tatacoa catchments may result from changes in their local base level, defined by the incision of the Magdalena River. If we consider a westward lateral migration of the Magdalena in the last 6–8 ka (Table 2; Figure 4), downstream areas have been added to the Tatacoa catchments, thus making the upstream χ higher. By recalculating χ and excluding the current western alluvial area from the Tatacoa catchments (assuming this could represent the added area), χ-values at the headwater are reduced by 20–28%, making these catchments in equilibrium with the Cabrera sub-catchments (Supplementary Figure S8).
At the Las Lajas/Cabrera divide (Figure 8B), DAI values higher than 0.4 are more common, but lower values also occur. In general, northern catchments seem to gain area against the Las Lajas basin (positions c and e). Near the center of the panel (position d), the Baraya Fault constitutes a topographic barrier that only the Las Lajas Creek could cross. This induces a drainage reorganization such that the tributaries are first reoriented to the Las Lajas Creek whilst they are progressively attacked by the Cabrera Catchment (position e). A few kilometers farther to the east, the capture by the Cabrera catchment has been accomplished, and rivers shifted toward the north into this river (position f). At this position, the DAI decreases, and alternating divide migration direction occurs, suggesting that equilibrium was established. At the easternmost divide (position g), the Las Lajas catchment is gaining areas with the highest DAI values. This, together with the divide migration directions calculated along the Baraya Fault (position d), point to an eastward migration of erosion in response to the increased relief in the footwalls of the westernmost structures of the Eastern Cordillera. Thus, instead of only the mobility of the divide, the relief asymmetry across the divide is likely to be increasing.
The Las Lajas catchment has higher χ-values than Cabrera, despite the complexity of divide directions. This highlights the problems in the use of χ as the indicator for divide mobility without considering other factors that can be affecting this metric (Whipple et al., 2017; Forte and Whipple, 2018). Following the rationale presented for the Tatacoa catchments, the higher values can result from the downstream addition of area due to the westward migration of the alluvial plain of Magdalena River, and hence the channels of the Las Lajas catchment need a longer route to reach the base level (zb).
The Tatacoa 1 and 2 catchments drain the La Victoria Fm (Figure 2) and have similar χ—profiles, which slightly diverge from around 12 m in the χ coordinate (Figure 9B). This divergence for the Tatacoa 2 channel occurs at the intersection with the Cerro Gordo Anticline (the red arrow 2, Figures 9A,B,D), which also affect some Tatacoa 1 tributaries at the boundary between the basins (see the blue dashed arrow 2 in Figure 9B, pointing to observed Tatacoa 1 data which are closer to the Tatacoa 2 profile). This shift in the Tatacoa 2 profile is reflected in its higher incision rates calculated using a nominal erodibility K = 17.55 × 10⁻⁴ ± 3.54 × 10⁻⁴ (Supplementary Table S7), reaching 18 mm/y between 8 and 15 m (Figure 9D). In the Tatacoa 1 profile, the incision rate increases to 12 mm/y between 15 and 20 m in the χ coordinate, returning to values ∼5 mm/y as it approaches 25 m in the χ coordinate. Unlike in Tatacoa 2, the incision increase in Tatacoa 1 is not related to a tectonic structure or a lithological change. Besides, the relict area between χ coordinates 17 and 25 m, behind a knickpoint, matches the height of terraces along the Magdalena eastern margin (Figures 4A,I, 7, the arrow TH in Figures 9B,D). Thus, assuming a knickpoint upstream propagation (Eqs 5a–5b), and taking the transition between the modern alluvial plain and the La Victoria Formation as the starting point, an incision pulse should have started between ∼10 and 6 ka (Figure 9D), agreeing with the aggradation of TAT-1 terrace between ∼5 and 9 ka (Figure 4; Table 2) followed by its abandonment.
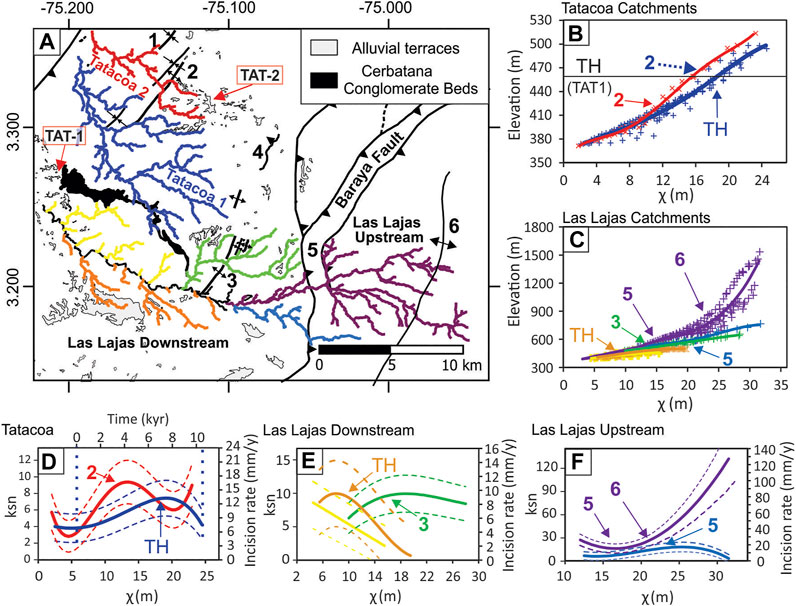
FIGURE 9. χ—profiles and incision rates. (A) Sub-catchment’s locations, color-coded for all graphs; The numbers in (A), indicated by arrows in (B–F) are tectonic structures: (1) Peralta Anticline; (2) Cerro Gordo Anticline; (3) La Becerrera Anticline; (4) Andalucia Fault; (5) Baraya Fault; and (6) La Pampa Anticline; (TH) is the terrace height of the TAT 1. (B) χ—plot of the internal Tatacoa drainage system, the crosses indicate the DEM-derived χ—plot and the lines of the best-fitted polynomial curve. (C) χ—plot of the Las Lajas sub-catchments. (D) ksn index, sampled from the derivative of the best-fitted polynomial curve, for the Tatacoa catchments (see Section 3.2.2). The incision rates were calculated from the K = 17.55 × 10⁻⁴ ± 3.54 × 10⁻⁴. χ-values were converted into time in the regions unaffected by folds along the Tatacoa 1 catchment (blue); (E) ksn index of the Las Lajas downstream sub-catchments; and (F) Ksn index of the Las Lajas upstream sub-catchments. Incision rates in (E) and the (F) were calibrated with the K = 17.55 × 10⁻⁴ ± 3.54 × 10⁻⁴ (Supplementary Table S7).
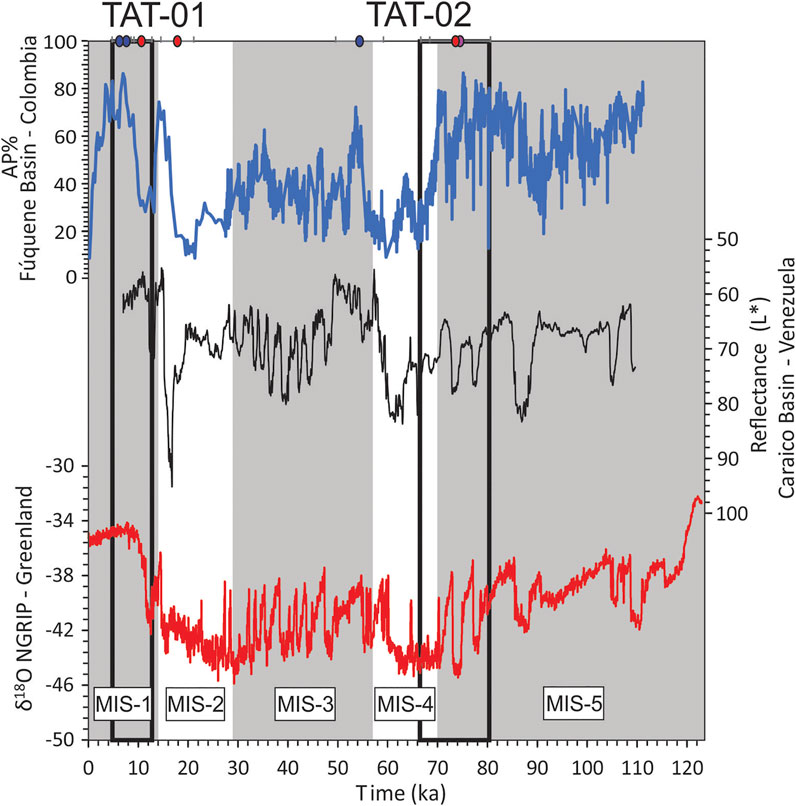
FIGURE 10. Comparison of OSL ages with arboreal pollen percentage in the Fúquene Basin (Colombian Eastern Cordillera at 5.45° N Lat) (Groot et al., 2011), as an indicator of arboreal vegetation and precipitation; sediment total reflectance (L*) in the Cariaco Basin (Venezuela) (Deplazes et al., 2013), in which low values are indicative of dark organic, carbon-rich sediments accumulated in wet periods; and δ 18O from NGRIP ice core (Greenland) (Rasmussen et al., 2014). Blue circles are MAM OSL ages; red circles are CAM ages; and the purple circle is the minimum age for the saturated-aliquots sample (Table 2).
The Las Lajas catchment dominantly drains the Villavieja Formation (Figure 2). The divide between the lower section of this catchment and the Tatacoa 1 is marked by the Cerbatana Conglomerate Beds (CCB), which is the boundary layer between the Villavieja and the underlying La Victoria formations (Figures 2, 9A). The incision rates were calibrated with a nominal erodibility K = 9.46 × 10⁻⁴ ± 1.92 × 10⁻⁴ (Supplementary Table S7). The catchments of Las Lajas downstream tributaries start with incision peaks between 8 and 10 mm/y, decreasing upstream to rates lower than 1 mm/y (Figures 9C,E). This section is populated by preserved alluvial terraces that become progressively wider to the south (upstream) (Figures 4A, 9A). Thus, whilst the incision along the Las Lajas main channel followed the Magdalena base level fall (Figure 4I), the hardness of the Quaternary terraces and CCB delayed the incision pulse in these tributaries, making it a part of a relict area. It is noted that the barrier of CCB diverts the Tatacoa 1 catchment northwards into the Magdalena River (Figure 9A), such that, the exhumation of CCB would create a low-level divide which between Tatacoa catchments and Magdalena in this segment. Therefore, the hardness of CCB and the terraces, together with denser vegetation along the Las Lajas channels are responsible for the lower erodibility inferred from the estimated K coefficient (Supplementary Table S7) for the Las Lajas downstream catchments.
In the upstream, the Las Lajas catchment is affected by the La Becerrera Anticline (arrow 3), the Baraya Fault Anticline (arrow 5), and the La Pampa anticline (arrow 6) (Figures 9A,C,E,F). These structures displace the χ-profile upward, increasing the ksn index of the sub-catchments among these structures, and incision rates from 10 mm/y to up to 20 mm/y (Figures 9C,E,F). Incision rates are higher in the footwall of the Baraya Fault, in agreement with the asymmetry of the drainage divide recorded by the DAI index (Figure 8, position d). In its hanging wall, the ksn index decreases until it reaches the Pampa Anticline, where the ksn increases by a factor of 5–6 (Figure 9E). This ksn increase is accompanied by the exposure of Paleogene to Cretaceous sedimentary rocks and an increase in the vegetation cover, thus a more appropriate K coefficient would need to be inferred to estimate reliable incision rates.
The climate of Colombian Andes is influenced by the north–south migration of the Intertropical Convergence Zone (ITCZ) across the equator line (Deplazes et al., 2013; Schneider et al., 2014). Variation of the ITCZ path along late Quaternary is related to abrupt millennial climate oscillations, mainly marked by Heinrich and Dansgaard–Oeschger events (Figure 10) (Chiang et al., 2003). Therefore, centennial to millennial rainfall peaks occurred in an antiphase pattern along with South America according to the ITCZ position (Deplazes et al., 2013). Although it is difficult to establish straight climatic correlations among local places at different latitudes and elevations, the recurrent short-time climatic oscillations within the long-term trends defined by the marine isotope stage (MIS) have the effect of triggering relative increases of discharge. These discharge increases lead to the erosion and transport of sediments from the high mountain ranges such as the Central and Eastern Cordilleras to lowlands such as the La Tatacoa area (Viveen et al., 2020). The most likely ages of deposition of the dated terraces (Table 2; Figures 4, 5) are framed within this context since they fall on warm and wet periods of MIS-1 (TAT-1, 5–9 ka) and the interglacial substage MIS-5a (TAT 2, 68–81 ka) (Groot et al., 2011; 2014, Deplazes et al., 2013, Rasmussen et al., 2014) (Figure 9). Within these depositional ages, the millennial oscillation that could increase discharge are the Holocene Climatic Optimum within the MIS-1 and the glacial interstadials 19, 20, and 21 within the MIS-5a (Rasmussen et al., 2014). However, the ∼8 m of deposit below the OSL sampling point in TAT-2 (Table 1, Fig. 5L) and that the TAT-2A sample yields only a minimum age of around 74.7 ± 6.1 ka do not allow us to restrict the aggradation only to the MIS—5a interstadials. The Ancient Cabrera River may have started deposition at the TAT-2 site earlier.
Sea-level fall could be an additional trigger to incision (Dill et al., 2020). Considering a long-time knickpoint upstream migration, one can consider the total last glacial fall. From 125 ka to 20 ka, the global sea level fell ∼120 m below the present level (Grant et al., 2012). This is a little more than half of the total incision within the Tatacoa area (e.g. the TAT-2 total incision within the last 74 ka is 206.4 ± 7.4 m—Supplementary Table S4). In addition, , the distance from the desert to the Caribbean Sea (1,200 km) and the alternation between detachment and transport-limited nature of the Magdalena River make a knickpoint smoothing along with its upstream traveling likely. Thus, the sea-level fall seems to have had only minor effects.
In response to the ongoing compression, the sedimentary fill of the Tatacoa Desert accommodated contractional deformation in the way of bivergent thrusting along its west and east bounding faults, as well as through slip along blind faults and attendant folding (Figure 2). This accommodation is likely reflected in the occurrence of recent earthquakes around these structures (Supplementary Figure S3). As a result, there is a general tilting of the Honda Group to W (Guerreiro, 1997) and a series of NW–SE trending anticlines and synclines that have affected the drainage network of Tatacoa during the Quaternary (Dill et al., 2020).
Examples of such interactions are the displacement of χ-profile and the increase in incision rates when across tectonic structures, remarkably within the Las Lajas catchment (Figures 9D,E). Thrusting along the Baraya Fault of the Cretaceous strata over the Villavieja Formation (Figure 2) resulted in a topographic barrier that affected the Las Lajas catchment (Figures 6A, 8B). Since the tributaries are deflected to the north–south direction due to this barrier, the Las Lajas trunk channel concentrates all discharge from the Eastern Cordillera. The intersection of the Baraya Fault trace by the Las Lajas Creek creates a gorge with 200 m of relief. The high incision rates estimated here imply that this topography development occurred recently. Incision rates of 10–20 mm/y in Las Lajas Creek at the gorge imply that the excavation of the valley spanned less than 20 ky (Figure 9). However, the building of this topography due to a contrast in erodibility between the Honda Group layers with older rocks across the fault trace calls for a more conservative estimate. Assuming that the 2.8 ± 0.2 mm/y incision rate derived from the TAT-2 OSL age (Table 2) could be more representative of the long-term uplift rates of the western edge of the Eastern Cordillera, the valley would have been carved in the last ∼74 ka. Caution is needed in this estimation since detailed empirical erosion rates are not available; more safely, a late Pleistocene age can be defined. Anyway, this implies a very recent topography related to the activity along with the Baraya Fault activity.
The Cabrera River also crosses the Baraya Fault forming a gorge with relief of more than 200 m. (Figure 2). In addition, this river also creates a gorge through the Saldaña Formation volcanic rocks across the Andalucia Fault (Cg in Figures 2, 5A). Interestingly, only after overcoming the Saldaña rocks barrier, the river is diverted to the north, leaving the alluvial terraces suspended (e.g. TAT-2) a few kilometers to the west of the channel (Figures 2, 5A). A similar elevation level (630–600 m a.s.l.) occurs at the TAT-2 terrace and the top of the hill that delimits the south side of the Cabrera gorge (Figures 2, 5A,C). According to the paleocurrent measurements and clast counting data that suggest easterly provenance (Figure 5), an ancient Cabrera River flowed westward into the Tatacoa area before the excavation of this gorge. The shift to the north of the Cabrera River responds to the incision of the Magdalena River at the north of the TD, along the Prado Fault. At the confluence between the Magdalena and Cabrera rivers, the first deviates from the broad valley filled by the Honda Rocks to cross via gorges of the igneous rocks of the Saldaña Formation. In this sector, there are suspended incised dry valleys (Pv in Figures 2, 6) that could be the record of continuous adaptation of the Cabrera River to the Magdalena incision. However, to conclude they are abandoned valleys, further inspection is required since intermittent rivers are ubiquitous in the area. A dome-like radial drainage system was established around the TAT-2 terrace after it was abandoned by the Cabrera River (Figures 2, 5, 6). At least, two incision pulses occurred as can be inferred by the occurrence of the steeper intermediated terrace levels (Figures 5A,B). The preservation of a relict topographic block including TAT-2 and its surrounding intermediate terraces is limited by the incision of Cabrera River to the east, and the small exposure of Saldaña Formation along the Cerro Gordo Anticline to the west (Figure 2, Figure 8A-position a, and Figure 9A). The activation of the latter would have contributed to the preservation of this topographic block by concentrating incision along with the deformation (Figure 9D) and leading to the exhumation of more resistant rocks, for which, differential erosion would further amplify the relief in the TD.
The westward migration of the Magdalena floodplain is recorded by the alluvial terraces that occur along the eastern margin of the river (Figure 4). The general westward dipping of the Honda Group associated with regional tilting of the Eastern Cordillera best explain this migration; however, the Holocene incision rate of 10.8 ± 2.0 mm/y of the Magdalena River in the hanging wall of the Prado Fault stands out. The Magdalena River incision along Prado Fault has attracted the Cabrera River in its north end, but also attracted the Tatacoa catchments. Moreover, intermediate terrace levels between TAT 1 and Magdalena (Figure 4B) suggest episodic base level changes during the Holocene. Overall, the activation of the westernmost thrust faults of the Eastern Cordillera affected the Tatacoa drainage system. Whilst the Eastern Cordillera rivers had their passage to the desert blocked by a structural topographic barrier, a series of anticlines and synclines diverted the internal drainage system. The topographic suspension of the NE sector of Tatacoa (the block between the Cerro Gordo Anticline and the Cabrera River) and the incision of the Magdalena River along the Prado Fault drove a northward shift of the Cabrera River. These events modified the local landscape and led to a feedback relationship with erosion, as is analyzed in the next section.
The vegetation restriction and formation of the TD Badlands could be related to the drainage system organization. In the Upper Magdalena Valley, evapotranspiration overcomes annual precipitation (IDEAM, 2012), thus the drainage system plays a key role in fixing vegetation along its wet floodplain (Supplementary Figure S1). However, the Tatacoa Desert is subjected to a peculiar condition where no river coming from the Eastern Cordillera enters (Figures 1, 2). With less drainage area and without the wetter mountainous headwaters, the internal Tatacoa catchments present low discharges unable to balance the high evapotranspiration effect, causing a surficial hydric deficit (Figure 1B). The previous data show that such drainage system configuration is not a long-term condition. Instead, the drainage network has been readjusted along the Late Pleistocene in response to ongoing compression and the incision of the Magdalena River. In a feedback relationship, the loss of drainage area and discharge in TD prevented vegetation expansion, which weakened the substratum and led to enhanced erosion.
Dill et al. (2020) recognized evolution stages of the Tatacoa desert based on the distribution of main typical badland zoning: the wadi (or “las quebradas”), gully (“arroyos”), and hillwash/mesa zones; these stages can be defined by the incision pulses delimited by the terraces OSL-ages. In the wadi zone, a planar surface is cut by intermittent drainage channels with wide horizontal channel floors, steep vertical walls that are filled with sand. These are the channels that integrate the Tatacoa 1 and the lower Tatacoa 2 catchment. In the past, such a zone extended further east and the Cabrera River and Las Lajas Creek, as well as their tributaries, freely entered in the desert from the mountains to the east (Figure 11A). This environment prevails at least until the time of the TAT-2 terrace deposition (at least 74 ka), during the end of the MIS-5 (Deplazes et al., 2013; Groot et al., 2014).
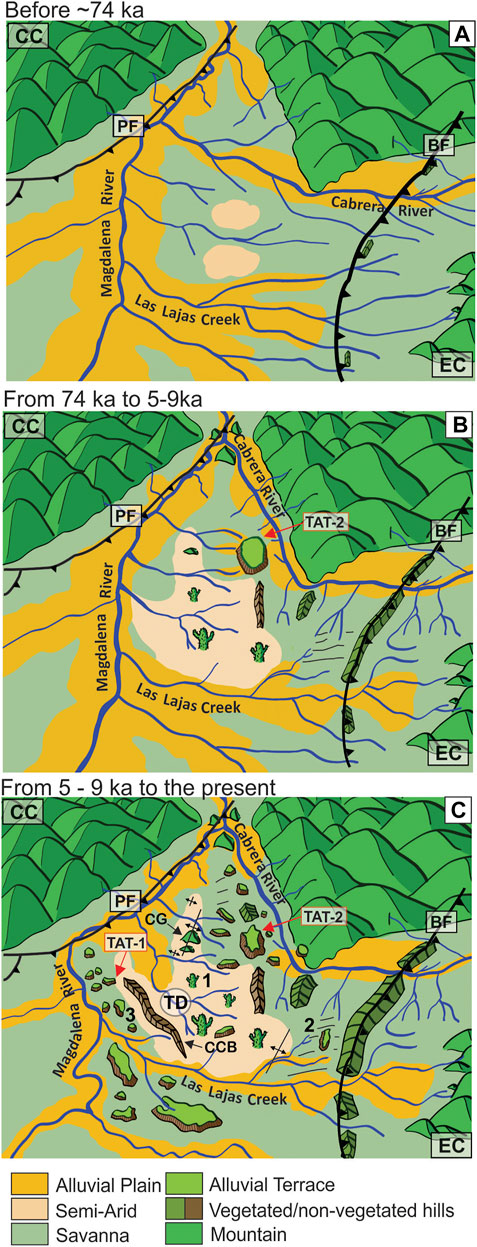
FIGURE 11. Evolution scheme of the Tatacoa Desert (TD) drainage network. (A) Before ∼74 ka. (B) Between 74 ka and 5–9 ka. (C) The present times. The formation of the terraces TAT-1 and TAT-2 is shown following the incision of the Magdalena River along the Prado Fault (PF). The shift to the north of Cabrera River and the topographic growth along the Baraya Fault (BF) reduced the drainage area within the TD, restricting surficial water availability and vegetation development. (CC) Is the Central Cordillera; (EC) is the Eastern Cordillera; (CG) is Cerro Gordo; and (CCB) is the Cerbatana Conglomerate Beds. The numbers are the Badlands zones: (1) Wadi; (2) Gully; and (3) hill wash/mesa zone.
With ongoing compression, the drainage network was induced to readjustment. The Cabrera River shifted to the north, which together with topographic growth along the Baraya Fault, led to the loss of drainage area of the Tatacoa drainage system (Figure 11B). Thus, the TD area was deprived of its major discharge contributions from Eastern Cordillera, resulting in its inability to balance the high evaporation and hampering to develop and maintain vegetation in its floodplain even during wet periods. This new rearrangement led to the second stage of Dill et al. (2020), illustrated by the Gully (“arroyos”) zones along the Cabrera/Tatacoa divide and the limbs of the internal synclines, that is, at the edges of the suspended topographic block of the TAT-2 terrace and the footwall of the Baraya Fault. The westward tilting of the Honda Group strata may have favored the continuity of ancient subsurface flow across the desert, even if the surface flow is now limited. By piping processes, the groundwater flow of the Cabrera and Las Hajas drainage system is directed to TD through open joints, leading to hillslope instability and formation of the gullies. This process was identified by Dill et al. (2020) as narrowing downward vugs, resulting from the removal of soluble minerals during episodical to periodical groundwater flow.
The lack of vegetation and hillslope erosion susceptibility are combined to the own nature of the rocks, with very soluble salts minerals and expansive clays (Dill et al., 2020). In a wet–dry tropical climate, these characteristics make the Honda Group rocks highly erodible during rainfall seasons. This is reflected in the high value for the K coefficient calculated for Tatacoa 1 and 2 catchments (Supplementary Table S7) and the fast increase in ksn and incision rates when the profiles are perturbed by external factors, such as incision pulses of the Magdalena River and the uplift along folds and faults (Figures 7, 9D–F). In the Tatacoa 1 and 2, catchments’ incision rates along with the χ-profile increase eastward from ∼5 mm/y to >10 mm/y. The initial rates are higher but closer to those calculated for the Cabrera River (2.8 ± 0.2 mm/y—Supplementary Table S4). They are likely towards equilibrium with the regional long-term uplift rates (Mora–Paez et al., 2019; Pérez Consuegra et al., 2021), whilst the higher rates are the responses to the Magdalena River incision pulses along Holocene. Whilst in Tatacoa 1 the incision wave moves upstream, in Tatacoa 2 the incision wave propagation was interrupted by the Cerro Gordo Anticline (CG) (Figures 9A,B,D). This is illustrated by the relict area in TD above 450–460 m a.s.l. (the TH arrow in Figures 9B–E), which is the lower limit of the Magdalena terraces. This area is restricted to the most upstream sector of the Tatacoa 1 catchment, whilst in Tatacoa 2, this is demarked by the CG (Figure 7). The focused incision in the CG has exhumed the Saldaña Formation (Figures 5A,B), which in the long-term tend to favor an increase in relief, the growth of a topographic barrier, and the rearrangement of catchments, as it was observed along the Baraya Fault with the Las Lajas catchment.
The Holocene incision pulses of the Magdalena River dissected mostly the La Victoria Formation, with the CCB restricting the Tatacoa 1 catchment area (Figures 2, 9A). The erosional resistance of CCB, together with the alluvial terraces delayed the incision propagation in the Las Lajas lower tributaries (Figure 11C), and incisions are lower than 1 mm/y in the relict areas (Figure 9E). This sector between the CCB and the Magdalena Valley, comprising Quaternary alluvial terraces and the Villavieja Formation, is the Hill wash/Mesa zone of Dill et al. (2020). This zone is formed by hillslope deposits derived from the dissection of the elevated flat terraces, as the TAT-1 and TAT-2. The alluvial plain of the Magdalena River is limited by this zone, while farther to the north, it developed to the east of the Prado Fault (Figure 2). By restricting the alluvial plain, this configuration also restricts any eastward expansion of the vegetation, hence marking the western boundary of the desert.
The alluvial terraces along the Tatacoa Desert recorded a drainage reorganization which triggered a pos that resulted in a water deficit and “aridification” of the landscape in the study area. The northward shift of the Cabrera River, deviating the Tatacoa Desert (TAT-2 terrace), and the westward migration of the Magdalena riverbed (TAT-1 terrace) has amplified the aridification effects in an area lacking any perennial river, which, in turn, restricts the vegetation development along the floodplains.
The optically stimulated luminescence dating, and the drainage system morphometric analysis revealed that such changes have been occurring during the last ∼74 ka and that they result from a combined effects of tectonics and regional climatic changes. Contractional deformation accommodated as thrust and folds affected the drainage system in two ways: 1. By creating a topographic barrier which limited the passage to the desert of Eastern Cordillera rivers; 2. By guiding incision and valley carving along the fault zone. While the ongoing compression built new topographic compartmentalization, climatic changes triggered pulses of aggradation and incision, which made the channels choose easier routes. The OSL ages indicate that the terraces were deposited during wet periods of the Marine Isotope Stages 5A (TAT-2) and during the Holocene Climatic Optimum (TAT-1), likely reflecting an increase in discharge and sediment production in the neighboring Central and Eastern cordilleras, due to enhanced precipitation.
A feedback relationship is then established between the tectonic drainage system rearrangement, climate, and erosion: as the sedimentary rocks in Tatacoa have little soil and vegetation cover, they became highly susceptible to erosion. Thus, the incision rates respond to external stimulation (e.g., increased discharge due to the climatic changes, or uplift along folds and faults) by readily increasing from the incision rates of <1–5 mm/y, in compass with regional long-term uplift rates, to incision rates of 10–20 mm/y.
The original contributions presented in the study are included in the article/Supplementary Material, further inquiries can be directed to the corresponding author.
DHS—writing, fieldwork, sample processing, and data analysis and interpretation; MP—project design, fieldwork, writing, and interpretation; IdR—OSL data analysis and interpretation; AOS—OSL data analysis and interpretation; FNP—project design, fieldwork, and interpretation; JSH-G—provenance analysis and interpretation; and SG—provenience analysis and interpretation.
DHS (#2019/00655-3), IdR (2019/20588-9) and MP (18/15613-1) were supported by the São Paulo Research Foundation (FAPESP). AOS (##304727/2017-2), FNP (#307262/2021-9), and MP (#313051/2018-6) are research fellows of Brazilian National Council for Scientific and Technological Development -CNPq/Brazil.
The authors declare that the research was conducted in the absence of any commercial or financial relationships that could be construed as a potential conflict of interest.
All claims expressed in this article are solely those of the authors and do not necessarily represent those of their affiliated organizations, or those of the publisher, the editors, and the reviewers. Any product that may be evaluated in this article, or claim that may be made by its manufacturer, is not guaranteed or endorsed by the publisher.
The authors thank Thays Desiree Mineli for her help with the OSL measurements, Maína Ortiz Fantini for the cartoon in Figure 11, and the reviewers for helping them improve the manuscript.
The Supplementary Material for this article can be found online at: https://www.frontiersin.org/articles/10.3389/feart.2022.808718/full#supplementary-material
Anderson, V. J., Horton, B. K., Saylor, J. E., Mora, A., Tesón, E., Breecker, D. O., et al. (2016). Andean Topographic Growth and Basement Uplift in Southern Colombia: Implications for the Evolution of the Magdalena, Orinoco, and Amazon River Systems. Geosphere 12 (4), 1235–1256. doi:10.1130/ges01294.1
Baby, P., Viveen, W., Sanjurjo-Sanchez, J., Bigot, J. Y., Dosseto, A., Villegas-Lanza, J. C., et al. (2020). First Record of OSL-Dated Fluvial Sands in a Tropical Andean Cave Reveals Rapid Late Quaternary Tectonic Uplift. Terra Nova 33, 262–273. doi:10.1111/ter.12512
Chiang, J. C. H., Biasutti, M., and Battisti, D. S. (2003). Sensitivity of the Atlantic Intertropical Convergence Zone to Last Glacial Maximum Boundary Conditions. Paleoceanography 18 (NO. 4), a–n. doi:10.1029/2003PA000916
Copernicus Sentinel data, European Space Agency, 2021 Retrieved from USGS January 21, 2014. doi:10.5066/F76W992G
DeCelles, P. G., Langford, R. P., and Schwartz, R. K. (1983). Two New Methods of Paleocurrent Determination from through Cross-Stratification. J. Sediment. Res. 53 (2), 629–642.
Deplazes, G., Lückge, A., Peterson, L. C., Timmermann, A., Hamann, Y., Hughen, K. A., et al. (2013). Links between Tropical Rainfall and North Atlantic Climate during the Last Glacial Period. Nat. Geosci 6, 213–217. doi:10.1038/ngeo1712
Diederix, H., Bohórquez, O. P., Mora–Páez, H., Peláez, J. R., Cardona, L., Corchuelo, Y., et al. (2020). “The Algeciras Fault System of the Upper Magdalena Valley, Huila Department,” in The Geology of Colombia, Volume 4 Quaternary. Editors J. Gómez, and A. O. Pinilla–Pachon (Bogotá: Servicio Geológico Colombiano, Publicaciones Geológicas Especiales), 38, 423–452. doi:10.32685/pub.esp.38.2019.12
Dill, H. G., Buzatu, A., Balaban, S.-I., Ufer, K., Gomez, J., Birgaoanu, D., et al. (2020). The “badland trilogy” of the Desierto de la Tatacoa, upper Magdalena Valley, Colombia, a result of geodynamics and climate: with a review of badland landscapes. Catena 194, 1–20. doi:10.1016/j.catena.2020.104696
Duller, G. A. T. (2003). Distinguishing Quartz and Feldspar in Single Grain Luminescence Measurements. Radiation Measurements 37, 161–165. doi:10.1016/S1350-4487(02)00170-1
Fan, A., Li, S.-H., and Li, B. (2011). Observation of Unstable Fast Component in OSL of Quartz. Radiat. Measurements 46 (1), 21–28. doi:10.1016/j.radmeas.2010.10.001
Ferreira, P. V., Nunez, A. T., and Rodriguez, M. A. P. (2002). Levantamiento Geologico de la plancha 323 Neiva Escala 1:100.000. Memoria Explicativa. Bogota: INGEOMINAS, 99.
Flint, J. J. (1974). Stream Gradient as a Function of Order, Magnitude, and Discharge. Water Resour. Res. 10, 969–973. doi:10.1029/wr010i005p00969
Flynn, J., Guerrero, J., and Swisher, C. (1997). “Geochronology of the Honda Group,” in Vertebrate Paleontology in the Neotropics: The Miocene Fauna of La Venta, Colombia. Editors R. Kay, C. Madden, R. L. Cifelli, and J. Flynn (Washington, DC: Smithsonian Institution Press), 44–60.
Forte, A. M., and Whipple, K. X. (2018). Criteria and Tools for Determining Drainage divide Stability. Earth Planet. Sci. Lett. 493, 102–117. doi:10.1016/j.epsl.2018.04.026
Fox, M., Bodin, T., and Shuster, D. L. (2015). Abrupt Changes in the Rate of Andean Plateau Uplift from Reversible Jump Markov Chain Monte Carlo Inversion of River Profiles. Geomorphology 238, 1–14. doi:10.1016/j.geomorph.2015.02.022
Fuquen, J. A., and Osorno, J. F. (2002). Geologia de la plancha 303, Departamentos de Huila, Tolima y Meta, Escala 1:100.000. Bogota: Memoria Explicativa, INGEOMINAS, 88.
Galbraith, R. F., and Roberts, R. G. (2012). Statistical Aspects of Equivalent Dose and Error Calculation and Display in OSL Dating: An Overview and Some Recommendations. Quat. Geochronol. 11, 1–27. doi:10.1016/j.quageo.2012.04.020
Geach, M. R., Viveen, W., Mather, A. E., Telfer, M. W., Fletcher, W. J., Stokes, M., et al. (2015). An Integrated Field and Numerical Modelling Study of Controls on Late Quaternary Fluvial Landscape Development (Tabernas, Southeast Spain). Earth Surf. Process. Landforms 40, 1907–1926. doi:10.1002/esp.3768
German Aerospace Center-TanDEM-X (2019). Available at: https://tandemx-science.dlr.de.
Gómez, J., Nivia, A., Montes, N. E., Almanza, M. F., and Madrid, C. A. (2015). “Notas explicativas: Mapa Geológico de Colombia,”in Publicaciones Geológicas Especiales. Editors J. Gómez, and M. F. Almanza (Bogotá: Bogotá Servicio Geológico Colombiano), Vol. 33, 35–60.
Goren, L., Fox, M., and Willett, S. D. (2014). Tectonics from Fluvial Topography Using Formal Linear Inversion: Theory and Applications to the Inyo Mountains, California. J. Geophys. Res. Earth Surf. 119, 1651–1681. doi:10.1002/2014JF003079
Grant, K. M., Rohling, E. J., Bar-Matthews, M., Ayalon, A., Medina-Elizalde, M., Ramsey, C. B., et al. (2012). Rapid Coupling between Ice Volume and Polar Temperature over the Past 150,000 Years. Nature 491, 744–747. doi:10.1038/nature11593
Groot, M. H. M., Bogotá, R. G., Lourens, L. J., Hooghiemstra, H., Vriend, M., Berrio, J. C., et al. (2011). Ultra-high Resolution Pollen Record from the Northern Andes Reveals Rapid Shifts in Montane Climates within the Last Two Glacial Cycles. Clim. Past 7 (1), 299–316. doi:10.5194/cp-7-299-2011
Groot, M. H. M., van der Plicht, J., Hooghiemstra, H., Lourens, L. J., and Rowe, H. D. (2014). Age Modelling for Pleistocene lake Sediments: A Comparison of Methods from the Andean Fúquene Basin (Colombia) Case Study. Quat. Geochronol. 22, 144–154. doi:10.1016/j.quageo.2014.01.002
Guérin, G., Mercier, N., and Adamiec, G. (2011). Dose-rate Conversion Factors: Update. Ancient TL 29 (1), 5–8.
Guerrero, J. (1997). “Stratigraphy, Sedimentary Environments, and the Miocene Uplift of the Colombian Andes,” in Vertebrate Paleontology in the Neotropics: The Miocene Fauna of La Venta, Colombia: Washington and London. Editors R. F. Kay, R. H. Madden, R. L. Cifelli, and J. J. Flynn (Smithsonian Institute Press), 15–43.
Guzmán, O., Vassallo, R., Audemard, F., Mugnier, J.-L., Oropeza, J., Yepez, S., et al. (2013). 10Be Dating of River Terraces of Santo Domingo River, on Southeastern Flank of the Mérida Andes, Venezuela: Tectonic and Climatic Implications. J. South Am. Earth Sci. 48, 85–96. doi:10.1016/j.jsames.2013.09.004
Hermelin, M. (2016). Geomorphological Landscapes and Landforms of Colombia, Landscapes, and Landforms of Colombia. New York, NY: Springer, 1–21. doi:10.1007/978-3-319-11800-0_1
Hoorn, C., Wesselingh, F. P., ter Steege, H., Bermudez, M. A., Mora, A., Sevink, J., et al. (2010). Amazonia through Time: Andean Uplift, Climate Change, Landscape Evolution, and Biodiversity. Science 330, 927–931. doi:10.1126/science.1194585
Horton, B., Parra, M., Saylor, J., Nie, J., Mora, A., Torres, V., et al. (2010). Resolving Uplift of the Northern Andes Using Detrital Zircon Age Signatures. Gsat 20 (7), 4–10. doi:10.1130/GSATG76A.1
Howard, A. D. (1994). A Detachment-Limited Model of Drainage basin Evolution. Water Resour. Res. 30 (7), 2261–2285. doi:10.1029/94WR00757
Howard, J. L. (1993). The Statistics of Counting Clasts in Rudites: a Review, with Examples from the Upper Palaeogene of Southern California, USA. Sedimentology 40 (2), 157–174. doi:10.1111/j.1365-3091.1993.tb01759.x
Hoyos, N., Monsalve, O., Berger, G. W., Antinao, J. L., Giraldo, H., Silva, C., et al. (2015). A climatic Trigger for Catastrophic Pleistocene-Holocene Debris Flows in the Eastern Andean Cordillera of Colombia. J. Quat. Sci. 30, 258–270. doi:10.1002/jqs.2779
IDEAM (2012). Promedios Climatológicos Actuales 1971–2000: Mapas Clima. Meteorología, y Estudios Ambientales, Instituto de Hidrología.
INGEOMINAS - Servicio Geologico Colombiano (SGC Colombia) (1993). Red Sismologica Nacional de Colombia [Data set]. International Federation of Digital Seismograph Networks. doi:10.7914/SN/CM
Kalnay, E., Kanamitsu, M., Kistler, R., Collins, W., Deaven, D., Gandin, L., et al. (1996). The NCEP/NCAR 40-year Reanalysis Project. Bull. Amer. Meteorol. Soc. 77, 437–471. doi:10.1175/1520-0477(1996)077<0437:tnyrp>2.0.co;2
Karger, D. N., Conrad, O., Böhner, J., Kawohl, T., Kreft, H., Soria-Auza, R. W., et al. (2017). Data from: Climatologies at High Resolution for the Earth’s Land Surface Areas. Dryad Digital Repository 4. doi:10.5061/dryad.kd1d4
Karger, D. N., Conrad, O., Böhner, J., Kawohl, T., Kreft, H., Soria-Auza, R. W., et al. (2017). Climatologies at High Resolution for the Earth's Land Surface Areas. Sci. Data 4, 170122. doi:10.1038/sdata.2017.122
Kay, R. F., and Madden, R. H. (1997). “Paleogeography and Paleoecology,” in Vertebrate Paleontology in the Neotropics: The Miocene Fauna of La Venta, Colombia: Washington and London. Editors R. F. Kay, R. H. Madden, R. L. Cifelli, and J. J. Flynn (Smithsonian Institute Press), 520–550.
Madden, R. H., Guerrero, J., Kay, R. F., Flynn, J. J., Swisher, C. C., and Walton, A. H. (1997). “The Laurentian Stage and Age,” in Vertebrate Paleontology in the Neotropics: The Miocene Fauna of La Venta, Colombia: Washington and London. Editors R. F. Kay, R. H. Madden, R. L. Cifelli, and J. J. Flynn (Smithsonian Institute Press), 499–519.
Montes, C., Silva, C. A., Bayona, G. A., Villamil, R., Stiles, E., Rodriguez-Corcho, A. F., et al. (2021). A Middle to Late Miocene Trans-andean Portal: Geologic Record in the Tatacoa Desert. Front. Earth Sci. 8, 587022. doi:10.3389/feart.2020.587022
Mora, A., Parra, M., Strecker, M. R., Kammer, A., Dimaté, C., and Rodríguez, F. (2006). Cenozoic Contractional Reactivation of Mesozoic Extensional Structures in the Eastern Cordillera of Colombia. Tectonics 25, a–n. doi:10.1029/2005TC001854
Mora-Páez, H., Kellogg, J. N., Freymueller, J. T., Mencin, D., Fernandes, R. M. S., Diederix, H., et al. (2019). Crustal Deformation in the Northern Andes - A New GPS Velocity Field. J. South Am. Earth Sci. 89, 76–91. doi:10.1016/j.jsames.2018.11.002
Mora–Páez, H., Mencin, D. J., Molnar, P., Diederix, H., Cardona–Piedrahita, L., Peláez–Gaviria, J. R., et al. (2016). GPS Velocities and the Construction of the Eastern Cordillera of the Colombian Andes. Geophys. Res. Lett. 43 (16), 8407–8416. doi:10.1002/2016GL069795
Murray, A. S., Thomsen, K. J., Masuda, N., Buylaert, J. P., and Jain, M. (2012). Identifying Well-Bleached Quartz Using the Different Bleaching Rates of Quartz and Feldspar Luminescence Signals. Radiat. Measurements 47 (9), 688–695. doi:10.1016/j.radmeas.2012.05.006
Murray, A. S., and Wintle, A. G. (2003). The Single Aliquot Regenerative Dose Protocol: Potential for Improvements in Reliability. Radiat. Measurements 37, 377–381. doi:10.1016/S1350-4487(03)00053-2
Parra, M., Mora, A., Sobel, E. R., Strecker, M. R., and González, R. (2009). Episodic Orogenic Front Migration in the Northern Andes: Constraints from Low-Temperature Thermochronology in the Eastern Cordillera, Colombia. Tectonics 28, a–n. doi:10.1029/2008TC002423
Peel, M. C., Finlayson, B. L., and McMahon, T. A. (2007). Updated World Map of the Köppen-Geiger Climate Classification. Hydrol. Earth Syst. Sci. 11, 1633–1644. doi:10.5194/hess-11-1633-2007
Pérez-Consuegra, N., Hoke, G. D., Mora, A., Fitzgerald, P., Sobel, E. R., Sandoval, J. R., et al. (2021). The Case for Tectonic Control on Erosional Exhumation on the Tropical Northern Andes Based on Thermochronology Data. Tectonics 40, e2020TC006652. doi:10.1029/2020TC006652
Perron, J. T., and Royden, L. (2013). An Integral Approach to Bedrock River Profile Analysis. Earth Surf. Process. Landforms 38 (6), 570–576. doi:10.1002/esp.3302
Poveda, G., Waylen, P. R., and Pulwarty, R. S. (2006). Annual and Inter-annual Variability of the Present Climate in Northern South America and Southern Mesoamerica. Palaeogeogr. Palaeoclimatol. Palaeoecol. 234, 3–27. doi:10.1016/j.palaeo.2005.10.031
Prescott, J. R., and Hutton, J. T. (1994). Cosmic ray Contributions to Dose Rates for Luminescence and ESR Dating: Large Depths and Long-Term Time Variations. Radiat. Measurements 23, 497–500. doi:10.1016/1350-4487(94)90086-8
Rasmussen, S. O., Bigler, M., Blockley, S. P., Blunier, T., Buchardt, S. L., Clausen, H. B., et al. (2014). A Stratigraphic Framework for Abrupt Climatic Changes During the Last Glacial Period Based on Three Synchronized Greenland Ice-Core Records: Refining and Extending the INTIMATE Event Stratigraphy. Quaternary Science Reviews 106, 14–28. doi:10.1016/j.quascirev.2014.09.007
Rosenbloom, N. A., and Anderson, R. S. (1994). Hillslope and Channel Evolution in a marine Terraced Landscape, Santa Cruz, California. J. Geophys. Res. 99 (14), 029. doi:10.1029/94jb00048
Saylor, J. E., Mora, A., Horton, B. K., and Nie, J. (2009). Controls on the Isotopic Composition of Surface Water and Precipitation in the Northern Andes, Colombian Eastern Cordillera. Geochimica et Cosmochimica Acta 73 (23), 6999–7018. doi:10.1016/j.gca.2009.08.030
Scherler, D., and Schwanghart, W. (2020a). Drainage divide Networks - Part 1: Identification and Ordering in Digital Elevation Models. Earth Surf. Dynam. 8, 245–259. doi:10.5194/esurf-8-245-2020
Scherler, D., and Schwanghart, W. (2020b). Drainage divide Networks - Part 2: Response to Perturbations. Earth Surf. Dynam. 8, 261–274. doi:10.5194/esurf-8-261-2020
Schneider, T., Bischoff, T., and Haug, G. H. (2014). Migrations and Dynamics of the Intertropical Convergence Zone. Nature 513, 45–53. doi:10.1038/nature13636
Schwanghart, W., and Scherler, D. (2014). Short Communication: TopoToolbox 2 - MATLAB-Based Software for Topographic Analysis and Modeling in Earth Surface Sciences. Earth Surf. Dynam. 2, 1–7. doi:10.5194/esurf-2-1-2014
Siravo, G., Molin, P., Sembroni, A., Fellin, M. G., and Faccenna, C. (2021). Tectonically Driven Drainage Reorganization in the Eastern Cordillera, Colombia. Geomorphology 389, 107847. doi:10.1016/j.geomorph.2021.107847
Struth, L., Teixell, A., Owen, L. A., and Babault, J. (2016). Plateau Reduction by Drainage Divide Migration in the Eastern Cordillera of Colombia Defined by Morphometry and 10Be Terrestrial Cosmogenic Nuclides. Earth Surface Processes and Landforms 42, 1155–1170. doi:10.1002/esp.4079
Struth, L., Giachetta, E., Willet, S. D., Owen, L. A., and Tesón, E. (2020). Quaternary Drainage Network Reorganization in the Colombian Eastern Cordillera Plateau. Earth Surface Processes and Landforms 45, 1789–1804. doi:10.1002/esp.4846
Terraza-Melo, R., Martin, C. L., Martínez, G. A., Rojas, S. T., and Rojas, N. R. (2019). “Exploración geológica de fosfatos en el departamento del Huila, costado Occidental del río Magdalena, Plan 302, 323, 344, 345 y 366,” in . Internal Report. Servicio Geologico Colombiano. Bogot.
Van der Wiel, A. M. (1991). Uplift and Volcanism of the SE Colombian Andes in Relation to Sedimentation in the Upper Magdalena Valley. Ph.D. thesis. Wageningen, Netherlands: Agricultural University of Wagenigen, 208.
Velandia, F., Núñez, A., and Marquínez, G. (2001). Mapa Geológico del Departamento del Huila Escala 1:300.000, Memoria explicativa. Bogotá: Bogotá Ingeominas, 151.
Veloza, G., Styron, R., Taylor, M., and Mora, A. (2012). Open-source Archive of Active Faults for Northwest South America. Gsat 22 (10), 4–10. doi:10.1130/GSAT-G156A.110.1130/gsat-g156a.1
Veloza, G., Taylor, M., Mora, A., and Gosse, J. (2015). Active Mountain Building along the Eastern Colombian Subandes: A Folding History from Deformed Terraces across the Tame Anticline, Llanos Basin. Geol. Soc. America Bull. 127 (9-10), 1155–1173. doi:10.1130/B31168.1
Viveen, W., Baby, P., Sanjurjo-Sanchez, J., and Hurtado-Enríquez, C. (2020). Fluvial Terraces as Quantitative Markers of Late Quaternary Detachment Folding and Creeping Thrust Faulting in the Peruvian Huallaga basin. Geomorphology 367, 107315. doi:10.1016/j.geomorph.2020.107315
Whipple, K. X., Forte, A. M., DiBiase, R. A., Gasparini, N. M., and Ouimet, W. B. (2017). Timescales of Landscape Response to divide Migration and Drainage Capture: Implications for the Role of divide Mobility in Landscape Evolution. J. Geophys. Res. Earth Surf. 122, 248–273. doi:10.1002/2016JF003973
Whipple, K. X., and Tucker, G. E. (1999). Dynamics of the Stream-Power River Incision Model: Implications for Height Limits of Mountain Ranges, Landscape Response Timescales, and Research Needs. J. Geophys. Res. 104, 17661–17674. doi:10.1029/1999JB900120
Willett, S. D., McCoy, S. W., Perron, J. T., Goren, L., and Chen, C.-Y. (2014). Dynamic Reorganization of River Basins. Science 343, 1248765. doi:10.1126/science.1248765
Wintle, A. G., and Murray, A. S. (2006). A Review of Quartz Optically Stimulated Luminescence Characteristics and Their Relevance in Single-Aliquot Regeneration Dating Protocols. Radiat. Measurements 41 (4), 369–391. doi:10.1016/j.radmeas.2005.11.001
Wobus, C., Whipple, K. X., Kirby, E., Snyder, N., Johnson, J., Spyropolou, K., et al. (2006). Tectonics from Topography: Procedures, Promise, and Pitfalls. Geol. Soc. America. Spec. Pap. 398, 55–74. doi:10.1130/2006.2398(04)
Keywords: aridification, alluvial terraces, optically stimulated luminescence dating, drainage system, chi-profile
Citation: Souza DH, Parra M, del Rio I, Sawakuchi AO, Pupim FN, Hernández-González JS and Gomez S (2022) Late Quaternary Drainage Rearrangement Prevents the Vegetation Development in the La Tatacoa Intermontane Basin of the Colombian Andes. Front. Earth Sci. 10:808718. doi: 10.3389/feart.2022.808718
Received: 03 November 2021; Accepted: 02 March 2022;
Published: 23 March 2022.
Edited by:
Nadia Solovieva, University College London, United KingdomReviewed by:
Xianyan Wang, Nanjing University, ChinaCopyright © 2022 Souza, Parra, del Rio, Sawakuchi, Pupim, Hernández-González and Gomez. This is an open-access article distributed under the terms of the Creative Commons Attribution License (CC BY). The use, distribution or reproduction in other forums is permitted, provided the original author(s) and the copyright owner(s) are credited and that the original publication in this journal is cited, in accordance with accepted academic practice. No use, distribution or reproduction is permitted which does not comply with these terms.
*Correspondence: D. H. Souza, ZGFuaWVsaHNvdXphQHVzcC5icg==
Disclaimer: All claims expressed in this article are solely those of the authors and do not necessarily represent those of their affiliated organizations, or those of the publisher, the editors and the reviewers. Any product that may be evaluated in this article or claim that may be made by its manufacturer is not guaranteed or endorsed by the publisher.
Research integrity at Frontiers
Learn more about the work of our research integrity team to safeguard the quality of each article we publish.