 Hu Wang
 Aizhong Yue1
 Jizhou Tang
 Bo Han
- 1China National Logging Corporation, Xi’an, China
- 2State Key Laboratory of Marine Geology, Tongji University, Shanghai, China
The pulsed neutron-gamma density logging technique is used to measure the bulk density of formations based on the detection of gamma rays from the inelastic scattering of neutrons in the formations. However, the induced gamma ray source is regarded as a function of neutron transport and cannot be considered a “point” source. Due to the high energy level of gamma rays, the attenuation of inelastic gamma rays is affected by Compton scattering and pair production. Therefore, bulk density can be measured using inelastic gamma rays while considering the effects of neutron transport and pair production. In this article, a novel density measurement method that uses a completely different response model is proposed to improve the accuracy of density measurement. The process of neutron-gamma density measurement is divided into the neutron transport group and the gamma ray transport group in accordance with the neutron-gamma coupled field theory. A novel density estimation algorithm is derived from the diffusion equation and the gamma ray attenuation law. The accuracy and specification of density measurement are investigated through the Monte Carlo simulation and the calibration of test pits. Theoretical and experimental analyses show that the neutron transport and gamma ray transport are not entirely independent of each other in the pulsed neutron-gamma density measurement. The newly developed model can effectively enable the inelastic gamma rays to conform to the gamma ray attenuation law and keep the measurement accuracy at ±0.025 g/cm3. Moreover, neutron-gamma density is insensitive to the porosity and lithology of the formation. The proposed novel algorithm successfully establishes the calculation model for the relationship between inelastic gamma rays and bulk density, providing a new perspective for density measurement in pulsed neutron-gamma density logging.
Introduction
The downhole logging tool with a radioisotope source plays an important role in hydrocarbon exploration and production (Ellis and Singer, 2007). As one of the most important parameters for the interpretation of well logs, the formation bulk density is widely used in reservoir evaluation. The conventional gamma density logging tools using cesium-137 (Cs-137) as the gamma source may date back about 50 years. This radioisotope source emits gamma rays with energies of 662 keV located in the Compton scattering zone. Compton scattering is the dominant interaction in gamma ray transport. Hence, gamma ray attenuation is proportional to electron density, ensuring high accuracy of density measurement. In clear and shale formations, the accuracy of the conventional gamma density measurement can reach ±0.015 g/cm3 (Reichel et al., 2012). However, the use of radioisotope source in well logging may pose health, safety, and environmental (HSE) risks. The use of pulsed neutron generator (PNG) in place of radioactive sources can help eliminate the risks of exposure to radiation and reduce the cost associated with source storage, transportation, and record keeping. In addition, PNG can provide a large amount of important well-log data that enables more accurate overall evaluation of complex reservoirs (Baumann and Henninges, 2012).
In recent decades, research scientists have been investigating several ways of replacing the Cs-137 source used for measuring formation density. The earliest solution is to use X-ray sources with a 4 MeV linear accelerator (Becker et al., 1987; King et al., 1987). The X-rays are generated by the collision of high-speed electrons with heavy metal target nuclei, resulting in bremsstrahlung radiation. Simon et al. (2018) developed two X-ray experimental prototypes using a continuous downhole X-ray generator with endpoint energies ranging from 250 to 400 keV. However, these X-ray density tools have not been commercialized.
The pulsed neutron-gamma density logging technique measures the bulk density of formations based on the detection of inelastic gamma rays in the formations without using any radioisotope source. The design concept was first proposed in cased-hole density measurements (Wilson, 1995; Odom et al., 1998). In comparison with the single gamma ray transport process in conventional gamma density measurement, the physical process of the pulsed neutron-gamma density logging is more complex in the formations. This physical process mainly includes neutron transport, inelastic gamma ray production, and gamma ray transport (Streeter et al., 1996; Odom et al., 1998). The accuracy of the neutron-gamma density logging in bulk density measurement is lower than that of conventional gamma density logging techniques because of the complex physical mechanism (Evans et al., 2012). The induced gamma ray source is produced by the collision of fast neutrons with the formation. Formation properties (porosity, lithology, and pore fluid) affect neutron slowing down and the generation of inelastic gamma rays. Therefore, the gamma source is a dispersed spectral source that is spatially distributed near the pulsed neutron generator. The size and strength of the induced gamma ray source are dynamic and are mainly affected by the neutron transport and the inelastic gamma production cross section of the formation (Odom et al., 1999). In the subsequent process of gamma ray transport, gamma responses are mainly affected by formation density. The gamma rays from the inelastic scattering of neutrons have high energies ranging from several keV to 7 MeV. For example, the energies of gamma rays from oxygen-16 are mostly in the 6–7 MeV range, and the energies of gamma rays from carbon are about 4.4 MeV. Pair production in gamma ray physics is sensitive to lithology, and the theoretical energy threshold is 1.02 MeV. Therefore, Compton scattering is no longer the only interaction in the gamma ray transport process.
A great challenge in density measurement using pulsed neutron sources instead of conventional chemical sources is how to improve the accuracy of density measurement. Establishing the correct relationship between the gamma response and bulk density is one of the key factors. In recent decades, many scholars have put forward a variety of estimation algorithms used in pulsed neutron-gamma density logging. Wilson (1995), Odom et al. (1997), and Odom et al. (1999) developed a neutron-gamma density calculation method based on the gamma diffusion length in water-filled formations. In this method, the gamma diffusion length is inversely proportional to bulk density and can be calculated by the ratio of inelastic gamma ray count rates of the near and far detectors. However, it is necessary to correct the influence of the variations in induced gamma ray source in gas-bearing or low-porosity formations. Odom et al. (2001) developed a cased-hole pulsed neutron-gamma density tool with a fast neutron detector. Jacobson et al. (2004) pointed out that neutron capture gamma rays could be used for correction in density calculation. Schlumberger developed the first commercial logging-while-drilling (LWD) pulsed neutron-gamma density measurement tool with thermal and epithermal neutron detectors (Yu et al., 2011; Evans et al., 2012; and Reichel et al., 2012). For all the methods previously mentioned, it is assumed that the inelastic gamma rays are affected by the hydrogen index and gamma ray transport, and fast neutrons, epithermal neutrons, thermal neutrons, and capture gamma rays can be used to correct the hydrogen index. However, the effect of fast neutrons still exists and needs to be further corrected. The accuracy of density measurement is ±0.025 g∕cm3 in clean formations and ±0.045 g∕cm3 in shale formations (Evans et al., 2012). Zhang et al. (2017) and Luycx and Carlos (2018) determined the relationship between formation bulk density and the ratio of inelastic gamma ray count rates based on the Monte Carlo simulation and the coupled field theory, thus enabling the pulsed neutron-gamma density calculation method to be theorized for the first time. Their theoretical tool consists of two gamma ray detectors and several fast neutron detectors. Using the coupled field theory and based on the principle of energy window compensation, Wang et al. (2019); Wang et al. (2020) obtained the density estimation algorithm insensitive to formation lithology and pore fluid.
In this article, the spatial distribution of inelastic gamma rays is obtained by solving the diffusion equation based on the neutron-gamma coupled field theory. Furthermore, a new formation density estimation algorithm is derived considering the principle of energy window compensation. Then, the measurement specification and density measurement accuracy of the experimental tool are analyzed through the Monte Carlo simulation and experiments on test pits. Theoretical analysis and experimental data show that neutron transport and gamma ray transport are not completely independent in neutron-gamma density measurement. The new density estimation algorithm can effectively enable the inelastic gamma rays to conform to the gamma ray attenuation law. The neutron-gamma density is insensitive to formation porosity and lithology, and the accuracy of bulk density measurement can reach ±0.025 g/cm3. The results of application of the new density estimation algorithm in the field wells are presented.
Methodology
The basic principle of the pulsed neutron-gamma density logging is based on the detection of the attenuation of neutron-induced inelastic gamma rays through Compton scattering. However, the induced gamma ray source is an extended source, and the attenuation of inelastic gamma rays is affected by pair production and Compton scattering. The correction of the effects of neutron transport and pair production is the main challenge for the density estimation algorithm.
Neutron Transport
The pulsed neutron-gamma density measurement involves three processes, including neutron transport, inelastic gamma ray production, and gamma ray transport. The basic issue of neutron transport is how to describe the neutron transport process using neutron flux.
If the angular distribution of the neutron velocity vector is isotropic or nearly isotropic, neutron flux can be expressed by the diffusion equation. In neutron-gamma density logging, the energy level of fast neutrons emitted from the pulsed neutron source is 14.1 MeV. Therefore, this source can be regarded as a mono-energetic point source. Like the group diffusion method used in thermal neutron porosity logging, the process of pulsed neutron-gamma density logging is divided into two groups, namely, the neutron transport group and the gamma ray transport group.
For the neutron transport group, assuming that the pulsed neutron source emits Q neutrons per unit time, the diffusion equation can be expressed as follows (Tittle, 1961):
where Dn is the diffusion coefficient of fast neutrons in the formation, ▽2 is the Laplace operator, ϕn is the spatial flux distribution of fast neutrons, and Σn is the macroscopic neutron scattering cross section in the formation.
According to the diffusion equation, the flux distribution of fast neutrons ϕn in a simple, spherical, and homogeneous point source model can be expressed as follows (Tittle, 1961):
where r is the distance between the pulsed neutron source and the detection point, and Ln is the neutron slowing-down length, which is given by Ln=(Dn/Σn) 0.5.
Most fast neutrons are concentrated near the pulsed neutron source during neutron-gamma density measurement. Therefore, the inelastic scattering of fast neutrons mainly occurs near the neutron source. Figure 1 shows the spatial variations in fast neutron flux in different formations. As the source-detector distance increases, fast neutron flux decreases sharply, and the difference in fast neutron flux in different formations also increases. Fast neutron flux decreases significantly with the increase in porosity in freshwater-filled formations. When freshwater in the pores is replaced by a gas (methane or carbon dioxide), fast neutron flux will increase greatly. When the gas is methane, the higher pore gas density is, the smaller fast neutron flux will be. However, when the gas is carbon dioxide, pore gas density has almost no impact on fast neutron flux.
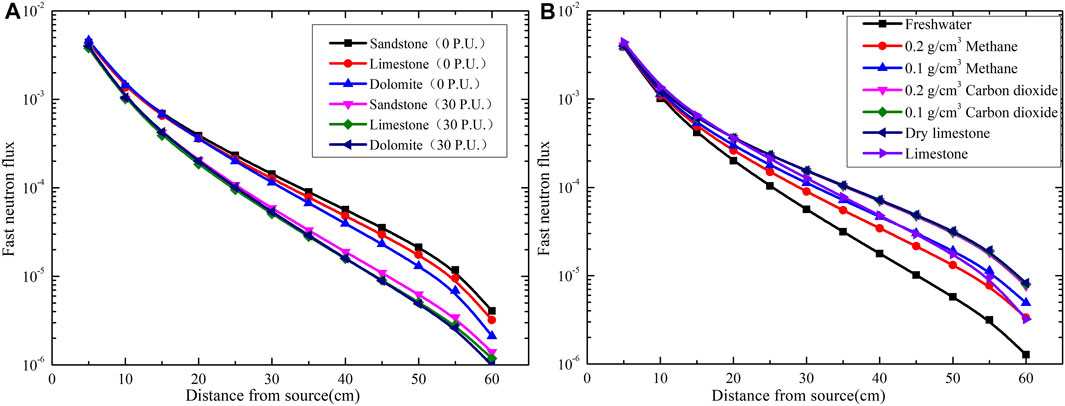
FIGURE 1. Spatial variation in fast neutron flux for various mineral and fluid combinations: (A) freshwater-filled formations with varying porosity; (B) limestone formations with varying pore fluid.
Figure 2 shows that the spatial distribution of fast neutron flux in the two energy intervals of formations with varying pore fluid, where the range from 0.1 to 6 MeV is defined as the low-energy interval of fast neutrons and the range from 6 to 14 MeV is regarded as the high-energy interval. As the pore fluid changes, there will be an obvious distinction between these two energy intervals of fast neutrons. When the pore fluid is freshwater, fast neutron flux increases slowly in the high-energy interval and decreases rapidly in the low-energy interval with the increase in formation porosity. When the pore fluid is methane, fast neutron flux increases rapidly in the high-energy interval and decreases slowly in the low-energy interval, with the increase in formation porosity. When the pore fluid is carbon dioxide or the formation is a dry formation, the fast neutron flux in the two energy intervals increases with the increase in formation porosity, and the increase in fast neutron flux in the high-energy interval is greater than that in the low-energy interval. As shown in Figures 1, 2, the spatial distribution and energy distribution of fast neutrons are dynamic and mainly affected by neutron transport.

FIGURE 2. Fast neutron flux distribution at different energy intervals.
Gamma Ray Production
For the inelastic scattering of fast neutrons, assuming that i is the average number of gamma photons generated during each inelastic collision, Σin is the macroscopic neutron inelastic scattering cross section, σin is the microscopic neutron inelastic scattering cross section, and N is the atomic density, gamma ray production by neutron inelastic scattering can be expressed as follows:
As shown in Figure 3, the inelastic scattering cross sections of various nuclides are different and mainly related to the energy of incident neutrons and the mass number of target nuclei. However, the inelastic scattering cross sections of nuclides, such as 16O, 28Si, and 40Ca, are relatively close to each other. Therefore, there is no significant change in the inelastic scattering cross sections, and there are only slight changes in the weight fraction of some nuclides.
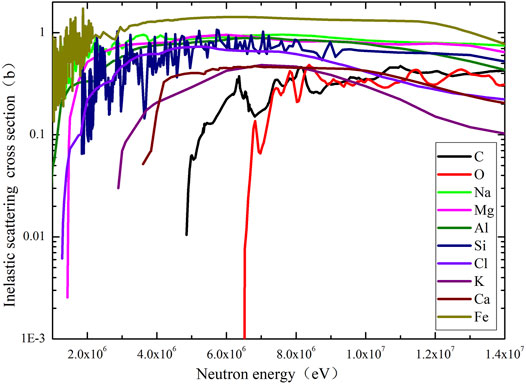
FIGURE 3. Inelastic scattering cross sections of various nuclides.
As the scattering cross sections of the most abundant nuclides are close to each other, the macroscopic cross section for neutron inelastic scattering is mainly related to the atomic density of the formation, and it is equal to the sum of the products of the inelastic scattering cross section and atomic density of each element in the formations. As shown in Figure 4, 16O content is dominant in the formation. If the fast neutron flux is assumed to be constant and does not vary with the formation properties, the strength of the induced gamma ray source mainly depends on 16O content. The 16O atomic density and the total atomic density decrease with the increase in formation porosity, no matter whether the pore fluid is freshwater or gas. With the increase in porosity, the 16O atomic density decreases faster in the gas-filled formation than in the freshwater-filled formation. Therefore, porosity variations have a great impact on the induced gamma ray source in the gas-filled formation.
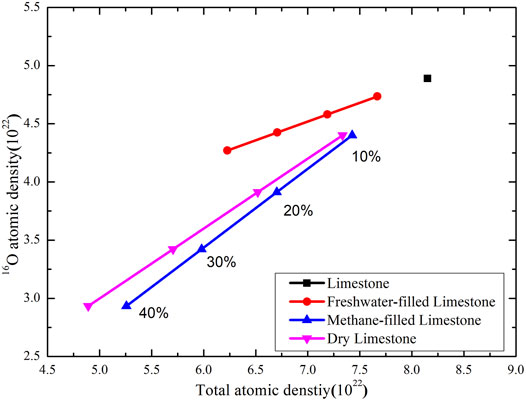
FIGURE 4. Relationship between 16O atomic density and total atomic density for various fluid combinations.
Gamma Ray Transport
For the gamma ray transport group, assuming that Dγ is the diffusion coefficient of gamma rays, Σγ is the macroscopic scattering cross section of gamma rays, ϕγ is the gamma ray flux, and Lγ is the gamma ray attenuation length, which is given by Lγ =(Dγ/Σγ) 0.5, the diffusion equation for gamma rays can be expressed as follows (Odom et al., 1999; Odom et al., 2001):
By substituting Eq. 2 into Eq. 4, the following equation can be obtained as follows:
The aforementioned equation can be simplified to Eq. 6:
Assuming that U′ = rϕγ, Eq. 6 can be reorganized to the form given as follows:
The homogeneous general solution to Eq. 7 is as follows:
where, both A and B are undetermined coefficients. According to the boundary conditions, the gamma-ray flux in the formation space other than the induced gamma ray source is limited. Therefore, B = 0 can be obtained.
The general solution to Eq. 7 is as follows:
where C is an undetermined coefficient. By substituting Eq. 9 into Eq. 7, the value of C can be obtained as follows:
Therefore, the general solution to gamma ray flux is expressed as follows:
Because the distribution of gamma rays is spherically symmetric, the density of gamma photons passing through the sphere of the measuring point is 0, that is,
Therefore, the spatial flux distribution of inelastic gamma rayscan can be determined using the diffusion equation given as follows.
In Eq. 14, the gamma ray flux is related to source-detector distance, fast neutron transport, inelastic gamma ray production, and gamma ray transport. As shown in Figure 5, it is difficult to directly identify the relationship between gamma response and bulk density using a single gamma ray detector.
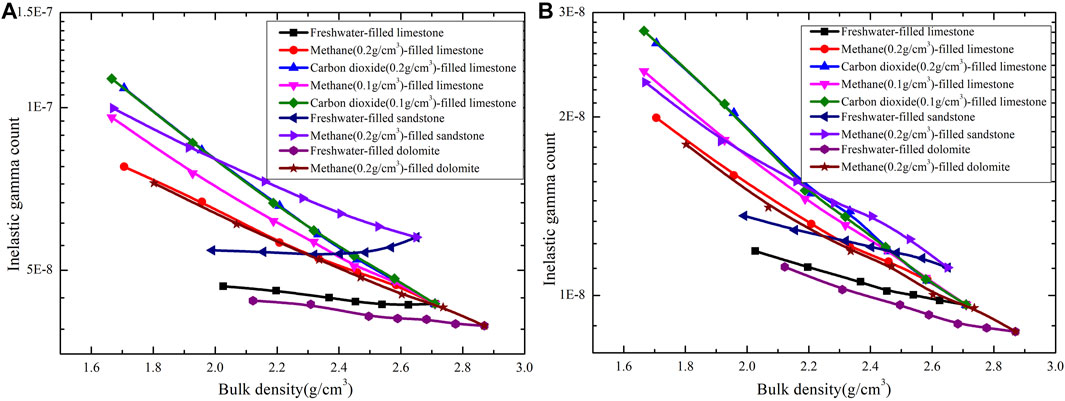
FIGURE 5. Cross-plot of inelastic scattering gamma ray count and bulk density for various mineral and fluid combinations: (A) near detector; (B) far detector.
Correction of the Effects of Neutron Transport and Pair Production
For two gamma ray detectors with the source-detector spacing r1 and r2 (r1<r2), the following equation can be obtained:
As shown in Figure 6, the effect of neutron transport cannot be neglected in inelastic gamma ray responses and should be compensated when the formation bulk density is calculated using the ratio of gamma ray count rates.
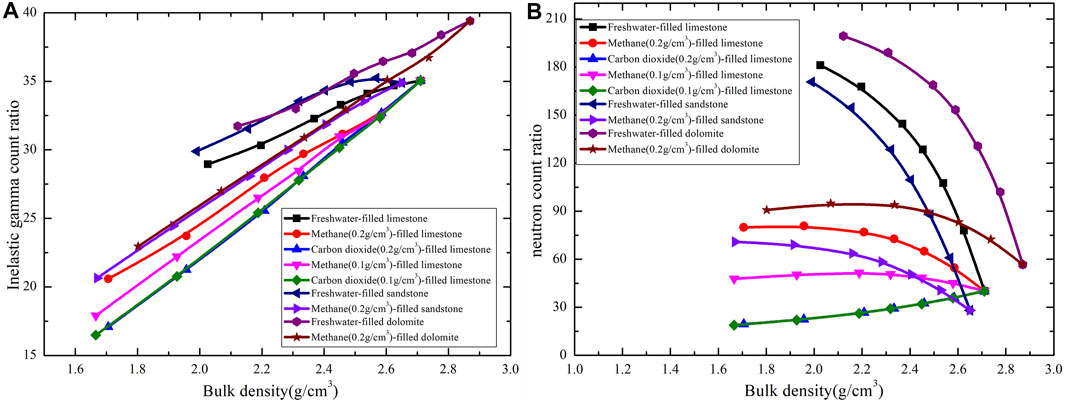
FIGURE 6. Cross-plot of count ratio and bulk density for various mineral and fluid combinations. (A) Inelastic scattering gamma ray count ratio; (B) neutron count ratio.
Based on Lagrange’s mean value theorem, bulk density can be expressed as follows (Wang et al., 2019):
where Rγ is the ratio of the inelastic gamma ray count rates of the near and far detectors, Rn is the ratio of the epithermal neutron count rates of the near and far detectors, and f and j are the logarithmic functions of the neutron count ratio, which are given by f(lnRn) = a1(lnRn)2+a2(lnRn) +a3 and j(lnRn) = a4(lnRn)3+a5(lnRn)2+a6(lnRn) +a7.
The original energies of inelastic scattering gamma rays from 16O, 12C, 28Si, and 40Ca are shown in Figure 7. For most elements, the energies of the gamma rays emitted are not unique and are concentrated in the range of 1–8 MeV, which are higher than the energies of those emitted by a 137Cs source. As shown in Figure 8, when the energies of incident gamma rays are within the range from 0.01 to 10 MeV, the percentage of pair production attenuation coefficient in the total mass attenuation coefficient varies as the energy changes. When the gamma rays are at low energy levels, the pair production attenuation coefficient is almost zero, which is consistent with the energy threshold of 1.02 MeV for pair production. The aforementioned percentage increases with the increase in energy. Although Compton scattering still dominates gamma ray attenuation, the effect of pair production should not be neglected.
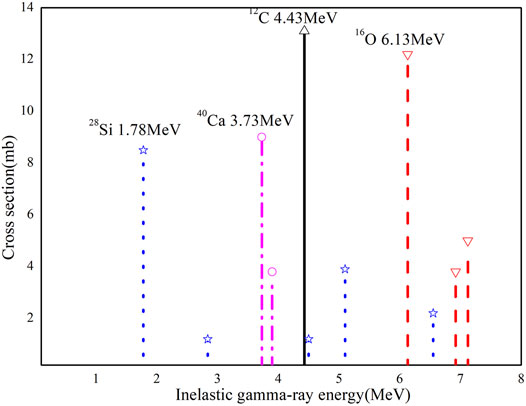
FIGURE 7. Inelastic scattering gamma ray spectrum.
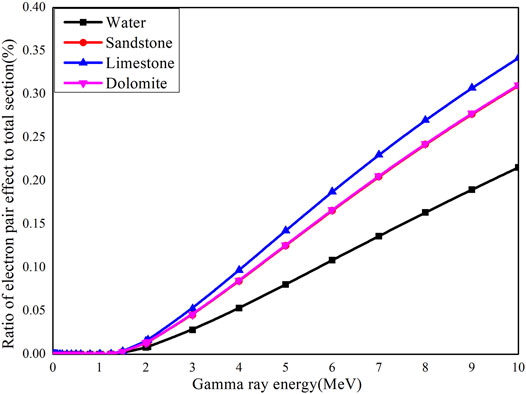
FIGURE 8. Ratio of pair production effect to total mass attenuation. [The data are calculated with XCOM (Berger et al., 2010).]
For neutron-gamma density measurement, the total attenuation of gamma rays is the linear superposition of the attenuation of gamma rays with different energies. In comparison with the gamma rays in the low-energy window, the gamma rays in the high-energy window are more affected by pair production. The spectra of inelastic gammy rays in the high-energy window can be compensated for the spectra of inelastic gamma rays in the low-energy window to correct the effect of pair production (Roberts, 2011). Bulk density can be expressed as follows (Wang et al., 2020):
where Rγ1 is the ratio of the low-energy gamma ray count rates of the near and far detectors, D is the fitting coefficient, Rγ2 is the ratio of the high-energy gamma ray count rates of the near and far detectors, and f’ and j’ are logarithmic functions of the neutron count ratio, which are given by f’(lnRn) = b1(lnRn)2+b2(lnRn)+b3 and j’(lnRn) = b4(lnRn)3+b5(lnRn)2+b6(lnRn) +b7. Equation 17 shows that neutron transport and gamma ray transport are not fully independent of each other. Neutron-gamma density can be calculated by the ratio of low and high-energy gamma ray count rates and the ratio of neutron count rates.
Experiment and Algorithm Development
Tool Structure
As shown in Figure 9, the wireline density logging experimental tool can be matched with other wireline tools with a diameter of 90 mm. The largest diameter of the tool is 124 mm at the position of the detector section. The material of the tool housing is precipitation hardening stainless steel (Cr17Ni4Cu4Nb). This tool can simultaneously provide several parameters including neutron porosity, neutron-gamma density, and element content in the formation. The tool sonde is mainly composed of the detector section and the electronics section. The detector section consists of two lanthanum bromide (LaBr3: Ce) gamma ray scintillation crystal detectors, two He-3 neutron detectors, and a pulsed neutron generator. The high-voltage power supply and multi-channel pulse-height analyzer of the electronics section are placed in the Dewar flask.
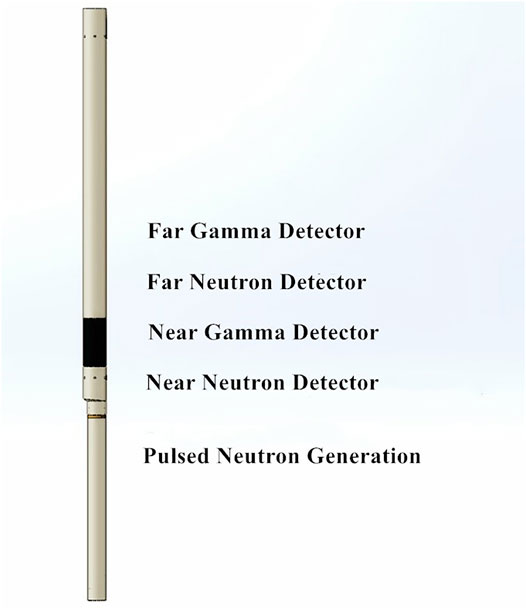
FIGURE 9. Sonde of the neutron-gamma density logging experimental tool.
In the neutron slowing-down process, the gamma rays resulting from the interactions of neutrons usually include inelastic gamma rays and capture gamma rays. In density measurement with commercial logging tools, the net inelastic gamma ray spectrum is used to calculate the formation bulk density, which is often obtained by removing the spectra of capture gamma rays using a subtraction factor.
Algorithm Development
The first step of algorithm development is to determine the neutron and gamma ray count rates of the experimental tool in a controlled environment. This environment is available at the Well Logging Metrology Station, China National Logging Corporation (CNLC), where there are sandstone, limestone, and dolomite rocks with various porosities in neutron porosity test pits. For these test pits, formation density is within the range of 1.8–2.86 g/cm3, and the 20-cm-diameter borehole is filled with freshwater. All of these standard conditions are required for the bulk density algorithm.
There are no test pits for gas-filled shale, gypsum, and anhydrite formations, which are very difficult to handle in laboratory conditions. The controlled environment was extended using the simulation method. Monte Carlo (Goorley, 2014) simulations were performed using artificial hypothesis formations. The simulation method allows for arbitrary addition of porosities, pore fluids, borehole fluids, and borehole sizes.
The results obtained using the new density estimation algorithm are presented in Figure 10. The calculated apparent density is highly consistent with the actual density, and most of the measuring points in various formations fall on the line. The effects of neutron transport and pair production have been compensated for various formations. The accuracy of the neutron-gamma density measurement using the new density estimation algorithm is ±0.025 g/cm3. The measurement accuracy is independent of mineralogy, formation porosity, and pore fluid, especially in shale and shaly formations and in gas-filled formations. However, the results show that the new density estimation algorithm performs poorly in the high-density formations and the low-density gas-filled formations. The density of the measured formation should be within the range of 1.95–2.90 g/cm3.
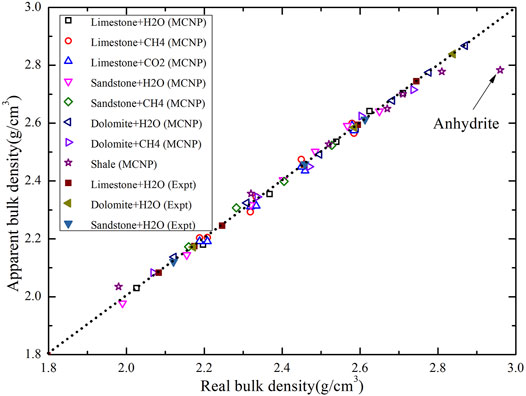
FIGURE 10. Diagram of the results for various formations from the MCNP tool model and experimental tool processed using the Levenberg–Marquardt method.
This problem with the neutron-gamma density measurement is a combined neutron-gamma ray transport problem. The density estimation algorithm shows that the bulk density is determined by two parameters, namely, the ratio of gamma ray count rates and the ratio of neutron count rates. However, both modes of transport vary simultaneously in laboratory formations. Therefore, it is very difficult to create controlled formation environments in which the neutron slowing down length is constant but bulk density is variable, or vice versa. For this reason, the Levenberg–Marquardt method is used to obtain the correlation coefficient for the density estimation algorithm.
Measurement Specifications
eutron-gamma density measurement is based on the responses of gamma rays from neutron inelastic scattering detected by the two gamma ray detectors at different source-director distances. To increase the contribution of gamma ray transport, the far gamma ray detector is positioned far from the pulsed neutron source, which results in a poorer vertical resolution and a greater depth of investigation.
Vertical Resolution
The conventional gamma density logging tools can identify the layers with a thickness of about 40 cm (Ellis and Singer, 2007). Figure 11 shows the vertical resolution of the neutron-gamma density tool in a vertical borehole, where the background formation is a 20 P.U. limestone formation filled with freshwater, and the thin layer is a 0 P.U. limestone formation. The results show that the neutron-gamma density has a relatively poor vertical resolution of about 75 cm.
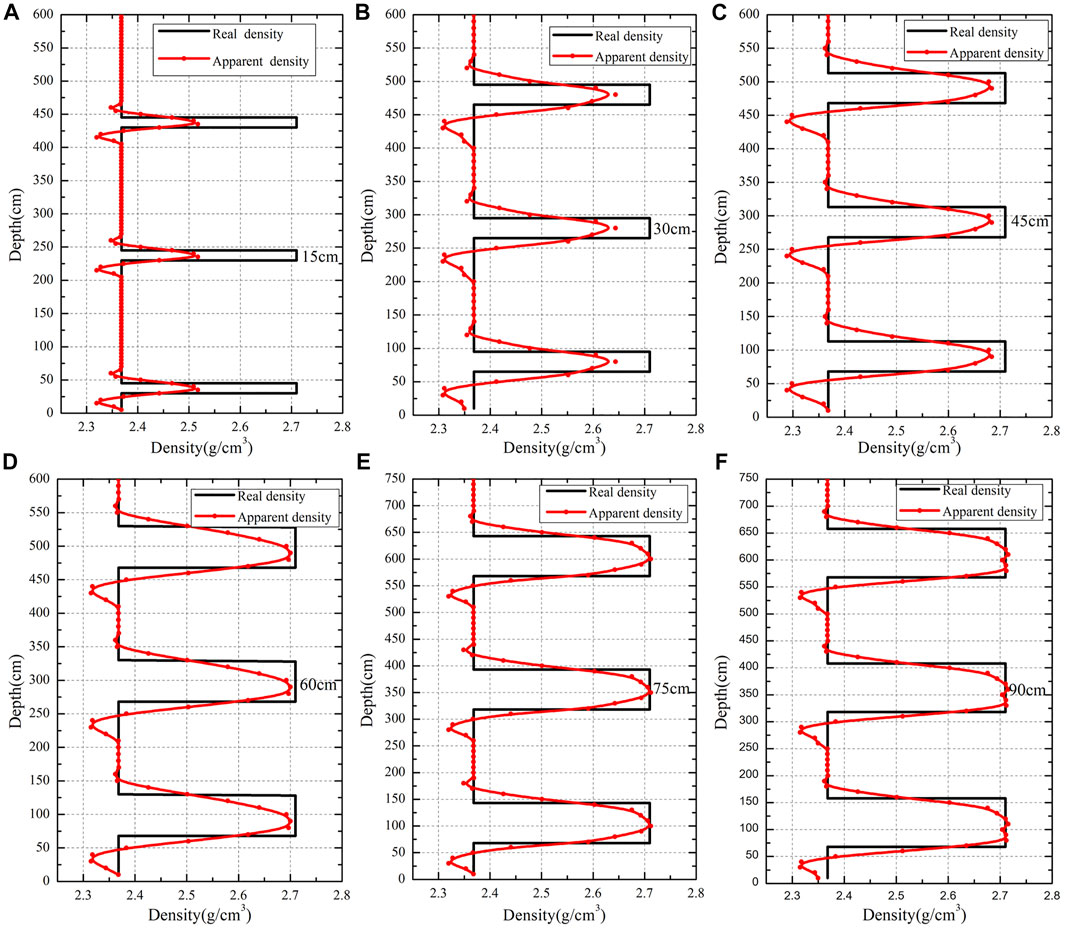
FIGURE 11. Vertical resolution of the neutron-gamma density tool in a vertical well. The background formation is a 20 P.U. limestone formation filled with freshwater, and the measured layer is a 0 P.U. limestone formation (A) thickness of the thin layers is 15 cm; (B) thickness of the thin layers is 30 cm; (C) The thickness of the thin layers is 45 cm; (D) thickness of the thin layers is 60 cm; (E) thickness of the thin layers is 75 cm; (F) thickness of the thin layers is 90 cm.
Depth of Investigation
A common definition quantifies the depth of investigation (DOI) as the radius corresponding to 90% of the radial geometric function. The DOI of the conventional gamma logging tool is approximately 9.7 cm (Ellis and Singer, 2007). The radial geometric functions of the neutron-gamma density for various formations are shown in Figure 12. The DOI of the neutron-gamma density tool is approximately 17 cm, which is twice that of the conventional gamma density logging tool, and it is less sensitive to formation properties compared with the conventional gamma density logging tool. The reason is that neutron-gamma density measurement relies on the effects of neutron transport and gamma ray transport that result in increased gamma ray penetration.
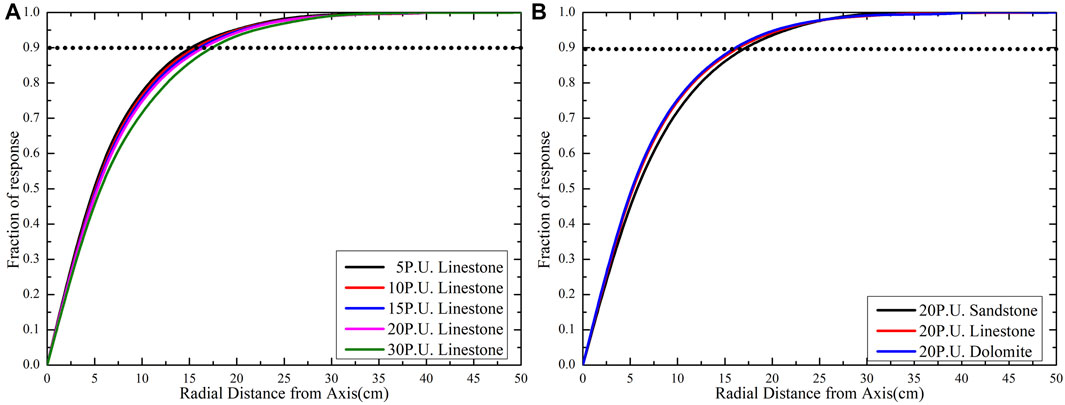
FIGURE 12. Radial geometric factor for the far gamma ray detector: (A) radial geometric factor for the formation with varying porosity; (B) radial geometric factor for the formation with varying lithology.
Results and Applications
Unlike conventional gamma density logging tools, the gamma-ray detectors of the neutron-gamma density logging tool are not wrapped by the shield. The measured apparent density is a weighted average of the densities of the formation and borehole fluid. Therefore, various borehole conditions, such as borehole diameter, standoff, and the type and weight of borehole fluid, affect the neutron-gamma density measurement. All of these factors may affect the comparison between the conventional gamma density logging tools and the neutron-gamma density logging tool. If a large difference can be explained according to an evident environmental effect, the difference can be tolerated. Of course, the measurement specifications of the tool (such as the depth of investigation and vertical resolution) may also cause differences in the measurement.
The pulsed neutron-gamma density experimental tool has been tested in several wells in the field. The comparison between the data sets from neutron-gamma density logging and those from conventional gamma density measurements can reveal the differences and the limitations of both the bulk density measurement techniques. The field test showed a high consistency the between neutron-gamma density measurements and conventional gamma density measurements.
Field Example 1
A shaly sand example at the bottom of a well is shown in Figure 13. This well was drilled with water-based mud with a density of 1.60 g/cm3. Track 1 includes the GR and caliper curves. The size of the borehole is close to that of the drill bit, which is 22.5 cm. Track 3 compares the neutron porosity (CNC, blue), neutron-gamma density (DEN, red), and conventional gamma density (ZDEN, black). Track 4 shows the conventional gamma density correction. Tracks 5, 6, and 7 show the contents of various elements in the formation. Conventional gamma density measurements and neutron-gamma density measurements are highly consistent. The logs from the sand shaly interval at the depth of 113–1140 m provide an opportunity for comparing the characteristics of vertical resolution of both the conventional gamma density measurements and pulsed neutron-gamma density measurements. The aforementioned phenomenon is reflected in the conventional gamma density measurements with an axial resolution of 40 cm. The neutron-gamma density logging tool with an axial resolution of 75 cm is less sensitive than thin beds.
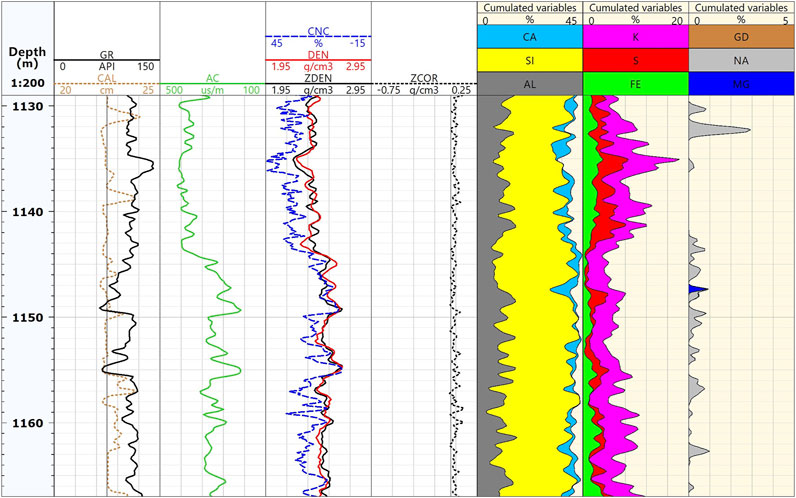
FIGURE 13. Density comparison in a sand-shaly layer. The neutron-gamma density measurements (track 3, red) and conventional gamma density measurements (black) are highly consistent. The data above are clearly separated from thermal neutron porosity data (blue) in the sand-shaly formation.
Field Example 2
Figure 14 shows the well logs of a vertical well drilled with 1.33 g/cm3 water-based mud. Track 1 includes the GR and caliper curves. The size of the borehole is close to that of the drill bit, which is 9 in. Track 3 compares the neutron porosity (CNC, blue), neutron-gamma density (DEN, red), and conventional gamma density (ZDEN, black). Track 4 shows the conventional gamma density correction. Tracks 5, 6, and 7 show the contents of various elements in the formation. The log curves and scales are similar to those shown in Figure 13. Similar to the previous well, the two types of measurements in the shaly-sand interval between 2,370 and 2,390 m are highly consistent.
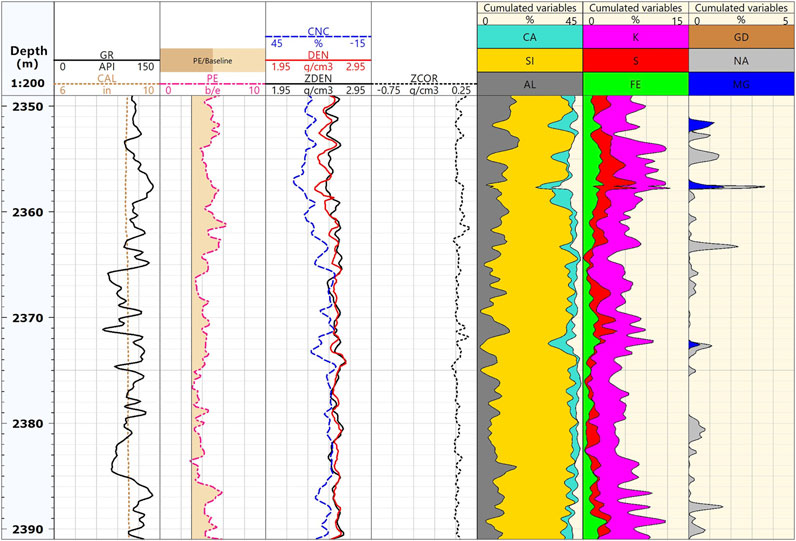
FIGURE 14. Density comparison in a sand-shaly interval. The neutron-gamma density measurements (track 3, red) and conventional gamma density measurements (black) are highly consistent.
Field Example 3
The log example in a tight carbonate formation is shown in Figure 15. This well was drilled with 1.21 g/cm3 water-based mud. Track 1 includes the GR and caliper curves. The size of the borehole is close to that of the drill bit, which is 23 cm. Track 3 compares the neutron porosity (CNC, blue), neutron-gamma density (DEN, red), and conventional gamma density (ZDEN, black). Tracks 5, 6, and 7 show the contents of various elements in the formation. The neutron-gamma density measurements are highly consistent with the conventional gamma density measurements.
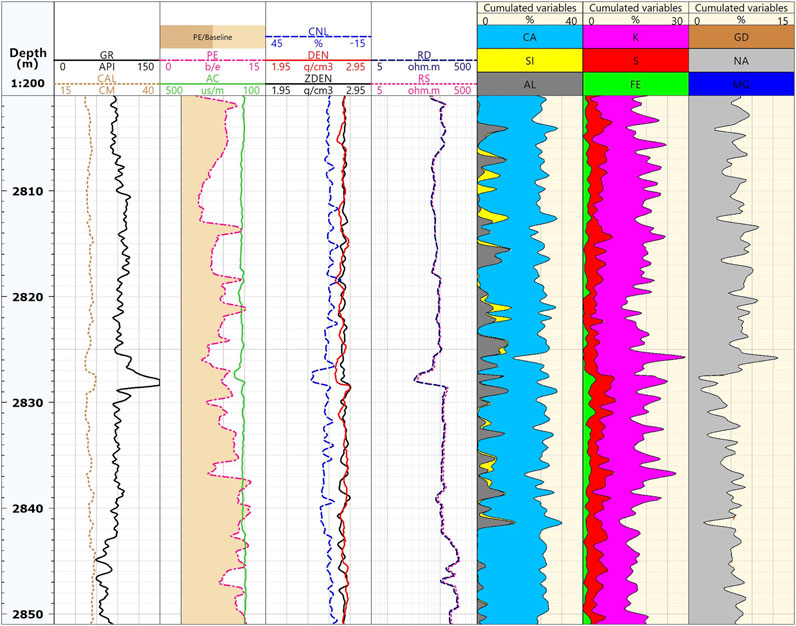
FIGURE 15. Density comparison in a tight carbonate zone. The neutron-gamma density measurements (track 3, red) and conventional gamma density measurements (black) are highly consistent.
Conclusion
In this article, a novel density estimation algorithm for neutron-gamma density logging is derived from the diffusion equation and the gamma ray attenuation law. Two neutron detectors are used to evaluate the effects of neutron transport. Two gamma ray energy windows are used in the gamma ray detectors to reduce the effect of pair production in the gamma ray transport process. The simulation results indicate that the corrected gamma ray count rate conforms to the gamma ray attenuation law and does not require corrections based on information from other well logs.
The accuracy of neutron-gamma density measurement using the newly developed density estimation algorithm can reach ±0.025 g/cm3, and it is independent of mineralogy, formation porosity, and pore fluid, especially in shale and sand-shaly formations and in gas-filled formations. NGD measurement can provide accurate density estimation. The density of the measured formation should be within the range of 1.95–2.90 g/cm3. Meanwhile, to increase the contribution of gamma transport, the far gamma ray detector is positioned far from the pulsed neutron source, which results in a poorer vertical resolution and a greater depth of investigation.
Significant progresses have been made in controllable source formation evaluation with PNG-based neutron-gamma density measurements. The application of this new density measurement method will provide the possibility of replacing conventional gamma density measurement.
Data Availability Statement
The raw data supporting the conclusions of this article will be made available by the authors, without undue reservation.
Author Contributions
The main research idea was contributed by JT and HW. The manuscript preparation and experiments parts were complicated by HW, AY, XZ, XH, XL, and BH.
Conflict of Interest
Authors HW, AY, XZ, XH, XL, and BH were employed by the China National Logging Corporation.
The remaining author declares that the research was conducted in the absence of any commercial or financial relationships that could be construed as a potential conflict of interest.
Publisher’s Note
All claims expressed in this article are solely those of the authors and do not necessarily represent those of their affiliated organizations, or those of the publisher, the editors, and the reviewers. Any product that may be evaluated in this article, or claim that may be made by its manufacturer, is not guaranteed or endorsed by the publisher.
Acknowledgments
The authors would like to express their gratitude for the assistance from the scientific research and technology development project of China National Petroleum Corporation (No. 2021DJ3801).
Supplementary Material
The Supplementary Material for this article can be found online at: https://www.frontiersin.org/articles/10.3389/feart.2022.803775/full#supplementary-material
References
Baumann, G., and Henninges, J. (2012). Sensitivity Study of Pulsed Neutron-Gamma Saturation Monitoring at the Altmark Site in the Context of CO2 Storage. Environ. Earth Sci. 67, 463–471. doi:10.1007/s12665-012-1708-x
Becker, A. J., Boyce, J. R., Corris, G. W., King, G., and Bramblett, R. L. (1987). Detection of Scattered X-Rays from an Electron Linac in a Borehole. Nucl. Instr. Methods Phys. Res. Section B: Beam Interactions Mater. Atoms 24-25, 995–998. doi:10.1016/S0168-583X(87)80296-3
Berger, M. J., Hubbell, J. H., Seltzer, S. M., Chang, J., Coursey, J. S., Sukumar, R., et al. (2010). XCOM: Photon Cross Sections Database, (Version1.5), Report NBSIR 87-3597. Gaithersburg, Maryland: U.S. National Institute of Standards and Technology. Available at: : https://www.osti.gov/biblio/6016002.
Ellis, D. V., and Singer, J. M. (2007). Well Logging for Earth Scientists. 2nd ed. Dordrecht: Springer Science & Business Media.
Evans, M., Allioli, F., Cretoiu, V., Haranger, F., Laporte, N., Mauborgne, M.-L., et al. (2012). “Sourceless Neutron-Gamma Density (SNGD): A Radioisotope-free Bulk Density Measurement: Physics Principles, Environmental Effects, and Applications,” in SPE Annual Technical Conference and Exhibition, Cartagene, Colombia, June 16–20, 2012. doi:10.2118/159334-MS
Jacobson, L., Durbin, D., and Reed, S. (2004). “An Improved Formation Density Measurement Using PNC Tools,” in Annual Technical Conference and Exhibition (Houston: Society of Petroleum Engineers), 1–9. doi:10.2118/90708-MS
King, G., Becker, A. J., Corris, G. W., Boyce, J. R., and Bramblett, R. L. (1987). Density Logging Using an Electron Linear Accelerator as the X-ray Source. Nucl. Instr. Methods Phys. Res. Section B: Beam Interactions Mater. Atoms 24-25, 990–994. doi:10.1016/S0168-583X(87)80295-1
Luycx, M., and Torres-Verdín, C. (2019). Physics, Applications, and Limitations of Borehole Neutron-Gamma Density Measurements. Geophysics 84 (1), D39–D56. doi:10.1190/geo2018-0088.1
Odom, R. C., Bailey, S. M., Wilson, R. D., and Archer, M. P. (1999). “Pulsed Neutron Density Measurements: Modeling the Depth of Investigation and Cased-Hole Wellbore Uncertainties,” in SPWLA 40th Annual Logging Symposium, Oslo, Norway, May 30–June 3, 1999. Available at: https://onepetro.org/SPWLAALS/ proceedings /SPWLA-1999/All-SPWLA-1999/SPWLA-1999-JJ/19772.
Odom, R. C., Hogan, G. P., Rogers, C. B., Smith, R. L., and Sirgio, M. A., 1998, Cased-hole Lithology and Density Measurements. Presented at the SPWLA 39th Annual Logging Symposium, Denver, United States, May 26–29, 1998, Available at: https://onepetro.org/SPWLAALS/proceedings/SPWLA-1998/All-SPWLA1998/SPWLA-1998-ZZ/19732.
Odom, R. C., Hogan, G. P., Crosby, B. W., and Archer, M. P. (1997). Applications and Derivation of a New Cased-Hole Density Porosity in Shaly Sands. Annual Technical Conference and Exhibition, San Antonio, TX, October 5–8, 1997 (Society of Petroleum Engineers), 1–13. doi:10.2118/38699-MS
Odom, R. C., Tiller, D. E., and Wilson, R. D. (2001). “Improvements in a Through-Casing Pulsed-Neutron Density Log,” in Annual Technical Conference and Exhibition (New Orleans: Society of Petroleum Engineers), 1–9. doi:10.2118/71742-MS
Reichel, N., Evans, M., Allioli, F., Mauborgne, M. L., Nicoletti, L., Haranger, F., et al. (2012). “Neutron-Gamma Density (NGD): Principles, Field Test Results and Log Quality Control of a Radioisotope-free Bulk Density Measurement,” in SPWLA 53rd Annual Logging Symposium, Cartagene, Colombia, June 16–20, 2012. Available at: https://onepetro.org/SPWLAALS/proceedings/SPWLA12/All-SPWLA12/SPWLA-2012-082/28188.
Roberts, L. P. (2011). Apparatus and Methods for Measuring Formations Bulk Density. U.S. Patent 2011/0191030 A1.
Simon, M., Tkabladze, A., Beekman, S., Atobatele, T., De Looz, M.-A., Grover, R., et al. (2018). “A Revolutionary X-ray Tool for True Sourceless Density Logging with superior Performance,” in SPWLA 59th Annual Logging Symposium, London, UK, June 2–6, 2018. Available at: https://onepetro.org/SPWLAALS/proceedings/SPWLA18/3-SPWLA18/D033S002R001/28779.
Streeter, R. W., Hogan, G. P., Rogers, C. B., Odom, R. C., and Barrett, D. G. (1996). Cased Hole Exploration: Modern Pulsed Neutron Techniques for Locating By-Passed Hydrocarbons in Old Wells. Permian Basin Oil & Gas Recovery Conference, Midland, TX, March 27–29, 1996 (Society of Petroleum Engineers), 1–9. doi:10.2118/35162-MS
Wang, H., Wu, W., Tang, T., Wang, R., Yue, A., Wang, S., et al. (2020). A New Method for Calculating Bulk Density in Pulsed Neutron-Gamma Density Logging. Geophysics 85 (6), D219–D232. doi:10.1190/geo2018-0821.1
Wang, H., Wu, W., Wang, R., and Ge, Y. (2019). Neutron Transport Correction and Density Calculation in the Neutron-Gamma Density Logging. Appl. Radiat. Isot. 150, 110–119. doi:10.1016/j.apradiso.2019.05.023
Wilson, R. D. (1995). Bulk Density Logging with High-Energy Gammas Produced by Fast Neutron Reactions with Formation Oxygen Atoms. 1995 IEEE Nuclear Science Symposium and Medical imaging Conference, Francisco, CA, United States, October 21–28, 1995. doi:10.1109/NSSMIC.1995.504211
Yu, H., Sun, J., Wang, J., and Gardner, R. P. (2011). Accuracy and Borehole Influences in Pulsed Neutron Gamma Density Logging while Drilling. Appl. Radiat. Isot. 69, 1313–1317. doi:10.1016/j.apradiso.2011.04.023
Zhang, Q., Zhang, F., and Liu, J. (2017). A Method of Determining Formation Density Based on Fast-Neutron Gamma Coupled Field Theory. Petrophysics 58 (4), 411–425. Available at: https://onepetro.org/petrophysics/article/58/04/411/171400/A-Method-of-Determining-Formation-Density-Based-on.
Nomenclature
Cs-137 cesium-137
HSE health, safety, and environment
LaBr3 lanthanum bromide
LWD logging-while-drilling
MCNP Monte Carlo N-particle code
PNG pulsed neutron generator
P.U. porosity unit
a1,a2,a3,a4,a5,a6, and a7 fitting coefficients
b1, b2, b3, b4, b5, b6, and b7 fitting coefficients
A, B, C, and D undetermined coefficients
Dn diffusion coefficient of neutrons (cm)
Dγ diffusion coefficient of gamma-rays (cm)
f,f’ logarithmic functions of the ratio of epithermal neutron count rates
g,g’ logarithmic functions of the ratio of epithermal neutron count rates
i average number of gamma photons in every inelastic collision
Ln neutron slowing-down length (cm)
Lγ gamma-ray attenuation length (cm)
N atomic density
Q intensity of the pulsed neutron source (particles/cm)
Rn ratio of the epithermal neutron count rates of the near and far detectors
Rγ ratio of the inelastic gamma ray count rates of the near and far detectors
Rγ1 ratio of the low-energy gamma ray count rates of the near and far detectors
Rγ2 ratio of the high-energy gamma ray count rates of the near and far detectors
r distance between the spatial gamma-ray detection point and the pulsed neutron source (cm)
r1 near detector-source spacing(cm)
r2 far detector-source spacing (cm)
Sγ inelastic gamma-ray production
U′ parameter related to r and ϕγ
▽2 Laplace operator
ϕn fast neutron flux (particles/cm2)
ϕγ gamma-ray flux (particles/cm2)
ρb bulk density (g/cm3)
σin microscopic neutron inelastic scattering cross section (cm2)
Σin macroscopic neutron inelastic scattering cross section (cm−1)
Σn macroscopic scattering cross section of neutrons (cm−1)
Σγ macroscopic scattering cross section of gamma ray (cm−1)
Keywords: neutron-gamma density, bulk density, neutron transport, pair production, Monte Carlo simulation
Citation: Wang H, Yue A, Zhang X, Tang J, He X, Luo X and Han B (2022) Bulk Density Response and Experimental Study of Pulsed Neutron-Gamma Density Logging. Front. Earth Sci. 10:803775. doi: 10.3389/feart.2022.803775
Received: 28 October 2021; Accepted: 31 January 2022;
Published: 20 May 2022.
Edited by:
Mourad Bezzeghoud, Universidade de Évora, PortugalReviewed by:
William Preeg, Schlumberger Doll Research, United StatesSheldon Landsberger, University of Texas at Austin, United States
Emerson M. Boldo, Universidade Estadual do Oeste do Paraná, Brazil
Copyright © 2022 Wang, Yue, Zhang, Tang, He, Luo and Han. This is an open-access article distributed under the terms of the Creative Commons Attribution License (CC BY). The use, distribution or reproduction in other forums is permitted, provided the original author(s) and the copyright owner(s) are credited and that the original publication in this journal is cited, in accordance with accepted academic practice. No use, distribution or reproduction is permitted which does not comply with these terms.
*Correspondence: Jizhou Tang, amVyZW15dGFuZ0B0b25namkuZWR1LmNu