
94% of researchers rate our articles as excellent or good
Learn more about the work of our research integrity team to safeguard the quality of each article we publish.
Find out more
ORIGINAL RESEARCH article
Front. Earth Sci., 05 August 2022
Sec. Cryospheric Sciences
Volume 10 - 2022 | https://doi.org/10.3389/feart.2022.799613
El Niño Southern Oscillation (ENSO), Interdecadal Pacific Oscillations (IPO), and their phase relation with the Southern Annular Mode (SAM) largely control Antarctic climate variability. The relative roles of these climate modes remain elusive, particularly in the backdrop of global warming. In this study, we present a seasonally resolved new ice core (IND33) record of oxygen isotope (δ18O) for the past two centuries (1809–2013 CE) from coastal Dronning Maud Land (DML) to investigate the role of these climate modes in the Antarctic temperature variability and trend. Our investigation based on this record combined with available records from the DML region reveals that ∼32% variability in δ18O records is related to late spring to summer (Nov–Dec–Jan) temperature rather than the mean annual temperature. This indicates that reconstructed annual temperature based on Antarctic ice core δ18O records could be biased toward the temperature of the months/seasons of higher precipitation with low-moderate wind speed, which are suitable for better preservation of the ice core signal. We have reconstructed the DML temperature record of the past two centuries (1809–2019 CE) at an annual resolution based on the δ18O ice core record (1809–1993 CE) combined with the recent ERA5 surface air temperature record (1994–2019 CE). The reconstructed temperature anomaly record reveals a significant cooling trend in the 19th century during 1809–1907 CE with a rate of −0.164 ± 0.045°C decade−1 followed by a warming trend from the mid-20th to early 21st centuries (1942–2019 CE) with a rate of +0.452 ± 0.056°C decade−1. This long-term warming trend since the 1940s coincides with the increase in ENSO events and its strong antiphase relation with SAM, suggesting an increasing influence of SAM–ENSO coupling in modulating the DML temperature in recent decades.
The Antarctic ice sheet is an important natural archive of past climate records. The ice cores retrieved from different regions of Antarctica can be classified as low-resolution (decadal to centennial-scale over low accumulation regions), long-term records (Dansgaard et al., 1993; Petit et al., 1999; EPICA community members, 2004; Stenni et al., 2004; Jouzel et al., 2007) and high-resolution (seasonally to annually resolved over high accumulation regions), short-term records (Divine et al., 2009; Schneider et al., 2017; Thamban et al., 2020; Nardin et al., 2021). In recent years, studies have highlighted the importance of high-resolution ice core-based temperature records to improve climate models and better projections for future climate (PAGES 2k Consortium, 2013; Stenni et al., 2017). The high-resolution satellite-based temperature record of Antarctica has been available only since the beginning of 1979, and few station-based instrumental records have been available since ∼1950 (Turner et al., 2020), which are too short to discern the long-term temperature trends. Based on a compilation of multiple (n = 112) ice core water isotope records from Antarctica, Stenni et al. (2017) have reconstructed the surface air temperature of Antarctica for the past two millennia. However, only a few long-term ice core records with annual or better resolution were available from the DML region for their compilation, and hence, such temperature reconstruction for this region might have large uncertainty. Coastal Antarctica comprises regions of higher precipitation and accumulation (Naik et al., 2010; Thomas et al., 2017; Turner et al., 2019), which are ideal sites for the reconstruction of high-resolution climate records to resolve subannual to decadal climate variability related to temperature, precipitation, sea ice, dust, and solar cycles (Abram et al., 2007; Masson-Delmotte et al., 2008; Laluraj et al., 2010; Mulvaney et al., 2012; Laluraj et al., 2014; Rahaman et al., 2016; Rahaman et al., 2019). Therefore, to reduce the uncertainty of the temperature reconstructions and improve our current knowledge of the long-term temperature variability, changes, and controlling factors, more stable water isotope records are needed from this region.
The oxygen isotope ratios (δ18O) in ice core records have been widely used to reconstruct past temperatures (Picciotto et al., 1960; Dansgaard et al., 1969) and to infer the changes in moisture sources for precipitation (Noone and Simmonds, 2002). Several studies have demonstrated that the δ18O proxy records show a profound influence of large-scale atmospheric circulation patterns around Antarctica on interannual to decadal and multidecadal scales (Okumura et al., 2012; Goodwin et al., 2016; Yuan et al., 2018). Anomalous changes in sea surface temperature over the tropical Pacific associated with the El Niño Southern Oscillation (ENSO) and decadal to Interdecadal Pacific Oscillations (IPO) significantly contribute to Antarctic temperature (Goodwin et al., 2016; Rahaman et al., 2019). In spite of their distant origin in the equatorial Pacific, the ENSO strongly influences the southern extratropical and Antarctic climate via atmospheric teleconnections generated by Rossby wave trains (Turner, 2004; Jin and Kirtman, 2009; Ding et al., 2011). Furthermore, Southern Annular Mode (SAM) has been demonstrated as the most dominant mode of climate variability in the Southern Hemisphere (Marshall, 2003); the positive phase of SAM is associated with low-pressure anomalies over Antarctica and high-pressure anomalies over midlatitudes and vice versa (Thompson and Wallace, 2000; Marshall, 2003; Turner et al., 2005; Marshall et al., 2006; Abram et al., 2014). The SAM generally shows a dipole response to the East Antarctic and Antarctic Peninsula temperature; a strong correlation between temperature and SAM is observed across the Antarctic Peninsula during the positive SAM and the opposite is found in East Antarctica (Kwok and Comiso, 2002; Thompson and Solomon, 2002; Van Den Broeke and Lipzig, 2003; Schneider et al., 2004; Marshall, 2007). Therefore, the shifting of SAM to a positive phase in the last several decades is expected to contribute to cooling across East Antarctica. However, studies from the Dronning Maud Land (DML) region of East Antarctica do not show any significant trends during the period before 1900 CE; by contrast, a significant warming trend is observed in the last century (Stenni et al., 2017). It is, therefore, necessary to obtain more spatially distributed long-term proxy records from the DML region to investigate the processes and factors that controlled the temperature variability and its trend in this part of Antarctica. Furthermore, such studies will help to improve our present understanding of the influence of climatic modes and Pacific oscillations on the Antarctic temperature variability in response to the recent global warming.
This study aims to extract temperature signals from multiple ice core δ18O records and reconstruct past temperature records of the past two centuries using a newly retrieved high-resolution ice core record along with other available δ18O records from the DML region. Such spatially distributed high-resolution records from the DML region have enabled us to assess the interannual to decadal variability in temperature during the past two centuries and investigate factors contributing to these changes.
In the present study, we have used a new coastal ice core record (IND-33/B8; hereafter IND33, 101.4 m long) retrieved using an electromechanical drill during 2013–14 from the central DML region (location: 71° 30′ 36″ S and 10° 09′ 36″; elevation: 1,470 m) as shown in (Figure 1). To check the suitability of the drilling site, a systematic ground penetrating radar survey was carried out over the region, which revealed an undisturbed ice stratigraphy. Ice cores were sealed in high-density polyethylene core bags, packed in expanded polypropylene boxes, and kept at −20°C until they arrived at the National Centre for Polar and Ocean Research in Goa, India, stored at the Ice Core Laboratory at −20°C. The ice cores were processed inside the sample processing room maintained at −15°C. Prior to subsampling, the ice cores were cleaned properly using ceramic knives and prewashed microtome blades. The ice core was subsampled at 5 cm resolution for various chemical and stable isotopic analyses to reconstruct climate records at seasonal resolution.
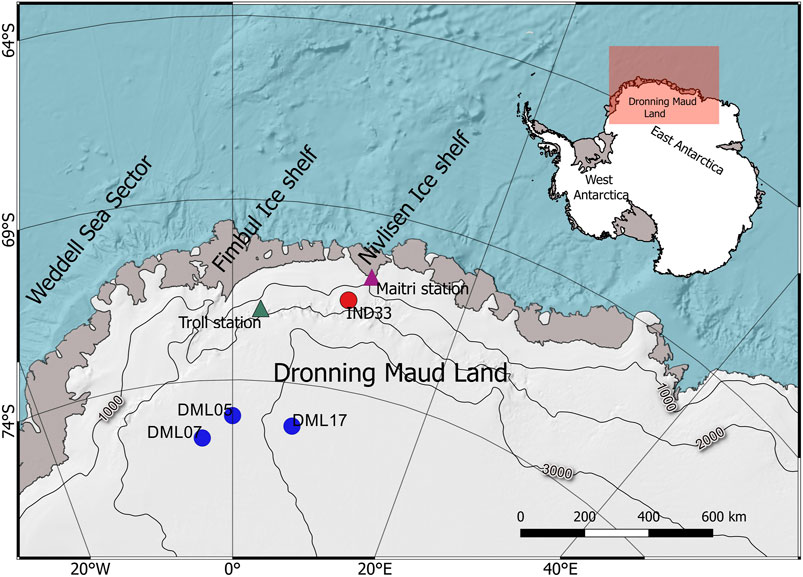
FIGURE 1. Location map of Dronning Maud Land (DML), East Antarctica, showing the ice core sites. The filled red circle represents the location of the IND33 ice core, whereas blue circles denote the published ice core records of DML07, DML05, and DML17 (Graf et al., 2002) used in this study. Contour lines represent the elevation (in meters) of the study region.
The stable isotopic ratios of melted ice core samples were measured using an “Isoprime” isotope ratio mass spectrometer (GV Instruments, United Kingdom). The analytical details are already discussed elsewhere (Ejaz et al., 2021). Both major ions (Na+ and Cl−) and δ18O ice core records were used to establish a robust and reliable chronology. A first-order chronology was established using manual counting of summer maxima in δ18O values, which was further improved by the tuning of the seasonal signal
In order to have a regional perspective on the temperature variability, in addition to the IND33 core, we have used three ice core δ18O records from the DML region (DMDL05, DML07, and DML17); (Graf et al., 2002) (Figure 1). These cores are situated 190–550 km away from the coast at elevations varying from 1,470 to 3,160 m; thereby, representing a broad range of topographic and snow accumulation patterns under a similar climatic regime (Table 1). The selected ice cores have accumulation rates varying from 46–62 kg m−2a−1 (DML ice cores) to 288 kg m−2 a−1 (IND33 ice core) (Table 1). Earlier studies have suggested that ice cores having accumulation rates above 40 kg m−2 a−1 would represent seasonal cyclicity at shallow depths (Landais et al., 2017). This suggests that annual signals can be extracted from ice cores selected for the present study.
In this study, ERA5 reanalysis of surface air temperature data available from 1979 at a resolution of 0.5° × 0.5° latitude-longitude was used to investigate the role of temperature in controlling δ18O variability in these ice core records and to reconstruct the temperature beyond 1979 as discussed in Section 3.1 (Hersbach et al., 2020). To examine the ENSO influences, we have used long-term Southern Oscillation Index (SOI) data available from NOAA (https://www.ncdc.noaa.gov/teleconnections/enso/indicators/soi/) (Ropelewski and Jones, 1987).
We also employ a long-term IPO index available online (https://psl.noaa.gov/data/timeseries/IPOTPI/tpi.timeseries.ersstv5.data) (Henley et al., 2015). The Marshall SAM index (Marshall, 2003) is combined here with the reanalysis 20CRV2c SAM index (Gong and Wang, 1999) to have a longer SAM record comparable to our target time window (1809–2019 CE). The DML05, DML07, and DML17 ice core data used in this study are available at the PAGES 2k (http://pastglobalchanges.org/science/wg/2k-network/data) repository.
The temporal variations of δ18O in the IND33 ice core are shown in (Figure 2A). This new ice core from the coastal DML region offers a high-resolution (seasonal–annual scale) record of δ18O; higher values are observed in summer and lower values in winter. The δ18O values of the IND33 ice core range from 27.6‰ to 32.70‰ with a mean value of 30.47 ± 0.89‰. In order to have a better understanding of regional climate variability on a longer time scale, we have selected three ice core records (DML05, DML07, and DML17) from the inland region of DML which are in close proximity to the IND33 record (Figure 1). The annual δ18O variability in DML ice cores is shown in (Figures 2B–D). Although these ice cores show large variability, they do not show a discernible common trend. The three inland ice cores from DML are close to each other within a few 100-km distances and show mean δ18O values ranging from −45‰ to −46.7‰ (Graf et al., 2002). The ice cores in this study were selected based on the following criteria: 1) ice core records should have a common time interval of at least past two centuries with a time resolution of at least annual or better, 2) the top part of the record should have a reasonable number of overlapping years with the available instrumental/reanalysis data for calibration with confidence, and 3) the region from where the cores were selected should come under the significant influence of ENSO and SAM.
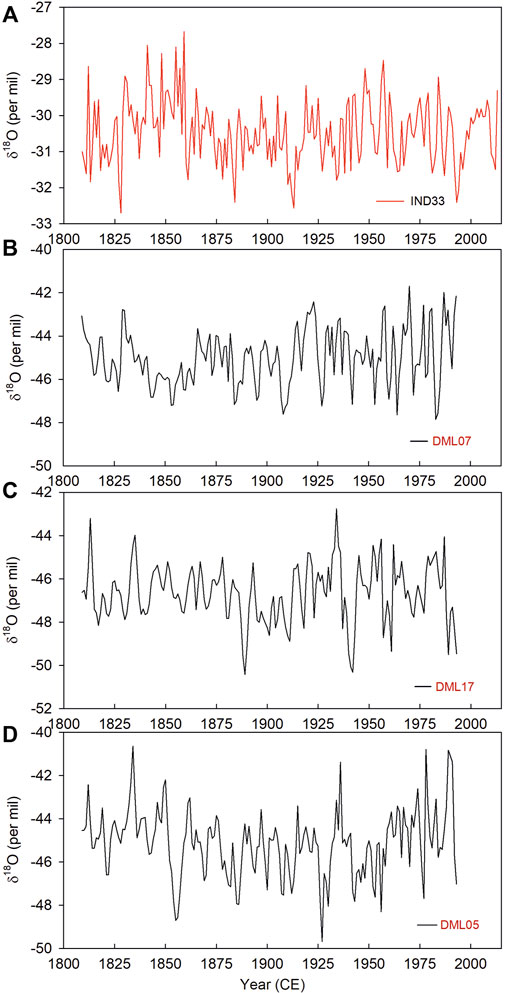
FIGURE 2. (A) IND33 ice core δ18O record (1809–2013 CE) is compared with the DML ice core records (B) DML07, (C) DML17, and (D) DML05 of their common time interval (1809–2013 CE).
Several studies have demonstrated that δ18O records in ice cores are influenced by several factors such as temperature (Petit et al., 1999; Stenni et al., 2017), sea ice variability (Ejaz et al., 2021), precipitation (Fujita and Abe, 2006), and postdepositional changes related to exchange of water vapor between surface snow and atmosphere through diffusion (Landais et al., 2017). As a result, the δ18O records represent a composite signal of various meteorological parameters and/or postdepositional processes and hence cannot be directly used to decipher climate variability. A previous study from this region has observed that the selected δ18O ice core records are only weakly correlated with ERA5 annual surface air temperature (Ejaz et al., 2021). Therefore, principal component analysis (PCA) was performed on these four δ18O records within their common time window (Supplementary Table S2) to deconvolute different climate signals embedded in the δ18O records and finally to extract a common temperature signal, which is representative of a large region of DML.
Temperature is the dominant factor among the meteorological parameters that explain maximum variability in δ18O ice core records from Antarctica (Masson-Delmotte et al., 2008; Rahaman et al., 2019). The first component (PC1), derived from PCA explains maximum variability (∼32%) whereas the second principal component PC2 explains ∼27% variability of the δ18O record (Supplementary Table S3). The other principal components such as PC3 and PC4 are not significant (eigenvalues <1), and therefore, they were not considered for further investigation. In a previous study, Ejaz et al. (2021) demonstrated that PC2 derived from PCA of these records is strongly related to annual sea ice variations in the western Indian Ocean sector of Antarctica. Based on the linear relationship, they have reconstructed past sea ice variability and trend in the western Indian ocean sector of Antarctica during the past two centuries. In this study, we have carried out a more rigorous investigation based on Pearson correlation analysis between PC1 and annual/seasonal surface air temperature shown in Supplementary Figure S1. We have observed that PC1 is weakly related to ERA5 annual surface air temperature averaged across the grid box over the DML region (71.5°S to 75.5°S; 11.0°E to 5°W), from 1979 to 1993 CE (r = 0.33, p > 0.05) (Figure S1 A). Correlation between PC1 and temperature is not found to be significant during summer (DJF) and autumn (MAM) (Figure S1 B, C). However, the ERA5 surface air temperature shows a strong correlation with PC1 (r = 0.73, p < 0.05, lag = 1 year) during the late spring to summer (NDJ) season for the period 1979–1993 CE (Figure S1 F). It is interesting to note that such a strong temperature correlation is not observed during winter (JJA) and spring (SON) seasons (Figure S1 D), possibly because of strong cyclonic activity and blowing wind (Figure S2 B) causing reworking and redistribution of accumulated snow (Mott et al., 2018; Mills et al., 2019). It is clearly shown in our ERA5 seasonal temperature PC1 correlation analysis that significant correlation is mainly observed during the season of reduced surface wind speed, whereas insignificant correlation is observed during the season of high surface wind speed (winter), because of strong reworking of freshly deposited snow in cyclonic activity. The maximum correlation is observed during the late spring to summer (NDJ) when accumulation was reasonably higher (Figure S2 A) and wind speed was lower to moderate (Figure S2 B) and thereby, suitable for better preservation of climate signals in the deposited snow/ice sheet. Furthermore, we have used the spatial correlation between PC1 and surface air temperature during the NDJ season (Figure 3A). The spatial correlation is found to be significant over the DML region during 1979–1993 CE (Figure 3A). Therefore, for the reconstruction of the DML temperature, we have used the regression equation derived from the correlation between the PC1 and NDJ temperature anomaly.
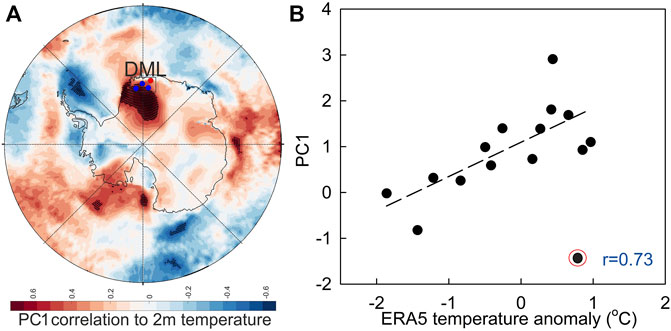
FIGURE 3. (A) Principal component 1 (PC1) was regressed with seasonal (Nov–Dec–Jan) ERA5 surface air temperature record for the period of 1979–1993 CE. Stippling indicates statistically significant correlations (95% confidence level). (B) PC1 shows a significant correlation with seasonal (Nov–Dec–Jan) ERA5 2m temperature anomaly averaged over the DML region (71.5°S to 75.5°S; 11.0°E to 5°W) (r = 0.73, p < 0.05, 1979–1993 CE, lag = ∼1 year).
We have reconstructed the temperature anomaly record (1809–1993 CE) of the DML region using the linear regression equation derived from PC1 and the ERA5 NDJ temperature correlation (Figure 3B). Furthermore, to determine the recent trend in the temperature record, we have combined the ERA5 surface air temperature anomaly for the DML region (1994–2019 CE) with our reconstructed ice core temperature anomaly record. The combined record of reconstructed and reanalysis ERA5 temperature anomaly records for the past two centuries (1809–2019 CE) enable us to determine the long-term trend in the DML temperature anomaly (Figure 4) and the influence of climate modes on temperature variability. To discern the significant long-term trend, a Mann–Kendall test (Kendall, 1975) was conducted and determined the breaking points of the trends in the temperature record. Therefore, two significant trends have been identified in the DML temperature record (Figure 4). The reconstructed temperature record revealed a significant cooling trend during 1809–1907 CE (n = 98, p < 0.05) with a rate of −0.164 ± 0.045°C decade−1, followed by a significant warming trend with a rate of +0.452 ± 0.056°C decade−1 during 1942–2019 CE (n = 77, p < 0.05). A recent study has shown that during the past two decades (1998–2016 CE), a more rapid increase in the temperature (+1.1 ± 0.7°C decade−1) is observed in western DML (Medley et al., 2018). Our study is also consistent with such a rapid warming trend in recent decades. Therefore, it is important to identify the potential drivers and their role in controlling the DML temperature trends and variability in the past two centuries.
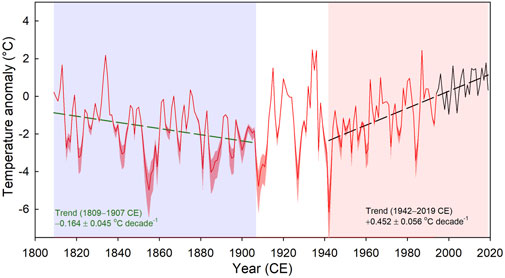
FIGURE 4. Trend analysis of the reconstructed surface air temperature anomaly record of the DML region, East Antarctica. The temperature anomaly was calculated based on the linear regression equation derived from the correlation between PC1 and ERA5 temperature anomaly (NDJ). The reconstructed mean annual surface air temperature anomaly demonstrates a significant (p < 0.05) declining trend during 1809–1907 CE and a significant (p < 0.05) increasing trend during 1942–2019 CE. The reconstructed temperature anomaly curve is shown in the red line (1807–1993 CE), whereas the black curve denotes the ERA5 2m temperature anomaly record for 1994–2019 CE. The red color shade represents the error envelope on the reconstructed temperature, and the dashed straight lines indicate trend lines.
Tropical Pacific oscillations such as ENSO, IPO, and their teleconnections to Antarctica in space and time, particularly in the recent time of global warming, are not well understood. To identify dominant periodicities associated with the climate modes and their temporal evolutions during the past two centuries, we first performed a spectral analysis (Schulz and Mudelsee, 2002) of the temperature anomaly record (Figure 5A) (1809–2019 CE). The spectral analysis revealed significant (95% χ2 level) periodicities of 5.2 and 15 years (Figure 5B). Furthermore, to understand the influence of ENSO and IPO on DML temperature during the past two centuries and their temporal evolution, we performed a continuous wavelet analysis of the temperature record (Figure 5C). We used the Morlet wavelet (Torrence and Compo, 1998) to analyze nonstationary climate signals in the temperature record, which enable us to identify significant (at 95% significance level) periodicities and their links to ENSO and IPO. This highlights the maximum power of lower frequencies in a decadal band (12–18 years) during 1830–1870 CE and 1910–1950 CE, whereas after the 1930s, high-frequency ENSO signals within the (2–8 years) band become more prominent. The variance at the ENSO band shows an increasing trend in the last century (Figure 5D), which is consistent with the earlier report from East Antarctica (Rahaman et al., 2019).
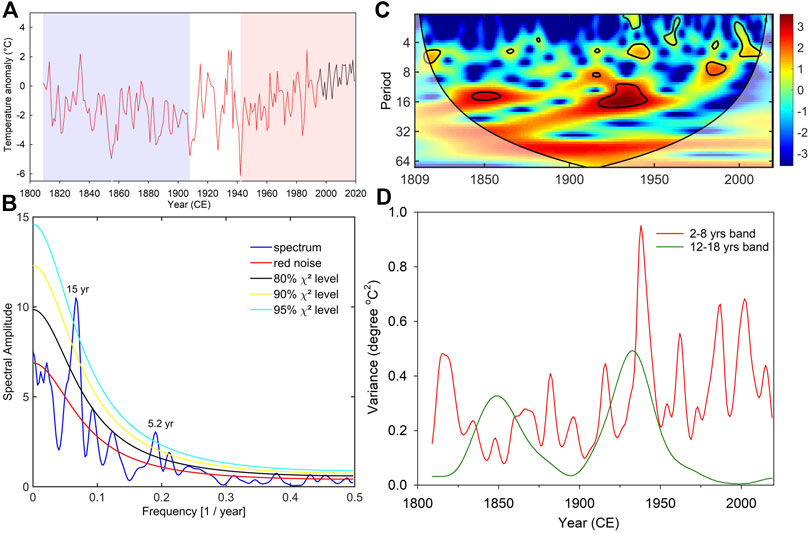
FIGURE 5. (A) Reconstructed temperature anomaly record combined with ERA5 surface air temperature anomaly records (1809–2019 CE). (B) Spectral analysis of temperature anomaly shows significant periodicities of 15 and 5.2 years (95% χ2 level). (C) Wavelet analysis of the temperature anomaly record highlights significant periodicities in the color band. (D) Scaled average variance analysis at two bands, namely, 2–8 years and 12–18 years frequency bands.
A cross-wavelet analysis (Grinsted et al., 2004) between the DML temperature anomaly record and SOI reveals the highest common power at the 2–8 years band (Figure 6A). This clearly shows a systematic increase from lower to higher frequencies at the ENSO band in the 20th century. This is consistent with the earlier reports of increasing ENSO activity and its influence on Antarctic temperature (Schmidt et al., 2012; Otto-Bliesner et al., 2016; Yeh et al., 2018; Rahaman et al., 2019). Cross-wavelet analysis between DML temperature and IPO shows a strong antiphase relation during 1920–1950 CE (Figure 6B). In order to deconvolute the signals of ENSO and IPO, bandpass filters were applied at 2–8 years and 12–18 years bands (Figures 6C,D). The bandpass filtered temperature record at 12–18 years band shows antiphase relation with that of IPO index throughout the record (except for 1890–1920 and 1960–1980 CE). This antiphase relation between temperature and IPO was found to be more prominent from 1920 to 1950.
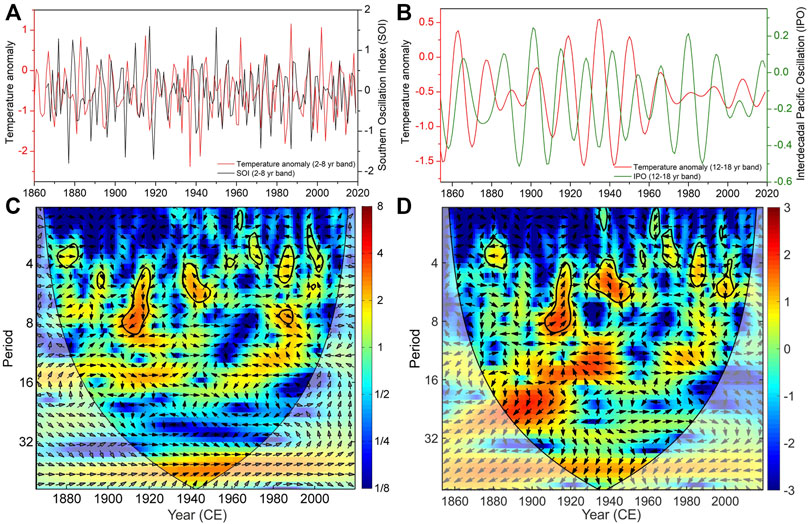
FIGURE 6. Annual variability in temperature anomaly record with (A) SOI (1866–2019 CE) (Ropelewski and Jones, 1987) and (B) IPO (1854–2019 CE) (Mantua and Hare, 2002). Cross-wavelet analysis of DML temperature anomaly with (C) SOI and (D) IPO. The thick black line depicts the cone of influence. The relative phase relationship is shown as arrows (with in-phase pointing right, antiphase pointing left, temperature leading SOI or PDO by 90° pointing straight down, and vice versa).
In order to understand the role of ENSO in modulating the temperature over the DML region, it is important to investigate the spatial variability of temperature during the El Niño (warm) and La Niña (cool) phases. Therefore, we have used the ERA5 2m temperature anomaly for strong El Niño (1987, 1997, 2002, and 2016) and La Niña phases (1989, 1999, 2000, and 2010) to highlight the temperature variability during ENSO events. During the El Niño events, the spatial anomaly plots show an increase in surface temperature over the DML region (Supplementary Figures S3A–D). By contrast, it shows reduced surface temperature over the DML region during the La Niña events (Supplementary Figures S3E–H). The spatial composite anomaly record of mean surface ERA5 temperature during El Niño years also shows a strong positive anomaly over the DML region, indicating a significant increase in temperature during these events (Figure 7A). In a similar manner, during the La Niña years, the composite temperature anomaly record shows significant cooling across the DML region (Figure 7B).
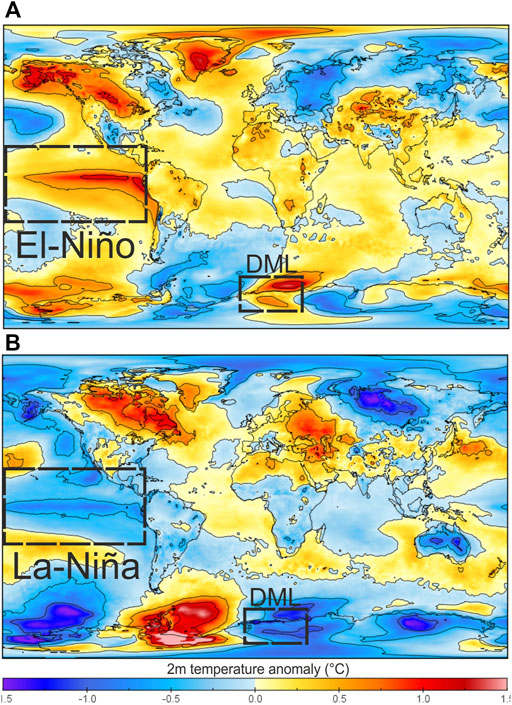
FIGURE 7. Composite ERA5 surface air temperature anomaly map for the (A) El Niño and (B) La Niña years. During El Niño years, the ERA5 surface air temperature anomaly shows a positive anomaly, whereas the opposite is observed during La Niña years over the DML region.
The teleconnections between the tropical Pacific and Antarctica are determined using the well-established dynamics of Rossby wave trains (Hoskins and Ambrizzi, 1993; Lachlan-Cope and Connolley, 2006). The atmospheric signature of this wave train is reflected in the Pacific South American pattern during ENSO events (Mo and Higgins, 1998; Li et al., 2021). Rossby wave trains are caused by convective heating of the tropical atmosphere (Fogt et al., 2011; Ding et al., 2012; Li et al., 2021) and propagate with alternating highs and lows in the atmosphere, curved poleward and eastward toward Antarctica (Clem and Fogt, 2013). Once reaching Antarctica, they interact with Amundsen sea low and further combine into interannual variability, which is influenced by SAM (Clem et al., 2016). Nonetheless, it is also important to understand the heat transfer during the El Niño and La Niña years to better understand the mechanism behind the temperature variability in the DML region. Toward this, we have used the vertical integral of the northward heat flux during El Niño and La Niña years. The anomaly plots of vertical heat flux (W m−2) show strong positive anomalies over the DML region during the La Niña years (Figure 8A), suggesting increased northward transport of heat (Isaacs et al., 2021). On the contrary, during the El Niño years, we have observed a strong negative heat flux over the DML region (Figure 8B), suggesting a strong tropical heat transfer toward the DML region during El Niño events. This highlights the role of ENSO and its atmospheric teleconnections in modulating the temperature variability in the DML region of East Antarctica.
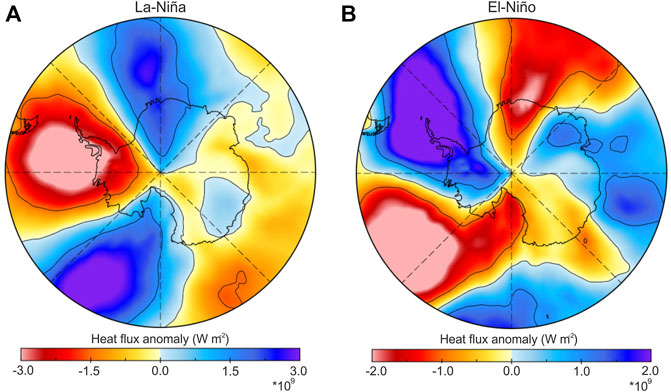
FIGURE 8. Heat flux anomaly during El Niño and La Niña years. Panel (A) and (B) show composite anomaly plots of the ERA5 vertical integral of the northward heat flux (W m−2) for the La Niña years and El Niño years respectively during 1979–2019 CE. The negative anomaly of the vertical integral of the northward heat flux (W m−2) suggests heat transfer from north to south and suggests an increase in temperature over the DML region of East Antarctica and vice versa.
SAM is the primary climate mode in the Southern Hemisphere, and hence, it is important to understand how SAM influenced DML temperature variability. In addition to the Rossby wave trains, ENSO signals are transmitted to the Antarctic region through a coupled interaction with SAM (Clem and Fogt, 2013). It is, therefore, necessary to understand the SAM–ENSO coupled interaction and its possible impact on surface air temperatures over the DML region. SAM is derived as the leading mode of empirical orthogonal function (EOF) of mean sea level pressure (MSLP) between 20°S and 75°S (Marshall et al., 2012; Lim and Hendon, 2015). Therefore, to understand the role of SAM–ENSO coupled interaction and its influence on surface air temperature of the DML region, we have used MSLP during the positive and negative SAM (pSAM and nSAM) years and correlated with ERA5 surface air temperature during the El Niño and La Niña years. During the pSAM and El Niño years, MSLP is inversely related to ERA5 surface air temperatures, whereas a strong positive correlation is observed during the La Niña years (Figures 9A,B). Furthermore, during the nSAM and El Niño years, MSLP is strongly correlated with the surface air temperature, whereas it is inversely related during the La Niña years (Figures 9A,B). In the above case, we have observed two modes of SAM–ENSO interactions: 1) pSAM/La Niña and nSAM/El Niño are in-phase (Figures 9B,C), and 2) pSAM/El Niño and nSAM/La Niña are antiphase (Figures 9A–D). There is a possibility of stronger teleconnections between ENSO and the Southern Pacific, based on the above in-phase pattern observed in case 1), which is found to be consistent with earlier studies (Fogt and Bromwich, 2006; Fogt et al., 2011). By contrast, the teleconnections became significantly weaker in case 2) when there was an antiphase relation (Fogt et al., 2011). In previous studies, it was observed that periodic break out of anticyclonic waves occurs more frequently during the La Niña phase, generating high zonal wind anomalies that propagate the low-pressure anomalies poleward (60°S) during the pSAM years (Clem and Fogt, 2013). Whereas, reverse conditions are often prevalent during El Niño events, which lead to positive pressure anomalies over the higher latitude and nSAM phases (Clem and Fogt, 2013). Therefore, our study supports the additional role of coupled interaction of SAM–ENSO in regulating the surface air temperature over the DML region.
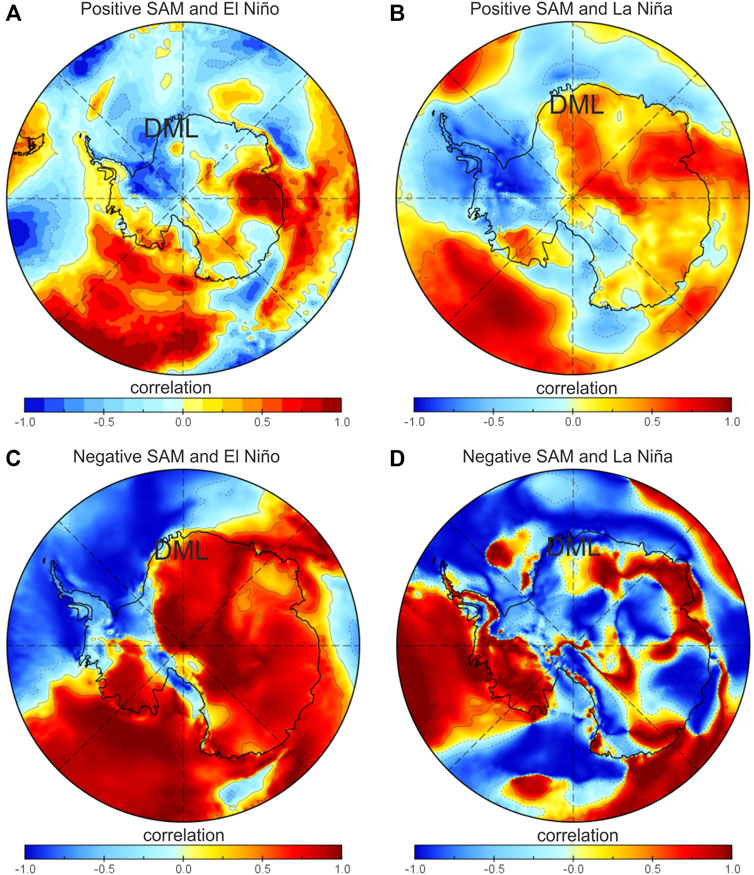
FIGURE 9. Mean sea level pressure (MSLP) during the positive SAM (pSAM) years is correlated with ERA5 surface air temperature during (A) El Niño years and (B) La Niña years. MSLP during the negative SAM (nSAM) years is correlated with ERA5 surface air temperature during (C) El Niño years and (D) La Niña years.
The Marshall SAM index (Marshall, 2003) regressed with ERA5 reanalysis of annual surface air temperature for 1957–2019 CE highlights a positive correlation across the western and central DML (Figure 10A). To understand the influence of the SAM–temperature relationship on a longer time scale, we have combined the Marshall SAM index with the reanalysis 20CRV2c SAM index for an extended SAM record and compared it with the DML temperature record (Figure 10B). It is noteworthy to observe that this extended SAM record shows its highest values and increasing trend in recent decades, similar to the temperature anomaly record (Figure 10C). This indicates that the warming trend since the 1940s is concomitant with the shifting of SAM to a positive phase. Such a positive shift could be attributed to the warming trend in the eastern DML for the last 7 decades. Furthermore, a wavelet coherency between SAM−SOI records (1851–2019 CE) shows significant antiphase relation between SAM at the decadal band since ∼1940, which exactly coincides with the warming trend in the DML region (Figure 10D). Compared to this, significant in-phase relation at 12–18 years band during 1880–1920 CE coincides with the cooling trend (Figure 10E). Therefore, we suggest that the SAM−ENSO phase relation influences the DML surface air temperature variability at annual to multidecadal scales.
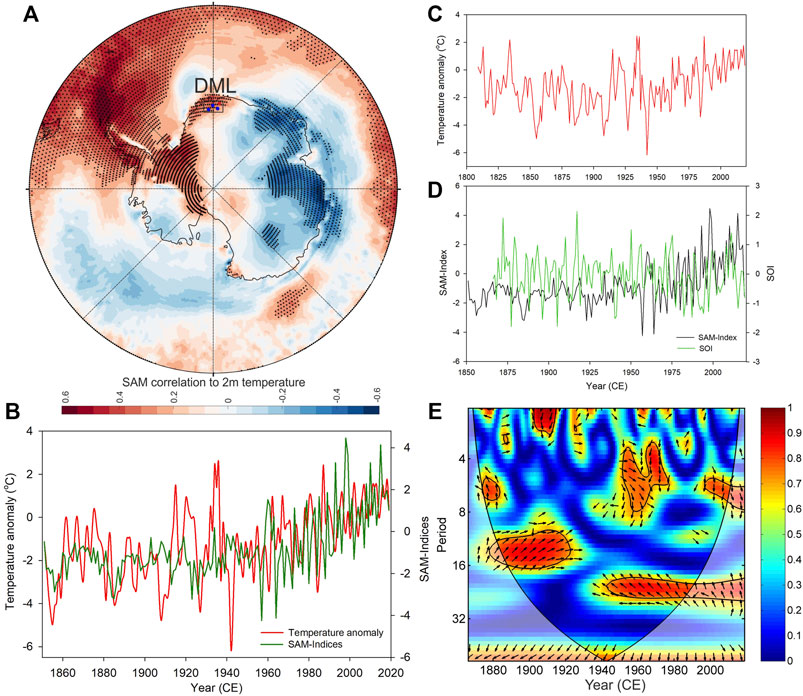
FIGURE 10. (A) Spatial correlation of Marshall SAM index (Marshall, 2003) with ERA5 reanalysis surface air temperature during (1957–2019 CE). Stippling indicates statistically significant correlations (95% confidence level). (B) The Marshall SAM index combined with the long-term 20CRV2c SAM record (Gong and Wang, 1999) is compared with the DML temperature anomaly record. The reconstructed DML temperature anomaly record broadly follows the combined SAM records during their respective time intervals. (C) Annual reconstructed temperature anomaly record (1809–1993 CE) is combined with ERA5 reanalysis surface temperature (1994–2019 CE). (D) The combined SAM Index record is compared with the SOI record (Ropelewski and Jones, 1987). (E) Wavelet coherence between the combined SAM record and SOI record (1851–2019 CE). The black contours indicate 95% of confidence, based on a red noise model. The thick black line indicates the cone of influence. The relative phase relationship is shown as arrows (with in-phase pointing right, antiphase pointing left, SAM leading SOI 90° pointing straight up, and vice versa).
A high-resolution ice core δ18O record (1809–2013 CE) retrieved from the coastal region integrated with published ice core records from DML in East Antarctica was used to investigate the factors that influenced oxygen isotope variability during the last two centuries. A PCA of the δ18O records was performed to extract the surface air temperature signal and reconstruct the temperature record of the DML region from 1809 to 1993 CE. The reconstructed surface air temperature record (1809–1993 CE) combined with the ERA5 reanalysis temperature anomaly record 1994–2019 CE was used to investigate the long-term trends, variability, and its link to various climate modes like SAM, ENSO, and IPO. The reconstructed DML temperature anomaly record shows a significant cooling trend at a rate of −0.164 ± 0.045°C decade−1 during 1809–1907 CE, followed by a significant warming trend at a rate of +0.452 ± 0.056°C decade−1 during the recent decades (1942–2019 CE). Our study revealed that ENSO coupled with SAM are the primary factors that modulate the surface air temperature variability in the DML region. Although the temperature signals at the ENSO band were persistent during the past two centuries, an increased shift from low (12–18 years band) to high-frequency (2–8 years band) oscillations was observed since the 1940s. We suggest that the shifting of SAM to a positive phase, coupled with increasing influences of ENSO in this part of Antarctica, has resulted in such dramatic warming over the DML region in recent decades.
The raw data supporting the conclusions of this article will be made available by the authors, without undue reservation.
MT, WR and TE conceived the study. TE analyzed, interpreted ice core data, and wrote the article. WR interpreted the data and designed the study. MT organized the project and drilled the ice core. KM drilled the ice core. All authors contributed to interpreting the results, discussion, and improvement of this article.
The authors declare that the research was conducted in the absence of any commercial or financial relationships that could be construed as potential conflicts of interest.
All claims expressed in this article are solely those of the authors and do not necessarily represent those of their affiliated organizations or those of the publisher, the editors, and the reviewers. Any product that may be evaluated in this article, or claim that may be made by its manufacturer, is not guaranteed or endorsed by the publisher.
We thank the Director of the National Centre for Polar and Ocean Research for encouragement and the Ministry of Earth Sciences (Government of India) for the financial support for the project “PACER—Cryosphere and Climate.” We acknowledge B. L. Redkar for support to the ice core drilling and laboratory work and A. H. Paiguinkar for laboratory assistance. We gratefully acknowledge PAGES 2k for ice core data, C Torrence, GP Compo, A Grinsted, JC Moore, and S Jevrejeva, for wavelet software, Norwegian Polar Institute for Quantarctica software package, and Climate Reanalyzer™ software of Climate Change Institute, University of Maine. TE acknowledges CSIR for a research fellowship grant and Prof. Kotha Mahender (Goa University) for guidance. We thank the reviewers for their useful comments and suggestions. This is NCPOR contribution No. J-27/2022-23.
The Supplementary Material for this article can be found online at https://www.frontiersin.org/articles/10.3389/feart.2022.799613/full#supplementary-material
Abram, N. J., Mulvaney, R., Vimeux, F., Phipps, S. J., Turner, J., and England, M. H. (2014). Evolution of the Southern Annular Mode during the Past Millennium. Nat. Clim. Change 4, 564–569. doi:10.1038/nclimate2235
Abram, N. J., Mulvaney, R., Wolff, E. W., and Mudelsee, M. (2007). Ice Core Records as Sea Ice Proxies: An Evaluation from the Weddell Sea Region of Antarctica. J. Geophys. Res. 112. doi:10.1029/2006jd008139
Clem, K. R., and Fogt, R. L. (2013). Varying Roles of ENSO and SAM on the Antarctic Peninsula Climate in Austral Spring. J. Geophys. Res. Atmos. 118, 11,481–411,492. doi:10.1002/jgrd.50860
Clem, K. R., Renwick, J. A., Mcgregor, J., and Fogt, R. L. (2016). The Relative Influence of ENSO and SAM on Antarctic Peninsula Climate. J. Geophys. Res. Atmos. 121, 9324–9341. doi:10.1002/2016jd025305
Dansgaard, W., Johnsen, S. J., Clausen, H. B., Dahl-Jensen, D., Gundestrup, N. S., Hammer, C. U., et al. (1993). Evidence for General Instability of Past Climate from a 250-kyr Ice-Core Record. Nature 364, 218–220. doi:10.1038/364218a0
Dansgaard, W., Johnsen, S. J., Møller, J., and Langway, C. C. (1969). One Thousand Centuries of Climatic Record from Camp Century on the Greenland Ice Sheet. Science 166, 377–381. doi:10.1126/science.166.3903.377
Ding, Q., Steig, E. J., Battisti, D. S., and Küttel, M. (2011). Winter Warming in West Antarctica Caused by Central Tropical Pacific Warming. Nat. Geosci. 4, 398–403. doi:10.1038/ngeo1129
Ding, Q., Steig, E. J., Battisti, D. S., and Wallace, J. M. (2012). Influence of the Tropics on the Southern Annular Mode. J. Clim. 25, 6330–6348. doi:10.1175/jcli-d-11-00523.1
Divine, D. V., Isaksson, E., Kaczmarska, M., Godtliebsen, F., Oerter, H., Schlosser, E., et al. (2009). Tropical Pacific–High Latitude South Atlantic Teleconnections as Seen inδ18O Variability in Antarctic Coastal Ice Cores. J. Geophys. Res. 114. doi:10.1029/2008jd010475
Ejaz, T., Rahaman, W., Laluraj, C. M., Mahalinganathan, K., and Thamban, M. (2021). Sea Ice Variability and Trends in the Western Indian Ocean Sector of Antarctica During the Past Two Centuries and its Response to Climatic Modes. J. Geophys. Res. Atmos. 126, e2020JD033943. doi:10.1029/2020jd033943
Epica Community Members (2004). Eight Glacial Cycles from an Antarctic Ice Core. Nature 429, 623–628. doi:10.1038/nature02599
Fogt, R. L., and Bromwich, D. H. (2006). Decadal Variability of the ENSO Teleconnection to the High-Latitude South Pacific Governed by Coupling with the Southern Annular Mode. J. Clim. 19, 979–997. doi:10.1175/jcli3671.1
Fogt, R. L., Bromwich, D. H., and Hines, K. M. (2011). Understanding the SAM Influence on the South Pacific ENSO Teleconnection. Clim. Dyn. 36, 1555–1576. doi:10.1007/s00382-010-0905-0
Fujita, K., and Abe, O. (2006). Stable Isotopes in Daily Precipitation at Dome Fuji, East Antarctica. Geophys. Res. Lett. 33, L18503. doi:10.1029/2006gl026936
Gong, D., and Wang, S. (1999). Definition of Antarctic Oscillation Index. Geophys. Res. Lett. 26, 459–462. doi:10.1029/1999gl900003
Goodwin, B. P., Mosley-Thompson, E., Wilson, A. B., Porter, S. E., and Sierra-Hernandez, M. R. (2016). Accumulation Variability in the Antarctic Peninsula: The Role of Large-Scale Atmospheric Oscillations and Their Interactions*. J. Clim. 29, 2579–2596. doi:10.1175/jcli-d-15-0354.1
Graf, W., Oerter, H., Reinwarth, O., Stichler, W., Wilhelms, F., Miller, H., et al. (2002). Stable-Isotope Records from Dronning Maud Land, Antarctica. Ann. Glaciol. 35, 195–201. doi:10.3189/172756402781816492
Grinsted, A., Moore, J. C., and Jevrejeva, S. (2004). Application of the Cross Wavelet Transform and Wavelet Coherence to Geophysical Time Series. Nonlin. Process. Geophys. 11, 561–566. doi:10.5194/npg-11-561-2004
Henley, B. J., Gergis, J., Karoly, D. J., Power, S., Kennedy, J., and Folland, C. K. (2015). A Tripole Index for the Interdecadal Pacific Oscillation. Clim. Dyn. 45, 3077–3090. doi:10.1007/s00382-015-2525-1
Hersbach, H., Bell, B., Berrisford, P., Hirahara, S., Horányi, A., Muñoz‐Sabater, J., et al. (2020). The ERA5 Global Reanalysis. Q. J. R. Meteorol. Soc. 146, 1999–2049. doi:10.1002/qj.3803
Hoskins, B. J., and Ambrizzi, T. (1993). Rossby Wave Propagation on a Realistic Longitudinally Varying Flow. J. Atmos. Sci. 50, 1661–1671. doi:10.1175/1520-0469(1993)050<1661:rwpoar>2.0.co;2
Isaacs, F. E., Renwick, J. A., Mackintosh, A. N., and Dadic, R. (2021). ENSO Modulates Summer and Autumn Sea Ice Variability Around Dronning Maud Land, Antarctica. J. Geophys. Res. Atmos. 126, e2020JD033140. doi:10.1029/2020jd033140
Jin, D., and Kirtman, B. P. (2009). Why the Southern Hemisphere ENSO Responses Lead ENSO. J. Geophys. Res. Atmos. 114. doi:10.1029/2009jd012657
Jouzel, J., Masson-Delmotte, V., Cattani, O., Dreyfus, G., Falourd, S., Hoffmann, G., et al. (2007). Orbital and Millennial Antarctic Climate Variability over the Past 800,000 Years. Science 317, 793–796. doi:10.1126/science.1141038
Kwok, R., and Comiso, J. C. (2002). Spatial Patterns of Variability in Antarctic Surface Temperature: Connections to the Southern Hemisphere Annular Mode and the Southern Oscillation. Geophys. Res. Lett. 29, 50–15054. doi:10.1029/2002gl015415
Lachlan-Cope, T., and Connolley, W. (2006). Teleconnections between the Tropical Pacific and the Amundsen-Bellinghausens Sea: Role of the El Niño/Southern Oscillation. J. Geophys. Res. Atmos. 111. doi:10.1029/2005jd006386
Laluraj, C. M., Thamban, M., Naik, S. S., Redkar, B. L., Chaturvedi, A., and Ravindra, R. (2010). Nitrate Records of a Shallow Ice Core from East Antarctica: Atmospheric Processes, Preservation and Climatic Implications. Holocene 21, 351–356. doi:10.1177/0959683610374886
Laluraj, C. M., Thamban, M., and Satheesan, K. (2014). Dust and Associated Geochemical Fluxes in a Firn Core from Coastal East Antarctica and its Linkages with Southern Hemisphere Climate Variability Over the Last 50 Years. Atmos. Environ. 90, 23–32. doi:10.1016/j.atmosenv.2014.03.031
Landais, A., Casado, M., Prié, F., Magand, O., Arnaud, L., Ekaykin, A., et al. (2017). Surface Studies of Water Isotopes in Antarctica for Quantitative Interpretation of Deep Ice Core Data. Comptes Rendus Geosci. 349, 139–150. doi:10.1016/j.crte.2017.05.003
Li, X., Cai, W., Meehl, G. A., Chen, D., Yuan, X., Raphael, M., et al. (2021). Tropical Teleconnection Impacts on Antarctic Climate Changes. Nat. Rev. Earth Environ. 2, 680–698. doi:10.1038/s43017-021-00204-5
Lim, E.-P., and Hendon, H. H. (2015). Understanding and Predicting the Strong Southern Annular Mode and its Impact on the Record Wet East Australian Spring 2010. Clim. Dyn. 44, 2807–2824. doi:10.1007/s00382-014-2400-5
Mantua, N. J., and Hare, S. R. (2002). The Pacific Decadal Oscillation. J. Oceanogr. 58, 35–44. doi:10.1023/a:1015820616384
Marshall, A. G., Hudson, D., Wheeler, M. C., Hendon, H. H., and Alves, O. (2012). Simulation and Prediction of the Southern Annular Mode and its Influence on Australian Intra-Seasonal Climate in POAMA. Clim. Dyn. 38, 2483–2502. doi:10.1007/s00382-011-1140-z
Marshall, G. J. (2003). Trends in the Southern Annular Mode from Observations and Reanalyses. J. Clim. 16, 4134–4143. doi:10.1175/1520-0442(2003)016<4134:TITSAM>2.0.CO;2
Marshall, G. J. (2007). Half-Century Seasonal Relationships between the Southern Annular Mode and Antarctic Temperatures. Int. J. Climatol. 27, 373–383. doi:10.1002/joc.1407
Marshall, G. J., Orr, A., Van Lipzig, N. P. M., and King, J. C. (2006). The Impact of a Changing Southern Hemisphere Annular Mode on Antarctic Peninsula Summer Temperatures. J. Clim. 19, 5388–5404. doi:10.1175/jcli3844.1
Masson-Delmotte, V., Hou, S., Ekaykin, A., Jouzel, J., Aristarain, A., Bernardo, R. T., et al. (2008). A Review of Antarctic Surface Snow Isotopic Composition: Observations, Atmospheric Circulation, and Isotopic Modeling. J. Clim. 21, 3359–3387. doi:10.1175/2007jcli2139.1
Medley, B., Mcconnell, J. R., Neumann, T. A., Reijmer, C. H., Chellman, N., Sigl, M., et al. (2018). Temperature and Snowfall in Western Queen Maud Land Increasing Faster Than Climate Model Projections. Geophys. Res. Lett. 45, 1472–1480. doi:10.1002/2017gl075992
Mills, S. C., Le Brocq, A. M., Winter, K., Smith, M., Hillier, J., Ardakova, E., et al. (2019). Testing and Application of a Model for Snow Redistribution (Snow_Blow) in the Ellsworth Mountains, Antarctica. J. Glaciol. 65, 957–970. doi:10.1017/jog.2019.70
Mo, K. C., and Higgins, R. W. (1998). The Pacific-South American Modes and Tropical Convection during the Southern Hemisphere Winter. Mon. Wea. Rev. 126, 1581–1596. doi:10.1175/1520-0493(1998)126<1581:tpsama>2.0.co;2
Mott, R., Vionnet, V., and Grünewald, T. (2018). The Seasonal Snow Cover Dynamics: Review on Wind-Driven Coupling Processes. Front. Earth Sci. 6, 197. doi:10.3389/feart.2018.00197
Mulvaney, R., Abram, N. J., Hindmarsh, R. C. A., Arrowsmith, C., Fleet, L., Triest, J., et al. (2012). Recent Antarctic Peninsula Warming Relative to Holocene Climate and Ice-Shelf History. Nature 489, 141–144. doi:10.1038/nature11391
Naik, S., Thamban, M., Laluraj, C. M., Redkar, P., and Chaturvedi, A. (2010). A Century of Climate Variability in Central Dronning Maud Land, East Antarctica, and its Relation to Southern Annular Mode and El Nino-Southern Oscillation. J. Geophys. Res. 115. doi:10.1029/2009jd013268
Nardin, R., Severi, M., Amore, A., Becagli, S., Burgay, F., Caiazzo, L., et al. (2021). Dating of the GV7 East Antarctic Ice Core by High-Resolution Chemical Records and Focus on the Accumulation Rate Variability in the Last Millennium. Clim. Past. 17, 2073–2089. doi:10.5194/cp-17-2073-2021
Noone, D., and Simmonds, I. (2002). Annular Variations in Moisture Transport Mechanisms and the Abundance of δ18O in Antarctic Snow. J. Geophys. Res. Atmos. 107, ACL 3-1–ACL 3-11. doi:10.1029/2002jd002262
Okumura, Y. M., Schneider, D., Deser, C., and Wilson, R. (2012). Decadal-Interdecadal Climate Variability Over Antarctica and Linkages to the Tropics: Analysis of Ice Core, Instrumental, and Tropical Proxy Data. J. Clim. 25, 7421–7441. doi:10.1175/jcli-d-12-00050.1
Otto-Bliesner, B. L., Brady, E. C., Fasullo, J., Jahn, A., Landrum, L., Stevenson, S., et al. (2016). Climate Variability and Change since 850 CE: An Ensemble Approach with the Community Earth System Model. Bull. Am. Meteorol. Soc. 97, 735–754. doi:10.1175/bams-d-14-00233.1
PAGES 2k Consortium (2013). Continental-Scale Temperature Variability during the Past Two Millennia. Nat. Geosci. 6, 339–346. doi:10.1038/ngeo1797
Petit, J. R., Jouzel, J., Raynaud, D., Barkov, N. I., Barnola, J.-M., Basile, I., et al. (1999). Climate and Atmospheric History of the Past 420,000 Years from the Vostok Ice Core, Antarctica. Nature 399, 429–436. doi:10.1038/20859
Picciotto, E., De Maere, X., and Friedman, I. (1960). Isotopic Composition and Temperature of Formation of Antarctic Snows. Nature 187, 857–859. doi:10.1038/187857a0
Rahaman, W., Chatterjee, S., Ejaz, T., and Thamban, M. (2019). Increased Influence of ENSO on Antarctic Temperature since the Industrial Era. Sci. Rep. 9, 6006. doi:10.1038/s41598-019-42499-x
Rahaman, W., Thamban, M., and Laluraj, C. (2016). Twentieth-Century Sea Ice Variability in the Weddell Sea and its Effect on Moisture Transport: Evidence from a Coastal East Antarctic Ice Core Record. Holocene 26, 338–349. doi:10.1177/0959683615609749
Ropelewski, C. F., and Jones, P. D. (1987). An Extension of the Tahiti-Darwin Southern Oscillation Index. Mon. Wea. Rev. 115, 2161–2165. doi:10.1175/1520-0493(1987)115<2161:aeotts>2.0.co;2
Schmidt, G. A., Jungclaus, J. H., Ammann, C. M., Bard, E., Braconnot, P., Crowley, T. J., et al. (2012). Climate Forcing Reconstructions for Use in PMIP Simulations of the Last Millennium (v1.1). Geosci. Model Dev. 5, 185–191. doi:10.5194/gmd-5-185-2012
Schneider, D. P., Steig, E. J., and Comiso, J. C. (2004). Recent Climate Variability in Antarctica from Satellite-Derived Temperature Data. J. Clim. 17, 1569–1583. doi:10.1175/1520-0442(2004)017<1569:rcviaf>2.0.co;2
Schneider, D. P., Steig, E. J., and Van Ommen, T. (2017). High-Resolution Ice-Core Stable-Isotopic Records from Antarctica: Towards Interannual Climate Reconstruction. Ann. Glaciol. 41, 63–70. doi:10.3189/172756405781813357
Schulz, M., and Mudelsee, M. (2002). REDFIT: Estimating Red-Noise Spectra Directly from Unevenly Spaced Paleoclimatic Time Series. Comput. Geosci. 28, 421–426. doi:10.1016/s0098-3004(01)00044-9
Stenni, B., Curran, M. A. J., Abram, N. J., Orsi, A., Goursaud, S., Masson-Delmotte, V., et al. (2017). Antarctic Climate Variability on Regional and Continental Scales Over the Last 2000 Years. Clim. Past. 13, 1609–1634. doi:10.5194/cp-13-1609-2017
Stenni, B., Jouzel, J., Masson-Delmotte, V., Röthlisberger, R., Castellano, E., Cattani, O., et al. (2004). A Late-Glacial High-Resolution Site and Source Temperature Record Derived from the EPICA Dome C Isotope Records (East Antarctica). Earth Planet. Sci. Lett. 217, 183–195. doi:10.1016/s0012-821x(03)00574-0
Thamban, M., Rahaman, W., and Laluraj, C. M. (2020). Millennial to Quasi-Decadal Variability in Antarctic Climate System as Evidenced from High-Resolution Ice Core Records. Curr. Sci. 119, 255–264. doi:10.18520/cs/v119/i2/255-264
Thomas, E. R., Van Wessem, J. M., Roberts, J., Isaksson, E., Schlosser, E., Fudge, T. J., et al. (2017). Regional Antarctic Snow Accumulation Over the Past 1000 Years. Clim. Past. 13, 1491–1513. doi:10.5194/cp-13-1491-2017
Thompson, D. W., and Solomon, S. (2002). Interpretation of Recent Southern Hemisphere Climate Change. Science 296, 895–899. doi:10.1126/science.1069270
Thompson, D. W. J., and Wallace, J. M. (2000). Annular Modes in the Extratropical Circulation. Part I: Month-To-Month Variability*. J. Clim. 13, 1000–1016. doi:10.1175/1520-0442(2000)013<1000:amitec>2.0.co;2
Torrence, C., and Compo, G. P. (1998). A Practical Guide to Wavelet Analysis. Bull. Amer. Meteor. Soc. 79, 61–78. doi:10.1175/1520-0477(1998)079<0061:apgtwa>2.0.co;2
Turner, J., Colwell, S. R., Marshall, G. J., Lachlan-Cope, T. A., Carleton, A. M., Jones, P. D., et al. (2005). Antarctic Climate Change during the Last 50 Years. Int. J. Climatol. 25, 279–294. doi:10.1002/joc.1130
Turner, J., Marshall, G. J., Clem, K., Colwell, S., Phillips, T., and Lu, H. (2020). Antarctic Temperature Variability and Change from Station Data. Int. J. Climatol. 40, 2986–3007. doi:10.1002/joc.6378
Turner, J., Phillips, T., Thamban, M., Rahaman, W., Marshall, G. J., Wille, J. D., et al. (2019). The Dominant Role of Extreme Precipitation Events in Antarctic Snowfall Variability. Geophys. Res. Lett. 46, 3502–3511. doi:10.1029/2018gl081517
Turner, J. (2004). The El Niño-Southern Oscillation and Antarctica. Int. J. Climatol. 24, 1–31. doi:10.1002/joc.965
Van Den Broeke, M., and Lipzig, N. (2003). Antarctic Peninsula Climate Variability: Historical and Paleoenvironmental Perspective 79.
Winstrup, M., Svensson, A. M., Rasmussen, S. O., Winther, O., Steig, E. J., and Axelrod, A. E. (2012). An Automated Approach for Annual Layer Counting in Ice Cores. Clim. Past. 8, 1881–1895. doi:10.5194/cp-8-1881-2012
Yeh, S.-W., Cai, W., Min, S.-K., Mcphaden, M. J., Dommenget, D., Dewitte, B., et al. (2018). ENSO Atmospheric Teleconnections and Their Response to Greenhouse Gas Forcing. Rev. Geophys. 56, 185–206. doi:10.1002/2017rg000568
Keywords: Antarctica, ice core, SAM, ENSO, IPO
Citation: Ejaz T, Rahaman W, Laluraj CM, Mahalinganathan K and Thamban M (2022) Rapid Warming Over East Antarctica Since the 1940s Caused by Increasing Influence of El Niño Southern Oscillation and Southern Annular Mode. Front. Earth Sci. 10:799613. doi: 10.3389/feart.2022.799613
Received: 21 October 2021; Accepted: 14 June 2022;
Published: 05 August 2022.
Edited by:
Samuel Jaccard, University of Lausanne, SwitzerlandReviewed by:
Andrea Spolaor, National Research Council (CNR), ItalyCopyright © 2022 Ejaz, Rahaman, Laluraj, Mahalinganathan and Thamban. This is an open-access article distributed under the terms of the Creative Commons Attribution License (CC BY). The use, distribution or reproduction in other forums is permitted, provided the original author(s) and the copyright owner(s) are credited and that the original publication in this journal is cited, in accordance with accepted academic practice. No use, distribution or reproduction is permitted which does not comply with these terms.
*Correspondence: Tariq Ejaz, dGFyaXFAbmNwb3IucmVzLmlu, dGFyaXFlamF6OTRAZ21haWwuY29t
Disclaimer: All claims expressed in this article are solely those of the authors and do not necessarily represent those of their affiliated organizations, or those of the publisher, the editors and the reviewers. Any product that may be evaluated in this article or claim that may be made by its manufacturer is not guaranteed or endorsed by the publisher.
Research integrity at Frontiers

Learn more about the work of our research integrity team to safeguard the quality of each article we publish.