
94% of researchers rate our articles as excellent or good
Learn more about the work of our research integrity team to safeguard the quality of each article we publish.
Find out more
ORIGINAL RESEARCH article
Front. Earth Sci., 11 February 2022
Sec. Geochemistry
Volume 10 - 2022 | https://doi.org/10.3389/feart.2022.795857
 Jingyao Zhao1,2*†
 Liangcheng Tan1,3*†
 Dong Li4
 Carlos Pérez-Mejías1Xiyu Dong1
 Jian Wang1
 Haiwei Zhang1Hai Cheng1,3,2
To interpret the climatic signals of precipitation/speleothem δ18O, it is critical to identify the importance of the factors affecting the precipitation δ18O. This study presents new stable isotope data for precipitation δ18O and δD in the site of Shenqi cave, southwest China, from November-2015 to October-2016 (the “Super-El Niño” event), to investigate the regional-scale climate forcing on precipitation δ18O. The precipitation δ18O, δD and d-excess have an obvious seasonality, relatively low values in the wet season and high in the dry season. The further analysis of seasonally altered LMWL and moisture circulations suggested that changes in atmosphere moisture circulations would be the key factor underlying the precipitation/speleothem δ18O fluctuations in our study area at least on seasonal timescales. Combined with the seasonal-monthly variations of the IsoGSM δ18O, GPCP/CRU rainfall and NCEP/NCAR moisture fluxes, we detected that the super-El Niño of 2016 have changed the distributions of monthly rainfall in wet season through the Western Pacific Subtropical High, but not mainly the precipitation isotopic compositions and moisture circulations in our study area.
Asian summer monsoon (ASM) and El Niño/Southern Oscillation (ENSO) affect billions of people’s livelihoods over East Asia including China, Japan, Korea, Indo-China peninsula, and Philippines (Wang et al., 2001; Xie et al., 2009; Tan et al., 2011; Wang et al., 2013; An et al., 2015; Cheng et al., 2016; Cai et al., 2017; Tan et al., 2018). The nature of its variability as well as its future evolution is always subject of debate, due to the great repercussion that unusual events may cause in the socioeconomic area involved. The oxygen isotope (δ18O) composition of rainfall (and thus, the one contained in speleothems) contains very valuable information about atmosphere moisture circulation, rainfall and temperature, drawing so much attention in the scientific community (Yonge et al., 1985; Fleitmann et al., 2004; Yuan et al., 2004; Maher, 2008; Li et al., 2011; Tan et al., 2011; Tan, 2014; Cheng et al., 2016; Moreno et al., 2021).
Speleothem oxygen isotope (δ18Ospel) records have been widely used to characterize ASM variations on a wide range of timescales from orbital and millennial to centennial-multidecadal and decadal-annual (Wang et al., 2001; Zhang et al., 2008; Zhou et al., 2008; Tan et al., 2011; Tan, 2014; Cheng et al., 2016; Tan et al., 2018). The δ18Ospel variability, under conditions of carbonate precipitation in equilibrium, has been widely attributed to changes in the δ18O of the precipitation (δ18Op) (Li et al., 2011; Luo et al., 2014; Tan, 2014; Duan et al., 2016; Chen & Li, 2018; Sun et al., 2018). As such there are many mechanisms controlling the δ18Op (Lachniet, 2009) that may complicate the interpretation of the δ18Ospel, e.g., the “temperature effect” (Mangini et al., 2005; Feng et al., 2014), “amount effect” (Bar-Matthews et al., 2003; Fleitmann et al., 2004), “rainout effect” (Yuan et al., 2004; Pérez-Mejías et al., 2018), “altitude effect” (Johnston et al., 2013), “continental effect” (McDermott et al., 2011) and “moisture/circulation effect” (Maher, 2008; Clemens et al., 2010; Tan, 2014; Cai et al., 2017; Yang et al., 2019). The monitoring of rainfall δ18O is an effective method to accurately unravel the speleothem δ18O significance, which has been implemented as early as 1980s (Yonge et al., 1985), while a complete study is needed of the corresponding hydrological conditions of recharge and evaluate the homogenization of the groundwaters (Fairchild and Baker, 2012; Genty et al., 2014; Duan et al., 2016). The rainfall/dripwater δ18O from Chinese monsoonal region roughly reflect changes in the monsoon intensity, being sensitive to the variability seen in the Western Pacific Subtropical High (WPSH) (Wang et al., 2013; Zhao et al., 2018) as well as changes in the amplitude and/or frequency of ENSO extreme events (Tan, 2014; Chen and Li, 2018; Sun et al., 2018; Zhao et al., 2018). Seasonally-varying arrivals of moisture likely play a key role in the observed seasonal cycle of δ18Op, as was seen, for example, in monsoon region of China or northern Borneo, whereby heavier δ18O is indicative of relatively dry conditions on seasonal timescale (Cobb et al., 2007; Duan et al., 2016).
The consistent variations of the ASM among different speleothem δ18O records on different timescales (Cheng et al., 2016; Tan et al., 2018; Zhao et al., 2018; Yang et al., 2019) basically suggest a common climatic control factor. It is worth noting that the seasonal δ18Op variation of the ASM had a large spatial consistency as well, with high values at the onset of the monsoon season and low values during the main monsoon phase. From the principle of oxygen isotope, it is most likely to represent the nature of the ‘wind’ of the monsoon scenario, or the spatial scales of the atmospheric circulation and the associated changes in moisture sources (Tan, 2014; Cheng et al., 2016; Duan et al., 2016; Chen and Li, 2018; Sun et al., 2018; Cheng et al., 2021). The ASM is a vast climate system, which transports huge amounts of moisture and heat northward from southern Hemisphere (e.g., Mascarene High) across the Indian Ocean into India, southeastern China, and as far as northeastern China and Japan (Cheng et al., 2016; Tan et al., 2018; Cheng et al., 2019; Zhao et al., 2021). The ASM δ18Op, therefore, is largely a measure of the fraction of water vapor removed from air masses between the tropical Indo-Pacific and monsoon region. To first order, this process can be modeled assuming Rayleigh fractionation (Yuan et al., 2004; Hoefs, 2009; Cheng et al., 2012). Moreover, the coherent spatial climate variation of East Asia summer Monsoon (EASM) regions also indicated the uniform signal regarding to its synoptical pattern, which is deeply affected by the intensity of southerly winds (Tan et al., 2014; Zhao et al., 2018; Cheng et al., 2019; Cheng et al., 2021). On the other hand, the variation of δ18Op in ASM region is highly complex and a large portion of the variance is unexplained by the monsoon intensity or southerly winds only, and may be attributed to some other related factors, for example the rainfall amount, ENSO or Westerly Jet (Tan, 2014; Chiang et al., 2015; Ming, 2016; Kong et al., 2017).
We also denote that ENSO is the dominant mode of climate variability in the instrumental records from the ASM regions (Xie et al., 2009; Zhang and Gao, 2016; Chen et al., 2017), which deeply affect the ASM through the Walker Circulation (Vecchi et al., 2006), the Indian Ocean capacitor effect (Xie et al., 2009) and also influences action centers like the WPSH (Wang et al., 2013; Zhao et al., 2018). The original signal may be kept in the footprint of the air mass where the precipitation is produced, as well as in the type of cloud (Hoefs, 2009). Some studies demonstrated that strong events on sub-annual scales, like for example tropical cyclones, may be recorded in the dripwater, and thus, potentially transmitted into speleothem (Frappier et al., 2007; Lases-Hernández et al., 2020). Here, we present data of the δ18O and δD of precipitation from the sensitive monsoon region located in southeastern Tibetan Plateau, covering a full hydrological year (from November 2015 to October 2016). The interest of that year can be found in the anomalous intensity seen in El Niño, comparable to the strongest events seen during the past decades so-called “super El Niño” during 1982/1983 and 1997/1998 (Chen et al., 2017; Rao and Ren, 2017). Hence, it is of great interest to explore any signal of such unusual El Niño event in the δ18Op in this area, as well enrich the information obtained from monitoring surveys to help to interpret the climatic signals recorded in the speleothem δ18O from caves located in our study area. In fact, under ideal conditions of a proper growth rate, fast infiltration and poor groundwater mixing, such signal of unusual events like the present case of super El Niño may be recorded in speleothems from this area.
The study area (Shenqi cave), located at the southeast margin of Tibetan Plateau (TP), has a specific geography environment about plenty of water sources (Dadu River and Yangtze River) and snow mountains (Gongga), with large relative height from ∼7,500 m to ∼1,000 m (Figure 1 and Supplementary Figure S1). The cave (28°56′ N, 103°06′ E, 1407 m above sea level), formed in Triassic dolomitic limestone, has a small entrance of 3*4 m2, and its total length exceeds 400 m (Tan et al., 2018). An underground river was developed in the cave along with the main passage. The annual precipitation is 1,290 mm with more than 80% occurring during the monsoon season (late May-October, data from Leshan station, 95 km northeast Shenqi cave, during 1951–2013). Spatial correlation analysis indicates that rainfall variations around the area of Shenqi cave are positively correlated with those in southwestern China, especially in southeastern TP (Tan et al., 2018).
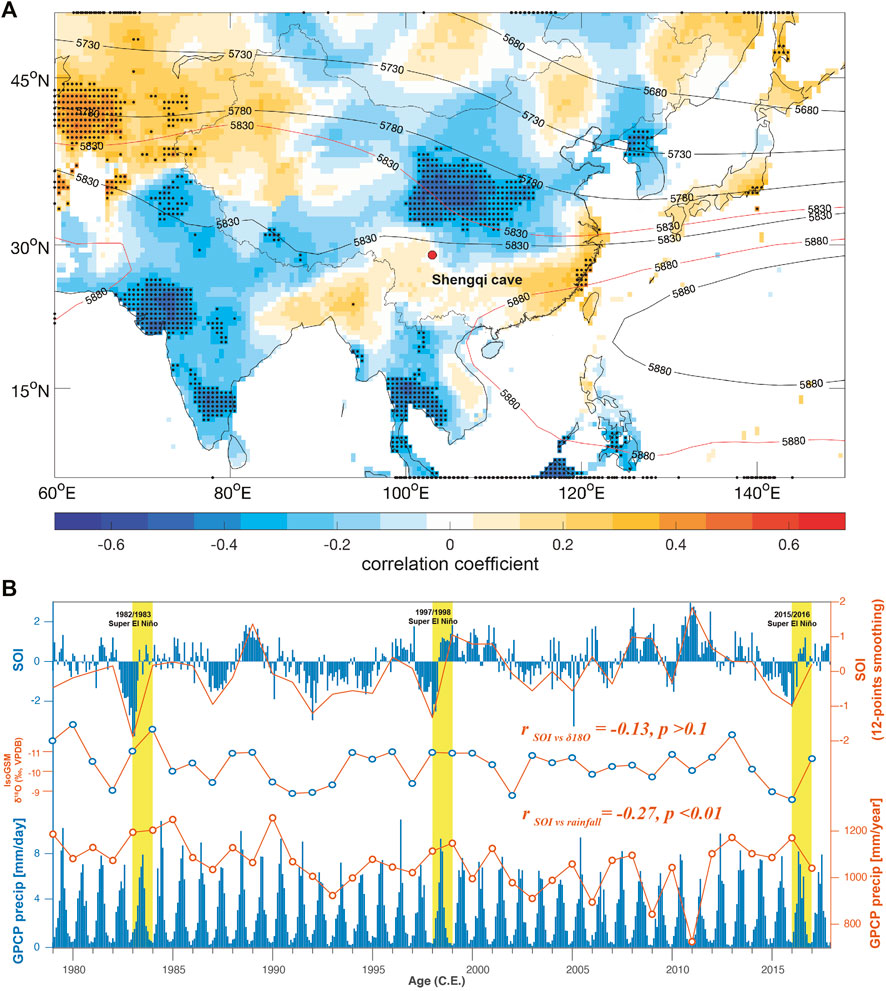
FIGURE 1. Spatial distribution of the correlation coefficients between the GPCP JJAS rainfall amount and the JJAS amount-weighted δ18Op averaged near the Shenqi cave (red circule) based on the Experimental Climate Prediction Center’s Isotope-incorporated Global Spectral Model (IsoGSM) (Yoshimura et al., 2008) between 1979 and 2017 with June geopotential heights (contours in geopotential meters, gpm) at 500 hPa in mean state of 1979–2017 (black line) and year of 2016 (red line) (A), and comparisons of the monthly amount-weighted IsoGSM δ18Op data with the SOI and GPCP rainfall amount records (B). Stippling indicates significant correlation (p < 0.1 level). Precipitation data (A) are from Climatic Research Unit (CRU) TS4.04, and the geopotential heights (gpm) are based on the monthly reanalysis data from the National Center for Environmental Prediction (NCEP) and the National Center for Atmospheric Research (NCAR). The Southern Oscillation Index (SOI) (B) are from website https://www.ncdc.noaa.gov/teleconnections/enso/soi; precipitation amount in the study area (103°–104°E 28°–29°N), using monthly mean values extracted from the Global Precipitation Climatology Project (GPCP) v2.3 (http://climexp.knmi.nl/select). Vertical bars depict the years with very intense El Niño (or “Super El Niño”) events. It is generally accepted to use the contour line of 5880 geo-potential meters (gpm) to define the spatial boundary of the WPSH, which is also routinely used by the National Climate Center of China (NCCC) (A).
Precipitation collection was carried out for a complete hydrological year from November-2015 to October-2016. The cumulative precipitation samples per rainfall event were collected above cave in an open area near cave entrance. Following the International Atomic Energy Agency (IAEA) protocol (www-naweb.iaea.org/napc/ih/documents/userupdate/sampling.pdf), rainwater was collected in a 5 L HDPE bottle with a funnel. A ping-pong ball was placed at the funnel mouth and the bottom of the HDPE bottle was coated with approximately 0.5 cm-thick paraffin oil to prevent evaporation. The sub-samples of the homogenized precipitation were removed into pre-cleaned 8 ml glass sealed bottles with no head space for δ18Op and δD analysis. To prevent precipitation from evaporating, liquid samples were collected immediately after precipitation ceased, filtered using a filter head with an aperture of 0.45 μm, and finally stored in 5-ml HDPE bottles with waterproof seals. The time and place of sampling were recorded for each sample. All the samples were stored in cold storage (4°C) before isotope ratio analysis using a water isotopes analyzer (IWA-35EP) of Los Gatos Research (LGR) Company. In total, 128 precipitation samples were collected as individual events in sample analysis. The standard reference is LGR3A/4A/5A from Los Gatos Research Company. As an analysis routine, LGR IWA analyzed each sample 6 times. Because residue of previous sample likely influences next sample (memory effect), the first two measurements were not taken as valid data. The results were expressed as δ-values relative to V-SMOW (Vienna Standard Mean Ocean Water). The precision of the IWA-35EP liquid water isotope analyzer measurement was <0.20‰ for δD and <0.03‰ for δ18Op. We decided to delete one outlier δ18Op and δD data on 9 September 2016 for their calculation of linear regression lines, owing to that R2 of the fit line is apparently improved from 0.69 to 0.92 after the point removing (Supplementary Figure S7). Deuterium excess (d-excess) of precipitation was calculated with the equation: d-excess = δD—eight δ18O (Dansgaard, 1964).
The δ18Op, δD and d-excess variability in our data exhibit a seasonal pattern with relatively low values in wet season (June to October) and relatively high values in dry season (November to May) (Figure 2), roughly consistent with the pattern seen in the datasets from the Global Network of Isotopes in Precipitation and the Chinese Network of Isotopes in Precipitation (Johnson and Ingram, 2004; Clemens et al., 2010; Dayem et al., 2010). The range of the δ18Op is −17.7‰ (27th July) to 0.7‰ (19th May), whereas δD ranges between −130.9‰ (27th July) to 29.1‰ (19th May, again). The lowest δ18Op and δD values occurred in July, likely correlated to the anomalously high WPSH and the super El Niño (Zhang and Gao, 2016; Chen et al., 2017). The mean values of δ18Op and δD are −7.0‰ and −39.8‰, respectively. The d-excess of precipitation exhibits the significant seasonal variations as well, with lower values in wet season and higher values in dry season (Figure 2).
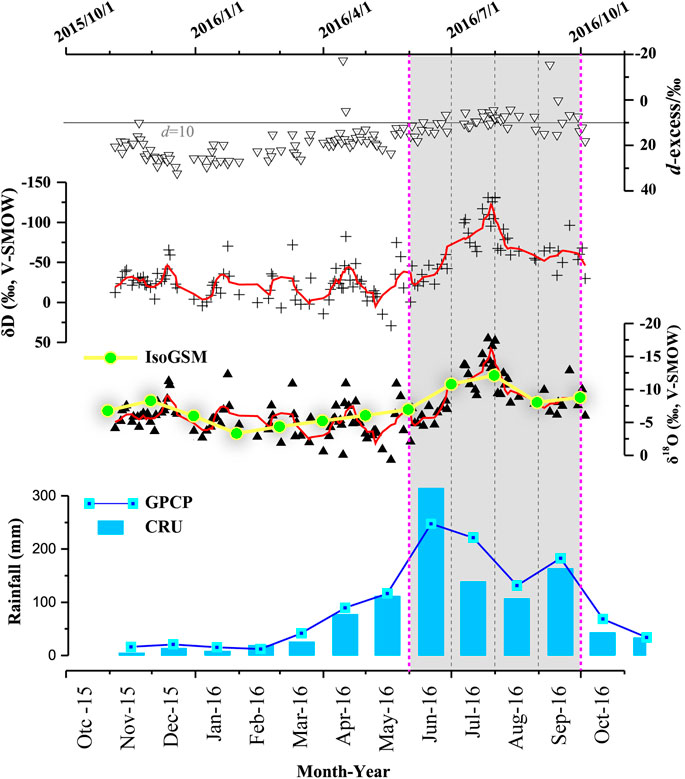
FIGURE 2. Precipitation d-excess, δ18O, δD and the corresponding amount of rainfall in our study area. A 10-points smoothing fit has been applied to the data (red line). And the monthly weighted δ18Op (yellow point line) near Shenqi cave are based on the IsoGSM (Yoshimura et al., 2008). The GPCP v2.3 and CRU TS4.04 data, used to extract the amount of rainfall data, can be found in the following website: http://climexp.knmi.nl/select. The yellow vertical bar depicts the wet season in the stable isotopes of the precipitation, influenced by the “super El Niño” event and the corelated anomalous WPSH.
The negative correlation (r = −0.51, p < 0.01) between monthly mean values of δ18Op and monthly GPCP precipitation amount in 2016 (Figure 2) marks the relationship between the stable isotopes and amount of precipitation in this area. Besides, the annual δ18O trend in Shenqi cave shows an negative relation with local monsoon precipitation during the 1951–2010 period in previous publication (Tan et al., 2018), suggesting that the speleothem δ18O or δ18Op in this area can reflect monsoon precipitation to some degree (Tan et al., 2015; Tan et al., 2018). The amount effect is ascribed to gradual saturation of air below the cloud, which diminishes any shift to higher δ18Op values caused by evaporation during precipitation (Fricke and O'Neil, 1999). Besides, relatively heavy isotopes tend to displace to the liquid solution and precipitate, whereas more negative oxygen are conforming in moistures. However, that significantly negative correlations can be explained by not only the sensu-stricto amount effect (Craig, 1961; Dansgaard, 1964), but also the different moisture origins, evolution and distance to the source area (Dansgaard, 1964; Tan, 2014; Cheng et al., 2016; Zhao et al., 2018). For instance, there’s no significant correlations of local rainfall amount and weighted IsoGSM δ18Op in spatial distribution of correlation coefficients for 1979–2017, but significantly negatively correlated with rainfall amount around the upstream regions-southwest monsoon regions (Figure 1A). Besides, the δ18Op in June kept enriched while the rainfall in June is highest during the entire year (Figure 2), which were unexplained by the only amount effect mechanisms as well. It is roughly consistent with the previous study about the 18O-enriched rainfall during the onset of monsoon when the moisture source was mainly from the continent or marginal ocean, owing to the relatively small land-sea temperature gradient (Cheng et al., 2012; Cheng et al., 2019). Therefore, the degree of “amount effect” observed here is basically an overall negative correlation on seasonal timescales, and it is largely controlled by the history and origin of the seasonally altered moisture circulations (Figures 1A, 4), rather than a conventional amount effect mechanism (Dansgaard, 1964; Fricke and O'Neil, 1999; Zhao et al., 2018). Indeed, this explanation entails differences with the relationship between δ18Op and rainfall amount seen in tropical regions, for example in northern Borneo, where it is linked to the intensity of convective activity associated with the Intertropical Convergence Zone variability, and increased precipitation drives more negative δ18Op (Cobb et al., 2007).
On the other hand, the d-excess is a characteristic parameter of the source area of the water vapor from which rain originates (Rozanski et al., 1982; Lewis et al., 2013; Duan et al., 2016). High humidity during the formation of moist air masses leads to d-excess < 10‰, while low humidity at the vapor source typically yields d-excess > 10‰ (Clark and Fritz, 2013). The d-excess of rainwater in our study area shows the similar seasonal variation, with lower values in wet season but higher values in dry season (Figure 2). This further confirms that rainfall in our study areas in the wet season is likely sourced from the tropical oceanic air masses (Figure 4), where the humidity is high. In contrast, the rainfall in the dry season is mostly sourced in continental air mass, northwest or from local recycled moisture, where the humidity is low.
The relationship between the δ18Op and δD values of the rainwater samples collected per rainfall events (n = 127) from November 2015 to October 2016 depict the following Local Meteoric Water Line (LMWL: δD = 8.85 δ18O+ 22.70) for the super-El Niño in 2016. The slope as well as the intercept for y-axis are higher than the Global Meteoric Water Line, defined as δD = 8 δ18O+ 10 (Craig, 1961) (Figure 3). We further established the LMWL respectively calculated for the case of the wet season (δD = 8.47 δ18O+ 14.51) and dry season (δD = 7.65 δ18O+ 18.44) (Figure 3). Additionally, new LMWL has been calculated for every month mainly in the wet season (MJJAS), and most of the fit lines are reliable with relatively high R2 (Figure 3). The slopes range from 9.16 to 7.95, and intercepts with values ranging from 20.41 to 7.95 (Figure 3). Generally, the decreasing slopes from wet season to dry season or from June to September are attributed to the increasing evaporation below the cloud (Craig, 1961; Fricke and O'Neil, 1999; Fairchild and Baker, 2012; Duan et al., 2016; Chen and Li, 2018; Pérez-Mejías et al., 2018; Sun et al., 2018), which’re likely related to the gradually weakening of remote oceanic moistures or monsoon intensity (Figure 4).
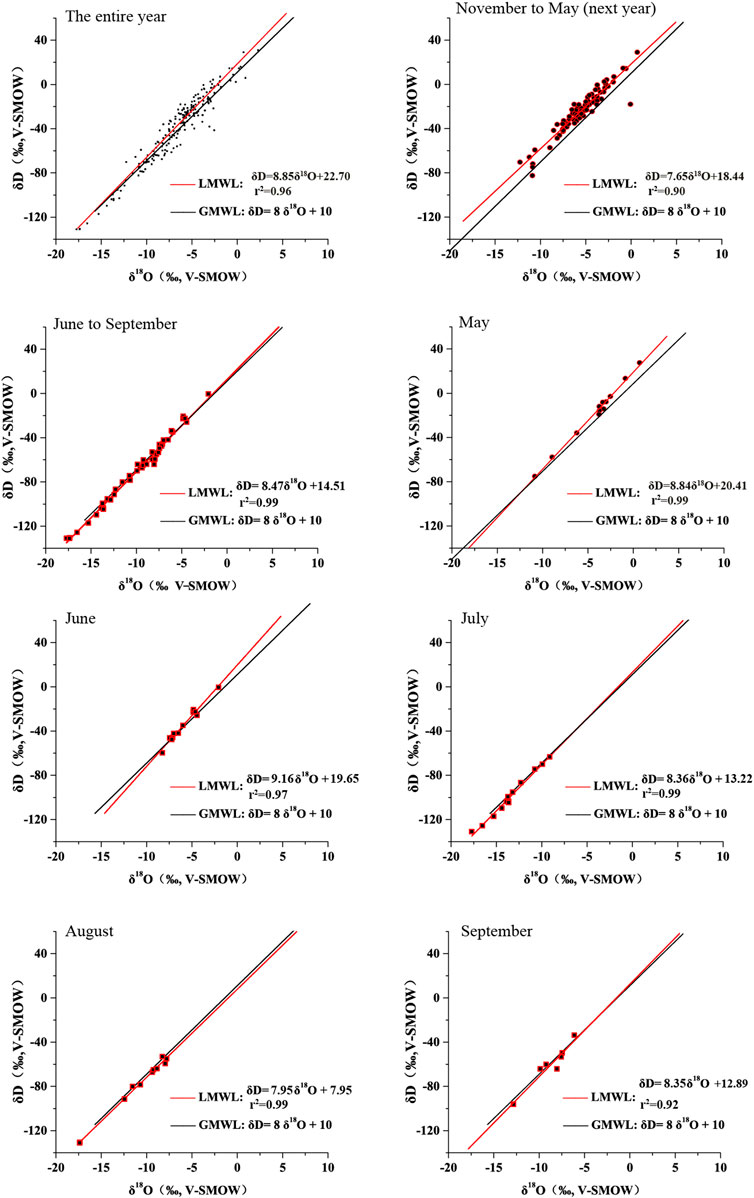
FIGURE 3. Linear regression lines conformed by the δ18Op and δD of the precipitation events in the study area during different periods. The GMWL is also included.
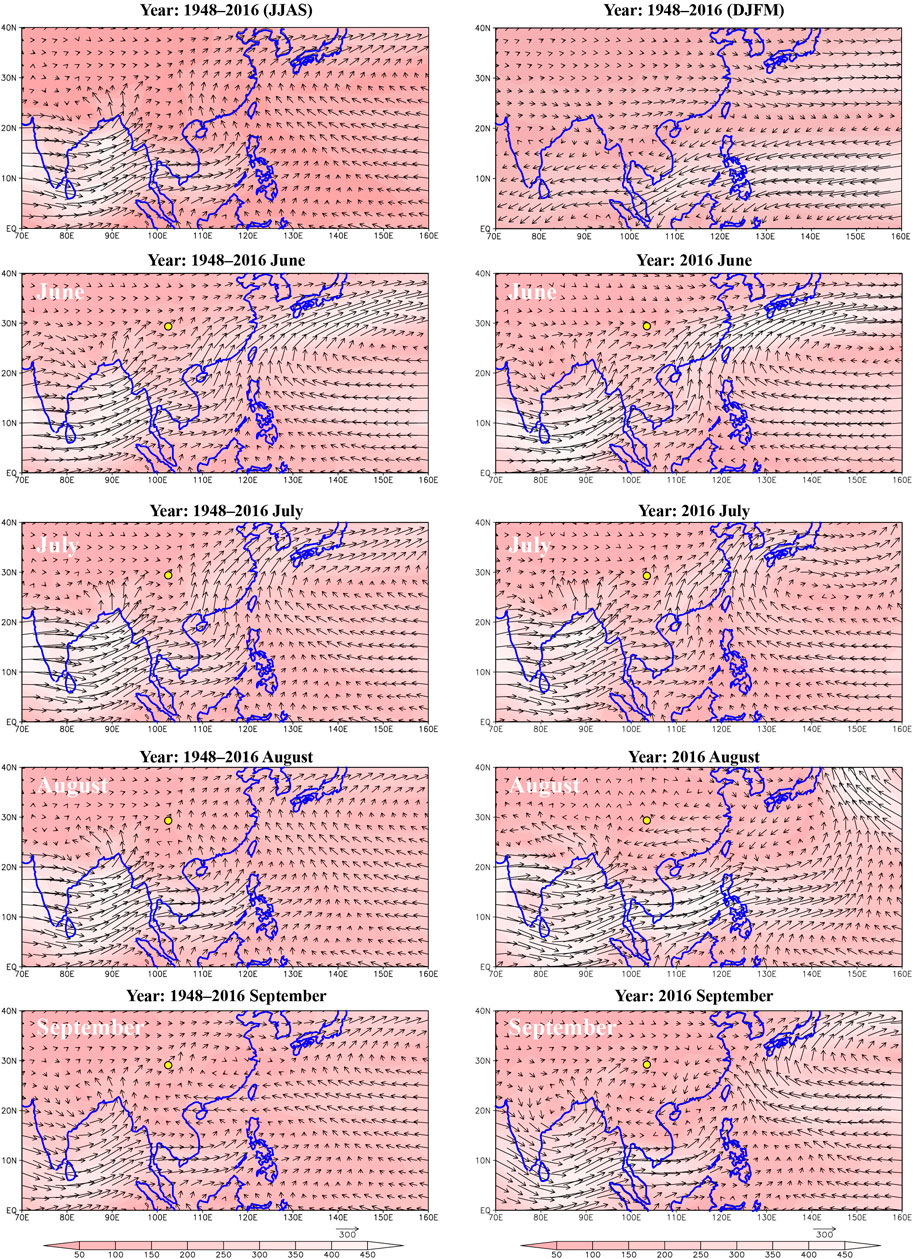
FIGURE 4. Moisture fluxes (kg m−1 s−1) integrated from 1,000 to 300 hPa during the wet season and dry season in 1948–2016 average, and comparisons of monthly moisture fluxes in wet seasons between 1948 and 2016a and 2016, respectively. Moisture fluxes (kg m−1s−1) and geopotential heights (gpm) are based on the monthly reanalysis data from the National Center for Environmental Prediction (NCEP) and the National Center for Atmospheric Research (NCAR).
It is worth noting that slope of LMWL in June is highest among the wet season (MJJAS), indicating the high relative humidity of atmosphere and the absence of evaporation. The situation can be attributed to the relatively low temperature (Supplementary Figure S4) and high rainfall amount in June. And indeed, the rainfall amount is highest along the year of 2016 (Figure 2) and highest of June rainfall in the past 40 years (Supplementary Figure S3) under the stable meteorological situation mainly maintained by the anomalously intensified WPSH in June of the super- El Niño 2016 (Figure 1A and Supplementary Figure S5, S6) (Zhang and Gao, 2016; Chen et al., 2017; Rao and Ren, 2017). On the other hand, although rainfall amount in June is highest, the intercepts, d-excess, δ18Op and δD values in June are apparently higher than that in July, August and September, which is very likely corresponding to the isotope enriched moisture/rainfall during the onset of monsoon (Cheng et al., 2012; Cheng et al., 2019). The land-sea temperature gradient before the onset of the summer monsoon was relatively small, the moisture source in our study area was thus mainly from the marginal ocean or continent, so that the precipitation δ18Op was heavier; the land-sea temperature gradient considerably increased after the summer monsoon onset, the atmospheric circulation scale become significantly larger, the moisture source was thus more from remote ocean (Figure 4), such that the precipitation δ18Op was lighter. Besides, the widely existing of large rivers, snowy mountains and dense forests may favor processes of continental recycled moisture and enrich the air masses with in this geographic area (Supplementary Figure S1) in June, the onset of the summer monsoon (Hoefs, 2009).
Therefore, the variations of LWML from wet season to dry season or from June to September basically indicates the increasing ratios of continental recycled moisture and the decreasing ratios of ocean moisture (depleted) relative to the total moisture, as the monsoon persistently weakens and decreases the ocean moistures deliver to study area. We also added the monthly weighted IsoGSM δ18Op data from 1979 to 2017, clearly showing the seasonal variations with the 18O-depleted values in the wet season and 18O-enriched in the dry season (Supplementary Figure S2). Besides, there is no significant correlation between the annually weighted IsoGSM δ18Op and SOI (r = -0.13, p > 0.1, n = 38), whereas the correlation coefficient between rainfall and SOI is obviously significant (r = -0.27, p < 0.01, n = 38) (Figure 1). Indeed, the super- El Niño 2016 have changed the distributions of monthly rainfall in wet season (June) through atmosphere systems, e.g., WPSH, but not the main isotopic compositions of moistures or precipitation.
The tropical oceanic moistures keep an almost constant northward component in the wet season (JJAS), usually reaching it northernmost influence during July, e.g., in the mean state of 1948–2016 or in the “super-El Niño” of 2016 (Figure 4), corresponding to the lowest values seen in the precipitation δ18O, δD and d-excess in July or August (Figure 2 and Supplementary Figure S3). The sharp decrease of δ-values is observed between June and July, reaching its minimum during the wet season when the most remote moistures were delivered to our site through a strong process of rainout or Rayleigh fractionation (Hoefs, 2009). This mechanism can account for the most depleted δ18O and δD reached during July of 2016, while the rainfall amount is not highest.
Based on meteorological data in Leshan station for the 1980–2010 period, the highest rainfall (around 300 mm) usually occurred in July and August, which is consistent with other stations of Ebian, Panzhihua and Emei cities around the study area (Supplementary Figure S4) (http://data.cma.cn/data/weatherBk.html). However, month with the highest precipitation in 2016 was June instead of July or August (Figure 2), perhaps corresponding to the super-El Niño event during that year 2016 (Zhang and Gao, 2016; Chen et al., 2017; Rao and Ren, 2017). And indeed, the CRU and GPCP data shows that rainfall amount in June 2016 is highest of June rainfall in the past 40 years (Supplementary Figure S3). Chinese researchers have long suggested that during the summer following El Niño, pronounced precipitation anomalies tend to take place in EASM regions (Xie et al., 2009; Cai and Tian, 2016; Zhang and Gao, 2016; Cai et al., 2017; Chen et al., 2017; Rao and Ren, 2017), causing major floods similar to what accounted during the summers of 1954 and 1998. The WPSH, which bridges the El Niño events and the precipitation in EASM region, is generally enhanced in boreal summer after El Niño events (Xie et al., 2009; Zhang and Gao, 2016; Chen and Li, 2018; Zhao et al., 2018). Indeed, during 2016 the WPSH intensity has clearly enhanced earlier and more intensively than usual, showing an enlarged size (Zhang and Gao, 2016; Chen et al., 2017; Rao and Ren, 2017) (Figure 1 and Supplementary Figure S5, S6), likely providing a stable meteorological situation to favor heavy rainfalls in June and July of 2016. As a consequence, intense floods were recorded during that summer, a disaster known as “7.19” which caused heavy economic losses in China (Rao and Ren, 2017).
Generally, the WPSH intensity reaches its maximum in July in the years without El Niño events (Supplementary Figure S5), usually consistent with the peak of rainfall amount in July or August in study area (Supplementary Figure S4). However, double rainfall peaks in wet season of 2016 have been shown in CRU and GPCP data (Figure 2). We attributed such double peak pattern to the unusually double peaks of WPSH intensity and area size (Supplementary Figure S5, S6), which can influence the study area very intensively. The WPSH exerts the control of the rainfall decreases seen in August of 2016, owing to that the strong sinking air of WPSH may occupy the study areas, shown by the anomalously prolonged western boundaries in August under the super El Niño (Supplementary Figure S5, S6). In September, the gradually weakening of the WPSH may lead to a synoptic situation more comparable to June, thus favoring the rainfall but shaping a second peak of rainfall amount less intense compared to the former one. Nevertheless, more meteorological and observational studies are critical to further assess the full role of the WPSH feedbacks in amending ASM rainfall.
This study presents new stable isotope data from November 2015 to October 2016 of δ18Op and δD of the precipitation in the area near Shenqi cave, southeast TP, west China. Despite the main forcing of local precipitation δ18O can be very different attending to the timescale, the following conclusions can be drawn:
1) Precipitation δ18O, δD and d-excess values have the seasonal pattern of low values during the wet season (JJAS) and relatively higher during the dry season (October to May of the following year).
2) Consequently, the equation of Local Meteoric Water Line (LMWL) was established in the year of super El Niño, δD = 8.84 δ18O+ 22.39. The further analysis of seasonal-monthly LMWL, companied with seasonally altered atmosphere moisture circulations and gradually depressed southerly moistures in wet season, suggested that changes in large-scale moisture sources/atmosphere circulations would be the key factor underlying the δ18Op fluctuations in study area at least on seasonal timescales.
3) The “super-El Niño” in 2016 have changed the distributions of monthly rainfall in wet season through the WPSH, but not mainly the precipitation isotopic compositions and moisture circulations in our study area.
The original contributions presented in the study are included in the article/Supplementary Material, further inquiries can be directed to the corresponding authors.
JZ, LT and HC obtained funding, conducted the field work, and conceptualized this study. XD, JZ, JW, and CP carried the experiments and data analysis. JZ and HZ helped organize fieldwork, sampling and provide samples. Accomplished the writing with the help of all co-authors.
This study is supported by the second Tibetan Plateau Scientific Expedition and Research (2019QZKK0101), National Natural Science Foundation of China (NSFC 42002199, 41888101, 41731174), Project (No. KDL&Guangxi202005) supported by Guangxi Key Science and Technology Innovation base on Karst Dynamics.
The authors declare that the research was conducted in the absence of any commercial or financial relationships that could be construed as a potential conflict of interest.
All claims expressed in this article are solely those of the authors and do not necessarily represent those of their affiliated organizations, or those of the publisher, the editors and the reviewers. Any product that may be evaluated in this article, or claim that may be made by its manufacturer, is not guaranteed or endorsed by the publisher.
We gratefully thank Professor Ashish Sinha for his kind comments of the climate modelling. We thank to the local farmer Shama Aluo for his kindly favors in the cave monitoring.
The Supplementary Material for this article can be found online at: https://www.frontiersin.org/articles/10.3389/feart.2022.795857/full#supplementary-material
An, Z., Guoxiong, W., Jianping, L., Youbin, S., Yimin, L., Weijian, Z., et al. (2015). Global Monsoon Dynamics and Climate Change. Annu. Rev. earth Planet. Sci. 43, 29–77. doi:10.1146/annurev-earth-060313-054623
Bar-Matthews, M., Ayalon, A., Gilmour, M., Matthews, A., and Hawkesworth, C. J. (2003). Sea-land Oxygen Isotopic Relationships from Planktonic Foraminifera and Speleothems in the Eastern Mediterranean Region and Their Implication for Paleorainfall during Interglacial Intervals. Geochimica et Cosmochimica Acta 67, 3181–3199. doi:10.1016/s0016-7037(02)01031-1
Cai, Z., and Tian, L. (2016). Atmospheric Controls on Seasonal and Interannual Variations in the Precipitation Isotope in the East Asian Monsoon Region. J. Clim. 29, 1339–1352. doi:10.1175/jcli-d-15-0363.1
Cai, Z., Tian, L., and Bowen, G. J. (2017). ENSO Variability Reflected in Precipitation Oxygen Isotopes across the Asian Summer Monsoon Region. Earth Planet. Sci. Lett. 475, 25–33. doi:10.1016/j.epsl.2017.06.035
Chen, C.-J., and Li, T.-Y. (2018). Geochemical Characteristics of Cave Drip Water Respond to ENSO Based on a 6-year Monitoring Work in Yangkou Cave, Southwest China. J. Hydrol. 561, 896–907. doi:10.1016/j.jhydrol.2018.04.061
Chen, L., Li, T., Wang, B., and Wang, L. (2017). Formation Mechanism for 2015/16 Super El Niño. Sci. Rep. 7, 2975. doi:10.1038/s41598-017-02926-3
Cheng, H., Sinha, A., Wang, X., Cruz, F. W., and Edwards, R. L. (2012). The Global Paleomonsoon as Seen through Speleothem Records from Asia and the Americas. Clim. Dyn. 39, 1045–1062. doi:10.1007/s00382-012-1363-7
Cheng, H., Edwards, R. L., Sinha, A., Spötl, C., Yi, L., Chen, S., et al. (2016). The Asian Monsoon over the Past 640,000 Years and Ice Age Terminations. Nature 534, 640–646. doi:10.1038/nature18591
Cheng, H., Zhang, H., Zhao, J., Li, H., Ning, Y., and Kathayat, G. (2019). Chinese Stalagmite Paleoclimate Researches: A Review and Perspective. Sci. China Earth Sci. 62, 1489–1513. doi:10.1007/s11430-019-9478-3
Cheng, H., Zhang, H., Cai, Y., Shi, Z., Yi, L., Deng, C., et al. (2021). Orbital-scale Asian Summer Monsoon Variations: Paradox and Exploration. Sci. China Earth Sci. 64, 529–544. doi:10.1007/s11430-020-9720-y
Chiang, J. C. H., Fung, I. Y., Wu, C.-H., Cai, Y., Edman, J. P., Liu, Y., et al. (2015). Role of Seasonal Transitions and westerly Jets in East Asian Paleoclimate. Quat. Sci. Rev. 108, 111–129. doi:10.1016/j.quascirev.2014.11.009
Clemens, S. C., Prell, W. L., and Sun, Y. (2010). Orbital-scale Timing and Mechanisms Driving Late Pleistocene Indo-Asian Summer Monsoons: Reinterpreting Cave speleothemδ18O. Paleoceanography 25, n–a. doi:10.1029/2010pa001926
Cobb, K. M., Adkins, J. F., Partin, J. W., and Clark, B. (2007). Regional-scale Climate Influences on Temporal Variations of Rainwater and Cave Dripwater Oxygen Isotopes in Northern Borneo. Earth Planet. Sci. Lett. 263, 207–220. doi:10.1016/j.epsl.2007.08.024
Craig, H. (1961). Isotopic Variations in Meteoric Waters. Science 133, 1702–1703. doi:10.1126/science.133.3465.1702
Dansgaard, W. (1964). Stable Isotopes in Precipitation. Tellus 16, 436–468. doi:10.3402/tellusa.v16i4.8993
Dayem, K. E., Molnar, P., Battisti, D. S., and Roe, G. H. (2010). Lessons Learned from Oxygen Isotopes in Modern Precipitation Applied to Interpretation of Speleothem Records of Paleoclimate from Eastern Asia. Earth Planet. Sci. Lett. 295, 219–230. doi:10.1016/j.epsl.2010.04.003
Duan, W., Ruan, J., Luo, W., Li, T., Tian, L., Zeng, G., et al. (2016). The Transfer of Seasonal Isotopic Variability between Precipitation and Drip Water at Eight Caves in the Monsoon Regions of China. Geochimica et Cosmochimica Acta 183, 250–266. doi:10.1016/j.gca.2016.03.037
Fairchild, I. J., and Baker, A. (2012). Speleothem Science: From Process to Past Environments. John Wiley & Sons.
Feng, W., Casteel, R. C., Banner, J. L., and Heinze-Fry, A. (2014). Oxygen Isotope Variations in Rainfall, Drip-Water and Speleothem Calcite from a Well-Ventilated Cave in Texas, USA: Assessing a New Speleothem Temperature Proxy. Geochimica et Cosmochimica Acta 127, 233–250. doi:10.1016/j.gca.2013.11.039
Fleitmann, D., Burns, S. J., Neff, U., Mudelsee, M., Mangini, A., and Matter, A. (2004). Palaeoclimatic Interpretation of High-Resolution Oxygen Isotope Profiles Derived from Annually Laminated Speleothems from Southern Oman. Quat. Sci. Rev. 23, 935–945. doi:10.1016/j.quascirev.2003.06.019
Frappier, A. B., Sahagian, D., Carpenter, S. J., González, L. A., and Frappier, B. R. (2007). Stalagmite Stable Isotope Record of Recent Tropical Cyclone Events. Geol 35, 111–114. doi:10.1130/g23145a.1
Fricke, H. C., and O'Neil, J. R. (1999). The Correlation between 18O/16O Ratios of Meteoric Water and Surface Temperature: its Use in Investigating Terrestrial Climate Change over Geologic Time. Earth Planet. Sci. Lett. 170, 181–196. doi:10.1016/s0012-821x(99)00105-3
Genty, D., Labuhn, I., Hoffmann, G., Danis, P. A., Mestre, O., Bourges, F., et al. (2014). Rainfall and Cave Water Isotopic Relationships in Two South-France Sites. Geochimica et Cosmochimica Acta 131, 323–343. doi:10.1016/j.gca.2014.01.043
Johnson, K. R., and Ingram, B. L. (2004). Spatial and Temporal Variability in the Stable Isotope Systematics of Modern Precipitation in China: Implications for Paleoclimate Reconstructions. Earth Planet. Sci. Lett. 220, 365–377. doi:10.1016/s0012-821x(04)00036-6
Johnston, V. E., Borsato, A., Spötl, C., Frisia, S., and Miorandi, R. (2013). Stable Isotopes in Caves over Altitudinal Gradients: Fractionation Behaviour and Inferences for Speleothem Sensitivity to Climate Change. Clim. Past 9, 99–118. doi:10.5194/cp-9-99-2013
Kong, W., Swenson, L. M., and Chiang, J. C. H. (2017). Seasonal Transitions and the Westerly Jet in the Holocene East Asian Summer Monsoon. J. Clim. 30, 3343–3365. doi:10.1175/jcli-d-16-0087.1
Lachniet, M. S. (2009). Climatic and Environmental Controls on Speleothem Oxygen-Isotope Values. Quat. Sci. Rev. 28, 412–432. doi:10.1016/j.quascirev.2008.10.021
Lases-Hernández, F., Medina-Elizalde, M., and Frappier, A. B. (2020). Drip Water δ18O Variability in the Northeastern Yucatán Peninsula, Mexico: Implications for Tropical Cyclone Detection and Rainfall Reconstruction from Speleothems. Geochimica et Cosmochimica Acta 285, 237–256. doi:10.1016/j.gca.2020.07.008
Lewis, S. C., Legrande, A. N., Kelley, M., and Schmidt, G. A. (2013). Modeling Insights into Deuterium Excess as an Indicator of Water Vapor Source Conditions. J. Geophys. Res. Atmos. 118, 243–262. doi:10.1029/2012jd017804
Li, T.-Y., Shen, C.-C., Li, H.-C., Li, J.-Y., Chiang, H.-W., Song, S.-R., et al. (2011). Oxygen and Carbon Isotopic Systematics of Aragonite Speleothems and Water in Furong Cave, Chongqing, China. Geochimica et Cosmochimica Acta 75, 4140–4156. doi:10.1016/j.gca.2011.04.003
Luo, W., Wang, S., Zeng, G., Zhu, X., and Liu, W. (2014). Daily Response of Drip Water Isotopes to Precipitation in Liangfeng Cave, Guizhou Province, SW China. Quat. Int. 349, 153–158. doi:10.1016/j.quaint.2014.01.043
Maher, B. A. (2008). Holocene Variability of the East Asian Summer Monsoon from Chinese Cave Records: a Re-assessment. The Holocene 18, 861–866. doi:10.1177/0959683608095569
Mangini, A., Spötl, C., and Verdes, P. (2005). Reconstruction of Temperature in the Central Alps during the Past 2000 Yr from a δ18O Stalagmite Record. Earth Planet. Sci. Lett. 235, 741–751. doi:10.1016/j.epsl.2005.05.010
McDermott, F., Atkinson, T. C., Fairchild, I. J., Baldini, L. M., and Mattey, D. P. (2011). A First Evaluation of the Spatial Gradients in δ18O Recorded by European Holocene Speleothems. Glob. Planet. Change 79, 275–287. doi:10.1016/j.gloplacha.2011.01.005
Ming, T. (2016). Circulation Background of Climate Patterns in the Past Millennium: Uncertainty Analysis and Re-reconstruction of ENSO-like State. Sci. China 59, 1225–1241. doi:10.1007/s11430-015-5256-6
Moreno, A., Iglesias, M., Azorin-Molina, C., Pérez-Mejías, C., Bartolomé, M., Sancho, C., et al. (2021). Measurement Report: Spatial Variability of Northern Iberian Rainfall Stable Isotope Values - Investigating Atmospheric Controls on Daily and Monthly Timescales. Atmos. Chem. Phys. 21, 10159–10177. doi:10.5194/acp-21-10159-2021
Pérez-Mejías, C., Moreno, A., Sancho, C., Bartolomé, M., Stoll, H., Osácar, M. C., et al. (2018). Transference of Isotopic Signal from Rainfall to Dripwaters and Farmed Calcite in Mediterranean Semi-arid Karst. Geochimica et Cosmochimica Acta 243, 66–98. doi:10.1016/j.gca.2018.09.014
Rao, J., and Ren, R. (2017). Parallel Comparison of the 1982/83, 1997/98 and 2015/16 Super El Niños and Their Effects on the Extratropical Stratosphere. Adv. Atmos. Sci. 34, 1121–1133. doi:10.1007/s00376-017-6260-x
Rozanski, K., Sonntag, C., and Münnich, K. O. (1982). Factors Controlling Stable Isotope Composition of European Precipitation. Tellus 34, 142–150. doi:10.3402/tellusa.v34i2.10796
Sun, Z., Yang, Y., Zhao, J., Tian, N., and Feng, X. (2018). Potential ENSO Effects on the Oxygen Isotope Composition of Modern Speleothems: Observations from Jiguan Cave, central China. J. Hydrol. 566, 164–174. doi:10.1016/j.jhydrol.2018.09.015
Tan, L., Cai, Y., An, Z., Edwards, R. L., Cheng, H., Shen, C.-C., et al. (2011). Centennial- to Decadal-Scale Monsoon Precipitation Variability in the Semi-humid Region, Northern China during the Last 1860 years: Records from Stalagmites in Huangye Cave. The Holocene 21, 287–296. doi:10.1177/0959683610378880
Tan, L., An, Z., Huh, C.-A., Cai, Y., Shen, C.-C., Shiau, L.-J., et al. (2014). Cyclic Precipitation Variation on the Western Loess Plateau of China during the Past Four Centuries. Sci. Rep. 4, 6381. doi:10.1038/srep06381
Tan, L., Cheng, H., Cai, Y., Cheng, H., Lawrence Edwards, R., Shen, C.-C., et al. (2015). Climate Significance of Speleothem δ18O from central China on Decadal Timescale. J. Asian Earth Sci. 106, 150–155. doi:10.1016/j.jseaes.2015.03.008
Tan, L., Cai, Y., Cheng, H., Edwards, L. R., Lan, J., Zhang, H., et al. (2018). High Resolution Monsoon Precipitation Changes on southeastern Tibetan Plateau over the Past 2300 Years. Quat. Sci. Rev. 195, 122–132. doi:10.1016/j.quascirev.2018.07.021
Tan, M. (2014). Circulation Effect: Response of Precipitation δ18O to the ENSO Cycle in Monsoon Regions of China. Clim. Dyn. 42, 1067–1077. doi:10.1007/s00382-013-1732-x
Vecchi, G. A., Soden, B. J., Wittenberg, A. T., Held, I. M., Leetmaa, A., and Harrison, M. J. (2006). Weakening of Tropical Pacific Atmospheric Circulation Due to Anthropogenic Forcing. Nature 441, 73–76. doi:10.1038/nature04744
Wang, Y. J., Cheng, H., Edwards, R. L., An, Z. S., Wu, J. Y., Shen, C.-C., et al. (2001). A High-Resolution Absolute-Dated Late Pleistocene Monsoon Record from Hulu Cave, China. Science 294, 2345–2348. doi:10.1126/science.1064618
Wang, B., Xiang, B., and Lee, J.-Y. (2013). Subtropical High Predictability Establishes a Promising Way for Monsoon and Tropical Storm Predictions. Proc. Natl. Acad. Sci. 110, 2718–2722. doi:10.1073/pnas.1214626110
Xie, S.-P., Hu, K., Hafner, J., Tokinaga, H., Du, Y., Huang, G., et al. (2009). Indian Ocean Capacitor Effect on Indo-Western Pacific Climate during the Summer Following El Niño. J. Clim. 22, 730–747. doi:10.1175/2008jcli2544.1
Yang, Y., Yang, R., Cao, J., Zhao, J., Cheng, H., and Wang, J. (2019). Relationship between the Asian Summer Monsoon Circulation and Speleothem δ18O of Xiaobailong Cave. Clim. Dyn. 53, 6351–6362. doi:10.1007/s00382-019-04935-6
Yonge, C. J., Ford, D. C., Gray, J., and Schwarcz, H. P. (1985). Stable Isotope Studies of Cave Seepage Water. Chem. Geology. Isotope Geosci. Section 58, 97–105. doi:10.1016/0168-9622(85)90030-2
Yoshimura, K., Kanamitsu, M., Noone, D., and Oki, T. (2008). Historical Isotope Simulation Using Reanalysis Atmospheric Data. J. Geophys. Res. 113. doi:10.1029/2008jd010074
Yuan, D., Cheng, H., Edwards, R. L., Dykoski, C. A., Kelly, M. J., Zhang, M., et al. (2004). Timing, Duration, and Transitions of the Last Interglacial Asian Monsoon. Science 304, 575–578. doi:10.1126/science.1091220
Zhang, P., Cheng, H., Edwards, R. L., Chen, F., Wang, Y., Yang, X., et al. (2008). A Test of Climate, Sun, and Culture Relationships from an 1810-year Chinese Cave Record. Science 322, 940–942. doi:10.1126/science.1163965
Zhang, R.-H., and Gao, C. (2016). The IOCAS Intermediate Coupled Model (IOCAS ICM) and its Real-Time Predictions of the 2015-2016 El Niño Event. Sci. Bull. 61, 1061–1070. doi:10.1007/s11434-016-1064-4
Zhao, J., Cheng, H., Yang, Y., Tan, L., Spötl, C., Ning, Y., et al. (2018). Reconstructing the Western Boundary Variability of the Western Pacific Subtropical High over the Past 200 Years via Chinese Cave Oxygen Isotope Records. Clim. Dyn. 52, 3741–3757. doi:10.1007/s00382-018-4456-0
Zhao, J., Cheng, H., Yang, Y., Liu, W., Zhang, H., Li, X., et al. (2021). Role of the Summer Monsoon Variability in the Collapse of the Ming Dynasty: Evidences from Speleothem Records. Geophys. Res. Lett. 48, e2021GL093071. doi:10.1029/2021gl093071
Keywords: precipitation δ18O, monsoon, super-El Niño, moisture circulations, LMWL
Citation: Zhao J, Tan L, Li D, Pérez-Mejías C, Dong X, Wang J, Zhang H and Cheng H (2022) The Seasonally Altered Atmosphere Moisture Circulations With Rainfall and Rainfall Isotopes in Southwest China. Front. Earth Sci. 10:795857. doi: 10.3389/feart.2022.795857
Received: 15 October 2021; Accepted: 18 January 2022;
Published: 11 February 2022.
Edited by:
Valdir Felipe Novello, University of Tübingen, GermanyReviewed by:
Jagoda Crawford, Australian Nuclear Science and Technology Organisation, AustraliaCopyright © 2022 Zhao, Tan, Li, Pérez-Mejías, Dong, Wang, Zhang and Cheng. This is an open-access article distributed under the terms of the Creative Commons Attribution License (CC BY). The use, distribution or reproduction in other forums is permitted, provided the original author(s) and the copyright owner(s) are credited and that the original publication in this journal is cited, in accordance with accepted academic practice. No use, distribution or reproduction is permitted which does not comply with these terms.
*Correspondence: Jingyao Zhao, emp5MTIzMEB4anR1LmVkdS5jbg==; Liangcheng Tan, dGFubGNoQGllZWNhcy5jbg==
†These authors have contributed equally to this work
Disclaimer: All claims expressed in this article are solely those of the authors and do not necessarily represent those of their affiliated organizations, or those of the publisher, the editors and the reviewers. Any product that may be evaluated in this article or claim that may be made by its manufacturer is not guaranteed or endorsed by the publisher.
Research integrity at Frontiers
Learn more about the work of our research integrity team to safeguard the quality of each article we publish.