 Inigo Irarrazaval1,2,3*
 Alejandro Dussaillant3,4
 Sebastián Vivero1
 Pablo Iribarren-Anacona5
 Gregoire Mariethoz1
- 1Institute of Earth Surface Dynamics, Faculty of Geosciences, University of Lausanne, Lausanne, Switzerland
- 2Centro de Investigación en Ecosistemas de la Patagonia, Coyhaique, Chile
- 3Departamento de Ciencias Naturales y Tecnología, Universidad de Aysén, Coyhaique, Chile
- 4Department of Natural Sciences, Middlesex University, London, United Kingdom
- 5Institute of Earth Science, University Austral Chile, Valdivia, Chile
Proglacial lakes are ubiquitous features formed during deglaciarization and are currently increasing in number in Patagonia and elsewhere. Proglacial lakes can affect glacier dynamics, catchment hydrology and have the potential to cause glacial lake outburst floods. Therefore, monitoring the onset and development of proglacial lake formation is relevant to understand glacial processes and anticipate glacier response to climate change. In this study, we integrate geomorphological and ice-dynamic information to assess proglacial lake development in Exploradores Glacier, Chilean Patagonia. We monitor recent spatial and temporal changes in the lower trunk of Exploradores Glacier (10 km2) to provide a 20-year observation record by combining eight uncrewed aerial vehicles (UAV) surveys between 2019 and 2020, with high-medium resolution satellite imagery (Rapid Eye and Landsat) between 2000 and 2018. We use feature tracking techniques, digital surface elevation model analysis and field data to create a multi-temporal scale (inter-annual and seasonal) and a multi-spatial (cm to km) data set. Our analysis shows that surface velocity overall trend has not changed over the last 20 years and that surface velocity near the terminus is significant (>10 m a−1). Moreover, an exceptional advance over moraine deposits was detected. We also found low downwasting rates (<0.5 m a−1) close to the glacier terminus which are attributed to sufficient ice flux and the insulation effect of the debris-covered surface. However, hundreds of supraglacial ponds were observed and are currently coalescing and expanding by ice-cliff backwasting favoring glacier disintegration. Lastly, it was found that calving losses at the east marginal lake equaled ice-flux input into the lake for the UAV monitored period. This study contributes to a better understanding of glacial lake dynamics during proglacial lake development, and our results may help ice modelling efforts to predict glacier response to future climate scenarios.
1 Introduction
Proglacial lakes have reportedly grown in number and size across different mountain regions such as the Southern Alps of New Zealand, the Himalayas and Patagonian Andes (e.g., Kirkbride, 1993; Sakai and Fujita, 2010; Carrivick and Tweed, 2013; Loriaux and Casassa, 2013; Iribarren Anacona et al., 2014; Nie et al., 2017; Shukla et al., 2018; Shugar et al., 2020; Zhang et al., 2021). Proglacial lake development can alter ice dynamics by several mechanisms such as flotation of the glacier’s terminus, formation of a calving front, and increased ice flow (e.g., Robertson et al., 2012; Tsutaki et al., 2013; Tsutaki et al., 2019). In addition, proglacial lake development can enhance mass loss by adding frontal ablation components such as calving and subaerial melting (e.g., Benn et al., 2007; Sakai et al., 2009; Minowa et al., 2017). In the Himalayas, studies have found that the rate of loss of area of lake terminating glaciers is five to six times greater than land terminating glaciers (e.g., King et al., 2018; King et al., 2019; Maurer et al., 2019; Watson et al., 2020). Moreover, glacial lakes represent a potential risk for glacial lake outburst floods (GLOFs), which can damage infrastructure and incur considerable socioeconomic impact (Tweed and Russell, 1999; Iribarren Anacona et al., 2015; Carrivick and Tweed, 2016). Glacial lake outburst floods in Patagonia have occurred through the actual deglacierization period (e.g., Davies et al., 2020; Benito et al., 2021), and they are currently a major concern in Patagonia as they are likely to increase in frequency in the future (Dussaillant et al., 2010). With predictions of climate change, glaciers will continue to retreat (e.g., Vaughan et al., 2013). Therefore, the study of the onset and development of proglacial lakes is relevant to improve the understanding and prediction of glacier response to climate change in future environmental systems (e.g., Carrivick and Tweed, 2016).
The development of ice-contact proglacial lakes have demonstrated complex system interdependencies and feedback mechanisms, which can be partially decoupled from climate (e.g., Kirkbride, 1993). Glacier-lake interaction can often present tipping points or switching behavior: the formation of a proglacial lake and a calving front can shift the glacier from slow to fast retreat (Kirkbride and Warren, 1999). Examples of studies on proglacial lake formation include: the Southern Alps of New Zealand (e.g., Kirkbride, 1993; Kirkbride and Warren, 1999; Purdie and Fitzharris, 1999; Quincey and Glasser, 2009; Dykes et al., 2011), the European Alps (e.g., Tsutaki et al., 2013), Iceland (e.g., Baurley et al., 2020), and the Himalayas (e.g., Haritashya et al., 2018; King et al., 2018; Tsutaki et al., 2019; Sato et al., 2021a). In particular, proglacial lake formation associated with the disintegration of debris-covered glaciers has been generalized in a three-phase sequence of retreat (e.g., Kirkbride, 1993; Purdie and Fitzharris, 1999; Quincey and Glasser, 2009; Sakai et al., 2009; Benn et al., 2012). First, there is a phase of slow downwasting, under a thickening supraglacial debris-cover. Debris-thickness and melt rate relationships are describe by the Østrem curve (Østrem, 1959), where the formation of a few centimeters debris layer can isolate ice and reduce ablation (e.g., Pellicciotti et al., 2015). Second, the glacier transits to a phase where the debris-covered area is disrupted by the development of supraglacial ponds, streams and ice cliffs, leading to the characteristic hummocky texture (e.g., Mölg et al., 2020). Moreover, ice cliffs and supraglacial ponds can act as melt hotspots (e.g., Buri et al., 2021). Supraglacial ponds can contribute to ablation forming thermo-erosional notches or melt water undercutting which increases calving (e.g., Röhl, 2006; Sakai et al., 2009). In addition, ice cliffs expose clean ice walls enhancing ablation by ice-cliff backwasting (e.g., Miles et al., 2017; Brun et al., 2018; Steiner et al., 2019; Buri et al., 2021). It has been noted that supraglacial pond coalescence is favorable when glacier surface has a low gradient (<2°) and surface velocity is lower than 10 m a−1 (Reynolds, 2000; Quincey et al., 2007). Lastly, the debris-covered area disintegration can lead to the development of a calving front and a phase of rapid calving retreat through an overdeepened glacially-excavated depression (e.g., Kirkbride, 1993; Warren and Aniya, 1999; King et al., 2018; Tsutaki et al., 2019).
However, processes associated with proglacial lake development and the disintegration of debris-covered glaciers need to be better characterized to improve estimates of ablation and feedback mechanisms. Understanding small-scale process as well as a detailed relief and surface characterization is required for accurately modelling energy balances and ice dynamics (e.g., Mölg et al., 2020). Ice-contact proglacial lakes and their influence on ice dynamics remain poorly quantified and their incorporation into glacier evolution numerical models remain challenging (e.g., Carrivick et al., 2020; Sutherland et al., 2020). Yet, recent advances in uncrewed aerial vehicles (UAVs) and Structure-from-Motion Multi-View Stereo (SfM-MVS) photogrammetric methods have allowed monitoring and quantifying changes in glacial features. Examples of surface characteristics studies by UAV include: surface velocity (e.g., Kraaijenbrink P. et al., 2016; Bhardwaj et al., 2016; Rossini et al., 2018; Benoit et al., 2019), glacier downwasting (Immerzeel et al., 2014), ice-cliff backwasting (e.g., Steiner et al., 2019; Mölg et al., 2020; Sato et al., 2021b), and supraglacial pond development (e.g., Kraaijenbrink P. et al., 2016; Miles et al., 2017). The UAVs derived products have provided insights into mechanisms that are only possible to observe by high resolution images and high-density point clouds (e.g., Rossini et al., 2018; Watson et al., 2018). Moreover, UAVs have become useful tools to reduce the gap between different spatial scales from satellite images to field observations.
This work investigates glacier-lake interaction processes at Exploradores Glacier, Patagonia, located at the north of the Northern Patagonian Ice Field (NPI). The objective of this study is to characterize and monitor the spatial and temporal changes on the glacier surface over the last 20 years. We integrate geomorphological and ice-dynamics analysis to characterize main controls (i.e., surface downwasting, surface velocity and pond coalescence) of the proglacial lake development.
The study incorporates recent UAV and archival satellite imagery to observe ice and lake changes in multi-temporal scales (inter-annual, seasonal) and multi-spatial (cm to whole ablation area). The UAV images are analyzed by feature tracking to determine surface velocity, digital surface models (DSMs) comparison and by mapping surface features (e.g., crevasses and supraglacial ponds). Due to challenging terrain access, the UAV-SfM products are not well registered with robust tie points off-glacier terrain. However, the degree of detected displacement and morphological changes are greater than the uncertainty so that it would not affect the findings. The data set is complemented with water level monitoring in supraglacial ponds and lakes as well as meteorological data.
It is worth noting that most studies in Patagonian glaciers have focused on one aspect of ice dynamics, such as mass balance or ice thickness estimations. More research is needed towards integrating ice dynamic responses to climate change at the individual glacier scale (e.g., Bown et al., 2019; Falaschi et al., 2019). Lastly, Exploradores Glacier is a recognized tourist destination for glacier walking tours, where up to one hundred visitors hike each day during summer. A transition to a fast retreating phase and development of a proglacial lake could not only impact ice dynamics but tourist guiding services which supports local economy (Bañales-Seguel et al., 2020).
2 Study Site
Exploradores Glacier (46.5714°S, 73.2463°W) is located at the north of the North Patagonian Ice Field (NPI). The NPI is comprised of 38 main glaciers, including 18 lacustrine calving glaciers (covering 64% of the surface area), 19 land terminating glaciers (covering 18% surface area) and one tidewater glacier covering 18% of the surface area (RGI, 2017; Collao-Barrios et al., 2018). Overall the NPI mass balances are negative (e.g., Jaber et al., 2016; Dussaillant et al., 2018; Dussaillant et al., 2019b; Minowa et al., 2021) and predicted mass-loss rates are likely to continue increasing towards the end of the century (e.g., Schaefer et al., 2013). Exploradores Glacier has a surface area of 85.9 km2 (RGI, 2017), an elevation range from ∼180 to 3,900 m. asl (Figure 1). Geodetic mass balance measurements for the period 2000–2014 indicate that the glacier is losing mass at a rate of −1.01 ± 0.12 m w.e. a−1 (Dussaillant et al., 2018). The glacier is influenced by westerly airflows that deliver large year-round quantities of precipitation (e.g., Carrasco et al., 2002).

FIGURE 1. (A) Exploradores Glacier (WGS84). (B) Aerial photo of Exploradores Glacier (credit to Guy Wenborne). Highest peak corresponds to Mount St. Valentín (4,032 m a.s.l.).
The main trunk of Exploradores glacier receives inputs from two tributaries, Bayo Glacier and an unnamed glacier from the west (Figure 1; RGI, 2017). The accumulation area lies below the north face of Mount San Valentin (4,032 m asl). The equilibrium line altitude (ELA) is located at ca. 1,200 m asl (Rivera et al., 2007) and the glacier has an accumulation area ratio of 0.62 (Willis et al., 2012). Also, there is a prominent icefall located in between the accumulation and ablation areas that extends from ∼500 to 1,500 m asl (Figure 1A). At this icefall, surface velocities are in the order of ∼300–600 m a−1 (Mouginot and Rignot, 2015; Gardner et al., 2019). The ablation area has a low gradient (<1°), covering an area of 20 km2 and ranging in elevation from 170 to 500 m asl. Recent ice-thickness model estimations in the ablation area indicate a prominent bed overdeepening with a maximum ice thickness of 570 m (Farinotti et al., 2019).
The debris-covered area spreads up to 2 km from the terminus and extends further up in medial moraines. Near the glacier terminus, the debris-covered area is disrupted by several supraglacial ponds (Figure 1). A marginal lake is currently expanding by calving at the confluence of Chileno Valley and the main trunk of Exploradores Glacier (e.g., Loriaux and Casassa, 2013). We refer to this lake as the east marginal lake (Figure 1). Lastly, the proglacial stream (Deshielo River, Figure 1) originates from a moraine-dammed lake, hereafter referred to as the terminal lake.
The study area (10 km2) is located in the lower section of the ablation area of the main trunk of Exploradores Glacier (Figure 1). In this area, precipitation models estimate nearly 2000 mm of annual precipitation for the last 35 years (Funk et al., 2015). However, precipitation up to 3,000 mm annually has been measured for the 2003–2005 period close to the terminus (Aniya et al., 2007). During the year 2019, a mean annual air temperature of 7°C has been measured in a meteorological station located on the glacier (Figure 1), with only 4 days reaching minimum temperatures below 0°C. In addition, ablation stakes installed in the lower trunk of the glacier (Figure 2) by the Chilean Water Directorate were monitored. Summer ablation rates for the surveyed period (2019–2020), assuming an ice density of 900 kg m3, ranged from 30 to 100 mm d−1 w.e. (Figure 2; Supplementary Table S3). The observed meteorological conditions and ablation rates for years 2019–2020 are comparable to those found in previous studies in 2003–2005 (Aniya et al., 2007; Konya and Matsumoto, 2010). Water levels from the east marginal lake, terminal lake, and one supraglacial pond (Figure 2) were monitored by installing HOBO U20L temperature and pressure transducers for the period (20-January-2019 to 29-May-2020). Pressure transducer measurements were corrected by atmospheric pressure variations, and georeferenced using dGNSS to obtain water levels. In addition, on 28-May-2020 water elevation levels of several supraglacial ponds located near the terminus were measured using a differential GNSS (Figure 2). The survey, conducted in a time span of 3 hours (to minimize diurnal oscillations), indicated that all surveyed pods shared similar water elevation ±50 cm.

FIGURE 2. (A) Reference UAV orthoimage. (B) DSM and elevation difference computed from dGNSS track. Red boxes a, b, and c indicate map extent on Figures 6A–C respectively. (C) Histogram of elevation differences DSM—dGNSS.
In addition, two recent GLOFs have been reported on Exploradores Glacier. In 2015 a debris flow entered Chileno Lake, located in Chileno Valley (Figure 1A), triggering a GLOF that drained an estimated volume of 105 × 106 m3 of water over 7 days (Wilson et al., 2019). In April 2018, the failure of a lateral moraine located in Bayo Glacier, drained Triángulo Lake (0.95 km2) (Loriaux and Casassa, 2013). During the GLOF event, water discharge entered the main trunk of Exploradores Glacier and drained supra- and sub-glacially, damaging a gauging station located downstream. Rough estimates of peak discharge at Exploradores Glacier proglacial stream indicate 350 m3 s−1 (Bañales-Seguel et al., 2020) and an approximate drained volume of ∼20 × 106 m3 (Chilean-Water-Directorate, 2018). Up to date, the event has not been studied in detail (Bañales-Seguel et al., 2020).
3 Data and Methods
3.1 Uncrewed Aerial Vehicle Surveys
3.1.1 Data Acquisition
The UAV survey area extends 4 km from the glacier front with a width up to 3 km and an elevation range from 170 to 220 m asl, covering the lower trunk of Exploradores Glacier and its margins (Figure 1). We conducted eight UAVs surveys between March 2019 and May 2020. A fixed wing autonomous eBee Classic from SenseFly UAV equipped with a 20 Mpx SenseFly S.O.D.A 10.5 mm focal length camera (global shutter system) was employed. The camera is static within the UAV, and images are nearly nadir. Flight plans were designed in Emotion 3 with 60% lateral and 80% longitudinal overlaps, and a target image resolution of 8.5 cm px−1. Most UAV flights were deployed from the glacier surface near the AWS (Figure 1). Four to seven flights were needed to complete each survey, and approximately 1,100 images were obtained on each survey (Table 1).
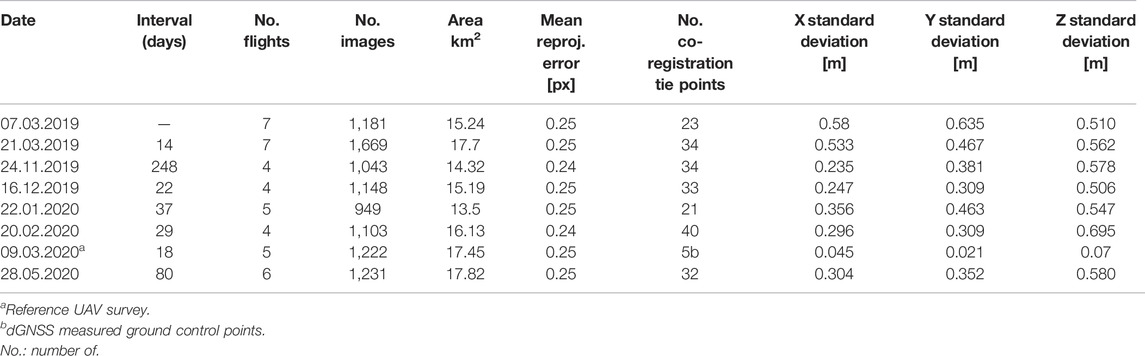
TABLE 1. UAVs image acquisition and co-registration data.
We measured five ground control points (GCPs) to georeference the UAV survey from 9 March 2020 (see Section 3.1.2). The GCPs marks were laid in the frontal moraine and on the glacier surface as the lateral moraines are inaccessible (Figures 1, 2). The GCPs measurements were done employing a single frequency (L1) Emlid Reach RS + differential GNSS (dGNSS) setup (base and rover receivers). The base station was located on a stable boulder off glacier, where a screw was fixed in place to facilitate the same occupation during all surveys (Figure 2B). Before each survey, the base station was initialized for at least 30 min before the first measurement. The rover receiver was configured in kinematic mode with a logging interval of 1 s. Maximum baseline lengths were up to 5 km, and occupation time for each GCP was 1 min. A post-processing kinematic (PPK) treatment of the raw receiver data (RINEX) was done by RTKlib version 2.4.3 Emlid b28 (Takasu and Yasuda, 2009), following settings suggested by Emlid Reach RS + manufacturer. We only consider points that are resolved on a fixed precision for analysis. The PPK solution reached horizontal and vertical precisions in the order of 5 cm horizontally and 10 cm, respectively. For the reference UAV survey (09 March 2020), the GCP measurements during the dGNSS survey were acquired with less than 4 hours difference from the UAV survey.
3.1.2 Data Processing
The UAV images were processed using a SfM-MVS workflow in Pix4Dmapper Pro version 4.4.12 (Vallet et al., 2011). The first step consists of a bundle adjustment comprising key point extraction/matching, a self-calibration of camera parameters and the reconstruction of the external camera parameters (position and orientation). As recommended by the manufacturer, the process is done considering geometrically verified matching and re-match options. The second step consisted of a densifying of the point clouds using the key points derived from the first step and then applying clustering and patch-based MVS algorithms (e.g., Smith et al., 2015; Rodriguez et al., 2020). Lastly, seamless DSMs and orthomosaics were derived from the points clouds and original images, respectively.
Ground control points are commonly used to georeference the resulting models (i.e., orthomosaics and DSMs) and to improve the interior and external orientation parameters (Immerzeel et al., 2014; James and Robson, 2014; Kraaijenbrink P. et al., 2016; Rossini et al., 2018; James et al., 2019). However, the study site accessibility is challenging as lateral moraines are virtually inaccessible, and the glacier presents crevasses that limit our reach. Therefore, we employed the following processing strategy following Benoit et al. (2019): 1) We selected a reference UAV survey (March 2020) that was georeferenced by five GCPs (Figure 2). 2) Based on this reference UAV survey, we manually selected between 20 and 40 tie points that were used as GCPs to process the remaining seven UAV surveys (see Table 1). The tie points (used as GCPs) are included in the bundle adjustment to generate a stackable co-registrated products among the UAV-derived orthomosaics and DSMs (e.g., Benoit et al., 2019). The tie points were preferentially chosen close to the glacier margin in stable bedrock outcrops. In areas without bedrock outcrops, tie points were selected in boulders that remained stable (visual inspection).
Previous studies have found that UAV-derived DSMs processed by SfM-MVS approaches are susceptible to certain systematic errors such as doming or dishing, and these error are more likely to occur if only nadir image acquisitions are used (e.g., James and Robson, 2014; Sanz-Ablanedo et al., 2020). Note that the maximum reported systematic errors were smaller than 2 m elevation difference (Sanz-Ablanedo et al., 2020). The inaccessibility and extent of the study area limited our ability to deploy checkpoints to robustly validate our results and correct for systematic errors. To estimate the magnitude of the vertical accuracy of the reference survey, we use the rover dGNSS positions to obtain a 12 km track containing ∼1 m spaced points on the glacier (more than 12,000 points). The track elevation and reference DSM are compared to evaluate vertical mismatch independently. Note that we do not consider correcting the reference survey with the track points, neither use the data as a comprehensive accuracy assessment, as the track orientation does not necessarily match the location of systematic errors. As our GCPs are limited, we aim to provide a rough evaluation of possible systematic errors.
Lastly, DSMs of 21-March-2019 and 9-March-2020 were post-processed using point cloud analysis using CloudCompare V2.11.0 (CloudCompare, 2020) to remove artifacts inside supraglacial ponds. The artifacts are produced as the plain water texture impedes to accurate locate tie points on image pairs to allow correct SfM-MVS matching. Considering the water level at the perimeter of the pond well resolved, the artifacts correspond to points inside the pond perimeter which are above or under the water level. In addition, artifacts produced by fast moving objects (e.g., icebergs) are removed as well.
3.1.3 Quality Assessment
First, we inspected the quality of the reference UAV survey (March 2020). The bundle adjustment re-projection error, which correspond to the distance in the raw images and modelled position after the optimization of the camera position and orientation. The reference survey reached subpixel mean re-projection error and camera calibration parameters reached sub pixel uncertainties as well. In addition, we inspected the correlation matrix between camera calibration parameters. Moreover, the calibrated internal parameters from the S.O.D.A. camera converged to comparable values across all surveys (Supplementary Table S1). Lastly, the reference survey using 5 GCPs reached subcentimeter mean errors in x, y, and z, and a maximum standard deviation of 0.07 m in the z axis.
To independently gauge the quality of the reference UAV survey, we subtracted the dGNSS elevation values at the dGNSS x and y track-point locations from the DSM. The elevation mismatch is presented along the dGNSS track and in a histogram (Figures 2B,C). The errors are not randomly distributed across the dGNSS. Near the GCPs uncertainty and bias decrease, whereas in between GCPs the elevation difference ranges between 1 and −0.5 m revealing a vertical doming or convex artifact (Figure 2C). The mismatch is visible in the histogram showing two modes. The first mode located at 0.36 m shows that the DSM is on average higher than the dGNSS elevation data. The second mode shows a non-biased distribution, which is consistent with the dGNSS track points near the GCPs. Note that systematic errors cannot be attributed to the dGNSS rover measurements as similar bias is found in back-and-forth directions. As mentioned earlier, the trajectory of the dGNSS track and its spatial distribution does not allow for a full systematic error assessment.
Next, co-registration accuracy was assessed by inspecting the root mean square error (RMSE) for co-registration tie points (used as GCPs). Results show that root mean square error for all surveys is less than 0.57 m. In addition, for all surveys bias is less than 1 cm and maximum standard deviation errors are 0.53 m in x, 0.6 m in y and 0.69 m in z (Table 1). The errors are attributed to difficulties in identifying tie points on changing sunlight exposure to sub-pixel precision level. However, tie points errors are not correlated in space and tend to compensate each other. As an independent assessment, 3 and 4 checkpoint marks were placed on the glacier surface in January and February respectively. The dGNSS resulted in a ±0.4 m horizontal and 0.7 m vertical maximum displacement error.
Given the challenging assessment of our UAV-derived datasets, and our limitation in obtaining several GCPs for the SfM-MVS workflow, conservatively we consider an empirically accuracy of ±0.5 m horizontally and ±1 m vertically for the derived orthomosaics and DSMs. Consequently, the following analysis is restricted to the aforementioned spatial resolution.
3.2 Surface Displacements
Horizontal displacements were computed from consecutive UAVs orthoimages resampled at 1 m resolution by the feature tracking algorithm ImGRAFT (Messerli and Grinsted, 2015). Results were post-processed to remove outliers by thresholding the signal-to-noise ratio as defined in ImGRAFT and by removing unrealistic large displacements. In addition, we limited the feature tracking to bare terrain, excluding points from vegetated areas and water bodies. We inspected the results through manual mapping of distinct features in the glacier surface (e.g., boulders), and compared velocities with ablation stakes horizontal displacement measured by dGNSS. UAVs surveys were complemented by annual surface velocity available from 1998 to 2018 by the NASA MEaSUREs ITS_LIVE project (Gardner et al., 2019).
3.3 Feature Mapping
Selected supraglacial ponds were mapped from the UAV-derived orthoimages and DSMs resampled at 0.5 m resolution. The vast majority of supraglacial pond water levels correspond to the hydrological base level. Therefore, to identify the margins of supraglacial ponds we extracted the 170.5 m a.s.l contour line, which represents the maximum observed water level. Pond margins are manually compared with the orthoimages and corrected. Lastly, satellite images from Landsat and Rapid Eye (Supplementary Table S2) were used to manually map the perimeter of the east marginal lake from 2000 to 2019.
4 Results
4.1 Surface Elevation Changes
First, we present the surface elevation changes between between 9 March, 2020 and and 21 March, 2019 (Figures 3A,B). Overall, we found a mean surface difference of −0.7 m a−1 for the lower trunk of Exploradores Glacier. Considering biases and uncertainties from the quality assessment, downwasting rates lay within the uncertainties of the method (±1 m vertically). Results are coherent with previous studies indicating average rates of −0.5 m a−1 using digital elevation models derived from ASTER stereo images (Dussaillant et al., 2019b). Locally, most elevation changes are attributed to the advection of the hummocky topography composed by ice cliffs, peaks and troughs that can reach a relief up to 10–20 m (Figure 3A). The first kilometer from the glacier terminus, which corresponds to the debris-covered area, shows positive and negative elevation changes of ±15 m amplitude. Areas of sharp negative changes are attributed to ice-cliff backwasting (Figure 3A; Figures 6A,B). One of the most noticeable ice dynamics, is the west-east advection of crevasses (running parallel to the glacier centerline) near the east marginal lake, that can reach more than 20 m of relief (see (2.) in Figure 3A). The advection of the surface can be seen as semi-parallel red and blue bands, most noticeable near profile C (Figure 3C).
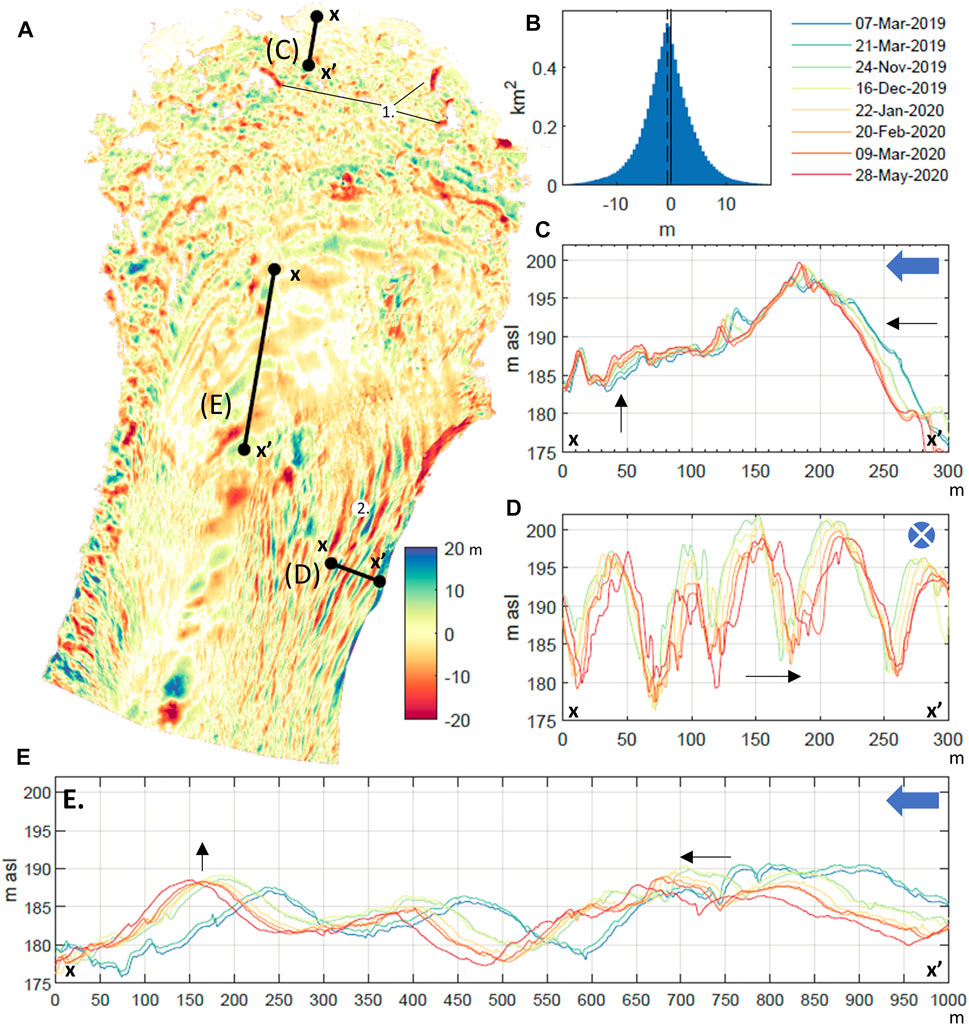
FIGURE 3. (A) DSM difference (m) between 09-March-2020 and 21-March-2019. (B) Surveyed area elevation difference hypsometry, bin width is 1 m. (C–E) Elevation profiles for each survey (color lines). The blue arrow indicates main ice-flow direction.
Second, we analyze the interannual elevation changes during 2019–2020 through elevation profiles (Figures 3C–E). Profile C (Figure 3C) comprises the first 300 m from the glacier terminus and runs parallel to the centerline. We note the advection (south-north direction) of a topographical peak or crest located 300 m from the terminus (horizontal arrow in Figure 3C). In addition, 50 m from the glacier terminus the surface raises almost ∼5 m between the first and last survey (vertical arrow in Figure 3C). Profile D, runs perpendicular to the centerline and near to the east margin. The DSM profiles reveal horizontal displacement towards the calving front (horizontal arrow in Figure 3D). Here, peaks and troughs run parallel to the centerline reaching an elevation difference of 15–20 m (amplitude) and are separated by 50 m (wavelength). Lastly, profile E (Figure 3E) located approximately 2 km from the glacier terminus along the glacier centerline shows the advection of peaks and troughs (Figure 3E), where at 150 m the surface raises. In addition, the arrow located at 700 m displays the advection and elevation changes of the surface. Note that described local surface elevation changes are larger than DSMs uncertainties previously discussed (±1 m).
4.2 Surface Velocity
The surface velocity from two periods: 2019–2020 derived from the UAV high-resolution images and from period 1998–2018 obtained from ITS_live project (Gardner et al., 2019) are presented in Figure 4. First, note that the ITS_live project velocities are in agreement with the UAV derived velocities of this study. Moreover, surface velocities match boulder displacements velocity measured during years 2003/2005 by (Aniya et al., 2007).
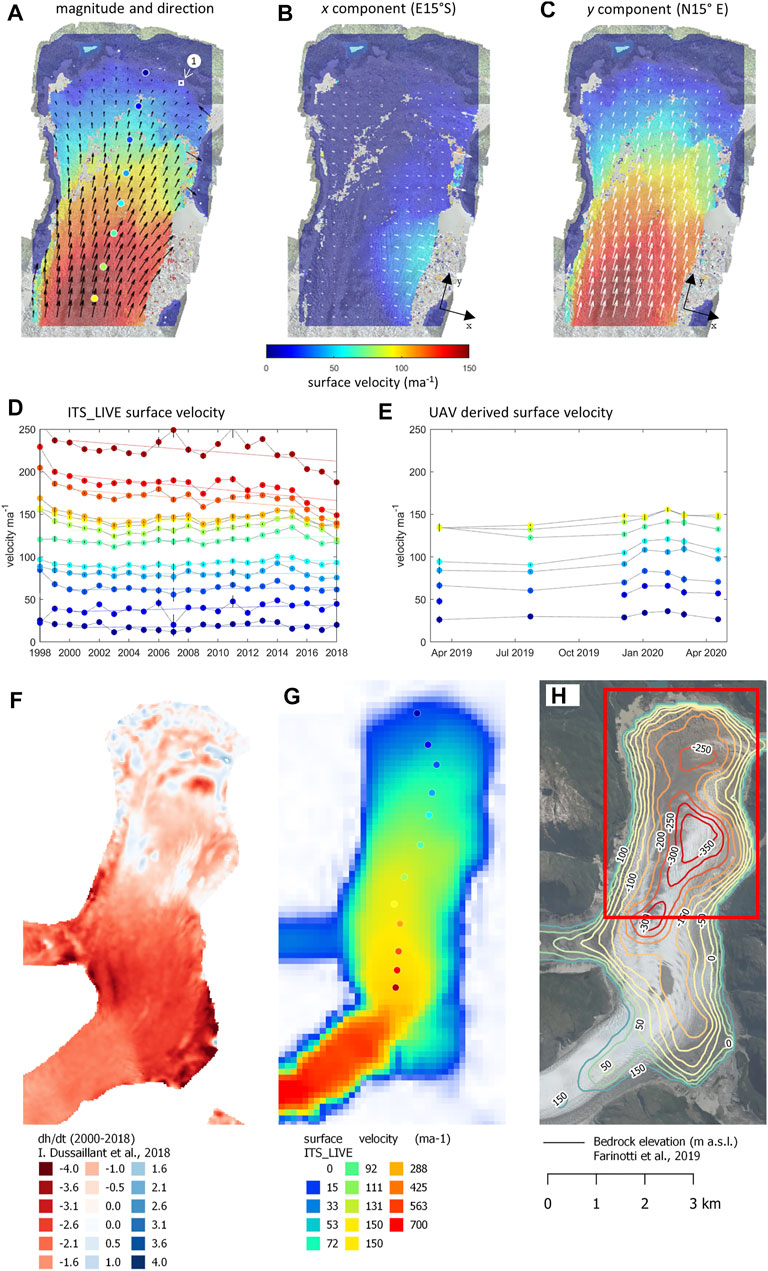
FIGURE 4. (A–C) UAV derived surface velocity from surveys from March 2020 to May 2020. Note that the arrows size is relatively scaled for each plot. (A) Surface velocity magnitude and direction. The color dots correspond to locations points in plots (D–E) and white square indicated with (1) show area of glacier advance. (B) Surface velocity x component. (C) Surface velocity y component. (D,E) Surface velocity (ordinates) at different locations and date (abscises). (F) Thinning rates dh/dt (m a−1) from dates 2000–2018 (Dussaillant et al., 2019b). (G) Ice surface velocity (m a−1) ITS_LIVE (Gardner et al., 2019). (H) Bedrock elevation model (Farinotti et al., 2019). Red square corresponds to the extent of plots (A–C).
The surface velocity spatial pattern shows that velocity decreases long the glacier centerline towards the terminus (Figures 4A,C,G). UAV derived velocities show velocities of ∼150 m a−1 at the glacier’s most upstream section (southern section of the study area). Note that ∼300 m from the glacier terminus surface velocity is 10 m a−1. Exceptionally in one location the glacier advanced 3.5 m over older moraine deposits (white square in Figure 4A). Surface velocity vectors were decomposed into orthogonal components oriented parallel to the centerline i.e. x- and y-axis rotated 15 degrees with respect to the North (Figures 4B,C). Note that the arrows size is relatively scaled for each plot. The x-axis component (perpendicular to glacier centerline) shows that surface velocity increases from the centerline towards the east marginal lake reaching 50 m a−1 (Figure 4B). The y-axis velocity magnitudes indicate that most of the ice flux occurs parallel to the centerline (Figure 4C).
The temporal trend of surface velocity is inspected at different points of the glacier in Figures 4D,E. Note that the date corresponds to the midpoint between image acquisition dates and uncertainties are denoted with a vertical black line. From Figure 4D it is observed that the first 2 km from the glacier terminus surface velocity remained stable between 2000 and 2009. However, 2–4 km from the terminus the glacier experienced an acceleration of 10% between 2009–2014 and deceleration between 2014 and 2019 (Figure 4D). Lastly, from the interannual velocities of the UAVs surveys, it is found that mid-summer velocities (January–February 2020) are ∼10% higher than velocities computed in early spring and end of summer (Figure 4E).
4.3 Development of Lakes and Ponds
The lower trunk of Exploradores Glacier is surrounded by ice-contact lakes at the east and west margins. Moreover, multiple supraglacial ponds are observed on the surface (Figure 2). The larger lake development is observed at the east margin (Figure 5A). The first evidence of the east marginal lake development can be observed in the 2002 Landsat images. However, before 2010 the east marginal lake corresponded to small ponds near the glacier margin. Moreover, due to the coarse image resolution of the Landsat satellite image (30 m) the surface of the ponds is not well detected. Since 2010, the lake reached an area larger than 0.5 km2 and expanded steadily until 2014, reaching an area of 1.1 km2 (see (3.) in Figure 5B). Note that the date of GLOF from Chileno Valley is marked with (4.) in Figure 5B. Since 2014, the east marginal lake maintained this extent until April 2018 where it expanded ∼0.3 km2 (see (5.) in Figure 5B). The sudden expansion of the lake in 2018 matches with GLOF date from Triángulo Lake located at tributary Bayo Glacier (Bañales-Seguel et al., 2020). Lastly, UAVs images show that in March 2019 the area corresponded to 1.405 km2 and in March 2020 the area decreased to 1.397 km2. The UAV images show that the lake expanded by calving to the north (see (1.) in Figure 4A) and shrunk to the south by the advance of the glacier (see (2.) in Figure 4A). In addition, note the large iceberg ∼450 by 130 m (55,000 m2) in March 2019 image (see (6.) in Figure 5A).
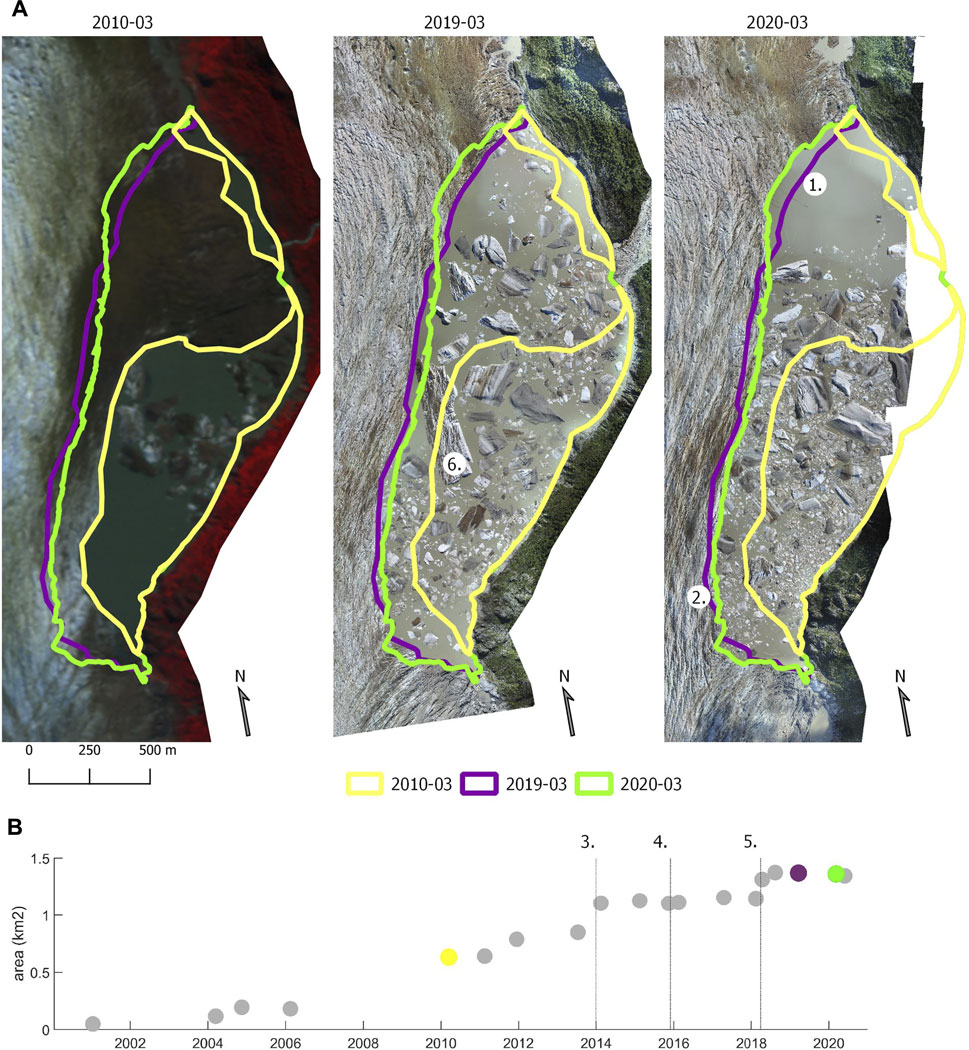
FIGURE 5. (A) Landsat March-2010, UAV March-2019 and UAV March-2020 images. (B) East marginal lake area over 20 years.
In the western part of the glacier, a marginal lake extends 4 km from the frontal moraine covering an area of 0.5 km2 (Figure 2). Near the terminus, the lake perimeter consists of debris-covered ice and ice cliffs. On the upper section of the study area, the west marginal lake perimeter consists in a steep lateral moraine, a partially debris-covered ice and marked splaying crevasses.
The first 200 m from the terminus present a hummocky topography commonly found in debris-covered glaciers (e.g., Mölg et al., 2020). Supraglacial ponds present ice cliffs up to 20 m high. It is observed that supraglacial ponds expand by ice-cliff backwasting and pond coalescence (Figure 6A). Moreover, field observations identified that supraglacial ponds formed thermo-erosional notches on ice cliffs near the terminus (Figure 6A). Up to 400 m from the terminus thermo-karst lakes are observed surrounded by funnel shape ice cliffs (Figure 6B). Approximately 1.5 km from the terminus, the UAV-derived orthoimages show the development of supraglacial ponds initiated by compressional crevasses (parallel to the main ice-flow direction), as well as strike-slip structures (en-echelon structures) (e.g., Figure 6C).
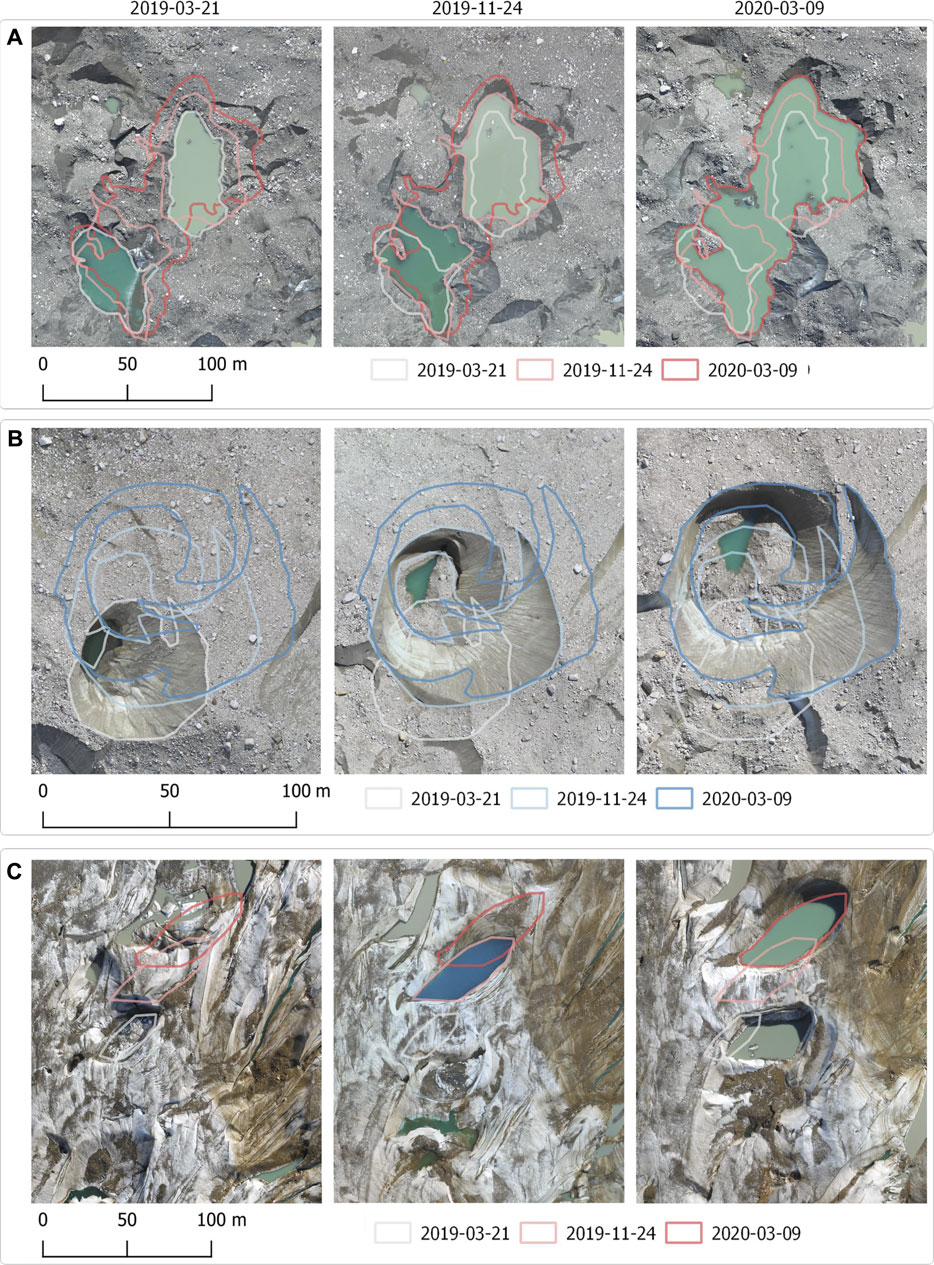
FIGURE 6. (A) Supraglacial pond coalescence by ice-cliff backwasting. (B) Thermo-karst sink hole and ice-cliff backwasting. (C) En-echelon crevasses and supraglacial pond formation. Location of the ponds is provided in Figure 2B.
Results from DSMs and dGNSS surveys indicate that supraglacial pond water level is near 170 m asl reaching a 170.5 m asl maximum at the end of March 2020. The supraglacial ponds water level are in agreement with the terminal and east marginal lake levels, showing few centimeters (<10 cm) of diurnal fluctuations. No evident supraglacial pond surface drainage system has been observed near the glacier terminus. Note that on a larger scale (>200 m) there is near zero surface gradient on the debris-covered area. Lake level monitoring from pressure transducers indicates that the east marginal lake and the terminal lake (lake located at the glacier snout) have a synchronous in-phase water level (no lag) (Supplementary Figure S1). Lastly, temperature from the east marginal lake ranged between 0.3–0.5 ± 0.5°C from February to May 2020.
5 Discussion
In this section we discuss Exploradores Glacier ice dynamics, morphological changes and indicators of the possible onset of proglacial lake development. The terminus of Exploradores Glacier has remained in a relatively stable position and only retreated approximately 100–200 m from its Neoglacial position, attested by the LIA moraines (Aniya et al., 2007). This is a distinct feature of a glacier in this location, given that most NPI glaciers have experienced a net retreat of the termini from their LIA moraines dated 12th–17th century (Aniya et al., 2007). Recent geomorphological changes in Exploradores Glacier include the development of an ice-dammed lake at the eastern margin (Loriaux and Casassa, 2013; Wilson et al., 2018), an increase in debris cover thickness (Glasser et al., 2016) and supraglacial pond enlargement (Aniya et al., 2007). Moreover, current debris cover disruption by formation of supraglacial ponds and lakes have led previous researchers to hypothesize that the first kilometers (from the glacier front) are disintegrating (Aniya et al., 2007). Following similar cases found in the literature (e.g., Kirkbride, 1993; Kirkbride and Warren, 1999), it can be expected that a calving front would develop implying an increase in ablation rates and extension of proglacial lake into overdeepening areas in the coming years. King et al. (2018) argues, with examples from the Himalayas, that there are common criteria that allow to predict proglacial lake development. These criteria include terminus stagnation (displacements <5 m a−1), glacier thinning, low gradient ablation area (<2 degrees), supraglacial ponds coalescence and terminus flotation (e.g., Kirkbride, 1993; Reynolds, 2000; Benn et al., 2001; Quincey et al., 2007; Quincey and Glasser, 2009; Sakai and Fujita, 2010; Tsutaki et al., 2013).
5.1 Terminus Disintegration
There are multiple evidences that the terminus of Exploradores Glacier is disintegrating and this process will continue forming a proglacial lake. The first 2 km of Exploradores Glacier terminus are covered by debris and this zone has a low surface gradient (<1 degree) which is common in glaciers which front disintegrated by the formation of glacial lakes. According to Aniya et al. (2007), between 2000–2004 supraglacial ponds and ice cliffs started to develop a hummocky texture near the glacier front. Furthermore, within the UAV monitored period (2019–2020), it was observed that supraglacial ponds expand via ice-cliff backwasting and subaqueous melt, without evident surface drainage (Figure 6A,B). The high-resolution of the acquired UAV images (less than 20 cm) allowed to observe pond initiation by crevasses opening. Interestingly, the analysis of the UAV images (2019–2020) showed that longitudinal crevasses (parallel to the main ice flow direction), marginal shear crevasses as well as strike-slip structures (en-echelon structures) provide fractures for pond initiation (Figure 6C). These ponds present a low turbidity at an initial stage and are later expanded by ice-cliff backwasting and subaqueous melt (e.g., Figure 6C). In addition, measured water levels indicate that most supraglacial ponds and marginal lakes have the same water level (170.5 m a.s.l ± 0.5), indicating hydrological connection which could favor lakes coalescence. The analysis of summer ablation stakes from December 2019 to March 2020 showed ice-loss ranging from 3.6 to 12 meters (30–100 w.e. mm d−1). However, the downwasting of the terminus ranged between −0.5 and −1 m a−1 based on UAV-derived DSMs from 2019–2020 (Figure 2A). Note that those rates are similar to elevation changes during 2000–2014 of ∼−0.5 m a−1 at the first 4 km from Exploradores Glacier terminus (Figure 4F) (Jaber et al., 2016; Dussaillant et al., 2019a; Dussaillant et al., 2019b).
The observed crevasse opening, ponds formation as well as ice downwasting contribute to the disintegration of the debris-covered glacier terminus (e.g., King et al., 2018). However, previous studies have noted that disintegration of the terminus is favorable when the terminus is stagnant (<5 ma−1) (King et al., 2018). Here, the analysis of high-resolution UAV images (March 2019 to May 2020) show that velocity around 300 m from the terminus reaches 10 m a−1. Moreover, velocity show a stable trend over the last 20 years. In addition, in 2020 we observed at one location the advance of 3 m of the glacier over moraine deposits (Figure 4). The actual surface velocity patterns show that predominant ice flux occurs parallel to the centerline (Figures 4A,C,G) decreasing in velocity towards the terminus. In addition, longitudinal crevasses (oriented parallel to the glacier centerline) are observed as well as splaying crevasses near the margin (Figure 2). This regime and the observed surface uplift found in profiles (Figures 3C,E), are indicators of glacier deceleration and a compressional regime (e.g., Sato et al., 2021a). Therefore, surface velocity and surface elevation changes observations indicate that within the study area the high ablation rates are partially compensated by the upstream glacier.
5.2 Terminus Flotation
The modelled ice thickness based on Farinotti et al., 2019, indicates a prominent bed overdeepening extending 4 km from the terminus (Figure 4H). Interestingly, considering a point at the center of the ablation area, the bedrock elevation reaches a minimum of −350 m asl, surface elevation is near 200 m asl and lake level is near 170 m asl. Therefore, at this point water level is above 94% of the ice thickness. Consequently, we suggest that at least a portion of the lower trunk of Exploradores Glacier has reached flotation (e.g., Boyce et al., 2007). However, the analysis is not conclusive as ice thickness estimation, for Exploradores Glacier, is based on numerical modelling without geophysical measurements or direct borehole drilling for validation. Therefore, uncertainties are significant (Farinotti et al., 2019). Moreover, glacier flotation is associated with extensive regimes where surface velocity increases towards the terminus (e.g., Tsutaki et al., 2013; Tsutaki et al., 2019). In the case of Exploradores Glacier, glacier surface velocity decreases towards the terminus showing similar behavior to land terminating glaciers (e.g., Tsutaki et al., 2019; Sato et al., 2021a). This can be interpreted as the glacier has not reached flotation yet, or a coherent section of the lower trunk is well grounded. For comparison, the onset of proglacial lake development at the debris-free Rhone Glacier (European Alps) showed an increase in surface velocity by a factor of 2.7 during 2006–2008 (Tsutaki et al., 2013). Moreover, lake development at Rhone Glacier showed surface uplift and extensive strain rates. This is attributed to the glacier reaching flotation and consequently decrease on basal drag (e.g., Iken, 1981; Boyce et al., 2007).
5.3 East Marginal Lake Expansion
Another relevant component of mass loss is the development of a calving front at the east marginal lake. Previous studies have described the east marginal lake as an ice-dammed lake that started developing in 2011 (Loriaux and Casassa, 2013; Wilson et al., 2019). We found evidence of the lake in archival satellite images as early as 2002. However, many images present shadows and clouds inhibiting accurate mapping. Note that before 2014, the east marginal lake was drained by a meandering supraglacial stream (Aniya, 2017). Nowadays, the east marginal lake is drained via englacial/subglacial hydraulic pathways as the glacier is in contact with the lateral moraine in two 200 m sections before the glacier terminus. From 2010, the east marginal lake expanded until 2014 and after the 2018 GLOF event in a stepwise manner. Previous studies have found that GLOFs can accelerate and hydraulically lift glaciers during drainage (Sugiyama et al., 2008). However, from our data, it is not clear the role played by the 2018 GLOF and if may have triggered a large calving event (see (6.) in Figure 5A). Note that within the UAV monitored period 2019–2020, the ice flux towards the east marginal lake was higher than calving flux, reducing the lake area. Note that the surface velocity component towards the calving front was near 50 m a−1 (Figure 4B), which is coherent with DSM profiles (Figure 3E) which show extensional characteristics.
5.4 Ice Dynamics of the Ablation Area
On a larger spatiotemporal scale, considering the whole of the ablation area of the glacier and the last 20 years, it is possible to identify two areas of the glacier whose dynamics differ: the first 4 km from the terminus and between 4 km and the icefall at approximately 6 km from the terminus. This is most noticeable by inspecting the thinning rates derived from geodetic mass balance (Figure 4F). Geodetic mass balance studies found that the first 4 km from the glacier terminus have thinning rates ranging −0.5–0 m a−1 and from 4 km up to the icefall thinning rates of 2 m a−1 (Jaber et al., 2016; Dussaillant et al., 2019b). Note that the first 4 km of the glacier include areas with and without debris-cover which show similar thinning rates. In addition, the velocity of the first 4 km of the glacier has remained stable over the last 20 years, and between 4 and 6 km the velocity magnitude has decreased by 15% (Figure 4D). The decrease in velocity implies a lower ice flux towards the glacier front from 2014–2018. Therefore, we interpret that thinning rates differences between the first 4 km, and in between 4–6 km are more likely dependent on the ice flux. One explanation is that dynamic thinning is taking place in between 4–6 km (from the UAV surveyed area up to the icefall, Figure 4H). Interestingly, according to ice-thickness maps the over-deepened area decreases at 4–6 km from the terminus. Lastly, it is worth noting that geodetic mass balance studies (2000–2014 and 2000–2018) have shown that the thinning rate in the accumulation area is near 0 m a−1 (Jaber et al., 2016; Dussaillant et al., 2019b).
5.5 Outlook
Further work should prioritize establishing an ice-flow dynamic model to test hypothesis/predictions regarding Exploradores Glacier response to climate drivers and calving fluxes (e.g., Tsutaki et al., 2019; Sato et al., 2021a). Efforts should focus on modelling the complete ablation area to explore downwasting rates below the icefall which could be attributed to dynamic thinning (e.g., Tsutaki et al., 2013). It is crucial to gather ice thickness data to improve bedrock elevation models. Furthermore, efforts might be directed to model ice melt at the debris-cover area to further study the disintegration of the glacier terminus. In this line, the acquired UAVs images can be used to improve quantification on ice-cliff backwasting and pond coalescence (e.g., Steiner et al., 2019) which is not explored in this study.
Lastly, it is worth noting that previous literature has pointed out that east marginal lake is an ice-dammed lake (e.g., Loriaux and Casassa, 2013; Wilson et al., 2019). Unravelling this is critical, as ice-dammed lakes are more susceptible to glacial lake outburst floods (e.g., Tweed and Russell, 1999; Carrivick and Tweed, 2016). Moreover, as the glacier reaches flotation, subglacial conduits are not likely to close solely due to viscous ice creep from the ice overburden pressure (e.g., Iken, 1981).
6 Conclusion
The formation of proglacial lakes at Exploradores Glacier has been ongoing for decades as a result of the relatively slow disintegration process of the debris-covered tongue. In this work, we monitored the ablation area of Exploradores Glacier by repeated UAV surveys and satellite images over the last 20 years. We observed that the debris-covered area of Exploradores is disintegrating by pond coalescence favored by low gradient slope and glacier thinning. However, surface velocities near the terminus are significant (>10 m a−1), implying a substantial ice flux towards the terminus which partially compensates surface ablation. We observed that the east marginal lake area has remained unchanged over the last 6 years, with the exception of a surface increase after a glacial lake outburst flood in 2018. Moreover, high-resolution UAV images from 2019–2020 show that the east marginal lake calving losses equaled upcoming ice flux. This is coherent with observed surface velocities towards the calving front of ∼50 m a−1.
We found that the east marginal lake, previously described in the literature as an ice-dammed lake is hydraulically efficiently connected to the terminal lake at the glacier outlet, showing the same synchronous water level across the study period. However, the monitoring period is less than a year and further monitoring is needed to evaluate GLOFs risk from the east marginal lake.
The study identified main controls on Exploradores Glacier ongoing lake development and provide information to assessing further glacier evolution. The observed geomorphological and ice dynamics characteristics imply that Exploradores Glacier is disintegrating at a slow rate given the steady ice flux from upstream. However, proglacial lake formation often implies nonlinear responses and tipping points which are difficult to predict. Future scientific effort in the region should be drawn to improve/collect ice-thickness data, as is a key to assessing further proglacial lake development as well as setting up ice-dynamic models to predict glacier evolution.
Data Availability Statement
The raw data supporting the conclusion of this article will be made available by the authors, without undue reservation. The UAV derived orthomosaics and DSMs can be found at https://doi.org/10.5281/zenodo.5483840 under license CC 4.0. In addition, ice thickness model for Exploradores Glacier was obtained from Farinotti et al. (2019) available at https://www.researchcollection.ethz.ch/handle/20.500.11850/315707 under license CC 4.0. Surface velocities from Gardner et al. (2019) ITS_LIVE available https://its-live.jpl.nasa.gov/ under MIT license. Glacier elevation changes available from Dussaillant et al. (2019a) in repository https://doi.org/10.1594/PANGAEA.903618 under license CC-BY-4.0.
Author Contributions
The study was designed by II with the inputs from GM, AD, SV, and PI-A. Field work was done by II and AD. Drone images were processed by II and SV. Analysis were performed by II and discussed among all co-authors. II prepared the paper, which was edited and proofread by all co-authors.
Funding
II was funded by the Swiss National Foundation through SNF-Doc Mobility fellowship 2019 (187738). In addition, II received funding from the National Agency for Research and Development (ANID) through BECAS CHILE/2015–72160092 and PATSER R-20F0002. The Doc.Mobility 2018 fellowship from Centro Latinoamericano–Suizo of St. Gallen University financed March 2019 field work. PI-A was funded by the Fondecyt de Iniciación project No 11190389. AD received field funding from SNF-SEED 2018. CONAF authorized and supported the project inside the National Park Laguna San Rafael, as well as providing fieldwork safety backups. The Water Cadastre of Chile (DGA) provided data from meteorological station as well as field work support in May 2020.
Conflict of Interest
The authors declare that the research was conducted in the absence of any commercial or financial relationships that could be construed as a potential conflict of interest.
Publisher’s Note
All claims expressed in this article are solely those of the authors and do not necessarily represent those of their affiliated organizations, or those of the publisher, the editors and the reviewers. Any product that may be evaluated in this article, or claim that may be made by its manufacturer, is not guaranteed or endorsed by the publisher.
Acknowledgments
We are grateful to C. Rodríguez-Morata, A. Muñoz-Torrero-Manchado, who provide helpful field support and to Guy Wenborne who provided the photo from Figure 1. Lastly, we are grateful to Francisco Croxatto and the park rangers from Parque Exploradores (www.parquexploradores.cl) who provided crucial support for logistics and field work across all the study period.
Supplementary Material
The Supplementary Material for this article can be found online at: https://www.frontiersin.org/articles/10.3389/feart.2022.791487/full#supplementary-material
References
Aniya, M., Barcaza, G., and Iwasaki, S. (2007). Recent Glacier Advances at Glaciar Exploradores, Hielo Patagónico Norte, Chile. Bull. Glaciological Res. 24, 49–57.
Aniya, M. (2017). Glacier Variations of Hielo Patagónico Norte, Chile, over 70 Years from 1945 to 2015. Bull. Glacier Res. 35, 19–38. doi:10.5331/bgr.17R01
Bañales-Seguel, C., Salazar, A., and Mao, L. (2020). Hydro-morphological Characteristics and Recent Changes of a Nearly Pristine River System in Chilean Patagonia: The Exploradores River Network. J. South Am. Earth Sci. 98, 102444. doi:10.1016/j.jsames.2019.102444
Baurley, N. R., Robson, B. A., and Hart, J. K. (2020). Long‐term Impact of the Proglacial lake Jökulsárlón on the Flow Velocity and Stability of Breiðamerkurjökull Glacier, Iceland. Earth Surf. Process. Landforms 45 (11), 2647–2663. doi:10.1002/esp.4920
Benito, G., Thorndycraft, V. R., Medialdea, A., Machado, M. J., Sancho, C., and Dussaillant, A. (2021). Declining Discharge of Glacier Outburst Floods through the Holocene in central Patagonia. Quat. Sci. Rev. 256, 106810. doi:10.1016/j.quascirev.2021.106810
Benn, D. I., Bolch, T., Hands, K., Gulley, J., Luckman, A., Nicholson, L. I., et al. (2012). Response of Debris-Covered Glaciers in the Mount Everest Region to Recent Warming, and Implications for Outburst Flood Hazards. Earth-Science Rev. 114 (1), 156–174. doi:10.1016/j.earscirev.2012.03.008
Benn, D. I., Warren, C. R., and Mottram, R. H. (2007). Calving Processes and the Dynamics of Calving Glaciers. Earth-Science Rev. 82 (3), 143–179. doi:10.1016/j.earscirev.2007.02.002
Benn, D. I., Wiseman, S., and Hands, K. A. (2001). Growth and Drainage of Supraglacial Lakes on Debris-Mantled Ngozumpa Glacier, Khumbu Himal, Nepal. J. Glaciol. 47 (159), 626–638. doi:10.3189/172756501781831729
Benoit, L., Gourdon, A., Vallat, R., Irarrazaval, I., Gravey, M., Lehmann, B., et al. (2019). A High-Resolution Image Time Series of the Gorner Glacier - Swiss Alps - Derived from Repeated Unmanned Aerial Vehicle Surveys. Earth Syst. Sci. Data 11 (2), 579–588. doi:10.5194/essd-11-579-2019
Bhardwaj, A., Sam, L., AkankshaMartín-Torres, F. J., Martín-Torres, F. J., and Kumar, R. (2016). UAVs as Remote Sensing Platform in Glaciology: Present Applications and Future Prospects. Remote Sensing Environ. 175, 196–204. doi:10.1016/j.rse.2015.12.029
Bown, F., Rivera, A., Pętlicki, M., Bravo, C., Oberreuter, J., and Moffat, C. (2019). Recent Ice Dynamics and Mass Balance of Jorge Montt Glacier, Southern Patagonia Icefield. J. Glaciol. 65 (253), 732–744. doi:10.1017/jog.2019.47
Boyce, E. S., Motyka, R. J., and Truffer, M. (2007). Flotation and Retreat of a lake-calving Terminus, Mendenhall Glacier, Southeast Alaska, USA. J. Glaciol. 53 (181), 211–224. doi:10.3189/172756507782202928
Brun, F., Wagnon, P., Berthier, E., Shea, J. M., Immerzeel, W. W., Kraaijenbrink, P. D. A., et al. (2018). Ice Cliff Contribution to the Tongue-wide Ablation of Changri Nup Glacier, Nepal, central Himalaya. The Cryosphere 12 (11), 3439–3457. doi:10.5194/tc-12-3439-2018
Buri, P., Miles, E. S., Steiner, J. F., Ragettli, S., and Pellicciotti, F. (2021). Supraglacial Ice Cliffs Can Substantially Increase the Mass Loss of Debris‐Covered Glaciers. Geophys. Res. Lett. 48 (6), e2020GL092150. doi:10.1029/2020GL092150
Carrasco, J. F., Casassa, G., and Rivera, A. (2002). “Meteorological and Climatological Aspects of the Southern Patagonia Icefield,” in The Patagonian Icefields: A Unique Natural Laboratory for Environmental and Climate Change Studies. Editors G. Casassa, F. V. Sepúlveda, and R. M. Sinclair (Boston, MA: Springer US), 29–41. doi:10.1007/978-1-4615-0645-4_4
Carrivick, J. L., and Tweed, F. S. (2016). A Global Assessment of the Societal Impacts of Glacier Outburst Floods. Glob. Planet. Change 144, 1–16. doi:10.1016/j.gloplacha.2016.07.001
Carrivick, J. L., and Tweed, F. S. (2013). Proglacial Lakes: Character, Behaviour and Geological Importance. Quat. Sci. Rev. 78, 34–52. doi:10.1016/j.quascirev.2013.07.028
Carrivick, J. L., Tweed, F. S., Sutherland, J. L., and Mallalieu, J. (2020). Toward Numerical Modeling of Interactions between Ice-Marginal Proglacial Lakes and Glaciers. Front. Earth Sci. 8 (500), 68. doi:10.3389/feart.2020.577068
Chilean-Water-Directorate (2018). Minuta Técnica: Incremento de caudal en Río Exploradores. Región de Aysén, Chile: Dirección General de Aguas - Ministerio de Obras Públicas.
CloudCompare (2020). CloudCompare. version 2.11.0. GPL software. Available at: http://www.cloudcompare.org/.
Davies, B. J., Darvill, C. M., Lovell, H., Bendle, J. M., Dowdeswell, J. A., Fabel, D., et al. (2020). The Evolution of the Patagonian Ice Sheet from 35 Ka to the Present Day (PATICE). Earth-Science Rev. 204, 103152. doi:10.1016/j.earscirev.2020.103152
Dussaillant, A., Benito, G., Buytaert, W., Carling, P., Meier, C., and Espinoza, F. (2010). Repeated Glacial-lake Outburst Floods in Patagonia: an Increasing hazard? Nat. Hazards 54 (2), 469–481. doi:10.1007/s11069-009-9479-8
Dussaillant, I., Berthier, E., and Brun, F. (2018). Geodetic Mass Balance of the Northern Patagonian Icefield from 2000 to 2012 Using Two Independent Methods. Front. Earth Sci. 6, 8. doi:10.3389/feart.2018.00008
Dussaillant, I., Berthier, E., Brun, F., Masiokas, M., Hugonnet, R., Favier, V., et al. (2019a). South American Andes Elevation Changes from 2000 to 2018, Links to GeoTIFFs. PANGAEA 12 (10). 3618. doi:10.1594/PANGAEA.903618
Dussaillant, I., Berthier, E., Brun, F., Masiokas, M., Hugonnet, R., Favier, V., et al. (2019b). Two Decades of Glacier Mass Loss along the Andes. Nat. Geosci. 12 (10), 802–808. doi:10.1038/s41561-019-0432-5
Dykes, R. C., Brook, M. S., Robertson, C. M., and Fuller, I. C. (2011). Twenty-First Century Calving Retreat of Tasman Glacier, Southern Alps, New Zealand. Arctic, Antarctic, Alpine Res. 43 (1), 1–10. doi:10.1657/1938-4246-43.1.1
Falaschi, D., Lenzano, M. G., Villalba, R., Bolch, T., Rivera, A., and Lo Vecchio, A. (2019). Six Decades (1958-2018) of Geodetic Glacier Mass Balance in Monte San Lorenzo, Patagonian Andes. Front. Earth Sci. 7, 326. doi:10.3389/feart.2019.00326
Farinotti, D., Huss, M., Fürst, J. J., Landmann, J., Machguth, H., Maussion, F., et al. (2019). A Consensus Estimate for the Ice Thickness Distribution of All Glaciers on Earth. Nat. Geosci. 12 (3), 168–173. doi:10.1038/s41561-019-0300-3
Funk, C., Peterson, P., Landsfeld, M., Pedreros, D., Verdin, J., Shukla, S., et al. (2015). The Climate Hazards Infrared Precipitation with Stations-A New Environmental Record for Monitoring Extremes. Sci. Data 2 (1), 150066. doi:10.1038/sdata.2015.66
Gardner, A. S., Fahnestock, M. A., and Scambos, T. A. (2019). ITS_LIVE Regional Glacier and Ice Sheet Surface Velocities. Boulder, CO: Data archived at National Snow and Ice Data Center. [accessed March 2021]:. doi:10.5067/6II6VW8LLWJ7
Glasser, N. F., Holt, T. O., Evans, Z. D., Davies, B. J., Pelto, M., and Harrison, S. (2016). Recent Spatial and Temporal Variations in Debris Cover on Patagonian Glaciers. Geomorphology 273, 202–216. doi:10.1016/j.geomorph.2016.07.036
Haritashya, U., Kargel, J., Shugar, D., Leonard, G., Strattman, K., Watson, C., et al. (2018). Evolution and Controls of Large Glacial Lakes in the Nepal Himalaya. Remote Sensing 10 (5), 798. doi:10.3390/rs10050798
Iken, A. (1981). The Effect of the Subglacial Water Pressure on the Sliding Velocity of a Glacier in an Idealized Numerical Model. J. Glaciol. 27 (97), 407–421. doi:10.3198/1981JoG27-97-407-42110.1017/s0022143000011448
Immerzeel, W. W., Kraaijenbrink, P. D. A., Shea, J. M., Shrestha, A. B., Pellicciotti, F., Bierkens, M. F. P., et al. (2014). High-resolution Monitoring of Himalayan Glacier Dynamics Using Unmanned Aerial Vehicles. Remote Sensing Environ. 150, 93–103. doi:10.1016/j.rse.2014.04.025
Iribarren Anacona, P., Mackintosh, A., and Norton, K. P. (2015). Hazardous Processes and Events from Glacier and Permafrost Areas: Lessons from the Chilean and Argentinean Andes. Earth Surf. Process. Landforms 40 (1), 2–21. doi:10.1002/esp.3524
Iribarren Anacona, P., Norton, K. P., and Mackintosh, A. (2014). Moraine-dammed lake Failures in Patagonia and Assessment of Outburst Susceptibility in the Baker Basin. Nat. Hazards Earth Syst. Sci. 14 (12), 3243–3259. doi:10.5194/nhess-14-3243-2014
Jaber, W. A., Floricioiu, D., and Rott, H. (2016). “Geodetic Mass Balance of the Patagonian Icefields Derived from SRTM and TanDEM-X Data.” in Proceeding of the 2016 IEEE International Geoscience and Remote Sensing Symposium (IGARSS), Beijing, China, July 2016, 342–345.doi:10.1109/igarss.2016.7729082
James, M. R., Chandler, J. H., Eltner, A., Fraser, C., Miller, P. E., Mills, J. P., et al. (2019). Guidelines on the Use of Structure‐from‐motion Photogrammetry in Geomorphic Research. Earth Surf. Process. Landforms 44 (10), 2081–2084. doi:10.1002/esp.4637
James, M. R., and Robson, S. (2014). Mitigating Systematic Error in Topographic Models Derived from UAV and Ground-Based Image Networks. Earth Surf. Process. Landforms 39 (10), 1413–1420. doi:10.1002/esp.3609
King, O., Bhattacharya, A., Bhambri, R., and Bolch, T. (2019). Glacial Lakes Exacerbate Himalayan Glacier Mass Loss. Sci. Rep. 9 (1), 18145. doi:10.1038/s41598-019-53733-x
King, O., Dehecq, A., Quincey, D., and Carrivick, J. (2018). Contrasting Geometric and Dynamic Evolution of lake and Land-Terminating Glaciers in the central Himalaya. Glob. Planet. Change 167, 46–60. doi:10.1016/j.gloplacha.2018.05.006
Kirkbride, M. P. (1993). The Temporal Significance of Transitions from Melting to Calving Termini at Glaciers in the central Southern Alps of New Zealand. The Holocene 3 (3), 232–240. doi:10.1177/095968369300300305
Kirkbride, M. P., and Warren, C. R. (1999). Tasman Glacier, New Zealand: 20th-century Thinning and Predicted Calving Retreat. Glob. Planet. Change 22 (1), 11–28. doi:10.1016/S0921-8181(99)00021-1
Konya, K., and Matsumoto, T. (2010). Influence of Weather Conditions and Spatial Variability on Glacier Surface Melt in Chilean Patagonia. Theor. Appl. Climatol 102 (1), 139–149. doi:10.1007/s00704-009-0248-0
Kraaijenbrink, P., Shea, J. M., Pellicciotti, F., Jong, S. M. d., and Immerzeel, W. W. (2016b). Object-based Analysis of Unmanned Aerial Vehicle Imagery to Map and Characterise Surface Features on a Debris-Covered Glacier. Remote Sensing Environ. 186, 581–595. doi:10.1016/j.rse.2016.09.013
Kraaijenbrink, P., Meijer, S. W., Shea, J. M., Pellicciotti, F., De Jong, S. M., and Immerzeel, W. W. (2016a). Seasonal Surface Velocities of a Himalayan Glacier Derived by Automated Correlation of Unmanned Aerial Vehicle Imagery. Ann. Glaciol. 57 (71), 103–113. doi:10.3189/2016AoG71A072
Loriaux, T., and Casassa, G. (2013). Evolution of Glacial Lakes from the Northern Patagonia Icefield and Terrestrial Water Storage in a Sea-Level Rise Context. Glob. Planet. Change 102, 33–40. doi:10.1016/j.gloplacha.2012.12.012
Maurer, J. M., Schaefer, J. M., Rupper, S., and Corley, A. (2019). Acceleration of Ice Loss across the Himalayas over the Past 40 Years. Sci. Adv. 5 (6), eaav7266. doi:10.1126/sciadv.aav7266
Messerli, A., and Grinsted, A. (2015). Image Georectification and Feature Tracking Toolbox: ImGRAFT. Geosci. Instrum. Method. Data Syst. 4 (1), 23–34. doi:10.5194/gi-4-23-2015
Miles, E. S., Steiner, J., Willis, I., Buri, P., Immerzeel, W. W., Chesnokova, A., et al. (2017). Pond Dynamics and Supraglacial-Englacial Connectivity on Debris-Covered Lirung Glacier, Nepal. Front. Earth Sci. 5, 69. doi:10.3389/feart.2017.00069
Minowa, M., Schaefer, M., Sugiyama, S., Sakakibara, D., and Skvarca, P. (2021). Frontal Ablation and Mass Loss of the Patagonian Icefields. Earth Planet. Sci. Lett. 561, 116811. doi:10.1016/j.epsl.2021.116811
Minowa, M., Sugiyama, S., Sakakibara, D., and Skvarca, P. (2017). Seasonal Variations in Ice-Front Position Controlled by Frontal Ablation at Glaciar Perito Moreno, the Southern Patagonia Icefield. Front. Earth Sci. 5, 1. doi:10.3389/feart.2017.00001
Mölg, N., Ferguson, J., Bolch, T., and Vieli, A. (2020). On the Influence of Debris Cover on Glacier Morphology: How High-Relief Structures Evolve from Smooth Surfaces. Geomorphology 357, 107092. doi:10.1016/j.geomorph.2020.107092
Mouginot, J., and Rignot, E. (2015). Ice Motion of the Patagonian Icefields of South America: 1984-2014. Geophys. Res. Lett. 42 (5), 1441–1449. doi:10.1002/2014GL062661
Nie, Y., Sheng, Y., Liu, Q., Liu, L., Liu, S., Zhang, Y., et al. (2017). A Regional-Scale Assessment of Himalayan Glacial lake Changes Using Satellite Observations from 1990 to 2015. Remote Sensing Environ. 189, 1–13. doi:10.1016/j.rse.2016.11.008
Østrem, G. (1959). Ice Melting under a Thin Layer of Moraine, and the Existence of Ice Cores in Moraine Ridges. Geografiska Annaler 41 (4), 228–230. doi:10.1080/20014422.1959.11907953
Pellicciotti, F., Stephan, C., Miles, E., Herreid, S., Immerzeel, W. W., and Bolch, T. (2015). Mass-balance Changes of the Debris-Covered Glaciers in the Langtang Himal, Nepal, from 1974 to 1999. J. Glaciol. 61 (226), 373–386. doi:10.3189/2015JoG13J237
Purdie, J., and Fitzharris, B. (1999). Processes and Rates of Ice Loss at the Terminus of Tasman Glacier, New Zealand. Glob. Planet. Change 22 (1), 79–91. doi:10.1016/S0921-8181(99)00027-2
Quincey, D. J., and Glasser, N. F. (2009). Morphological and Ice-Dynamical Changes on the Tasman Glacier, New Zealand, 1990-2007. Glob. Planet. Change 68 (3), 185–197. doi:10.1016/j.gloplacha.2009.05.003
Quincey, D. J., Richardson, S. D., Luckman, A., Lucas, R. M., Reynolds, J. M., Hambrey, M. J., et al. (2007). Early Recognition of Glacial lake Hazards in the Himalaya Using Remote Sensing Datasets. Glob. Planet. Change 56 (1), 137–152. doi:10.1016/j.gloplacha.2006.07.013
Reynolds, J. M. (2000). On the Formation of Supraglacial Lakes on Debris-Covered Glaciers, 264. Wallingford, Oxfordshire, UK: IAHS Publ., 153–161. Symposium at Seattle 2000 - Debris-Covered Glaciers.
RGI, C. (2017). Randolph Glacier Inventory – A Dataset of Global Glacier Outlines: Version 6.0: Technical Report, Global Land Ice Measurements from Space. Colorado, USA: Digital Media. doi:10.7265/N5-RGI-60
Rivera, A., Benham, T., Casassa, G., Bamber, J., and Dowdeswell, J. A. (2007). Ice Elevation and Areal Changes of Glaciers from the Northern Patagonia Icefield, Chile. Glob. Planet. Change 59 (1), 126–137. doi:10.1016/j.gloplacha.2006.11.037
Robertson, C. M., Benn, D. I., Brook, M. S., Fuller, l. C., and Holt, K. A. (2012). Subaqueous Calving Margin Morphology at Mueller, Hooker and Tasman Glaciers in Aoraki/Mount Cook National Park, New Zealand. J. Glaciol. 58 (212), 1037–1046. doi:10.3189/2012JoG12J048
Rodriguez, J., Macciotta, R., Hendry, M. T., Roustaei, M., Gräpel, C., and Skirrow, R. (2020). UAVs for Monitoring, Investigation, and Mitigation Design of a Rock Slope with Multiple Failure Mechanism“ a Case Study. Landslides 17 (9), 1–14. doi:10.1007/s10346-020-01416-4
Röhl, K. (2006). Thermo-erosional Notch Development at Fresh-Water-Calving Tasman Glacier, New Zealand. J. Glaciol. 52 (177), 203–213. doi:10.3189/172756506781828773
Rossini, M., Di Mauro, B., Garzonio, R., Baccolo, G., Cavallini, G., Mattavelli, M., et al. (2018). Rapid Melting Dynamics of an alpine Glacier with Repeated UAV Photogrammetry. Geomorphology 304, 159–172. doi:10.1016/j.geomorph.2017.12.039
Sakai, A., and Fujita, K. (2010). Formation Conditions of Supraglacial Lakes on Debris-Covered Glaciers in the Himalaya. J. Glaciol. 56 (195), 177–181. doi:10.3189/002214310791190785
Sakai, A., Nishimura, K., Kadota, T., and Takeuchi, N. (2009). Onset of Calving at Supraglacial Lakes on Debris-Covered Glaciers of the Nepal Himalaya. J. Glaciol. 55 (193), 909–917. doi:10.3189/002214309790152555
Sanz‐Ablanedo, E., Chandler, J. H., Ballesteros‐Pérez, P., and Rodríguez‐Pérez, J. R. (2020). Reducing Systematic Dome Errors in Digital Elevation Models through Better UAV Flight Design. Earth Surf. Process. Landforms 45 (9), 2134–2147. doi:10.1002/esp.4871
Sato, Y., Fujita, K., Inoue, H., Sakai, A., and Karma, (2021a). Land- to lake-terminating Transition Triggers Dynamic Thinning of a Bhutanese Glacier. Cryosphere Discuss. 2021, 1–21. doi:10.5194/tc-2021-286
Sato, Y., Fujita, K., Inoue, H., Sunako, S., Sakai, A., Tsushima, A., et al. (2021b). Ice Cliff Dynamics of Debris-Covered Trakarding Glacier in the Rolwaling Region, Nepal Himalaya. Front. Earth Sci. 9 (398), 623623. doi:10.3389/feart.2021.623623
Schaefer, M., Machguth, H., Falvey, M., and Casassa, G. (2013). Modeling Past and Future Surface Mass Balance of the Northern Patagonia Icefield. J. Geophys. Res. Earth Surf. 118 (2), 571–588. doi:10.1002/jgrf.20038
Shugar, D. H., Burr, A., Haritashya, U. K., Kargel, J. S., Watson, C. S., Kennedy, M. C., et al. (2020). Rapid Worldwide Growth of Glacial Lakes since 1990. Nat. Clim. Chang. 10, 939–945. doi:10.1038/s41558-020-0855-4
Shukla, A., Garg, P. K., and Srivastava, S. (2018). Evolution of Glacial and High-Altitude Lakes in the Sikkim, Eastern Himalaya over the Past Four Decades (1975-2017). Front. Environ. Sci. 6, 81. doi:10.3389/fenvs.2018.00081
Smith, M. W., Carrivick, J. L., and Quincey, D. J. (2015). Structure from Motion Photogrammetry in Physical Geography. Prog. Phys. Geogr. Earth Environ. 40 (2), 247–275. doi:10.1177/0309133315615805
Steiner, J. F., Buri, P., Miles, E. S., Ragettli, S., and Pellicciotti, F. (2019). Supraglacial Ice Cliffs and Ponds on Debris-Covered Glaciers: Spatio-Temporal Distribution and Characteristics. J. Glaciol. 65 (252), 617–632. doi:10.1017/jog.2019.40
Sugiyama, S., Bauder, A., Huss, M., Riesen, P., and Funk, M. (2008). Triggering and Drainage Mechanisms of the 2004 Glacier-Dammed lake Outburst in Gornergletscher, Switzerland. J. Geophys. Res. 113 (F4), 920. doi:10.1029/2007JF000920
Sutherland, J. L., Carrivick, J. L., Gandy, N., Shulmeister, J., Quincey, D. J., and Cornford, S. L. (2020). Proglacial Lakes Control Glacier Geometry and Behavior during Recession. Geophys. Res. Lett. 47 (19), e2020GL088865. doi:10.1029/2020gl088865
Takasu, T., and Yasuda, A. (2009). “Development of the Low-Cost RTK-GPS Receiver with an Open Source Program Package RTKLIB.” in Proceedings of the International Symposium on GPS/GNSS, Jeju, Korea, 4–6 November 2009, Available at: http://www.rtklib.com/.
Tsutaki, S., Fujita, K., Nuimura, T., Sakai, A., Sugiyama, S., Komori, J., et al. (2019). Contrasting Thinning Patterns between lake- and Land-Terminating Glaciers in the Bhutanese Himalaya. The Cryosphere 13 (10), 2733–2750. doi:10.5194/tc-13-2733-2019
Tsutaki, S., Sugiyama, S., Nishimura, D., and Funk, M. (2013). Acceleration and Flotation of a Glacier Terminus during Formation of a Proglacial lake in Rhonegletscher, Switzerland. J. Glaciol. 59 (215), 559–570. doi:10.3189/2013JoG12J107
Tweed, F. S., and Russell, A. J. (1999). Controls on the Formation and Sudden Drainage of Glacier-Impounded Lakes: Implications for Jökulhlaup Characteristics. Prog. Phys. Geogr. Earth Environ. 23 (1), 79–110. doi:10.1177/030913339902300104
Vallet, J., Panissod, F., Strecha, C., and Tracol, M. (2011). Photogrammetric Performance of an Ultra Light Weight Swinglet "UAV. ISPRS - Int. Arch. Photogrammetry, Remote Sensing Spat. Inf. Sci. 3822, 253.
Vaughan, D. G., Comiso, J. C., Allison, I., Carrasco, J., Kaser, G., Kwok, R., et al. (2013). “Observations: Cryosphere,” in Climate Change 2013: The Physical Science Basis. Contribution of Working Group I to the Fifth Assessment Report of the Intergovernmental Panel on Climate Change. Editors T. F. Stocker, D. Qin, G.-K. Plattner, M. Tignor, S. K. Allen, J. Boschunget al. (Cambridge, United Kingdom and New York, NY, USA: Cambridge University Press), 317–382.
Warren, C., and Aniya, M. (1999). The Calving Glaciers of Southern South America. Glob. Planet. Change 22 (1), 59–77. doi:10.1016/S0921-8181(99)00026-0
Watson, C. S., Kargel, J. S., Shugar, D. H., Haritashya, U. K., Schiassi, E., and Furfaro, R. (2020). Mass Loss from Calving in Himalayan Proglacial Lakes. Front. Earth Sci. 7 342. doi:10.3389/feart.2019.00342
Watson, C. S., King, O., Miles, E. S., and Quincey, D. J. (2018). Optimising NDWI Supraglacial Pond Classification on Himalayan Debris-Covered Glaciers. Remote Sensing Environ. 217, 414–425. doi:10.1016/j.rse.2018.08.020
Willis, M. J., Melkonian, A. K., Pritchard, M. E., and Ramage, J. M. (2012). Ice Loss Rates at the Northern Patagonian Icefield Derived Using a Decade of Satellite Remote Sensing. Remote Sensing Environ. 117, 184–198. doi:10.1016/j.rse.2011.09.017
Wilson, R., Glasser, N. F., Reynolds, J. M., Harrison, S., Anacona, P. I., Schaefer, M., et al. (2018). Glacial Lakes of the Central and Patagonian Andes. Glob. Planet. Change 162, 275–291. doi:10.1016/j.gloplacha.2018.01.004
Wilson, R., Harrison, S., Reynolds, J., Hubbard, A., Glasser, N. F., Wündrich, O., et al. (2019). The 2015 Chileno Valley Glacial lake Outburst Flood, Patagonia. Geomorphology 332, 51–65. doi:10.1016/j.geomorph.2019.01.015
Keywords: Patagonia, proglacial lakes, supraglacial ponds, ice-cliff backwasting, aerial vehicle, Exploradores Glacier
Citation: Irarrazaval I, Dussaillant A, Vivero S, Iribarren-Anacona P and Mariethoz G (2022) Ice Dynamics and Morphological Changes During Proglacial Lake Development at Exploradores Glacier, Patagonia. Front. Earth Sci. 10:791487. doi: 10.3389/feart.2022.791487
Received: 08 October 2021; Accepted: 16 March 2022;
Published: 12 April 2022.
Edited by:
Juan-Luis García, Pontificia Universidad Católica de Chile, ChileReviewed by:
Koji Fujita, Nagoya University, JapanAdina Elena Racoviteanu, UMR5001 Institut des Géosciences de l’Environnement (IGE), France
Copyright © 2022 Irarrazaval, Dussaillant, Vivero, Iribarren-Anacona and Mariethoz. This is an open-access article distributed under the terms of the Creative Commons Attribution License (CC BY). The use, distribution or reproduction in other forums is permitted, provided the original author(s) and the copyright owner(s) are credited and that the original publication in this journal is cited, in accordance with accepted academic practice. No use, distribution or reproduction is permitted which does not comply with these terms.
*Correspondence: Inigo Irarrazaval, aW5pZ28uaXJhcnJhemF2YWxAY2llcC5jbA==