 Ben Dong
 Shuyi Dong1,2*
 Yingchun Wang
 Fayang Wen
 Rongcai Song
94% of researchers rate our articles as excellent or good
Learn more about the work of our research integrity team to safeguard the quality of each article we publish.
Find out more
ORIGINAL RESEARCH article
Front. Earth Sci., 08 April 2022
Sec. Economic Geology
Volume 10 - 2022 | https://doi.org/10.3389/feart.2022.785900
This article is part of the Research TopicProgress in Exploration, Development and Utilization of Geothermal EnergyView all 28 articles
Geothermal energy is a kind of clean energy, which attracts more attention. The detection of geothermal resources is inseparable from regional geothermal prospects. Land surface temperature (LST) is an indispensable parameter for geothermal exploration, but the retrieval accuracy of LST for complex and remote areas is currently a major challenge. In this article, based on Landsat 8 remote sensing data, the characteristics of surface temperature retrieval methods are systematically reviewed, and the differences among these three algorithms are researched by using them to detect the surface temperature in the study area, which is Kangding County, Sichuan Province, China. Then the experimental results of the three algorithms are verified by using long-time (more than 1 year) measured data from the two monitoring sites, and the monitoring sites are situated in Zhonggu and Lao Yulin area of Kangding County. The results show that the radiative transfer equation (RTE) has the highest accuracy, and the mean error is 0.372°C; mono-window algorithm (MW) has a mean error of −0.606°C; and the split-window (SW) algorithm has the lowest accuracy, with a mean error of −2.07°C. The experimental results were used to select an algorithm with relatively high accuracy and low sensitivity. At the same time, a time series was used to perform temperature retrieval for this study area from November 2016 to December 2017 to evaluate the applicability of the method. The result shows that the RTE has the highest accuracy in mid-winter and a relatively low accuracy in summer in Kangding County. The purpose of this article is to establish a suitable method for high-precision surface temperature retrieval in plateau areas and to provide technical support for exploring geothermal resources or evaluating geothermal potential in these areas.
At present, it is common to apply satellite remote sensing data for surface temperature retrieval characteristics. Because of medium spatial and temporal resolution, free continuous observation data, systematic scientific data archiving, etc., MODIS, Landsat series remote sensing images, and other remote sensing data are widely used (Duan et al., 2021). Using remote sensing image data information to delineate geothermal anomaly zones has attracted a lot of research work in recent years, which shows the growing interest in clean energy. The estimates of the prospects of geothermal rely on field exploration, which is expensive and subjective to the constraints of remote areas. Through the use of remote sensing thermal infrared data, it has been able to accurately obtain and highlight geothermal anomaly areas in the study area (Qin et al., 2011; van der Meer et al., 2014). This technology has been studied by scholars, who have reached a good conclusion on this issue. Previous studies are as follows:
As early as 1961, the Geothermal survey of Yellowstone National Park in the United States applied infrared remote sensing in geothermal exploration and successfully identified hot springs and other near-surface geothermal anomalies. At the beginning of the 21st century, the use of remote sensing hyperspectral data to analyze and detect geothermal anomalies began to enter the picture. By using hyperspectral data analysis, Nash et al. (2003) explored spectral anomalies of vegetation caused by geothermal gases, and by obtaining and analyzing the spectral anomalies, they completed research works related to geothermal exploration. Reath and Ramsey (2013) proposed a method to search for geothermal resources by using the spectrum of special minerals in geothermal active areas; moreover, they used hyperspectral thermal infrared data to conduct geothermal exploration research.
The use of remote sensing LST data combined with other data models to analyze and detect geothermal anomalies has become an indispensable technical tool in the geothermal industry today. Qin et al. (2011) demonstrated the use of Landsat ETM + thermal infrared (TIR) data to detect possible geothermal sites in Zhangzhou, China. They concluded that TIR data are an effective technique for detecting thermal anomalies. They found that the distribution of geothermal regions is consistent with the development of faults in the study area, which form thermal pathways for heat transfer from magma bodies in the region. Romaguera et al. (2018) mapped geothermal anomalies in the Kenya Rift Valley in the form of a 45-day time series during the winter of 2012 by combining ground-based models with remote sensing LST data. He further proposed that the areas of strong topography lead to anomalously high LST values (false positives). The conclusion showed that spatial averages are generally high in geothermal active areas, and the relative frequency of high LST is also high. Chan et al. (2018) indicated that the occurrence of hot springs and geothermal drilling has good spatial consistency with abnormal areas by using multi-temporal luminance temperature images to verify LST anomaly results and verified selected geothermal anomaly areas in detail through field investigations of hot springs and geothermal drilling. Alexandra et al. (2021) showed that an area with geothermal potential displays LST anomalies, and they extracted a 7-year LST time series of the study area, defined LST thresholds for different land covers, and used a set of logical manipulation algorithms to confirm the possibility of geothermal activity in the study area.
So far, there are still problems to be solved by researchers using LST data to detect geothermal areas. Eneva et al. (2009) pointed out the importance of obtaining nighttime surface temperatures when conducting geothermal soundings. However, it is still hard to eliminate relative hot and cold temperature anomalies caused by differences in the specific heat capacities of different surface objects. Falalakis and Gemitzi (2020) pointed out that the need for spatially and temporally consistent LST datasets cannot be met with existing techniques for estimating LST under cloudy skies.
When performing LST calculations on remote sensing data, researchers have proposed a variety of algorithms. Among these algorithms, there are many representative algorithms, including atmospheric correction method (also called radiative transfer equation method), split-window algorithm, and single-window algorithm. Yu et al. (2014) studied and compared the accuracy of these three algorithms, and finally showed that the radiative transfer equation method had the highest accuracy, followed by the split-window algorithm and the single-window algorithm (Hu et al., 2017). This experiment was proposed by quantitative comparative analysis, which has both accuracy and persuasiveness. Xiao et al. (2021) proposed that mountainous terrain is highly undulating and spatially heterogeneous, and the surface temperature inversion exhibits modeling hard, long time-series data acquisition, and validation. Nowadays, most surface temperature inversion algorithms are based on a flat surface and homogeneous ground area. It seems that no scholars have put forward an appropriate surface temperature inversion algorithm in the plateau region. The high altitude, low atmospheric water vapor content, and other points of the plateau region influence the results calculated by the algorithm.
In this paper, the authors used the atmospheric correction method, split-window algorithm, and single-window algorithm to calculate the surface temperature in Kangding County, and compare and verify the experimental results with the measured data from real-time monitoring stations in Zhonggu and Lao Yulin area. Then in this article, we will analyze the accuracy and sensitivity of the three algorithms in detail, the algorithm relatively suitable for the study area will be derived, and the applicability of the algorithm in the highland region will be comprehensively evaluated by using a time-series format. One of the purposes of this article is to provide a reference for the scholars who will apply surface temperature retrieval algorithms to highland areas.
Kangding County is located in the west of Sichuan Province and the east of Ganzi Tibetan Autonomous Prefecture, spanning 29°08′–30°46′ north latitude and 101°02′–102°30′ east longitude, covering an area of 11,600 square kilometers. National Highway 318 is the main route connecting the outside and Kangding, and Provincial Highway 211 connects Aba and Liangshan autonomous prefectures. Figure 1 shows the geographical scope of Kangding County.
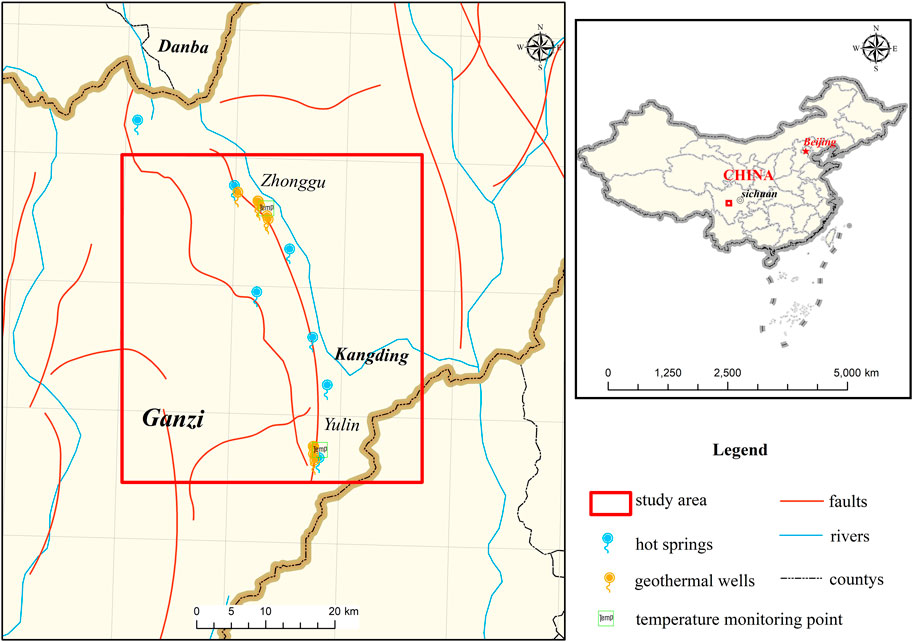
FIGURE 1. Geographical location and tectonic map of the study area.
The study area is located on the eastern edge of the Qinghai–Tibet Plateau—the border between the western Sichuan Plateau and the Sichuan Basin, and has long been subjected to cold physical and chemical weathering, and tectonic uplift erosion, forming a typical deep-cut alpine landform. Haizi Mountain, Zanduashan Mountain, and Gongga Mountain in the middle of the Big Snow Mountain run from north to south across the whole territory; these mountains divide the Big Snow Mountain into two parts, east and west parts. In the east, there are high mountains and valleys, and in the west and northwest, there are hilly plateaus, high mountains, and deep valleys. The highest point is 7,556 m above sea level, and the lowest point is only 1,390 m.
Kangding County is located in the transition zone between the western edge of the Sichuan Basin and the Qinghai–Tibetan Plateau, and the terrain slopes from west to east. According to the geographical latitude, Kangding should have a subtropical climate; because of the complex topography, there are significant vertical differences, forming a unique plateau-type continental monsoon climate. There is a large temperature difference between morning and evening, and the weather ranges from rainy and foggy to humid. The average annual temperature is 7.1°C, the average summer temperature is 15.7°C, and the lowest temperature is −14.9°C (January). The frost-free period is about 150–250 days, and the snow and ice period is from November to April every year. The multi-year average annual precipitation is 815.7 mm, mainly concentrated in May to September (multi-year average precipitation of 625.6 mm), accounting for 76.7% of the total annual precipitation. The multi-year average number of precipitation days is 178.7 days, and the average evaporation is 1,285.5 mm. The multi-year average relative humidity is 73%, with a higher humidity from June to October, averaging 80.8%, and the lowest from December to March, averaging 65%. In view of the potential geothermal resources, local characteristics, and unique tourism resources in Kangding, it is of great significance for surface temperature monitoring in Kangding County.
On 11 February 2013, NASA successfully launched the Landsat 8 satellite, which carries two sensors, the OLI Land Imager and the thermal infrared sensor (TIRS). Landsat 8 maintains basic consistency with Landsat 1–7 in terms of spatial resolution and spectral characteristics. The satellite has a total of 11 bands, bands 1–7 and 9–11 have a spatial resolution of 30 m, band 8 is a 15-m resolution panchromatic band, and the satellite can achieve global coverage once every 16 days.
Landsat 8 remote sensing image data were download from USGS (https://earthexplorer.usgs.gov/) on 20 November 2016. The image was collected at 3:48 p.m. with a resolution of 30 m. Due to the topographic factors of Kangding County, the remote sensing image covering to this area has a long-time distribution and poor image quality, and its annual amount of cloud cover is bigger. After selection, the remote sensing image of 20 November 2016 was chosen as the experimental data, which has moderate/good image quality, and the cloud cover is less than 5%. In conclusion, it is relatively suitable for temperature retrieval.
Our temperature measuring equipment is the American HOBO thermometer. The collected temperature can be approximated as the surface temperature data, and the data can be collected every 30 min on average. The collection period is from October 2016 to December 2017. In the image, we selected the average temperature of the region pixel 10 × 10 of the coordinate point of the equipment as the final experimental result (The pixel range was selected through experiments; i.e., the average regional temperature of different pixel ranges was selected as the experimental results and compared with the measured values, and the pixel range with high accuracy was selected, including 5 × 5, 10 × 10, 20 × 20, 25 × 25; refer to Supplementary Table S1 for details).
Due to limitations of space, spectrum, time, and radiation resolution of remote sensing system, it is difficult to accurately record the information of complex land surface, which will cause errors in the process of data acquisition. These errors degrade the quality of remote sensing data and affect the accuracy of experimental results, so preprocessing of the acquired remote sensing images is required. The preprocessing process includes radiometric calibration, atmospheric correction, image fusion, image stitching, and geometric alignment.
The atmospheric correction method is also known as the radiative transfer equation (RTE) algorithm. The basic principles of the atmospheric correction method are as follows: first, to estimate the atmospheric influence on the surface thermal radiation, then subtract this atmospheric effect from the total amount of thermal radiation observed by the satellite sensor to obtain the surface thermal radiation intensity, and then convert this thermal radiation intensity into the corresponding surface temperature. The calculation formulas are
where K1 (W/m2/sr/μm) and K2 (K) are sensor-specific calibration constants; for Landsat 8: Band 10: K1 = 774.89, K2 = 1,321.08; Band 11: K1 = 480.89, K2 = 1,201.14; Tsurface is the surface temperature (K), B (Ts) is the radiation brightness received by the sensor for a blackbody with temperature Ts (K); Lλ (W/m2/sr/μm) is the satellite sensor converting its image element gray value DN to the received radiation brightness value using the radiation calibration factor; gian (W/m2/sr/μm) and offset (W/m2/sr/μm) are the slope and the intercept of the response functions for Band 10 and 11, respectively. DN is the original pixel value of the image; τ and ε are the atmospheric transmittance and surface specific emissivity, respectively; L↑(W/m2/sr/μm), L↓(W/m2/sr/μm), and τ can be obtained through the NASA query website (https://atmcorr.gsfc.nasa.gov/). The calculation of surface-specific emissivity using the NDVI threshold method was proposed by Sobrino et al. (2003). Pv is the vegetation cover, which can be calculated from the normalized vegetation index NDVI according to the like dichotomous model.
The Mono-window algorithm (MW) is an algorithm derived by Qin et al. (2003) based on the surface thermal radiation induction equation. They deduced an algorithm for land surface temperature retrieval using Landsat TM Band 6 data, which is applicable to deduce land surface temperature from remote sensing data of a hot band. It is a linearized first-order Taylor series expansion of the Planck function based on the thermal radiation transfer equation. They simplified the computational models of atmospheric upward radiative brightness and atmospheric downward radiative brightness. The calculation formula is
where TS is the surface temperature (K); Tsen is the brightness temperature on the sensor (K); Ta is the average atmospheric temperature (K); a and b are the reference coefficients, when the surface temperature is 0–70°C, a = 67.355,351 and b = 0.458,606; C and D are the intermediate variables, and the calculation formula is
The key to the surface temperature retrieval by the single-window algorithm is to calculate the brightness temperature Tsensor, the surface specific emissivity ε, the atmospheric transmittance, and the average atmospheric action temperature Ta. Among them, the calculation of the atmospheric transmittance can be referred to Table 1. In the table, ω is the atmospheric moisture content (g/cm2) and is calculated as follows:
where t is the average atmospheric temperature (°C), RH is the relative humidity, and the data can be obtained through the website of China Meteorological Administration. For the mean atmospheric temperature, Qin et al. (2004) also provided an empirical formula that was derived from the standard atmosphere provided by the Modtran model. As for the article, the authors use the mid-latitude winter mean atmosphere, on account of the location of the study area, as shown in Equation 9, where it is the near-surface temperature (K).
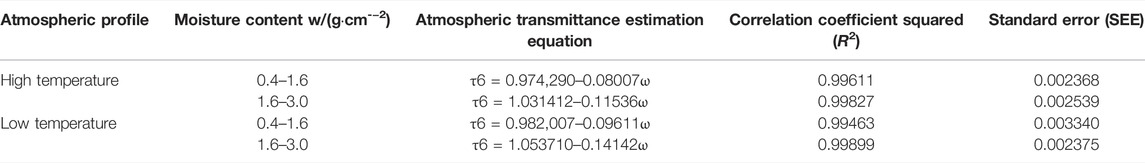
TABLE 1. Atmospheric transmittance estimation equation.
The split-window algorithm was originally developed for sea surface temperature retrieval, specifically for NOAA/AVHRR channels 4 and 5, and was later also used for surface temperature retrieval, which is more mature and has higher accuracy. Based on the surface heat radiation conduction equation, the split-window algorithm takes into account the difference of atmospheric absorption between two adjacent thermal infrared channels (generally 10.5–11.5 μm and 11.5–12.5 μm) in a 10–13 μm atmospheric window, and eliminates the influence of atmosphere through various combinations of the measured values of the two channels, then the atmospheric and surface emissivity revisions are made. Its calculation formulas is
Ts is the surface temperature (K); Ti and Tj are the brightness temperatures (K) corresponding to i and j bands, in K. Combining with the characteristics of Landsat 8, i = 10 and j = 11; A0, A1, and A2 are the conversion parameters of TIRS10,11 bands, which are determined by the factors of atmospheric transmittance and surface specific emissivity, and for different algorithms, their values vary. The inverse regression coefficients of TIRS in different temperature ranges derived by Qin et al. (2004) were selected for this algorithm, taking a10 = −62.8065 and b10 = 0.4338; a11 = −67.1728 and b11 = 0.4694. Combined with the characteristics of Landsat 8, each parameter is calculated as
After a series of accuracy and sensitivity analyses, it was initially concluded that RTE has the highest applicability in this study area, followed by MW, and SW has some limitations for this study area due to its excessive sensitivity to atmospheric transmittance and surface specific emissivity. To better highlight the applicability of RTE, the method was used to make the corresponding temperature retrieval for the study area from November 2016 to December 2017, presented as a time series, and then compared and analyzed with the measured data to discuss and evaluate the applicability of RTE in the highland region.
Landsat 8 image data were still downloaded from USGS (https://earthexplorer.usgs.gov/), and the time series distribution was from November 2016 to December 2017. Due to the influence of high cloud coverage on experimental results, images with cloud coverage less than 15% were selected as experimental objects; 11 selected image data could fully represent temperature changes in the study area for 1 year. The data selection process is shown in Table 2.
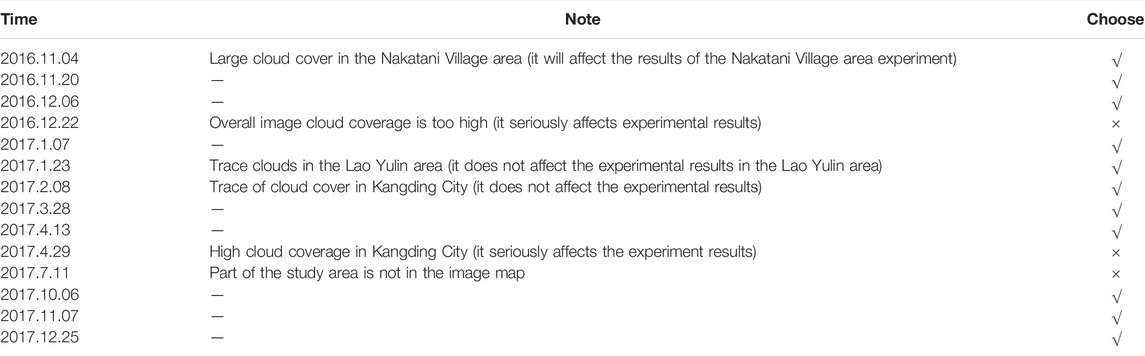
TABLE 2. Selection of image data.
Based on real-time monitoring instruments in two areas, Zhonggu and Lao Yulin, surface temperature was calculated using RTE, MW, and SW, and the results were compared with the measured data. Figure 2A, Figure 2B, and Figure 2C show the results of RTE, MW, and SW retrieval, respectively. Referring to the LST results obtained from the retrieval of the three algorithms, the overall temperature distribution trend is roughly the same, with high correlation. The areas with higher temperatures are mainly located in the western mountainous areas; the northeastern and southeastern areas have lower temperatures; the northern and central areas have moderate temperatures. Combined with the surrounding terrain factors of Kangding County, it is concluded that the high temperature area is relatively concentrated in the west and northwest, while the eastern area is mainly bare soil and trees, and there are more low temperature areas.
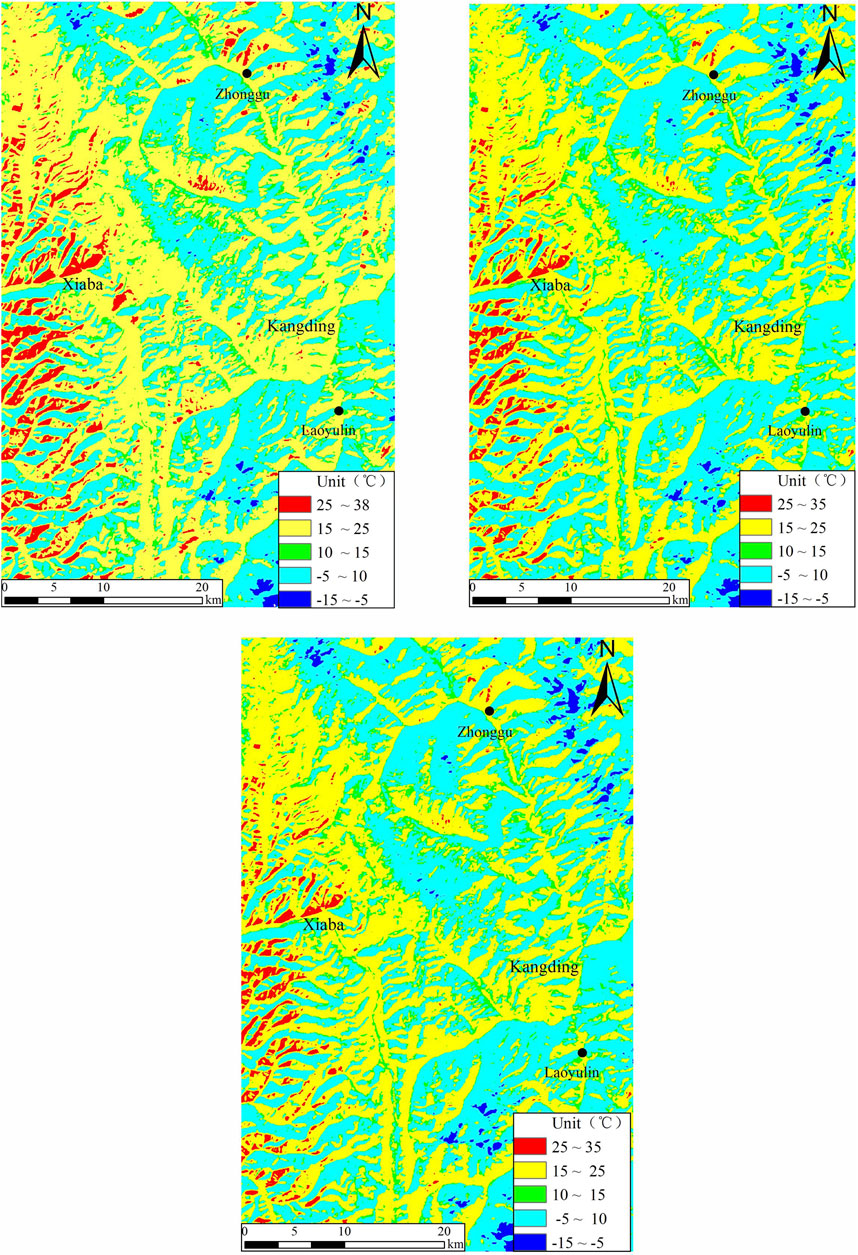
FIGURE 2. Plot of LST retrieval results of three algorithms. From left to right:(A) RTE; (B) MW; and (C) SW.
From Table 3, the temperature values derived from the retrieval of the three algorithms are Zhonggu: 16.314, 16.027, and 14.928°C, and the measured temperature is 16.034°C, while the temperature values in the Lao Yulin were 16.317, 14.654, and 12.819°C, and the measured temperature was 15.843°C. The statistics of surface temperature retrieval results are shown in Table 3, △ indicates the absolute error of retrieval results, and △R indicates the mean error.
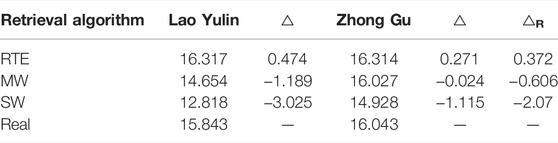
TABLE 3. Statistics of LST retrieval results (unit: °C).
After the screening of the 11 image data, RTE was used to conduct temperature retrieval for the 11 images. The statistics of the experimental results are shown in Figure 3 and Table 4.
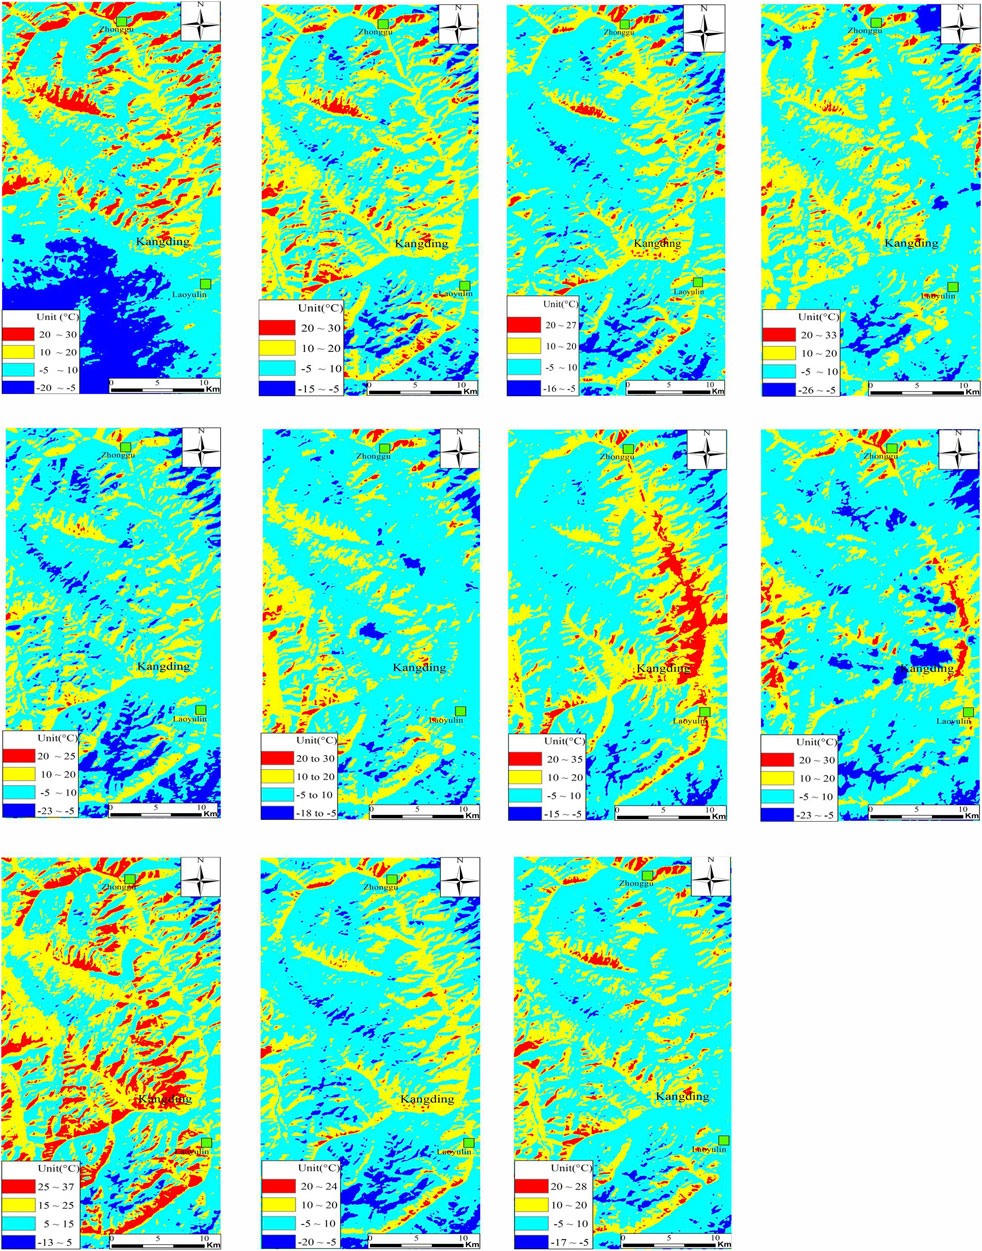
FIGURE 3. RTE LST retrieval results. In the order of 11.04.2016–12.12.2017.
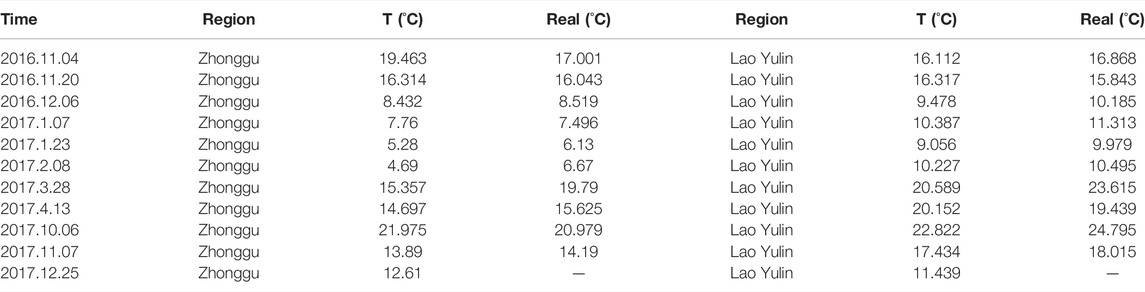
TABLE 4. Statistics of RTE LST retrieval results.
According to the results in Table 3, the mean error of RTE is 0.372°C, the mean error of MW is −0.606°C, and the mean error of SW is −2.07°C. Among them, the RTE retrieval results are all higher than the measured results, while the retrieval results of the two other algorithms are lower than the measured results; in terms of accuracy, it is obvious that RTE has the lowest temperature deviation, higher accuracy, and more credibility, followed by MW, while SW has a lower accuracy.
The analysis results show that the temperature retrieval results of RTE in this study area are higher than the measured data, while MW and SW are generally lower than the measured data. The preliminary judgment is that due to the complex topography of the Kangding area, the observation angle and the topographic features, slope, and slope direction in the study area will affect the accuracy of the algorithm, the sensitivity of various algorithms is different, and the degree of influence by atmospheric water vapor content and surface specific emissivity are different.
Atmospheric transmittance has a very important effect on the conduction of surface heat radiation in the atmosphere and is the basic of surface temperature retrieval. Accurate acquisition of atmospheric transmittance is beneficial to access performance of surface temperature with high accuracy. There are many factors affecting the atmospheric transmittance, such as air pressure, air temperature, aerosol content, and atmospheric water vapor content; all have different degrees of effect on the conduction of thermal radiation, thus making the surface thermal radiation conduction in the atmosphere produce attenuation parameters.
Based on the remote sensing data of the study area in Kangding County on 20 November 2016, sensitivity analysis was performed on the atmospheric transmittance. The retrieval results of the three algorithms were observed and then compared with the measured data for analysis. △m indicates the average rate of change of surface temperature due to the effect of atmospheric transmittance. The results of the sensitivity analysis are shown in Table 5 and Figure 4.
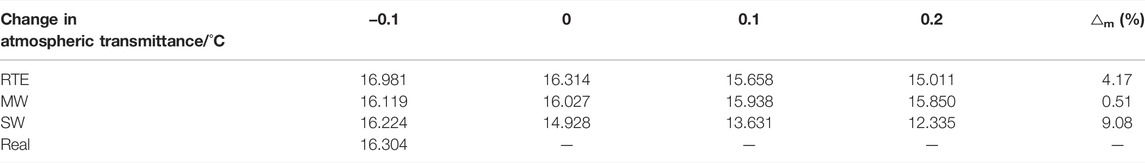
TABLE 5. Variation in surface temperature due to atmospheric transmittance errors (unit: °C).
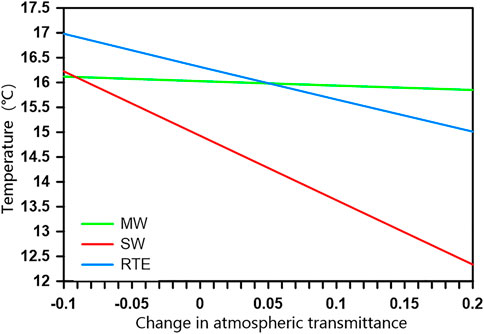
FIGURE 4. Variation in surface temperature due to atmospheric transmittance errors.
According to Table 5 and Figure 4, when atmospheric transmittance increases or decreases by 0.1, the average change rate of atmospheric transmittance obtained by RTE, MW, and SW is 4.17, 0.51, and 9.08% respectively, and the average change of surface temperature is 0.667°C, 0.086 2°C, and 1.299°C, respectively. The results show that MW is less sensitive to atmospheric transmittance and less affected by atmospheric transmittance; RTE has moderate influence and sensitivity to it; SW is greatly influenced and sensitive to it.
Surface specific emissivity is another key parameter for surface temperature retrieval. In the analysis of surface specific emissivity sensitivity, three algorithms are modeled separately, and the relevant parameters mentioned above are pre-input as constant values when applying these models to surface temperature retrieval. Based on the remote sensing data of the study area in Kangding County on 20 November 2016, a sensitivity analysis of the surface specific emissivity was performed, taking a step size of 0.01, observing the retrieval results of the three algorithms, and then comparing the analysis with the actual measured data. △1 indicates the average rate of change of surface temperature due to the effect of atmospheric transmittance, and the results of sensitivity analysis are shown in Table 6 and Figure 5.
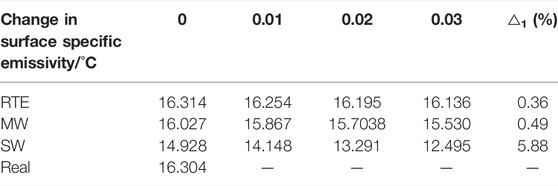
TABLE 6. Surface temperature change due to surface specific emissivity error (unit: °C).

FIGURE 5. Surface temperature change due to surface specific emissivity error.
According to Table 6 and Figure 5, as the surface specific emissivity increases by 0.01, the average rate of change of RTE retrieval results by surface specific emissivity is 0.36% and the average change of surface temperature value is 0.06°C; the average rate of change of MW by surface specific emissivity is 0.49% and the average change of surface temperature value is 0.08°C; the average rate of change of SW by surface specific emissivity is 5.88% and the average change of surface temperature value was 0.8°C. The results show that RTE and MW are less influenced by surface specific emissivity and both have less sensitivity to surface specific emissivity; SW is more affected by surface emissivity and sensitive to atmospheric transmittance.
The influence of near-surface temperature on the temperature retrieval results is mainly reflected in the fact that the change of near-surface temperature directly affects the average atmospheric temperature, while it indirectly has a significant effect on the change of atmospheric transmittance. For the mean atmospheric temperature, Qin et al. (2003) provided an empirical formula, which was derived from the standard atmosphere provided by the Modtran model. The study area of Kangding County was determined to be a mid-latitude winter mean atmosphere, corresponding to Eq. 9.
Based on the remote sensing data of the study area in Kangding County on 20 November 2016, the sensitivity analysis of near-surface temperature is carried out with an increase of 1°C, and the retrieval results of the three algorithms were observed and then compared with the actual measured data for analysis. △1 indicates the average rate of change of surface temperature due to the effect of near-surface temperature, and the results of sensitivity analysis are shown in Table 7 and Figure 6.
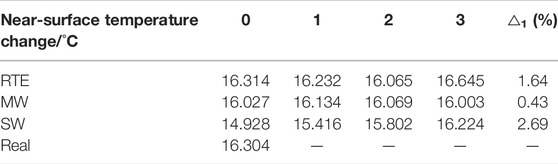
TABLE 7. Changes in surface temperature due to near-surface temperature errors (unit: °C).
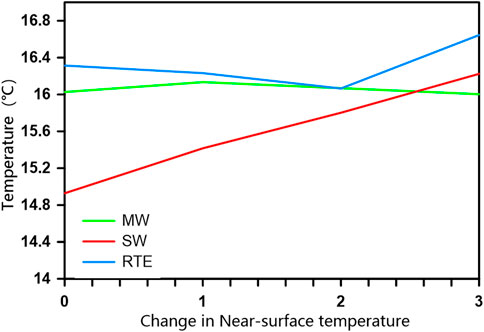
FIGURE 6. Variation of surface temperature due to near-surface temperature error.
According to Table 7 and Figure 6, the average rate of change of RTE retrieval results by near-surface temperature is 1.64% for every 1°C increase in near-surface temperature, and the average change of surface temperature value is 0.27°C. However, when the temperature increases by 3°C, the temperature changes from a decreasing trend to an increasing trend, and the preliminary judgment is that because the near-surface temperature will indirectly affect the atmospheric transmittance when the atmospheric correction model is established, when the value-added reaches a certain limit, it will change the atmospheric transmittance and thus affect the retrieval results. The average rate of change of MW by near-surface temperature is 0.43%, and the average change of surface temperature value is 0.07°C; the average rate of change of SW by near-surface temperature is 2.69%, and the average change of surface temperature value is 0.42°C. The results show that MW is less affected by near-surface temperature and less sensitive to near-surface temperature; RTE is affected by near-surface temperature and will become larger with the gradual increase of temperature and more sensitive to near-surface temperature; SW is more affected by near-surface temperature and more sensitive to near-surface temperature.
In order to more intuitively compare the retrieval accuracy of RTE in this study area for 1 year, the measured data and experimental results of each station were drawn into a line graph for comparison. The measured data were not collected up to 25 December 2017, because the monitoring site stopped operating on 10 November 2017. The applicability of RTE in the study area can still be evaluated by comparing the overall experimental results with the measured data trends (for details, see Figure 7 and Figure 8). Detailed data are shown in the attached Supplementary Table S2.
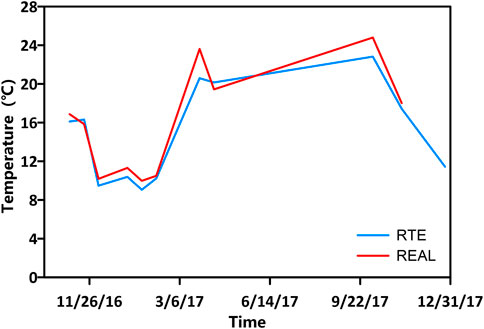
FIGURE 7. Comparison of experimental results and actual measurement data in Zhonggu.
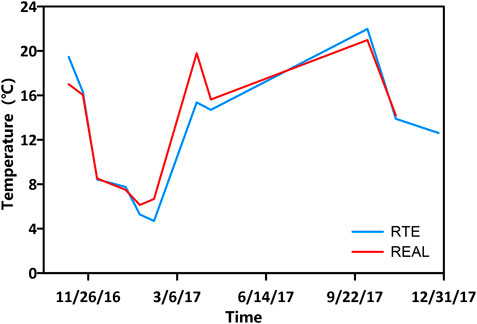
FIGURE 8. Comparison of experimental results and measured data in the Lao Yulin.
According to Table 7, and Figure 7 and Figure 8, the trend of RTE retrieval is basically the same with the measured data, and the time series were divided into winter and summer with February 8 as the node. The overall accuracy of the results is about 0–4°C, and the highest retrieval accuracy in winter with an error of 0–1°C; the retrieval accuracy in summer is lower with an error of 1–4°C. By comparison, it is found that the error results of the 3 days of 4 November 2016, 8 February 2017, and 6 October 2017 are significantly different between the two monitoring stations. The overall experiment accuracy is higher in the Laoyulin area, and the accuracy is higher in Zhonggu Village in different time periods. Preliminary judgment might be because the terrain of Kangding urban area is obvious. The altitudes of Zhonggu Village and Laoyulin area are different, and the atmospheric water vapor content and near-surface temperature in the high-altitude area are relatively low. In addition, they are affected by topography, slope aspect, cloud cover, and vegetation coverage, so the experimental errors of the same method in the two places are completely different.
We found that from July to mid-September, the experimental results in the Zhonggu Village area were lower than the measured value, while the experimental results in the Laoyulin area were higher than the measured value. Preliminary judgment cloud cover is one of the reasons; as the result of the Kangding area for performance is often cloudy in the summer, there are thick clouds and the characteristics of dispersion may directly affect the study area, and we did not choose this period of remote sensing images, so if the actual situation in the clouds covered the study area, deviation will directly lead to the result of the experiment. In the location of this study area, winter and summer are predominant throughout the year, and in the peak of summer, cloudy or scattered thick clouds often appear. We did not select remote sensing images from July to September, when cloudiness is most pronounced, but simulated the surface temperature during this period by using experimental results from images with low cloudiness in other months. However, we can judge the possible factors for the anomalous deviations in the two plots: 1. caused by cloud cover and 2. differences in the sensitivity of the algorithm in different seasons. Finally, we conclude that the accuracy of RTE is higher in winter and lower in summer in the study area of Kangding County. The above sensitivity and accuracy analyses shows that the surface temperature retrieval results of RTE are more reliable than the other two algorithms in the Kangding study area and are suitable for highland areas.
Local and regional geothermal energy prospects are a prerequisite for geothermal energy development. However, due to operational costs and site accessibility, existing geophysical methods for estimating geothermal potential are usually limited to the exploration scale. Therefore, exploration of large-scale areas such as surface temperature and thermal anomalies mainly relies on thermal infrared images from remote sensing satellite (Chan et al., 2018). Although IR remote sensing is currently limited to detecting supersurface and shallow buried geothermal resources, it is a valuable tool that provides an effective mapping and quantification method that can greatly facilitate the assessment of local geothermal potential and the development of geothermal resources.
Usually, scholars use high-resolution time series data, together with two LST datasets (one for remotely sensed data and the other for land surface empirical data) to discuss the thermal anomaly area. Some scholars have also adopted a deviation bias approach in which the differences between the two LST datasets in a non-geothermal region are analyzed, the region is clustered based on hydrometeorological and surface properties, and a spatially averaged LST deviation is assigned to each cluster, and then the LST is calculated for the entire region. It is then assumed that these differences are partly due to the geothermal component being represented in the remote sensing data only, which allows the geothermal area to be determined and the results to be compared with the given geothermal area map. However, it is not always possible to choose a specific time and date for analysis due to the constraints of the acquisition time in a given region.
Due to the large number of geothermal fields in the geothermal active area, rift zones occur when tectonic extension and convection in the area of upwelling thermal material thins the lithospheric plates. The continuous supply of heat sources increases the heat flow and thermal energy at shallow depths compared to other tectonic environments, leading to anomalies in the land surface LST. Using remote sensing image data LST to detect geothermal fields leads to more dispersed geothermal anomalies. Several other areas are highlighted, which form potential geothermal zones, and the highlighted points are often associated with thermally active tectonic zones, that is, basement faults in the basement or rising angular structures.
The two temperature monitoring sites selected for this study—the Laoyulin and the Zhonggu area—have hot spring. In the northern part of the study area, the hot spring in the Zhonggu area is called Xikang Hot spring, and the temperature of the hot spring reaches 76°C. In the southern part, the hot spring in the Laoyulin area is called Guanding Hot spring, and the temperature reaches 77.6°C. Xikang Hot spring has become one of the local tourist attractions, featuring its spa and wellness. After exploration of these two areas, boiling hot springs and geysers were found in two areas. By investigating the hot springs and the field, the selected area was preliminarily judged as the geothermal anomaly area. It also shows that there is a good spatial consistency between hot spring occurrence and thermal anomaly areas.
Through the previous research results, the geotectonic and background of the Kangding geothermal activity area in the study area of this article are analyzed. First, due to the special geological and tectonic background of the Kangding geothermal anomaly area, the hydrothermal activity in the study area is intense. The geothermal system belongs to the convective conduction type, so the traditional method of analyzing geothermal gradient by testing the geothermal heat flow value is not precise enough [even though geodetic heat flow values for the region have been discussed by researchers in the region, they are still imperfect (Guo et al., 2017). In addition, the tectonic activity in the Kangding area is intense, the heat flow component consisting of shear friction heat generation and plastic deformation heat generation in the crust should not be negligible, and the proportion of the heat contribution to the lithosphere from the radiogenic heat flow component in the crust and the conduction heat flow component in the mantle is unknown, so it is an effective means to detect the geothermal field by LST using remote sensing thermal infrared data for the area.
However, only preliminary work has been done in this paper, that is, a comparative analysis of three surface temperature retrieval algorithms and a comprehensive evaluation of the applicability of RTE in highland areas, aiming to provide a relatively reliable basis for geothermal resource for the future development or excavation of geothermal prospective areas.
Based on Landsat 8 remote sensing imagery of 20 November 2016 in the Kangding County study area, three algorithms are adopted in this study: the atmospheric correction method (radiative transfer equation, RTE), split-window algorithm (SW algorithm), and mono-window algorithm (MW algorithm) were used to retrieval the surface temperature of the study area. Based on the measured data of two real-time monitoring stations located in Zhonggu and Laoyulin area, Kangding county, comparative analysis and accuracy verification of retrieval results are made, and the following conclusions are preliminarily drawn:
1) In the study area with complex topographic features—Kangding County as an example, RTE has the highest accuracy with a mean error of 0.372°C, followed by MW with an accuracy of −0.606°C, which is slightly higher than that of SW, −2.07°C.
2) In the study area, the temperature values using RTE retrieval are higher than the measured values, while the temperature values of MW and SW retrieval are lower than the measured values. It is preliminarily judged that the accuracy of the algorithm is affected by the observation angle, the topographic features, slope, and slope direction in the study area.
3) For the two monitoring stations, Zhonggu and Laoyulin area, the regional temperature difference values of the three algorithms are also different. The regional temperature difference value of RTE is the smallest, only 0.01°C, followed by MW with a regional temperature difference value of 1.373°C, and SW with the largest regional temperature difference value of 2.11°C. The influence of regional factors also causes different effects on the retrieval results of each algorithm, among which RTE has the smallest influence and SW has the largest influence.
4) High emissivity and low water vapor content exist in the high-altitude study area like Kangding. After comprehensive comparison analysis, it is concluded that MW has the lowest comprehensive sensitivity; RTE has higher sensitivity to atmospheric transmittance and moderate comprehensive sensitivity. However, SW is too sensitive to surface specific emissivity and atmospheric transmittance, which has some limitations for temperature retrieval in this area.
5) Through in-depth analysis of the temperature retrieval results of RTE in the study area of Kangding County by using time series, it can be seen that the experimental accuracy of RTE in Kangding County is higher in winter and relatively lower in summer, and affected by altitude and other factors, the performance effects in different regions are different.
6) The use of thermal infrared remote sensing can produce spatially representative experimental results over a much larger area than traditional geothermal exploration methods. However, this method is also only applicable to the exploration of shallow geothermal resources, so in the future, we need to discover new means of exploring and monitoring geothermal resources. This requires not only further mastery of the mechanistic analysis of geothermal anomalies but also a thorough analysis of the geological structure of the study area. This approach of combining geothermal mechanistic analysis with geological structures will greatly improve the effectiveness of geothermal exploration and monitoring.
In this article, by comparing the results of temperature retrieval of the three algorithms in the study area of Kangding County and systematically evaluating the RTE in the form of time series, the results show that the algorithm has certain applicability for LST retrieval in the study area and can provide some references for surface temperature retrieval in highland areas. However, due to the insufficient number of monitoring stations, the accuracy of the three algorithms could not be verified and evaluated more systematically and comprehensively.
The original contributions presented in the study are included in the article/Supplementary Material; further inquiries can be directed to the corresponding author.
DB: algorithm analysis, methodology, and writing—original draft. SD: writing—review, algorithm analysis, methodology. WY: writing—review and editing, and methodology. WF: mapping and analysis of results. YC: algorithm analysis and mapping. ZJ: writing—original draft, and analysis of results. SR: writing—review and editing, and methodology.
This study was supported by the Natural Science Foundation of China’s project: No. 42002300.
The authors declare that the research was conducted in the absence of any commercial or financial relationships that could be construed as a potential conflict of interest.
All claims expressed in this article are solely those of the authors and do not necessarily represent those of their affiliated organizations, or those of the publisher, the editors, and the reviewers. Any product that may be evaluated in this article, or claim that may be made by its manufacturer, is not guaranteed or endorsed by the publisher.
The editors and the two reviewers are also thanked for their comments on the improvement of the manuscript.
The Supplementary Material for this article can be found online at: https://www.frontiersin.org/articles/10.3389/feart.2022.785900/full#supplementary-material
Alexandra, G., Paschalis, D., and George, F. (2021). Detecting Geothermal Anomalies Using Landsat 8 thermal Infrared Remotely Sensed Data International Journal of Applied Earth Observations and Geoinformation. Int. J. Appl. Earth Obs. Geoinf. Available at: www.elsevier.com/locate/jag.
Chan, H. P., Chang, C. P., and Dao, P. D. (2018). Geothermal Anomaly Mapping Using Landsat ETM+ Data in Ilan Plain, Northeastern Taiwan. Pure Appl. Geophys. 175 (1), 303–323. doi:10.1007/s00024-017-1690-z
Duan, S. B., Ru, C., Li, Z., Wang, M. M., Xu, H. Q., Li, H., et al. (2021). Progress of Remote Sensing Inversion of Surface Temperature from Landsat thermal Infrared Data. J. Remote Sensing 08, 1591–1617.
Eneva, M., and Coolbaugh, M. F. (2009). Importance of Elevation and Temperature Inversions for the Interpretation of thermal Infrared Satellite Images Used in Geothermal Exploration. Trans. - Geothermal Resour. Counc. 33, 415–418.
Falalakis, G., and Gemitzi, A. (2020). A Simple Method for Water Balance Estimation Based on the Empirical Method and Remotely Sensed Evapotranspiration Estimates. J. Hydroinformatics 22, 440–451. doi:10.2166/hydro.2020.182
Guo, Q., Pang, Z., Wang, Y., and Tian, J. (2017). Fluid Geochemistry and Geothermometry Applications of the Kangding High-Temperature Geothermal System in Eastern Himalayas. Appl. Geochem. 81, 63–75. doi:10.1016/j.apgeochem.2017.03.0070883-2927
Hu, D., Qiao, K., Wang, X., Zhao, L., and Guohua, J. (2017). Inversion Using Single Window Algorithm Landsat 8 TIRS Data Surface Temperature [J]. J. Wuhan Univ. (Information Sci. Edition) 42 (07), 869–876. doi:10.13203/j.whugis20150164
Nash, G. D., Moore, J. N., and Sperry, T. (2003). Vegetal-spectral Anomaly Detection at the Cove Fort-Sulphurdale thermal Anomaly, Utah, USA: Implications for Use in Geothermal Exploration: Implications for Use in Geothermal Exploration. Geothermics 32 (2), 109–130. doi:10.1016/s0375-6505(03)00012-9
Qin, Q., Zhang, N., Nan, P., and Chai, L. (2011). Geothermal Area Detection Using Landsat ETM+ thermal Infrared Data and its Mechanistic Analysis-A Case Study in Tengchong, China. Int. J. Appl. Earth Obs. Geoinf. 13 (4), 552–559. doi:10.1016/j.jag.2011.02.005
Qin, Z., Li, W., Zhang, M., Karnieli, A., and Berliner, P. (2003). Atmospheric Parameter Estimation Method by Single Window Algorithm[J]. Remote Sensing Land Resour. 02, 37–43.
Qin, Z., Mao, K., and Liu, W. (2004). Inversion of Surface Temperature in the Bohai Rim Using MODIS Imagery and Single Window Algorithm. Mapp. Spat. Geogr. Inf. 06, 23–25.
Reath, K. A., and Ramsey, M. S. (2013). Exploration of Geothermal Systems Using Hyperspectral thermal Infrared Remote Sensing. J. Volcanol. Geotherm. Res. 265, 27–38. doi:10.1016/j.jvolgeores.2013.08.007
Romaguera, M., Vaughan, R. G., Ettema, J., Izquierdo, V. E., Hecker, C. A., and van der Meer, F. D. (2018). Detecting Geothermal Anomalies and Evaluating LST Geothermal Component by Combining thermal Remote Sensing Time Series and Land Surface Model Data. Remote Sensing Environ. 204, 534–552. doi:10.1016/j.rse.2017.10.003
Sobrino, J. A., and Jimnez-Muoz, J. C. (2003). A Generalized Single-Channel Method for Retrieving Land Surface Temperature from Remote Sensing Data. J. Geophys. Res. 108 (D22), 4688. doi:10.1029/2003JD003480
Van der Meer, F., Hecker, C., van Ruitenbeek, F., van der Werff, H., de Wijkerslooth, C., and Wechsler, C. (2014). Geologic Remote Sensing for Geothermal Exploration: A Review. Int. J. Appl. Earth Obs. Geoinf. 33, 255–269. doi:10.1016/j.jag.2014.05.007
Xiao, Y., Ma, M., and Wen, J. (2021). Progress in Land Surface Temperature Retrieval over Complex Surface. Remote Sens. Technol. Appl. 36 (1), 33–43.
Keywords: land surface temperature, algorithm comparison, time series, Landsat 8, Kangding geothermal area
Citation: Dong B, Dong S, Wang Y, Wen F, Yu C, Zhou J and Song R (2022) Detecting Geothermal Resources in a Plateau Area: Constraints From Land Surface Temperature Characteristics Using Landsat 8 Data. Front. Earth Sci. 10:785900. doi: 10.3389/feart.2022.785900
Received: 29 September 2021; Accepted: 24 January 2022;
Published: 08 April 2022.
Edited by:
Shu Jiang, The University of Utah, United StatesReviewed by:
Zheming Shi, China University of Geosciences, ChinaCopyright © 2022 Dong, Dong, Wang, Wen, Yu, Zhou and Song. This is an open-access article distributed under the terms of the Creative Commons Attribution License (CC BY). The use, distribution or reproduction in other forums is permitted, provided the original author(s) and the copyright owner(s) are credited and that the original publication in this journal is cited, in accordance with accepted academic practice. No use, distribution or reproduction is permitted which does not comply with these terms.
*Correspondence: Shuyi Dong, MzI2Nzg3NTFAcXEuY29t
Disclaimer: All claims expressed in this article are solely those of the authors and do not necessarily represent those of their affiliated organizations, or those of the publisher, the editors and the reviewers. Any product that may be evaluated in this article or claim that may be made by its manufacturer is not guaranteed or endorsed by the publisher.
Research integrity at Frontiers
Learn more about the work of our research integrity team to safeguard the quality of each article we publish.