 Lorenzo G. Candioti
 Thibault Duretz2
 Stefan M. Schmalholz
94% of researchers rate our articles as excellent or good
Learn more about the work of our research integrity team to safeguard the quality of each article we publish.
Find out more
ORIGINAL RESEARCH article
Front. Earth Sci., 04 May 2022
Sec. Structural Geology and Tectonics
Volume 10 - 2022 | https://doi.org/10.3389/feart.2022.785418
This article is part of the Research TopicTectono-Magmatism, Metallogenesis, and Sedimentation at Convergent MarginsView all 13 articles
Subduction zones are essential drivers of plate tectonics. However, the processes causing subduction zone initiation (SZI), involving the formation of a new plate boundary, and the forces required remain disputed. Here, we focus on horizontally forced SZI at passive margins and quantify the horizontal force required for SZI with two-dimensional petrological-thermomechanical numerical models. The initial configuration, involving two passive margins bounding a 400 km wide basin with exhumed mantle, is calculated by a numerical rifting simulation to guarantee thermomechanical feasibility and isostatic equilibrium. SZI occurs at one passive margin during convergence of the basin-margin system. SZI is caused by thermal softening due to local shear heating. A local temperature increase of only ca. 50°C is sufficient to cause SZI. Corresponding simulations without shear heating do not show SZI, showing unequivocally that thermal softening controls SZI. We systematically limit the lithospheric deviatoric stress to determine the minimum force required for SZI. A minimum force (per unit length) of ca. 14 TN m−1 is required for SZI; a force magnitude that agrees with independent estimates from mantle convection models. However, for the associated stress limit of 200 MPa the lithosphere is so weak that slab detachment (SD) already occurs at the onset of basin closure in the horizontal, non-subducted region of the subducting plate. Only for stress limits
Earth is the only planet in our Solar System known to have currently active plate tectonics. Subduction zones, where old lithosphere is recycled back into the mantle, are major drivers of plate motion. However, the mechanisms that form convergent plate boundaries and create new subduction zones remain elusive (Stern, 2004; Stern and Gerya, 2018; Crameri et al., 2020). Two conceptual endmember scenarios for subduction zone initiation (SZI) have been proposed in the past decades: spontaneous, or vertically-forced, and induced, or horizontally-forced SZI (Stern, 2004; Stern and Gerya, 2018; Crameri et al., 2020). Vertically-forced SZI is supposedly driven by the increasing density, and therefore buoyancy, contrast between cooling oceanic lithosphere moving away from mid-ocean ridges and the underlying mantle. The feasibility of this scenario is disputed (e.g., Mueller and Phillips, 1991), particularly for SZI at passive margins. Cloetingh et al. (1989) already estimated that if SZI is not successful by ca. 20 Myr after continental break-up, the body force arising from density contrasts is likely insufficient to break the oceanic lithosphere. In fact, old ages of ocean floor (e.g., Müller et al., 2008) and various data collected from recent and ancient subduction zones (Crameri et al., 2020; Lallemand and Arcay, 2021) indicate that vertically-forced SZI was unlikely the dominant scenario during the last ca. 100 Myr. Instead, an additional horizontal compressive force, i.e., horizontally-forced SZI (McKenzie, 1977; Crameri et al., 2020), is required to overcome the increasing strength of cooling oceanic lithosphere. Recent geophysical observations of the Puysegur plate boundary south of New Zealand suggest that horizontal forces initially dominate at the site of SZI, but with time, vertical forces can accelerate, propagate along strike and facilitate the development of self-sustaining subduction (Shuck et al., 2022). However, both the horizontal force required for SZI as well as the processes causing strain localization and creating a new plate boundary remain poorly constrained.
Due to the large time and spatial scales, the complex petrological-thermomechanical feedbacks and the sparsity of geological evidence for SZI on present-day Earth (e.g., Crameri et al., 2020), a suitable method to study SZI is numerical geodynamic modelling. Published numerical models of SZI can be classified in two categories: 1) Models that investigate SZI at already existing, weak plate boundaries, which are prescribed as weak zones in the initial model configuration. These studies focus on the onset of sinking of a lithospheric plate and sometimes on the subduction of one plate below another plate (e.g., Malatesta et al., 2013; Zhong and Li, 2020; Zhou et al., 2020; Zhou and Wada, 2021). These studies do not investigate the formation of a new convergent plate boundary associated with SZI. 2) Models that investigate both SZI and the associated formation of a new convergent plate boundary, without a priori prescribing an already existing weak plate boundary in the initial model configuration (e.g., Thielmann and Kaus, 2012; Auzemery et al., 2020; Kiss et al., 2020; Candioti et al., 2021). The plate boundary formation must be numerically simulated in these models and, hence, these models can be used to determine the horizontal force required for SZI at, for example, passive margins. SZI involving the formation of a new plate boundary at a passive margin, so-called newly destructive SZI after Crameri et al. (2020), requires most likely a mechanism that mechanically softens, or weakens, the lithosphere while compressive horizontal forces build up. Several softening mechanisms have been proposed that can facilitate strain localisation of a compressed lithosphere during SZI, such as reaction-induced softening (e.g., White and Knipe, 1978), fluid-induced softening (e.g., Regenauer-Lieb et al., 2001; Dymkova and Gerya, 2013), evolution of fabric and anisotropy (e.g., Montési, 2013) or grain damage (e.g., Bercovici and Ricard, 2012; Mulyukova and Bercovici, 2018). All these mechanisms require knowledge of microscale (i.e., mineral grain scale) or two-phase (solid-fluid) pore-scale processes, which remain poorly constrained and are challenging to upscale for lithosphere models having typically numerical resolutions in the order of a kilometer. A softening mechanism that does not require assumptions of microscale and two-phase processes and that results only from the fundamental law of conservation of energy and the well established temperature dependence of viscous creep of rocks is thermal softening (e.g., Yuen et al., 1978; Regenauer-Lieb and Yuen, 1998). The conversion of dissipative work into heat, so called shear or strain heating, is inherent in all inelastic deformation such as viscous, or rate-dependent, and plastic, or rate-independent deformation. Hence, since viscous creep is thermally activated (e.g., Turcotte and Schubert, 2014), thermal softening may effectively reduce the strength of the viscously deforming regions of the lithosphere and yield to spontaneous formation of shear zones (e.g., Yuen et al., 1978; Regenauer-Lieb and Yuen, 1998; Leloup et al., 1999; Takeuchi and Fialko, 2012; Kiss et al., 2019). Furthermore, all physical processes proposed to explain high-velocity weakening of frictional faults are essentially related to shear heating (e.g., Aharonov and Scholz, 2018). Therefore, we consider here shear heating and associated thermal softening of viscous creep as main softening mechanism during SZI on the lithospheric scale, as has been done in several previous studies (Thielmann and Kaus, 2012; Jaquet and Schmalholz, 2018; Kiss et al., 2020; Auzemery et al., 2020, 2021).
Models for SZI at passive margins consider frequently an initial model configuration with an idealized, ad hoc designed passive margin geometry and associated temperature field (e.g., Auzemery et al., 2020; Kiss et al., 2020). At an idealized passive margin with homogeneous crustal and mantle material properties, Kiss et al. (2020) reported a required horizontal force per unit length of ca. 37 TN m−1, indicating that high driving forces are required for shear heating to cause SZI. Such large driving forces, and associated locally high deviatoric stresses, have been used as argument against thermal softening being a feasible mechanism for shear localization (e.g., Platt, 2015). An important step to reduce the driving force necessary for SZI by thermal softening is to consider more realistic passive margin architectures. Including mechanical heterogeneities and numerically modelling the architecture of passive margins prior to convergence, instead of designing these margins ad hoc, Candioti et al. (2020) and Candioti et al. (2021) report significantly smaller force magnitudes between 15 and 18 TN m−1 for thermal softening induced SZI. Although the plate driving force magnitudes in these models are significantly reduced, a minimum value for horizontal forces required for SZI via thermal softening has not been quantified yet in a systematic way. Here, we generate the passive margin architecture with a numerical lithosphere rifting simulation and apply this architecture as initial configuration for convergence simulations to investigate SZI at passive margins (see also Candioti et al., 2020, 2021, for detailed discussion). Advantages of using a numerically calculated passive margin architecture as initial configuration are that 1) such architecture is thermomechanically feasible and consistent with the applied convergence model, 2) it is isostatically stable and 3) the initial temperature field, including thermal convection in the upper mantle, is consistent with the architecture and applied thermal parameters.
Here, we present two-dimensional (2D) petrological–thermomechanical numerical models that predict SZI at hyperextended passive continental margins. We aim to quantify the minimum horizontal force required for SZI at a passive continental margin via thermal softening. Hence, we quantify the resistance to failure of the lithosphere around passive margins under compressive forces during SZI. After SZI we continue modelling convergence and progressive subduction until slab detachment (SD) occurs. Therefore, we also quantify tensile forces, arising due to increasing slab pull, required to fail the lithosphere by SD. With our model we want to test the following hypothesis: The magnitude of the horizontal force required for SZI also controls the force required for detachment of the slab generated by SZI. Therefore, the smaller the force required for SZI, the shorter the slab for which SD occurs. In other words, if the force required for SZI is small, then the initiated subduction zone cannot generate a slab of significant length. To this end, we systematically limit the stresses in the load-bearing layers of the lithosphere (lower crust and mantle lithosphere), because the strength of these layers is a key parameter for successful SZI. Unfortunately, the strength of the lithosphere is difficult to constrain (e.g., Burov and Watts, 2006; Baumann et al., 2014) and often determined by laboratory experiments on olivine, an abundant mineral in the upper mantle, conducted under accelerated deformation conditions and then extrapolated over many orders of magnitude to geological time and deformation scales. In consequence, the actual strength of olivine deforming under geological conditions is currently actively debated (e.g., Demouchy et al., 2013; Idrissi et al., 2016; Hansen et al., 2019; Furstoss et al., 2021). Many recent rock deformation experiments suggest that the strength of olivine is mainly controlled by dislocation glide, or low-temperature plasticity, and is significantly lower than determined in previous laboratory experiments (e.g., Demouchy et al., 2013; Idrissi et al., 2016). However, other studies recently showed that although olivine might be initially weaker than previously thought, strain hardening during increasing rate-dependent plastic deformation might increase its overall strength significantly (e.g., Hansen et al., 2019). Knowledge of the strength of the lithosphere is important because it controls essentially all deformation processes of the lithosphere, such as lithosphere flexure at subduction zones or around seamounts, and of course SZI and SD as studied here. One aim of our modelling study is, therefore, also to evaluate whether our combined SZI and SD simulations can help in assessing the effective strength of the lithosphere.
Furthermore, we discuss potential implications of our results for the closure and subduction of the Piemonte–Liguria ocean during the formation of the European Alps and potential slab detachment associated with the Alpine continental collision (Figure 1). For the Western Alpine orogeny, a wealth of data exists that allowed constraining the tectonic and petrological evolution from SZI at the Adriatic margin, through the closure of the Piemont-Liguria ocean to the Alpine continental collision potentially involving slab detachment. Thus, the configuration of our numerical models is motivated by tectonic reconstructions for the Alpine orogeny.
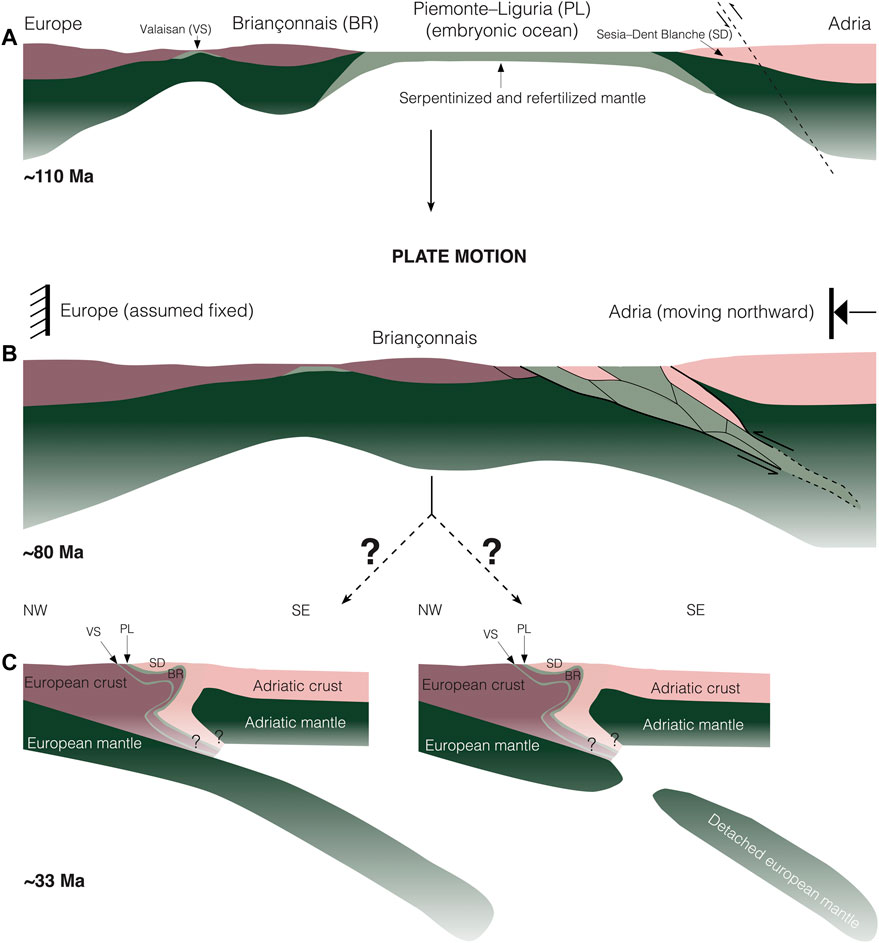
FIGURE 1. Simplified conceptual geodynamic sketch of the Alpine orogeny. (A) Passive margin geometry and embryonic oceans after the rifting stage. (B) Horizontally-forced SZI at the Adriatic passive margin and subduction of the Sesia–Dent Blanche unit. (C) Possible scenarios for the collisional stage of the Alpine orogeny with a continuously subducting slab (left) or detached slab (right). Geological units are simplified and taken from Schmid et al. (2017) and McCarthy et al. (2020).
Here we focus on SZI at magma-poor passive margins that bound embryonic oceans. We define embryonic oceans as marine basins that are small in extent (ca. ≤ 600 km) and mainly floored by exhumed mantle and hyperextended continental crust rather than mature oceanic crust (Chenin et al., 2017). Ancient and recent examples of embryonic oceans are, for example, the Piemonte–Liguria ocean (e.g., McCarthy et al., 2020), the present day Ligurian Basin (e.g., Dannowski et al., 2020) and Red Sea (e.g., Chenin et al., 2017). These ocean basins result from slow-to-ultra-slow spreading rift systems, and the architecture and extent of these oceans is similar (Chenin et al., 2017). Mesozoic rifting separated Europe from Adria and terminated at ca. 145 Ma (e.g., Le Breton et al., 2021). This rifting generated the Piemonte-Liguria ocean basin and the two magma-poor passive margins of Europe and Adria (e.g., Handy et al., 2010; McCarthy et al., 2020; Le Breton et al., 2021). The European and Adriatic passive margins were likely hyperextended and bounded the embryonic Piemonte–Liguria ocean (see Figure 1A). At ca. 85–80 Ma subduction was presumably initiated within the Adriatic continental margin leading to subduction of the Sesia–Dent Blanche unit (e.g., Manzotti et al., 2014, see Figure 1B). Remnants of the Piemonte–Liguria ocean have been incorpated in the Alpine orogenic wedge (e.g., Schmid et al., 2017, see Figure 1C). Whether the European slab is detached or still attached to the European plate is currently disputed (e.g., Kästle et al., 2019).
In this study we build upon our previous work presented in Candioti et al. (2021). Candioti et al. (2021) presented two-dimensional (2D) petrological-thermomechanical numerical models that simulate several, subsequent geodynamic processes in a single and continuous simulation, including thermal convection in the upper mantle. They modelled 1) the formation of hyperextended passive continental margins bounding an embryonic ocean, 2) SZI via thermal softening during convergence of the ocean-margin system, 3) subduction and closure of an embryonic ocean, 4) formation of a collisional orogen and 5) SD of subducted lithosphere. This Wilson-type cycle of embryonic ocean basins comprised 1) a 50 Myr extension period, 2) a 60 Myr cooling period between the extension and convergence phase and 3) a ca. 70 Myr convergence period. Candioti et al. (2021) applied this cycle to the opening and closure of the Piemonte–Liguria ocean and the subsequent formation of the European western Alps (e.g., McCarthy et al., 2020). They mainly focused on the competition between buoyancy and shear forces during the collisional stage of the orogen. When shear forces dominate the collisional stage of the orogen, wedge formation without deep subduction of continental crustal material occured. When buoyancy forces were equally important as shear forces, Candioti et al. (2021) observed deep subduction and exhumation of continental units. The mechanical boundary velocities and the duration of the deformation periods they applied were motivated by plate motion reconstructions from the European and Adriatic plate during the past ca. 180 Myr (e.g., Le Breton et al., 2021). Complementary to their results, we here focus on the subduction stage. Especially, we aim at quantifying the minimum force required for SZI and the role of lithospheric strength in the kind of models presented by Candioti et al. (2021). Note, that we refer to time as the simulated physical time and its unit is Myr. Whenever we refer to actual geological time, we use the unit Ma. Figures 2A-D shows the initial configuration used by Candioti et al. (2021) to model this type of Wilson cycle. A detailed justification of the initial conditions, a full description of the entire model evolution as well as in depth information on the implementation of boundary conditions, petrological-thermomechanical coupling and surface processes (i.e., sedimentation and erosion) is given in the open-access article of Candioti et al. (2021). The models we present here start from the configuration predicted at 110 Myr (end of cooling period) in model history by the reference model of Candioti et al. (2021) (see Figures 2E-H). Similar to the study of Candioti et al. (2021), we parameterize a serpentinisation front propagating across the top 3 km of exhumed mantle material in the embryonic oceanic basin before the onset of convergence. Because of ultra-slow spreading rates, no significant mid-ocean ridge with active magmatism is formed. Therefore, embryonic oceans often lack a mature Penrose-type oceanic crust (e.g., McCarthy et al., 2020). Instead, the subcontinental mantle is exhumed to the surface and in contact with the sea-water. Thus, serpentinisation is likely significant in embryonic ocean basins and presumably plays an important role during subduction of embryonic oceans (e.g., McCarthy et al., 2020). In our models, convergence is induced by applying a constant absolute boundary horizontal velocity of 1.5 cm yr−1. To quantify the minimum driving force and assess the strength of embryonic oceanic lithosphere, we employ a parameterized stress limiter in the mantle lithosphere and the lower crust. In addition to the applied pressure-sensitive Drucker-Prager plastic stress limiter function, this stress limiter is independent on pressure and is used here as a controlling parameter for the plate strength. We systematically tested stress limits of 10, 50, 100, 150, 200, 300, 500 MPa, and 500 GPa. Employing a value of 500 GPa deactivates the stress limiter in the reference model, named NOSLIM hereafter. In addition to the reference model, we here report results for models employing stress limits of 100, 200 and 300 MPa, named SLIM100, SLIM200 and SLIM300 hereafter. These models predict end-member dynamics for subduction initiation and the evolving subduction zone. To test the impact of shear heating and associated thermal softening on SZI we also performed the two simulations SLIM300 and NOSLIM without shear heating.
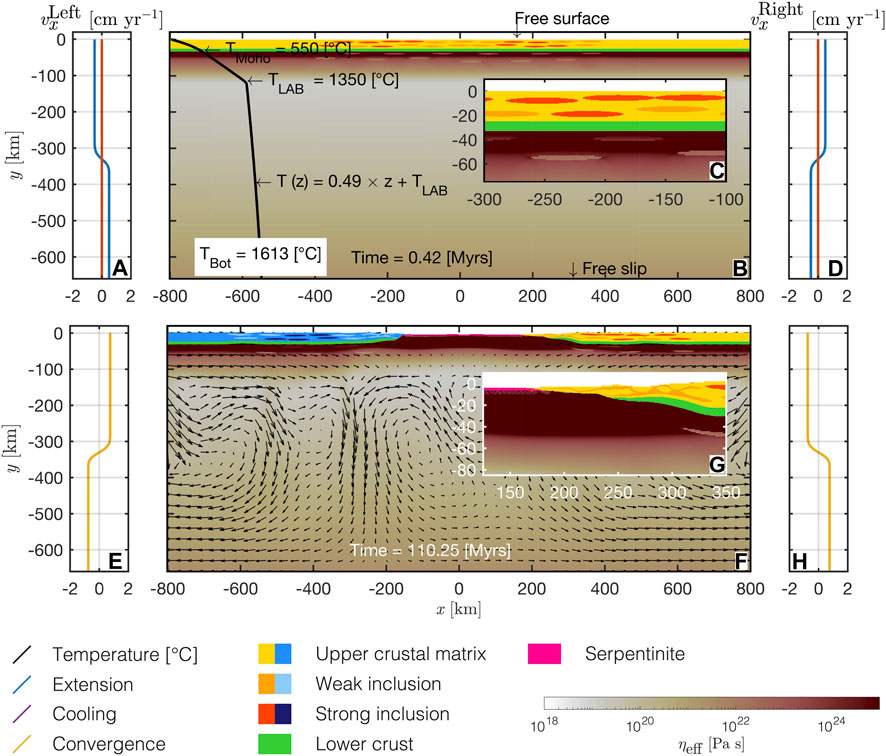
FIGURE 2. Initial model configuration. Numerical resolution is 1 km by 1 km everywhere in the domain. (A–D) From the onset of rifting as modelled in detail by Candioti et al. (2021) and (E–H) from the onset of convergence as investigated in this study. (A,E): vertical profile of horizontal boundary velocity applied along the left boundary. (D,H): vertical profile of horizontal velocity applied along the right model boundary. (B,F) show the entire model domain. White to red indicates the effective viscosity calculated by numerical algorithm, black solid line is the initial temperature profile, light to dark orange are upper crustal lithologies of the right plate, light to dark blue are the lithologies of the left plate, green is the lower crust of both plates and magenta is a serpentinite layer, initially 3 km thin. (C): enlargement of the domain center and (G) shows an enlargement of the right margin. Glyphs in (F) show the velocity field calculated by the numerical algorithm.
We consider incompressible materials that slowly creep (no inertia) under gravity and boundary tractions. The applied numerical algorithm solves the continuity equation, the equation for the conservation of momentum and the heat transfer equation in a two-dimensional Cartesian coordinate system, which are given by:
where i and j are spatial indices and repeated indices are summed, v is velocity and x is the spatial coordinate, σ is the total stress tensor, ρ is density and g = [0; −9.81] is a vector including the gravitational acceleration. The density is a function of temperature, T, pressure, P, and a given bulk rock composition, C, which is precomputed using a thermodynamic software package (Perple_X Connolly, 2005, 2009). We, thus, include large density variations resulting from mineral phase transitions. For example, at a lithostatic pressure and a temperature corresponding to a depth of ca. 410 km, the olivine–wadsleyite phase transition results in a density increase of ca. 150 kg m−3 (see Candioti et al., 2020, Figures 2B,E). Such an increase might significantly impact on the subduction dynamics. A detailed description of the implementation of petrological-thermomechanically coupled processes and the applied chemical composition of the model units is given in the two open-access publications Candioti et al. (2020) and Candioti et al. (2021). In Eq. 3, cP is heat capacity at constant P,
where δij is the Kronecker-Delta, ηeff is the effective viscosity,
where G is shear modulus, Δt is the time step, τo are the deviatoric stress tensor components of the preceding time step. We consider visco-elasto-plastic deformation and additively decompose (so-called Maxwell model) the total deviatoric strain rate tensor into contributions from rate-dependent plastic deformation (i.e., effectively viscous behaviour by dislocation, diffusion and Peierls creep), elastic and rate-independent (brittle) plastic deformation as
The viscosity for dislocation, diffusion and Peierls creep are a function of the respective second strain rate tensor invariant,
where d is grain size and the ratio in front of the prefactor A results from the conversion of experimentally derived flow laws into a tensor formulation of these flow laws (e.g., Schmalholz and Fletcher, 2011). The quantities A, n, m, Q, V,
employing an effective stress exponent
where APei, γ and σPei are material parameters. We control rate-independent (brittle) plastic deformation by a deviatoric stress limiter function
where,
where
or is equal to ηvep. Advection of material is performed using a marker-and-cell technique (Gerya and Yuen, 2003) and we compute rigid body rotation of stresses analytically (see also Candioti et al., 2021, for a more detailed description of the algorithm). A marker chain and a stabilisation algorithm (Duretz et al., 2011b, 2016) is employed to allow for dynamic evolution of topography. Surface processes, namely erosion and sedimentation, are parameterized in the model. In case, the newly computed topography falls below a sedimentation level of z = −5 km it is corrected back to the sedimentation level. The resulting gap between the newly computed topographic level and the sedimentation level is filled instantaneously with markers describing a calcite or a mica rheology. The rheology of the sediment markers alternates every 2 Myr. In case the newly computed topography rises above an erosion level of z = 2 km, the topographic level is corrected downward. The distance of correction is calculated by multiplying the current time increment, Δt, by a constant erosion velocity of 0.5 mm yr−1. All material parameters used in the models presented here are listed in Table 1.
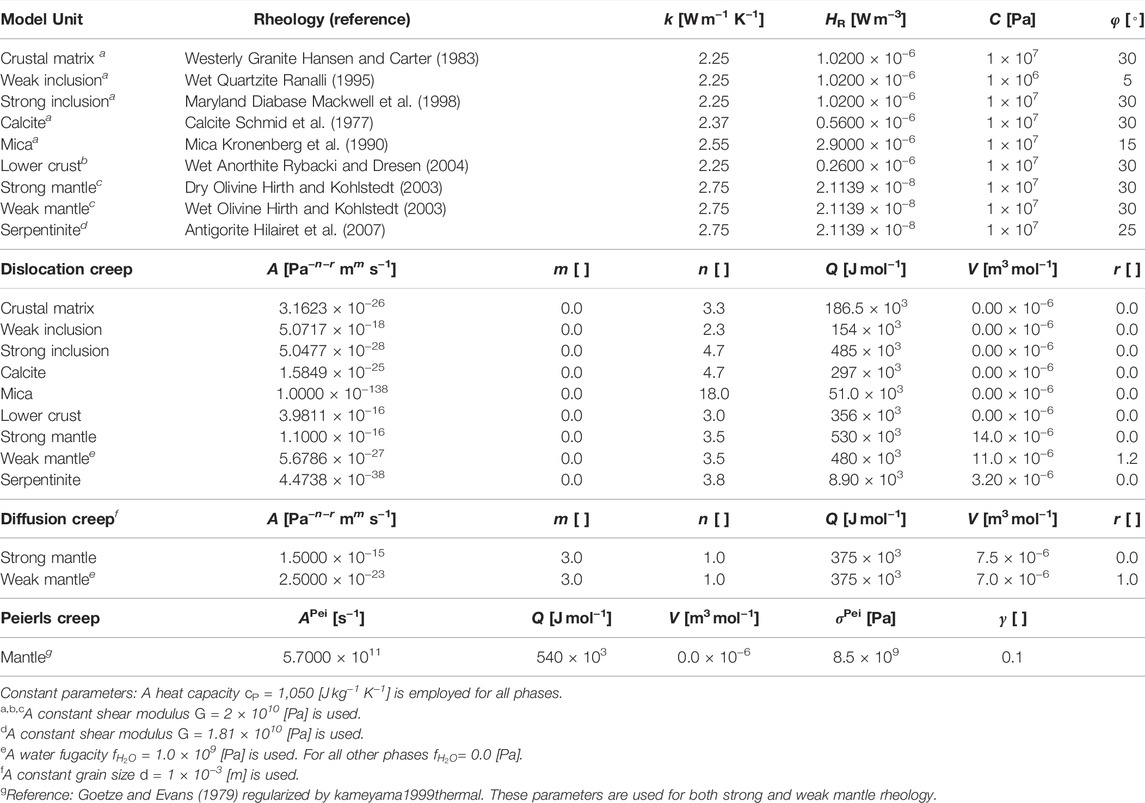
TABLE 1. Physical parameters used in the numerical simulations.
Here,
where a is the topographic level at each horizontal grid point and b = −660 km is the bottom coordinate of the model domain. The values of
We further estimate the slab-pull force per unit length by calculating the effective body force of the subducting slab. This body force, FSP, is computed as the difference between densities of all material that is 1) enclosed horizontally within −700 ≤ x ≤ 700 km of the domain, 2) colder than T ≤ 1,300°C and 3) subducted below y = −160 km and a vertical reference density profile. This reference profile is obtained from the last time step of the cooling period of model NOSLIM by averaging horizontally all material densities at each vertical grid level below y = −160 km over the entire horizontal domain. This reference density is also used to compute the density difference, Δρ, induced by a phase transition. The body force is then calculated as follows:
where Δρ is the aforementioned density difference integrated over the area Ω covered by material matching the three criteria defined above. This is a maximum estimate for the slab-pull force, because the surrounding mantle material exerts shear stresses on the slab surface which resist subduction. Assuming shear stress magnitudes of 1–10 MPa along the bottom and top of a ca. 500 km long slab results in force magnitudes between 1 and 10 TN m−1, respectively, acting against the slab pull force due to buoyancy only. Therefore, the natural, effective slab pull force magnitudes including the shear resistance from the surrounding mantle are likely lower than the ones reported here (see also Turcotte and Schubert, 2014). However, the relative evolution of FSP likely remains as reported here.
In this section we first report the results of the reference model without stress limiter, termed NOSLIM, and compare them to the models with different stress limits afterwards. We compare the stage of SZI, the evolution of plate driving and approximated slab pull forces as well as the dynamics of SD. We refer to the model passive margins on the left and right side of the model as left and right margin from here onward.
Convergence is started at 110 Myr in model history. Subduction initiates at ca. 113 Myr at the transition zone between the proximal and the necking domain within the mantle lithosphere of the right margin (Figures 3A,E). SZI occurs at a region where no serpentinite is present which indicates that the initially horizontal serpentinite layer is not important for SZI. This conclusion is also supported by the findings of Candioti et al. (2021), who report successful SZI with and without a serpentinite layer in similar numerical models. Maximal bending stresses within the lithosphere of the subducting and overriding plate are ca. 500–700 MPa and limited to a 10–25 km thin layer (Figure 3E). Until ca. 129 Myr, large portions of the serpentinite are sheared off the subducting slab (Figure 3B). The values for stresses decrease below ca. 100 MPa within the overriding plate and remain at ca. 250–400 MPa where the subducting plate is bent below the overriding plate (Figures 3F,G). This stage marks the successful SZI in this simulation. The embryonic ocean basin is closed at ca. 140 Myr in model history. At this stage, the serpentinite material has largely been sheared off the subducting plate and reorganized along the plate interface (Figure 3C). A thrust wedge has formed at ca. 160 Myr and a large part of the subducting slab has been detached from the subducting plate (Figure 3D). The values of deviatoric stresses within the thrust wedge remain between ca. 100–250 MPa (e.g., − 200 ≤ x ≤ −100 km and y > − 30 km in Figure 3H).
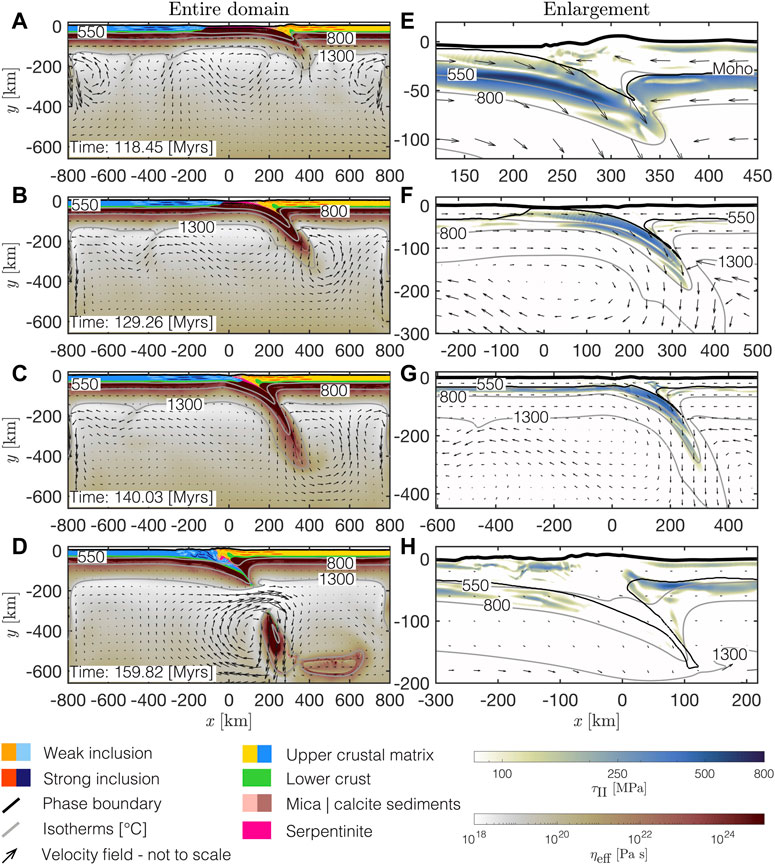
FIGURE 3. Geodynamic evolution of the reference model NOSLIM (no additional applied stress limit). (A–D): Entire domain. White to red is the effective viscosity calculated by the numerical algorithm. Colouring of lithologies as indicated in the legend. (E–H): White to blue is the second invariant of the deviatoric stress tensor as calculated by the numerical algorithm. Glyphs in all panels show the velocity field and grey solid lines are several isotherms predicted by the numerical algorithm.
Figure 4 shows the stage of SZI in the different models. In the reference model, NOSLIM, and in SLIM300 a shear zone forms below the right margin (blue region in right column of Figures 4A,B). Values for dissipative heating inside the shear zone are above 10−5 W m−3 (red contour line in Figures 4A,B) and the temperature inside the evolving shear zone increases compared to the surrounding ambient mantle temperature. This temperature increase is indicated by the geometry of the isotherms which are in shallower depth inside the shear zone compared to the corresponding isotherms to the left and right side of the shear zone. By comparing the vertical position of the grey isotherms in Figures 4A,B, one can estimate the temperature rise inside the shear zone assuming that before shear zone formation the isotherms were approximately horizontal, like in the corresponding left margins. For example, at the right margin of model NOSLIM, the isotherm for 727°C inside the shear zone is in approximately the same depth as the horizontal isotherm for 637°C to the left of the shear zone. Therefore, in NOSLIM the temperature rises by ca. 90°C and in SLIM300 by ca. 50°C, using the same estimate based on isotherm geometries. Kiss et al. (2019) showed that a small temperature increase of only ca. 50°C already can cause strain localization by thermal softening. Compared to models NOSLIM and SLIM300, less dissipative heat is generated by the shear zone forming in model SLIM200. The temperature rise inside the shear zone of model SLIM200 is still ca. 50°C, which is comparable to model SLIM300. In SLIM100 the heat generated by the conversion of mechanical work into heat is insignificant and the temperature inside the shear zone rises by less than 10°C (compare Figures 4A,B to Figures 4C,D). Figure 5 shows which regions in the model exhibit only rate–independent plastic, or brittle, deformation (highlighted in blue) and which regions exhibit elastic or rate–dependent plastic, or ductile, deformation (highlighted in white, see Section 2.3 for calculation). In contrast to the ductile (white regions in Figures 5A,B) shear zones formed in NOSLIM and SLIM300, the shear zones in SLIM200 and SLIM100 are mainly formed due to brittle deformation (blue regions in Figures 5C,D). The reason is that in SLIM200 and SLIM100 the stress limits are lower and, hence, the regions in which stresses exceed the stress limit (i.e., here the brittle region) become larger. Further, brittle shear zones also form below the left margin in SLIM100 (Figure 4D and Figure 5D). In consequence, the subduction zone in SLIM100 evolves completely different compared to the subduction zone in SLIM300. Subduction in SLIM100 is initiated below the opposite margin (Figures 6A,B) and the slab is subducted much slower (compare depth of slab tip in the left and right column of Figure 6C). The detachment of the slab occurs approximately at the same depth in SLIM100 and SLIM300, but much later in SLIM100 compared to SLIM300 (156 and 150 Myr, respectively, Figure 6D). We consider the slab as detached when the distance between the 1,300°C isotherms bounding the slab is less than 10 km. The slab in model SLIM300 is much longer than it is thick, thus resembling the typical rectangular cross-sectional shape of a slab. In contrast, the shape of the slab in SLIM100 resembles more the cross-sectional shape of a lithospheric droplet rather than a subducting slab (compare left and right panel Figure 6D). The deformation behaviour observed in SLIM100 is very similar to the so-called drip-off mode described in the numerical simulations of Thielmann and Kaus (2012). This deformation behaviour does not correspond to the subduction of a coherent plate-like slab.
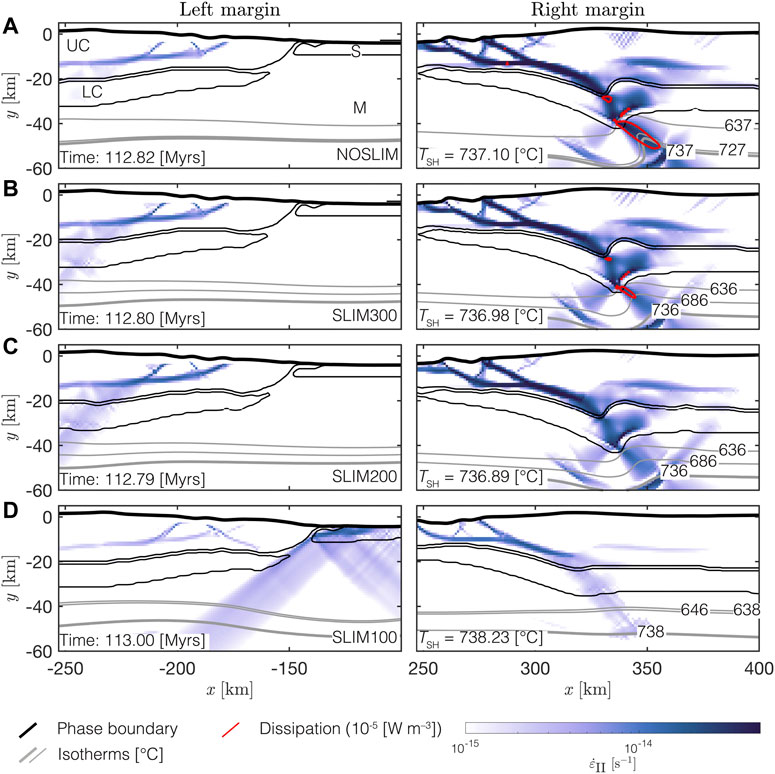
FIGURE 4. Subduction initiation via thermal softening for models with different applied stress limits: (A) no stress limit, (B) 300 MPa, (C) 200 MPa and (D) 100 MPa. White to dark blue is the second invariant of the deviatoric strain rate tensor, solid grey lines are several isotherms used to estimate the temperature rise inside the shear zone based on their vertical position, the red contour indicates the dissipation and black solid lines are material phase boundaries. The left column shows the left margin and the right column shows the right margin. For decreasing stress limits, the dissipation inside the evolving shear zone is significantly reduced and the TSH (an analytically predicted temperature; see text for details) isotherm is less deflected upward indicating that thermal softening (shear heating) becomes less important for shear localization and, thus, for subduction initiation at the passive margin.
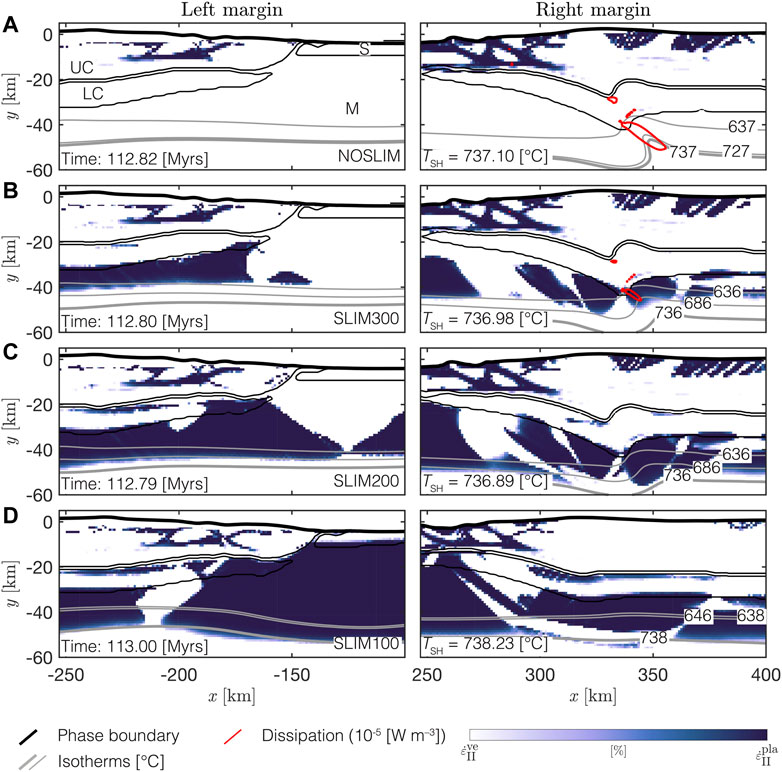
FIGURE 5. Subduction initiation via thermal softening for models with different applied stress limits: (A) no stress limit, (B) 300 MPa, (C) 200 MPa and (D) 100 MPa. White to dark blue mark the model region that undergo rate-dependent (viscoelastic, white) or rate-independent (brittle, blue) plastic deformation. Solid grey lines are several isotherms used to estimate the temperature rise inside the shear zone based on their vertical position, the red contour indicates the dissipation and black lines are material phase boundaries. The left column shows the left margin and the right column shows the right margin. When no stress limit is applied (NOSLIM) the emerging shear zone and large parts of the plate deform ductilly. With decreasing stress limit, large portions of the plate deform brittle-plastically.
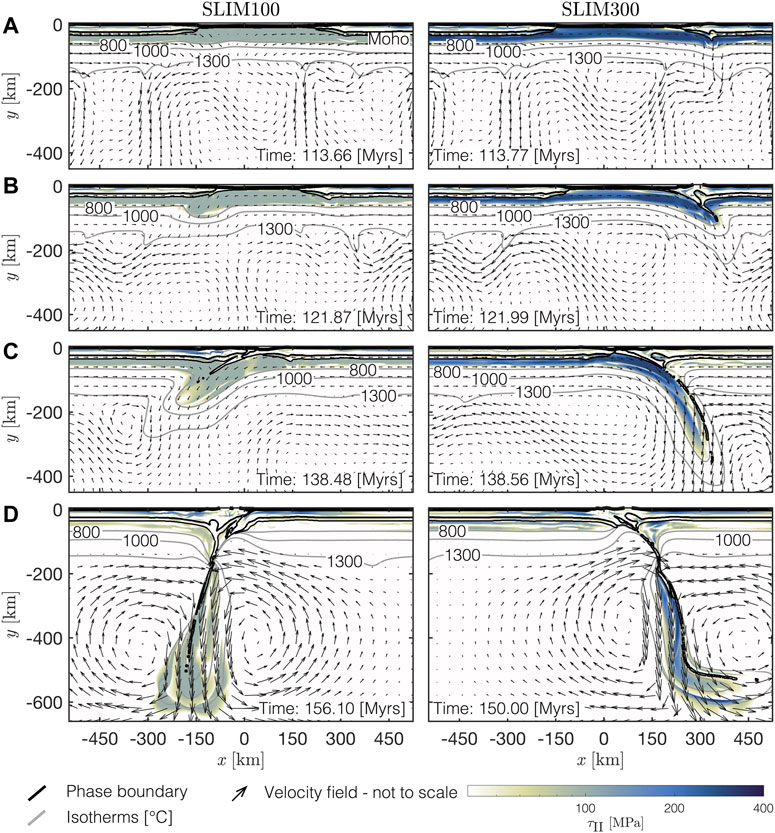
FIGURE 6. Comparing the evolution of the subduction zone in SLIM100 (left column) and SLIM300 (right column). Black solid lines are phase boundaries and grey solid lines are several isotherms. White to blue colors are the second invariant of the deviatoric stress tensor and glyphs indicate the velocity field calculated by the numerical algorithm at various stages:(A) Subduction initiation, (B) embryonic subduction zone, (C) mature subduction zone and (D) slab detachment. Note that subduction is initiated below the opposite margin in SLIM100.
As shown above, the maximum temperature increase associated with the formation of shear zones is less than 100°C. It is, therefore, difficult to isolate the temperature increase exclusively caused by shear heating because of the simultaneously ongoing temperature advection and conduction. To clearly show that the shear zones, causing SZI in our models, are due to shear heating and associated thermal softening, we have performed two additional simulations of NOSLIM and SLIM300 in which we have deactivated the shear heating (Figure 7). This deactivation was done by setting the term HD in Eq. 3 to zero. When shear heating is deactivated (see right column in Figure 7) SZI is not successful. Instead, buckling and thickening in the regions of the two margins is the dominant deformation behaviour of the lithosphere. Therefore, the four simulations NOSLIM and SLIM300 with and without shear heating clearly show that shear heating is causing SZI in our models. Consequently, other model features such as the mechanical heterogeneities, mimicked by initial elliptical heterogeneities, or the serpentinite layer are not able to cause SZI.
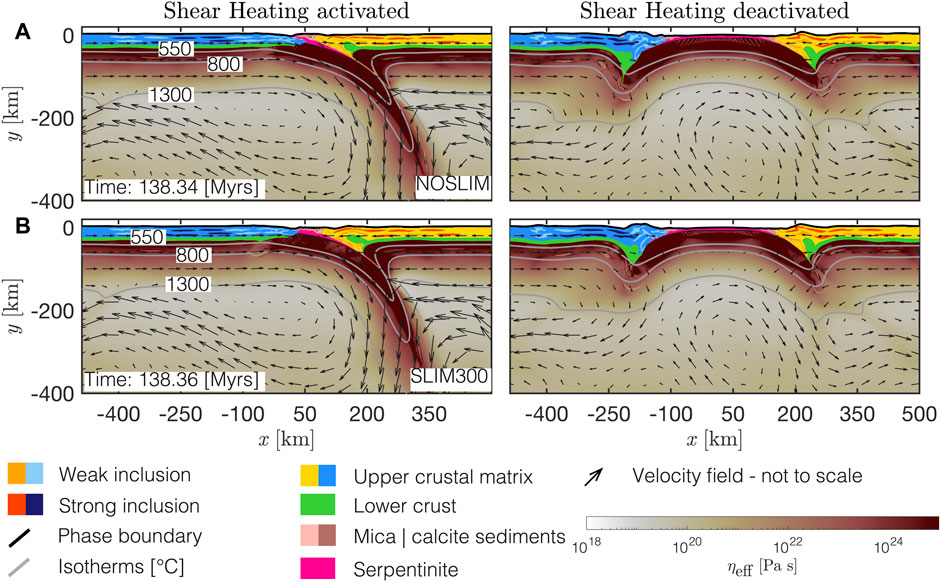
FIGURE 7. Comparison of NOSLIM (A) and SLIM300 (B) with activated (left column) and deactivated shear heating (right column). While SZI at the right passive margin evolves into a mature subduction zone when shear heating is activated, buckling and thickening dominates the lithospheric deformation at both passive margins when shear heating is deactivated. Subduction is not initiated in models without shear heating. Colours as indicated in the legend.
In Figure 8 we report the evolution of the plate driving forces per unit length, FD, and an approximate estimate for the slab pull force per unit length, FSP, over time. The magnitude of FD increases to ca. 18 TN m−1 in NOSLIM, ca. 15 TN m−1 in SLIM300 and ca. 12 TN m−1 in SLIM200 between the onset of convergence and ca. 113 Myr (Figure 8A). A maximum FD = 14 TN m−1 is reached at ca. 122 Myr in SLIM200. Between ca. 113 and 114 Myr, values for FD decrease in NOSLIM and SLIM300 and remain relatively constant in SLIM200. In NOSLIM, SLIM300 and SLIM200, the values for FD overall decrease to ca. 10 TN m−1 between ca. 130 Myr and ca. 135 Myr. In SLIM100 the magnitude of FD continuously increases to ca. 10 TN m−1 until ca. 122 Myr in model history (blue solid line in Figure 8A).
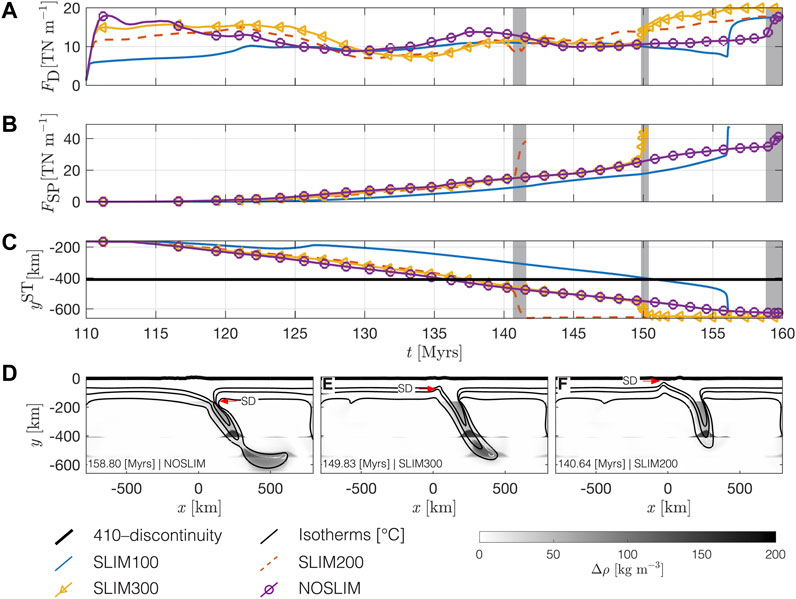
FIGURE 8. Evolution of (A) horizontal driving forces, FD, and (B) the slab pull force, FSP. Panel (C) shows the depth of the slab tip over time and panels (D–F) show the difference between the local mantle density and an average vertical mantle density profile, Δρ, at the onset of necking in the subducting slab for three different stress limiters. Grey rectangles in panels (A–C) mark the period from necking of the subducting slab to its detachment. Compared to a strong plate [no stress limit, (D)], necking is induced soon after the slab tip transects the 410-discontinuity [see panel (C)] for a weak plate [low stress limit, (F)].
The density within the subducting slab increases by up to 150 kg m−3 compared to the ambient mantle density structure when it transects y = −410 km (Figures 8D–F). The reason for this increase in density is the olivine–wadsleyite phase transition. Due to a positive Clapeyron slope (i.e., the change in temperature–pressure space), this phase transition occurs at shallower depths for cold material than for hot material. Therefore, the phase transition is deflected upward inside the cold subducting slabs (see Figures 8D–F) and induces an additional pull force. A gradual increase in FSP until the onset of necking in the subducting slab (left edge of grey rectangles in Figure 8B, see also stages in Figures 8D–F) is observed in all models. This stage is reached after ca. 141 Myr in SLIM200, ca. 150 Myr in SLIM300 and ca. 158 Myr in NOSLIM. The corresponding magnitudes are FSP ≈ 15 TN m−1 in SLIM200, FSP ≈ 25 TN m−1 in SLIM300 and FSP ≈ 35 TN m−1 in NOSLIM. When the slab detaches and sinks into the mantle, magnitudes of FSP increase rapidly to ca. 40 TN m−1 in SLIM200, ca. 42 TN m−1 in SLIM300 and again ca. 40 TN m−1 in NOSLIM. This rapid increase of FSP occurs ca. 4, 13 and 21 Myr after the slab has transected y = −410 km in SLIM200, SLIM300 and NOSLIM, respectively. The depths of slab detachment also vary from y ≈ − 200 km in NOSLIM, y ≈ − 150 km in SLIM300 to y ≈ − 30 km in SLIM200 (Figure 9). In SLIM100 the magnitude of FSP increases slowly to ca. 30 TN m−1 until ca. 156 Myr. At this stage, drip-off of the lithosphere occurs in this model (Figure 6D).
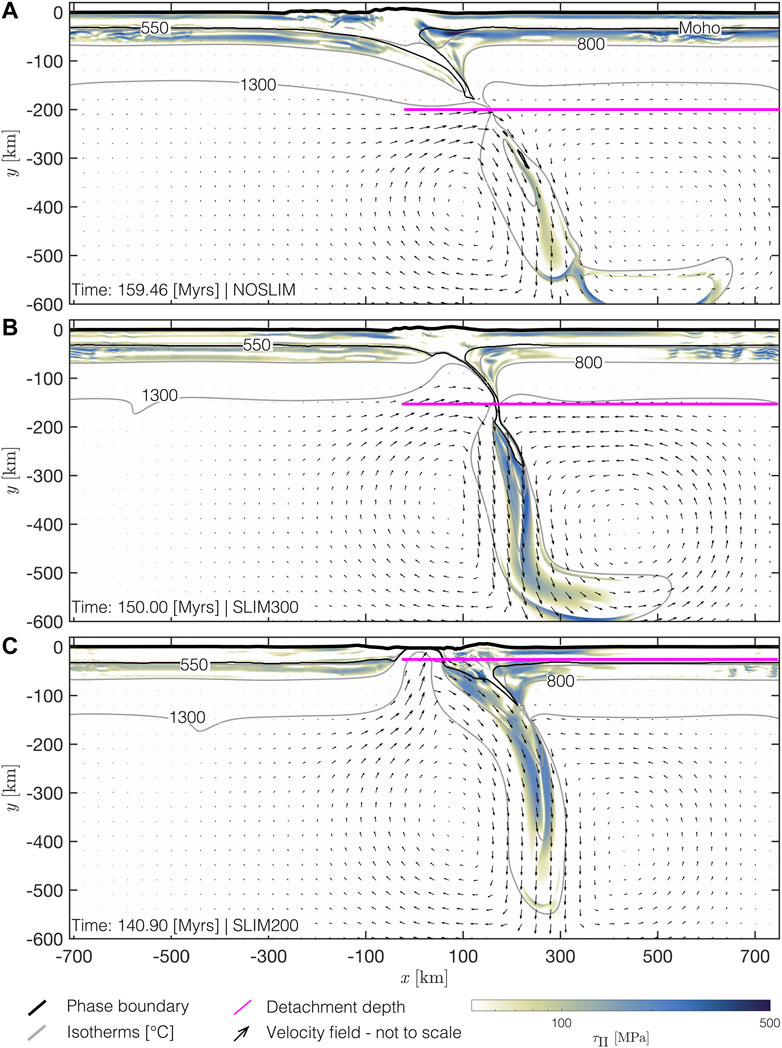
FIGURE 9. Depth of slab detachments for models with different applied stress limits. White to dark blue is the second invariant of deviatoric stress tensor, solid grey lines are several isotherms, glyphs show the velocity field calculated by the numerical algorithm, solid black lines indicate the crustal phase boundary and the solid magenta line marks the approximate depth of slab detachment. For a weak plate [low stress limit, (B,C)], the slab detachment occurs earlier in model history and at shallower depth compared to a strong plate [no stress limit, (A)].
In combination with temperature-dependent rheologies, shear heating is potentially a feasible mechanism to form a shear zone transecting the lithosphere (Yuen et al., 1978; Thielmann and Kaus, 2012; Jaquet and Schmalholz, 2018) and initiate subduction at a hyperextended continental margin (Candioti et al., 2021). Kiss et al. (2019) derived an equation to predict the maximum temperature rise inside a shear zone, TSH (Eq. 22 in Kiss et al., 2019), that is formed via shear heating. This prediction relies only on material parameters and the applied absolute horizontal velocity difference, and has already been applied to SZI at homogeneous hyperextended continental margins (Kiss et al., 2020). According to their prediction, a temperature rise by 50°C is sufficient for spontaneous shear localisation via shear heating and the associated thermal softening. In our models, the dissipation created by the conversion of mechanical work into heat is ca. 10−5 W m−3. Consequently, the temperature increases by 50–90°C in models SLIM200, SLIM300 and NOSLIM. Due to thermal diffusion such a moderate temperature increase is likely not detectable in natural shear zones having a thickness in the order of a few kilometers (e.g., Kiss et al., 2019). The temperature inside the evolving shear zone can be predicted by the equation of Kiss et al. (2019) (deflection of grey solid lines in Figures 4A,B). Therefore, shear heating is efficient for stresses inside the lithospheric mantle that are as low as ca. 200 MPa in our models. This stress magnitude represents the maximum stress during the onset of the formation of a shear zone and stresses are decreasing during progressive shear zone formation (Kiss et al., 2019). This observation is crucial as shear heating is often critized for requiring too high stresses to be an efficient mechanism for ductile shear zone localization (e.g., Platt, 2015). Furthermore, Kiss et al. (2019) reported that shear heating is already efficient for stresses as low as 200 MPa. The predicted temperature inside the shear zone forming in SLIM200 is still accurate, although the deformation inside and around the shear zone is mainly occurring in the brittle-plastic field due to the low stress limit (Figure 5C). Although the generated dissipation is relatively lower compared to higher stress limiters, the temperature increase in SLIM200 and SLIM300 are comparable (compare isotherms in Figures 4B,C). The estimated temperature increase of ca. 50°C in SLIM200 is the limit for shear heating causing spontaneous shear localisation predicted by Kiss et al. (2019). This indicates that likely ductile and brittle-plastic processes are equally important for shear zone localization in model SLIM200. In case stresses are lower than 200 MPa, brittle-plastic processes dominate the deformation inside the lithospheric mantle and shear heating is likely inefficient (flat grey isotherm in Figure 5D). Thielmann and Kaus (2012), Jaquet and Schmalholz (2018) and Kiss et al. (2020) already showed that in absence of other softening mechanisms, thermal softening is required for convergent plate boundary formation and successful SZI in lithospheric-scale geodynamic models. We here confirm these results. In the models we present, thermal softening is indeed the responsible mechanism that causes SZI (see Figure 7).
We report a minimum magnitude of ca. 14–15 TN m−1 for horizontal plate driving forces required for SZI via shear heating (SLIM200 and SLIM300, Figure 8A). While a magnitude of ca. 30–37 TN m−1 for plate driving forces was required to initiate subduction at a homogeneous continental margin in the models of Kiss et al. (2020) and Auzemery et al. (2021), we here report a maximum value of ca. 18 TN m−1 for a continental margin that includes elliptical mechanical heterogeneities. Subduction initiation at ca. 10 TN m−1 is observed in SLIM100. However, subduction initiation in this model is controlled by brittle-plastic deformation rather than by shear heating. In our model SLIM100, the lithospheric deformation style changes from a subduction (Figure 6C) into a delamination, or drip-off, style with ongoing convergence (Figure 6D). Such drip-off deformation behaviour is consistent with earlier studies on subduction initiation within mechanically weak lithospheric plates (e.g., Thielmann and Kaus, 2012). We therefore propose that the minimum driving force magnitude predicted by SLIM200 and SLIM300 of 14–15 TN m−1 are likely more meaningful estimates for SZI at natural geodynamic settings than the magnitude predicted by SLIM100. This magnitude could likely be further reduced by modulating, for example, the olivine dislocation and Peierls flow law parameters.
The density difference between the slab and the surrounding mantle due to the uplift of the olivine–wadsleyite phase transition (at y = −410 km) in our models is between ca. 150–200 kg m−3. This petrological-thermomechanically coupled density prediction is slightly lower but overall in good agreement with previous estimates (275 kg m−3, Turcotte and Schubert, 2014). This increase in density causes an increase in slab pull force magnitude of ca. 16 TN m−1 (Turcotte and Schubert, 2014). Although this estimate is based on buoyancy only and does not consider shear forces along the subducting slab, it is meaningful as these shear forces already act on the slab before the phase change. Our model SLIM200 confirms this estimate. A sharp increase in slab pull force occurs when a magnitude of ca. 17 TN m−1 is reached at ca. 141 Myr (Figure 8B). In SLIM200, SD begins immediately after the slab has transited a depth of 410 km (Figures 8C,F). This observation indicates that slabs must at least be strong enough to support the additional pull force induced by the phase transition in order to penetrate further into the mantle without detaching immediately after the olivine–wadsleyite phase transition occurs within the slab.
In our models we observe the following correlation between the slab strength and the timing of slab detachment: The weaker the slab, the earlier it detaches after transiting the olivine–wadsleyite phase transition. We further observe a correlation between the strength of the slab and the depth of the detachment: weak slabs detach already in the horizontal region of the subducting plate, whereas strong slabs detach in ca. 100–200 km depth (Figure 10). In all models, the slab detaches within ca. 1 Myr from the onset of necking. These observations are consistent with earlier studies of slab detachment (e.g., Andrews and Billen, 2009; Baumann et al., 2010; Duretz et al., 2011a; Schmalholz, 2011; van Hunen and Allen, 2011; Thielmann and Schmalholz, 2020). The estimates for slab pull forces we report here are between ca. 18 and 35 TN m−1. These magnitudes are lower than previous calculations (e.g., Forsyth and Uyeda, 1975). However, these magnitudes only consider forces arising from buoyancy contrasts between the subducting slab and the surrounding mantle and do not include viscous tractions along the slab. Such tractions reduce the effective slab pull force (e.g., Schellart, 2004).
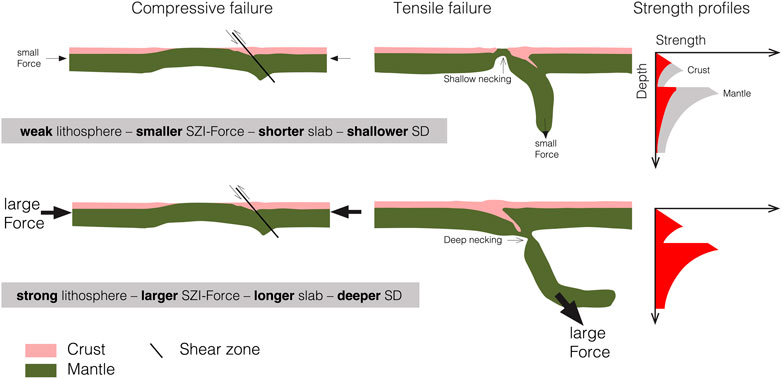
FIGURE 10. Simplified sketch illustrating the causal link between plate strength, forces required for subduction zone initiation (SZI) and slab detachment (SD) depth. Pink colours indicate the crust, olive green colours the mantle, the red colour in the strength profiles represents a schematic yield strength envelope of the crust and the mantle for a given depth and the black solid lines represent shear zones. Compared to a weak plate, a strong plate requires higher forces for SZI, yields a longer slab and slab detachments at larger depth.
Natural orogens like the Variscides, the Pyrenees or the European Alps may have resulted from the closure of narrow oceanic basins (e.g., Chenin et al., 2019). These immature extensional systems are characterized by insignificant production of new, mature oceanic lithosphere and subduction of these embryonic oceans produce insignificant amounts of volcanic arc–basalts (e.g., McCarthy et al., 2020). In absence of a significant active mid–ocean ridge, such embryonic basin–margin system is likely more laterally homogeneous (due to lack of a ridge) compared to an ocean basin including a significant spreading ridge. Consequently, embryonic ocean basins likely lack significant lateral variation in temperature and, therefore, strength. Hence, the closure of such basins from SZI to SD may be considered as, respectively, natural compressive and tensile failure tests of the lithosphere. The models we present have significant implications for these natural systems. For example, subduction in the Western Alpine-Tethys presumably initiated below the hyperextended continental margin of the Adriatic plate at ca. 85 Ma (e.g., Manzotti et al., 2014) and lead to closure of the embryonic Piemonte–Liguria ocean (e.g., McCarthy et al., 2020). Our models predict that, compared to a weak subducting lithosphere, a strong lithosphere requires higher forces to fail under compression and yield SZI and plate boundary formation. However, under tension, which develops due to increasing pull forces induced by the subducting slab, the same strong lithosphere may be able to hold a continuous subducting slab down to 660 km depth over more than 20 Myr after basin closure. In contrast, a weak lithosphere fails immediately under tension and exhibits shallow SD early after closure of the embryonic ocean basin. This result may help explaining the strong east–west variability of slab geometries observed in tomographic images from the present-day European Alps (e.g., Lippitsch et al., 2003; Hua et al., 2017; Kästle et al., 2019).
Our models NOSLIM and SLIM300 (Figures 9A,B) suggest that the embryonic Piemonte–Liguria ocean might have been weaker in the east compared to the centre which lead to early and shallow slab break-off in the eastern Alps (slab gap, Lippitsch et al., 2003) whereas the slab remained more or less intact in the central region (Zhao et al., 2016). The resulting asthenospheric window in the slab (see glyphs in Figure 9B) below the eastern Alps might have induced a heat pulse in the crustal units (e.g., Davies and von Blanckenburg, 1995). For example, in simulation SLIM300 the 1,300°C isotherm is uplifted towards shallower depth in the region of SD (Figure 9B). The 1,300°C isotherm is uplifted to approximately the same depth as that of the horizontal 800°C isotherm to the left and right side of the region with SD. Therefore, the temperature can be locally increased by ca. 500°C with respect to temperatures in an undeformed lithosphere. Such local temperature increase due to SD might contribute to magmatism associated with the Bergell intrusion, which has been explained by SD (e.g., Davies and von Blanckenburg, 1995). Certainly, the Alps have a distinct 3D architecture and our models are only two-dimensional. Previous three-dimensional modelling studies have studied the impact of along-strike variations on the process of slab detachment (van Hunen and Allen, 2011; von Tscharner et al., 2014; Duretz et al., 2014). Because of their two-dimensional nature, our models do not capture along-strike propagation of slab detachment. Nevertheless, they successfully account for the physics of necking which is the underlying physical process governing slab detachment (e.g., Schmalholz, 2011; Duretz et al., 2012). Moreover, lateral propagation of slab detachment is triggered by asymmetries in the lateral structure of collision zones (van Hunen and Allen, 2011), which remain difficult to constrain through the course of the Alpine history. We hence suggest that our models remain applicable, at first order, to the study of slab detachment in the Alps.
Slab detachment is a short-lived process and we just mention also briefly two regions in which SD is presumably occurring at present day. In the Vrancea area (e.g., Wenzel et al., 1998) a nearly vertically hanging slab which is still attached to the overlying plate induces earthquakes at an intermediate depth between 70 and 180 km. However, the maximum depth of the slab might be much deeper (Sperner et al., 2001; Ferrand and Manea, 2021). Also, recent seismic data from the Hindu Kush indicates a potential onset of slab detachment or delamination at depths of ca. 200 km (e.g., Kufner et al., 2021). Such detachment depths are well predicted by our models (Figures 8D–F).
Three-dimensional numerical models of global mantle convection have been used to constrain the effective strength of the lithosphere. Mallard et al. (2016), for example, applied a constant von-Mises stress limiter function in their models (similar to this study) and showed that stress magnitudes between 150 and 200 MPa in the lithosphere result in the most realistic plate-like behaviour. The model results of SLIM200 confirm the results reported by Mallard et al. (2016). However, our models predict plate-like behaviour also for stresses higher than 200 MPa in the lithosphere (see for example model NOSLIM), likely because of the higher numerical resolution. In our models, high stresses in the lithosphere are limited to a 10–25 km thin, load-bearing layer (see f.e. Figures 3E–H). Such thin layers cannot be resolved numerically in most global mantle convection models. In comparison, dividing, for example, FD = 18 TN m−1, which was necessary to overcome the plate strength in NOSLIM and initiate subduction, by a ca. 50 km thick lithosphere yields an average deviatoric stress of ca. 180 MPa which agrees with the equivalent von-Mises shear stress between 150 and 200 MPa of Mallard et al. (2016), which is required to generate a plate size–frequency distribution observed for Earth. Therefore, the magnitude of the horizontal driving forces in our numerical simulations agree with horizontal forces predicted by recent global mantle convection models.
Because of the high numerical resolution, our models can test first the resistance of plates to failure under variable applied compressive stresses (during SZI) and subsequently under variable tensile stresses (during SD). Therefore, models as presented here may represent a complementary method to classical laboratory experiments, inversion from geophysical data and global mantle convection models and help to better constrain the effective strength of the lithosphere.
We presented 2D petrological-thermomechanical models for the convergence of embryonic ocean basins bounded by passive margins to quantify the minimum horizontal force required for subduction zone initiation (SZI) at passive margins. Although we also include an initially horizontal weak serpentinite layer in the ocean basin, our results show that this layer has no impact on SZI. In our models, plate boundary formation and SZI is controlled by thermal softening caused by shear heating. Simulations in which shear heating only is deactivated do not show SZI which clearly shows that shear heating and associated thermal softening controls SZI in our models. A temperature increase due to shear heating inside a shear zone of only ca. 50°C is sufficient for successful SZI. The minimum horizontal force (per unit length) required for such SZI is between 14 and 15 TN m−1. Dividing 15 TN m−1 by a lithosphere thickness of 50 km (representing the region with significant strength) yields a shear stress of 150 MPa. Such shear stress magnitude is consistent with average lithospheric yield stress estimates based on 3D spherical models of mantle convection in order to self-consistently produce the plate size–frequency distribution observed for Earth. Consequently, we conclude that 1) shear heating and associated thermal softening is a feasible mechanism for horizontally-forced SZI at passive margins and 2) the required horizontal force magnitudes for such SZI are realistic and in agreement with independent estimates from global mantle convection models.
The convergence and closure of ocean basins bounded by passive margins involves two geodynamic processes that are controlled by the effective strength of the lithosphere: SZI, controlled by the compressive strength of the lithosphere, and subsequent slab detachment (SD), controlled by the tensile strength. Therefore, the compressive force magnitude required to “break” the lithosphere during horizontally forced SZI is linked to the tensile force required to “break” the lithosphere during SD. Our results show that the smaller the horizontal force required for SZI, the earlier and shallower SD occurs during basin closure and the shorter is the length of the slab. We presented one simulation with a stress limit in the lithosphere of 200 MPa (corresponding to a horizontal force during SZI of 14 TN m−1) which showed a successful SZI. However, the lithosphere was so weak that the subducting lithosphere detached already in the horizontal, non-subducted region of the lithospheric plate shortly before basin closure. Such horizontal slab detachment is most likely unrealistic for most natural settings such as for the closure of the Piemonte-Liguria ocean during Alpine orogeny. In the Alps, the slab geometries are still contentious with some studies proposing slab detachment linked to the Europe-Adria collision some 30 Myrs ago while other studies argue that there was no slab detachment. Our results imply that if there was no slab detachment since the Europe-Asia collision, as suggested by some studies, then the corresponding slab must have a large effective strength to prohibit SD.
We propose that the closure of ocean basins involving both SZI and SD can be considered as a natural “experiment” that tests both the effective compressive and tensile strength of the lithosphere. Consequently, we propose that numerical studies on horizontally-forced SZI also should test whether their models can generate a significant slab which can support realistic slab pull forces in order to avoid that SZI is studied for an unrealistically weak lithosphere.
The raw data supporting the conclusion of this article will be made available by the authors, without undue reservation.
LC conducted the numerical simulations, interpreted the results and wrote the manuscript. TD developed the applied numerical algorithm, helped interpreting the results and writing the manuscript. SS conceptualized and supervised the study, helped interpreting the results and writing the manuscript.
This study was supported by SNSF grant No. 200020 163169.
The authors declare that the research was conducted in the absence of any commercial or financial relationships that could be construed as a potential conflict of interest.
All claims expressed in this article are solely those of the authors and do not necessarily represent those of their affiliated organizations, or those of the publisher, the editors and the reviewers. Any product that may be evaluated in this article, or claim that may be made by its manufacturer, is not guaranteed or endorsed by the publisher.
Aharonov, E., and Scholz, C. H. (2018). A Physics-Based Rock Friction Constitutive Law: Steady State Friction. J. Geophys. Res. Solid Earth 123, 1591–1614. doi:10.1002/2016jb013829
Andrews, E. R., and Billen, M. I. (2009). Rheologic Controls on the Dynamics of Slab Detachment. Tectonophysics 464, 60–69. doi:10.1016/j.tecto.2007.09.004
Auzemery, A., Willingshofer, E., Yamato, P., Duretz, T., and Beekman, F. (2021). Kinematic Boundary Conditions Favouring Subduction Initiation at Passive Margins over Subduction at Mid-oceanic Ridges. Front. Earth Sci. 9. doi:10.3389/feart.2021.765893
Auzemery, A., Willingshofer, E., Yamato, P., Duretz, T., and Sokoutis, D. (2020). Strain Localization Mechanisms for Subduction Initiation at Passive Margins. Glob. Planet. Change 195, 103323. doi:10.1016/j.gloplacha.2020.103323
Baumann, C., Gerya, T. V., and Connolly, J. A. D. (2010). Numerical Modelling of Spontaneous Slab Breakoff Dynamics during continental Collision. Geol. Soc. Lond. Spec. Publications 332, 99–114. doi:10.1144/sp332.7
Baumann, T. S., Kaus, B. J. P., and Popov, A. A. (2014). Constraining Effective Rheology through Parallel Joint Geodynamic Inversion. Tectonophysics 631, 197–211. doi:10.1016/j.tecto.2014.04.037
Bercovici, D., and Ricard, Y. (2012). Mechanisms for the Generation of Plate Tectonics by Two-phase Grain-Damage and Pinning. Phys. Earth Planet. Interiors 202-203, 27–55. doi:10.1016/j.pepi.2012.05.003
Burov, E. B., and Watts, A. B. (2006). The Long-Term Strength of continental Lithosphere: "jelly sandwich" or "crème Brûlée"? GSA today 16, 4. doi:10.1130/1052-5173(2006)016<4:tltsoc>2.0.co;2
Candioti, L. G., Duretz, T., Moulas, E., and Schmalholz, S. M. (2021). Buoyancy versus Shear Forces in Building Orogenic Wedges. Solid Earth 12, 1749–1775. doi:10.5194/se-12-1749-2021
Candioti, L. G., Schmalholz, S. M., and Duretz, T. (2020). Impact of Upper Mantle Convection on Lithosphere Hyperextension and Subsequent Horizontally Forced Subduction Initiation. Solid Earth 11, 2327–2357. doi:10.5194/se-11-2327-2020
Chenin, P., Manatschal, G., Picazo, S., Müntener, O., Karner, G., Johnson, C., et al. (2017). Influence of the Architecture of Magma-Poor Hyperextended Rifted Margins on Orogens Produced by the Closure of Narrow versus Wide Oceans. Geosphere 13, 559–576. doi:10.1130/ges01363.1
Chenin, P., Picazo, S., Jammes, S., Manatschal, G., Müntener, O., and Karner, G. (2019). Potential Role of Lithospheric Mantle Composition in the wilson Cycle: a north atlantic Perspective. Geol. Soc. Lond. Spec. Publications 470, 157–172. doi:10.1144/sp470.10
Cloetingh, S., Wortel, R., and Vlaar, N. J. (1989). “On the Initiation of Subduction Zones,” in Subduction Zones Part II (Berlin, Germany: Springer), 7–25. doi:10.1007/978-3-0348-9140-0_2
Connolly, J. A. D. (2005). Computation of Phase Equilibria by Linear Programming: a Tool for Geodynamic Modeling and its Application to Subduction Zone Decarbonation. Earth Planet. Sci. Lett. 236, 524–541. doi:10.1016/j.epsl.2005.04.033
Connolly, J. (2009). The Geodynamic Equation of State: what and How. Geochem. Geophys. Geosystems 10. doi:10.1029/2009gc002540
Crameri, F., Magni, V., Domeier, M., Shephard, G. E., Chotalia, K., Cooper, G., et al. (2020). A Transdisciplinary and Community-Driven Database to Unravel Subduction Zone Initiation. Nat. Commun. 11, 3750. doi:10.1038/s41467-020-17522-9
Dannowski, A., Kopp, H., Grevemeyer, I., Lange, D., Thorwart, M., Bialas, J., et al. (2020). Seismic Evidence for Failed Rifting in the Ligurian basin, Western alpine Domain. Solid Earth 11, 873–887. doi:10.5194/se-11-873-2020
Demouchy, S., Tommasi, A., Boffa Ballaran, T., and Cordier, P. (2013). Low Strength of Earth's Uppermost Mantle Inferred from Tri-axial Deformation Experiments on Dry Olivine Crystals. Phys. Earth Planet. Interiors 220, 37–49. doi:10.1016/j.pepi.2013.04.008
Duretz, T., Gerya, T. V., and May, D. A. (2011a). Numerical Modelling of Spontaneous Slab Breakoff and Subsequent Topographic Response. Tectonophysics 502, 244–256. doi:10.1016/j.tecto.2010.05.024
Duretz, T., Gerya, T. V., and Spakman, W. (2014). Slab Detachment in Laterally Varying Subduction Zones: 3-d Numerical Modeling. Geophys. Res. Lett. 41, 1951–1956. doi:10.1002/2014GL059472
Duretz, T., May, D. A., Gerya, T., and Tackley, P. (2011b). Discretization Errors and Free Surface Stabilization in the Finite Difference and Marker-In-Cell Method for Applied Geodynamics: A Numerical Study. Geochem. Geophys. Geosystems 12. doi:10.1029/2011gc003567
Duretz, T., May, D. A., and Yamato, P. (2016). A Free Surface Capturing Discretization for the Staggered Grid Finite Difference Scheme. Geophys. J. Int. 204, 1518–1530. doi:10.1093/gji/ggv526
Duretz, T., Schmalholz, S., and Gerya, T. (2012). Dynamics of Slab Detachment. Geochem. Geophys. Geosystems 13. doi:10.1029/2011gc004024
Dymkova, D., and Gerya, T. (2013). Porous Fluid Flow Enables Oceanic Subduction Initiation on Earth. Geophys. Res. Lett. 40, 5671–5676. doi:10.1002/2013gl057798
Ferrand, T. P., and Manea, E. F. (2021). Dehydration-induced Earthquakes Identified in a Subducted Oceanic Slab beneath Vrancea, romania. Sci. Rep. 11, 10315–10319. doi:10.1038/s41598-021-89601-w
Forsyth, D., and Uyeda, S. (1975). On the Relative Importance of the Driving Forces of Plate Motion. Geophys. J. Int. 43, 163–200. doi:10.1111/j.1365-246x.1975.tb00631.x
Furstoss, J., Petit, C., Tommasi, A., Ganino, C., Muñoz, D. P., and Bernacki, M. (2021). On the Role of Solute Drag in Reconciling Laboratory and Natural Constraints on Olivine Grain Growth Kinetics. Geophys. J. Int. 224, 1360–1370.
Gerya, T. V., and Yuen, D. A. (2003). Characteristics-based Marker-In-Cell Method with Conservative Finite-Differences Schemes for Modeling Geological Flows with Strongly Variable Transport Properties. Phys. Earth Planet. Interiors 140, 293–318. doi:10.1016/j.pepi.2003.09.006
Goetze, C., and Evans, B. (1979). Stress and Temperature in the Bending Lithosphere as Constrained by Experimental Rock Mechanics. Geophys. J. Int. 59, 463–478. doi:10.1111/j.1365-246x.1979.tb02567.x
Handy, M. R., M. Schmid, S., Bousquet, R., Kissling, E., and Bernoulli, D. (2010). Reconciling Plate-Tectonic Reconstructions of Alpine Tethys with the Geological-Geophysical Record of Spreading and Subduction in the Alps. Earth-Science Rev. 102, 121–158. doi:10.1016/j.earscirev.2010.06.002
Hansen, F., and Carter, N. (1983). “Semibrittle Creep of Dry and Wet Westerly Granite at 1000 MPa,” in The 24th US Symposium on Rock Mechanics (USRMS).
Hansen, L. N., Kumamoto, K. M., Thom, C. A., Wallis, D., Durham, W. B., Goldsby, D. L., et al. (2019). Low‐Temperature Plasticity in Olivine: Grain Size, Strain Hardening, and the Strength of the Lithosphere. J. Geophys. Res. Solid Earth 124, 5427–5449. doi:10.1029/2018jb016736
Hilairet, N., Reynard, B., Wang, Y., Daniel, I., Merkel, S., Nishiyama, N., et al. (2007). High-pressure Creep of Serpentine, Interseismic Deformation, and Initiation of Subduction. Science 318, 1910–1913. doi:10.1126/science.1148494
Hirth, G., and Kohlstedt, D. (2003). Rheology of the Upper Mantle and the Mantle Wedge: A View from the Experimentalists. Geophys. Monograph-American Geophys. Union 138, 83–105. doi:10.1029/138gm06
Hua, Y., Zhao, D., and Xu, Y. (2017). P Wave Anisotropic Tomography of the Alps. J. Geophys. Res. Solid Earth 122, 4509–4528. doi:10.1002/2016jb013831
Huw Davies, J., and von Blanckenburg, F. (1995). Slab Breakoff: a Model of Lithosphere Detachment and its Test in the Magmatism and Deformation of Collisional Orogens. Earth Planet. Sci. Lett. 129, 85–102. doi:10.1016/0012-821x(94)00237-s
Idrissi, H., Bollinger, C., Boioli, F., Schryvers, D., and Cordier, P. (2016). Low-temperature Plasticity of Olivine Revisited with In Situ Tem Nanomechanical Testing. Sci. Adv. 2, e1501671. doi:10.1126/sciadv.1501671
Jaquet, Y., and Schmalholz, S. M. (2018). Spontaneous Ductile Crustal Shear Zone Formation by thermal Softening and Related Stress, Temperature and Strain Rate Evolution. Tectonophysics 746, 384–397. doi:10.1016/j.tecto.2017.01.012
Kameyama, M., Yuen, D. A., and Karato, S.-I. (1999). Thermal-mechanical Effects of Low-Temperature Plasticity (The Peierls Mechanism) on the Deformation of a Viscoelastic Shear Zone. Earth Planet. Sci. Lett. 168, 159–172. doi:10.1016/s0012-821x(99)00040-0
Kästle, E. D., Rosenberg, C., Boschi, L., Bellahsen, N., Meier, T., and El-Sharkawy, A. (2019). Slab Break-Offs in the alpine Subduction Zone. Solid Earth Discuss. 2019, 1–19.
Kiss, D., Candioti, L. G., Duretz, T., and Schmalholz, S. M. (2020). Thermal Softening Induced Subduction Initiation at a Passive Margin. Geophys. J. Int. 220, 2068–2073. doi:10.1093/gji/ggz572
Kiss, D., Podladchikov, Y., Duretz, T., and Schmalholz, S. M. (2019). Spontaneous Generation of Ductile Shear Zones by thermal Softening: Localization Criterion, 1D to 3D Modelling and Application to the Lithosphere. Earth Planet. Sci. Lett. 519, 284–296. doi:10.1016/j.epsl.2019.05.026
Kronenberg, A. K., Kirby, S. H., and Pinkston, J. (1990). Basal Slip and Mechanical Anisotropy of Biotite. J. Geophys. Res. 95, 19257–19278. doi:10.1029/jb095ib12p19257
Kufner, S. K., Kakar, N., Bezada, M., Bloch, W., Metzger, S., Yuan, X., et al. (2021). The Hindu Kush Slab Break-Off as Revealed by Deep Structure and Crustal Deformation. Nat. Commun. 12, 1685. doi:10.1038/s41467-021-21760-w
Lallemand, S., and Arcay, D. (2021). Subduction Initiation from the Earliest Stages to Self-Sustained Subduction: Insights from the Analysis of 70 Cenozoic Sites. Earth-Science Rev. 221, 103779. doi:10.1016/j.earscirev.2021.103779
Le Breton, E., Brune, S., Ustaszewski, K., Zahirovic, S., Seton, M., and Müller, R. D. (2021). Kinematics and Extent of the Piemont-Liguria Basin - Implications for Subduction Processes in the Alps. Solid Earth 12, 885–913. doi:10.5194/se-12-885-2021
Leloup, P. H., Ricard, Y., Battaglia, J., and Lacassin, R. (1999). Shear Heating in continental Strike-Slip Shear Zones:model and Field Examples. Geophys. J. Int. 136, 19–40. doi:10.1046/j.1365-246x.1999.00683.x
Lippitsch, R., Kissling, E., and Ansorge, J. (2003). Upper Mantle Structure beneath the alpine Orogen from High-Resolution Teleseismic Tomography. J. Geophys. Res. Solid Earth 108. doi:10.1029/2002jb002016
Mackwell, S. J., Zimmerman, M. E., and Kohlstedt, D. L. (1998). High-temperature Deformation of Dry Diabase with Application to Tectonics on Venus. J. Geophys. Res. 103, 975–984. doi:10.1029/97jb02671
Malatesta, C., Gerya, T., Crispini, L., Federico, L., and Capponi, G. (2013). Oblique Subduction Modelling Indicates Along-Trench Tectonic Transport of Sediments. Nat. Commun. 4, 2456–6. doi:10.1038/ncomms3456
Mallard, C., Coltice, N., Seton, M., Müller, R. D., and Tackley, P. J. (2016). Subduction Controls the Distribution and Fragmentation of Earth's Tectonic Plates. Nature 535, 140–143. doi:10.1038/nature17992
Manzotti, P., Ballèvre, M., Zucali, M., Robyr, M., and Engi, M. (2014). The Tectonometamorphic Evolution of the Sesia-Dent Blanche Nappes (Internal Western Alps): Review and Synthesis. Swiss J. Geosci. 107, 309–336. doi:10.1007/s00015-014-0172-x
McCarthy, A., Tugend, J., Mohn, G., Candioti, L., Chelle-Michou, C., Arculus, R., et al. (2020). A Case of Ampferer-type Subduction and Consequences for the Alps and the Pyrenees. Am. J. Sci. 320, 313–372. doi:10.2475/04.2020.01
McKenzie, D. P. (1977). The Initiation of Trenches: a Finite Amplitude Instability. Isl. arcs, deep sea trenches back-arc basins 1, 57–61. doi:10.1029/me001p0057
Montési, L. G. (2013). Fabric Development as the Key for Forming Ductile Shear Zones and Enabling Plate Tectonics. J. Struct. Geology. 50, 254–266.
Mueller, S., and Phillips, R. J. (1991). On the Initiation of Subduction. J. Geophys. Res. 96, 651–665. doi:10.1029/90jb02237
Müller, R. D., Sdrolias, M., Gaina, C., and Roest, W. R. (2008). Age, Spreading Rates, and Spreading Asymmetry of the World’s Ocean Crust. Geochem. Geophys. Geosystems 9.
Mulyukova, E., and Bercovici, D. (2018). Collapse of Passive Margins by Lithospheric Damage and Plunging Grain Size. Earth Planet. Sci. Lett. 484, 341–352. doi:10.1016/j.epsl.2017.12.022
Platt, J. P. (2015). Influence of Shear Heating on Microstructurally Defined Plate Boundary Shear Zones. J. Struct. Geology. 79, 80–89. doi:10.1016/j.jsg.2015.07.009
Regenauer-Lieb, K., Yuen, D. A., and Branlund, J. (2001). The Initiation of Subduction: Criticality by Addition of Water? science 294, 578–580. doi:10.1126/science.1063891
Regenauer-Lieb, K., and Yuen, D. A. (1998). Rapid Conversion of Elastic Energy into Plastic Shear Heating during Incipient Necking of the Lithosphere. Geophys. Res. Lett. 25, 2737–2740. doi:10.1029/98gl02056
Rybacki, E., and Dresen, G. (2004). Deformation Mechanism Maps for Feldspar Rocks. Tectonophysics 382, 173–187. doi:10.1016/j.tecto.2004.01.006
Schellart, W. (2004). Quantifying the Net Slab Pull Force as a Driving Mechanism for Plate Tectonics. Geophys. Res. Lett. 31. doi:10.1029/2004gl019528
Schmalholz, S. M. (2011). A Simple Analytical Solution for Slab Detachment. Earth Planet. Sci. Lett. 304, 45–54. doi:10.1016/j.epsl.2011.01.011
Schmalholz, S. M., Duretz, T., Hetényi, G., and Medvedev, S. (2019). Distribution and Magnitude of Stress Due to Lateral Variation of Gravitational Potential Energy between Indian lowland and Tibetan Plateau. Geophys. J. Int. 216, 1313–1333. doi:10.1093/gji/ggy463
Schmalholz, S. M., and Fletcher, R. C. (2011). The Exponential Flow Law Applied to Necking and Folding of a Ductile Layer. Geophys. J. Int. 184, 83–89. doi:10.1111/j.1365-246x.2010.04846.x
Schmalholz, S. M., Medvedev, S., Lechmann, S. M., and Podladchikov, Y. (2014). Relationship between Tectonic Overpressure, Deviatoric Stress, Driving Force, Isostasy and Gravitational Potential Energy. Geophys. J. Int. 197, 680–696. doi:10.1093/gji/ggu040
Schmid, S. M., Boland, J. N., and Paterson, M. S. (1977). Superplastic Flow in Finegrained limestone. Tectonophysics 43, 257–291. doi:10.1016/0040-1951(77)90120-2
Schmid, S. M., Kissling, E., Diehl, T., van Hinsbergen, D. J. J., and Molli, G. (2017). Ivrea Mantle Wedge, Arc of the Western Alps, and Kinematic Evolution of the Alps-Apennines Orogenic System. Swiss J. Geosci. 110, 581–612. doi:10.1007/s00015-016-0237-0
Shuck, B., Gulick, S. P. S., Van Avendonk, H. J. A., Gurnis, M., Sutherland, R., Stock, J., et al. (2022). Stress Transition from Horizontal to Vertical Forces during Subduction Initiation. Nat. Geosci. 15, 149–155. doi:10.1038/s41561-021-00880-4
Sperner, B., Lorenz, F., Bonjer, K., Hettel, S., Muller, B., and Wenzel, F. (2001). Slab Break-Off - Abrupt Cut or Gradual Detachment? New Insights from the Vrancea Region (SE Carpathians, Romania). Terra Nova 13, 172–179. doi:10.1046/j.1365-3121.2001.00335.x
Stern, R. J., and Gerya, T. (2018). Subduction Initiation in Nature and Models: A Review. Tectonophysics 746, 173–198. doi:10.1016/j.tecto.2017.10.014
Stern, R. (2004). Subduction Initiation: Spontaneous and Induced. Earth Planet. Sci. Lett. 226, 275–292. doi:10.1016/s0012-821x(04)00498-4
Takeuchi, C. S., and Fialko, Y. (2012). Dynamic Models of Interseismic Deformation and Stress Transfer from Plate Motion to continental Transform Faults. J. Geophys. Res. Solid Earth 117. doi:10.1029/2011jb009056
Thielmann, M., and Kaus, B. J. P. (2012). Shear Heating Induced Lithospheric-Scale Localization: Does it Result in Subduction? Earth Planet. Sci. Lett. 359-360, 1–13. doi:10.1016/j.epsl.2012.10.002
Thielmann, M., and Schmalholz, S. M. (2020). Contributions of Grain Damage, thermal Weakening, and Necking to Slab Detachment. Front. Earth Sci. 8, 254. doi:10.3389/feart.2020.00254
van Hunen, J., and Allen, M. B. (2011). Continental Collision and Slab Break-Off: A Comparison of 3-d Numerical Models with Observations. Earth Planet. Sci. Lett. 302, 27–37. doi:10.1016/j.epsl.2010.11.035
von Tscharner, M., Schmalholz, S. M., and Duretz, T. (2014). Three-dimensional Necking during Viscous Slab Detachment. Geophys. Res. Lett. 41, 4194–4200. doi:10.1002/2014GL060075
Wenzel, F., Achauer, U., Enescu, D., Kissling, E., Russo, R., Mocanu, V., et al. (1998). Detailed Look at Final Stage of Plate Break-Off Is Target of Study in romania. Eos Trans. AGU 79, 589–594. doi:10.1029/98eo00427
White, S. H., and Knipe, R. J. (1978). Transformation- and Reaction-Enhanced Ductility in Rocks. J. Geol. Soc. 135, 513–516. doi:10.1144/gsjgs.135.5.0513
Yuen, D. A., Fleitout, L., Schubert, G., and Froidevaux, C. (1978). Shear Deformation Zones along Major Transform Faults and Subducting Slabs. Geophys. J. Int. 54, 93–119. doi:10.1111/j.1365-246x.1978.tb06758.x
Zhao, L., Paul, A., Malusà, M. G., Xu, X., Zheng, T., Solarino, S., et al. (2016). Continuity of the alpine Slab Unraveled by High-Resolution P Wave Tomography. J. Geophys. Res. Solid Earth 121, 8720–8737. doi:10.1002/2016jb013310
Zhong, X., and Li, Z.-H. (2020). Subduction Initiation during Collision-Induced Subduction Transference: Numerical Modeling and Implications for the Tethyan Evolution. J. Geophys. Res. Solid Earth 125, e2019JB019288. doi:10.1029/2019jb019288
Zhou, X., Li, Z. H., Gerya, T. V., and Stern, R. J. (2020). Lateral Propagation-Induced Subduction Initiation at Passive continental Margins Controlled by Preexisting Lithospheric Weakness. Sci. Adv. 6, eaaz1048. doi:10.1126/sciadv.aaz1048
Keywords: Convergent plate boundary formation, subduction zone initiation, thermal softening, shear heating, slab detachment, lithospheric strength, plate driving force, Alps
Citation: Candioti LG, Duretz T and Schmalholz SM (2022) Horizontal Force Required for Subduction Initiation at Passive Margins With Constraints From Slab Detachment. Front. Earth Sci. 10:785418. doi: 10.3389/feart.2022.785418
Received: 29 September 2021; Accepted: 25 March 2022;
Published: 04 May 2022.
Edited by:
Fabio Crameri, Undertone.design, SwitzerlandReviewed by:
Elvira Mulyukova, Northwestern University, United StatesCopyright © 2022 Candioti, Duretz and Schmalholz. This is an open-access article distributed under the terms of the Creative Commons Attribution License (CC BY). The use, distribution or reproduction in other forums is permitted, provided the original author(s) and the copyright owner(s) are credited and that the original publication in this journal is cited, in accordance with accepted academic practice. No use, distribution or reproduction is permitted which does not comply with these terms.
*Correspondence: Lorenzo G. Candioti, bG9yZW56by5jYW5kaW90aUB1bmlsLmNo
Disclaimer: All claims expressed in this article are solely those of the authors and do not necessarily represent those of their affiliated organizations, or those of the publisher, the editors and the reviewers. Any product that may be evaluated in this article or claim that may be made by its manufacturer is not guaranteed or endorsed by the publisher.
Research integrity at Frontiers
Learn more about the work of our research integrity team to safeguard the quality of each article we publish.