 Fengyan Zhang*
 Lixin Li
- Chinese Academy of Geological Sciences, Beijing, China
When geothermal fluid flows to the wellhead along the wellbore, there is a thermal transfer from the high-temperature geothermal fluid to the low-temperature formation. This process can directly lead to the decrease of wellhead temperature and loss of geothermal energy. Even though previous studies have confirmed that reducing the thermal conductivity of cement could validly cut down the heat loss of geothermal fluid, the influence factors of thermal conductivity are limited. In this research, we conducted detailed studies of the influence factors of thermal conductivity and compressive strength for cement. The results show that with the increase of water-cement ratio and thermal insulation materials, thermal conductivity and compressive strength decline. Furthermore, curing temperature is another important factor to improve the thermal preservation effect, but the testing temperature has the opposite influence. Based on these results, the present study concluded that porosity, Skeleton ingredients, curing temperature, and test temperature are vital factors for thermal conductivity. This research provides theoretical guidance for increasing the wellhead temperature of geothermal fluid and enhancing the efficiency of geothermal energy.
1 Introduction
Geothermal energy is clean and sustainable and has been widely used for power generation, heating, and farming (Bildirici and Gökmenoğlu, 2017; Wang et al., 2017; Hamm and Metcalfe, 2019; Yang et al., 2021). In recent years, with the increased need for renewable energy, the exploration and utilization of medium-low temperature geothermal resources have been widely developed in China (Ma et al., 2016; Zhao and Fu, 2019). However, the temperature difference between high-temperature geothermal fluid and low-temperature formations results in the temperature in the wellhead being lower than that in the actual reservoir (Hasan and Kabir, 2002). This is unfavorable to the application of geothermal energy, especially for geothermal wells featured by high bottom temperature or lower fluid-production rate (Kanev et al., 1997; Tóth, 2006).
The wellhead temperature of the geothermal fluid is one of the most important parameters to determine the usage modes and applied efficiency for geothermal energy (Kanev et al., 1997; Tekin and Akin, 2011; Zhou and Zhang, 2013; Gorman et al., 2014). Hence, elevating this temperature is vital for the exploration and utilization of geothermal energy. Recently, more and more research has focused on cement sheath, as its great contribution to heat transfer (Yang et al., 2013; Won et al., 2015). Meanwhile, the theory that decreasing cement thermal conductivity can prominently reduce heat loss has been proposed (Ichim et al., 2016, Ichim et al., 2018; Li et al., 2017; Zhao, 2020). Based on this theory, calculation method and influence factors (e.g., water-cement ratio, testing temperature, and additives) of cement thermal conductivity have been confirmed (Ichim et al., 2018; Won et al., 2015; Fang et al., 2020). These results revealed the change laws of thermal conductivity from macroscopical sight. The study of influencing factors is not comprehensive and the microcosmic mechanisms remain obscure.
This paper aims to confirm the change laws and corresponding microcosmic mechanisms of thermal conductivity for cement. A precisely designed steady-state method was used at the selected representative thermal insulation materials. Based on this research, thermal conductivity, and compressive strength were affected by different influence factors (i.e., water-cement ratio, thermal insulation materials content, curing, and testing temperature) are documented. Combined with the results of microcosmic analysis (Porosity test and scanning electron microscope), a method of interpreting changes in thermal conductivity and compressive strength from microcosmic sights is proposed. The research results could provide a theoretical basis for the effective utilization of geothermal energy.
2 Material and Methods
2.1 Material
In this study, class G cement was used as the basic material as it has been commonly used in geothermal wells. Simultaneously, floating beads with a hollow structure and expanded perlite with a honeycomb-like structure were selected as insulation materials. Results of chemical composition and physical properties of Class G cement are shown in Tables 1, 2. The properties of these two thermal insulation materials are shown in Table 3.
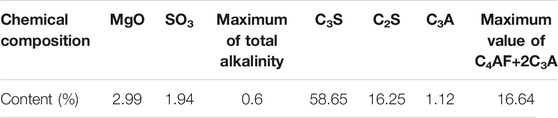
TABLE 1. Composition of Class G cement.
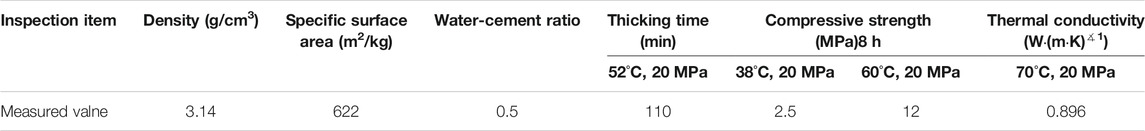
TABLE 2. Physical properties of Class G cement.
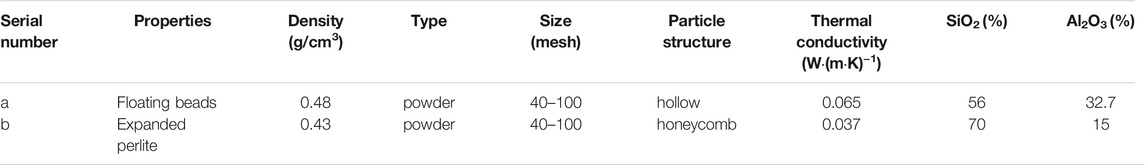
TABLE 3. Properties of thermal insulation materials.
2.2 Methods
In this research, four different (0.5, 0.55, 0.6, and 0.7) water-cement ratios (w/c ratio) were chosen for pure cement slurry. The mass ratio of thermal insulation materials to Class G cement is 5%, 10%, 15%, and 20% respectively. Besides, a fixed w/c ratio (0.7) was selected for thermal insulation cement slurry, and water-reducing agents were used in maintaining its rheological properties. The comparison between pure cement with a w/c ratio of 0.7 (w/c = 0.7) and thermal insulation cement with different contents of thermal insulation materials was conducted. Meanwhile, the steady-state method was used to accurately calculate the thermal conductivity of cement. The tools designed for making cement samples in this study are shown in Figure 1. During the design process, the ratio between sample diameter and thickness was greater than 8.
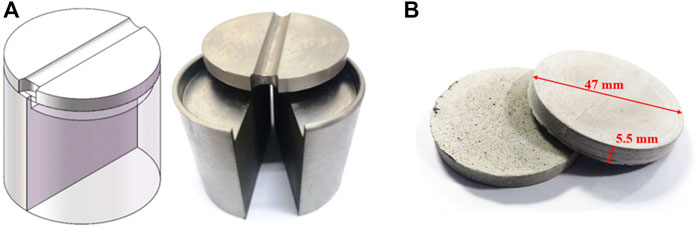
FIGURE 1. Curing molds and test samples. (A) Curing mold assembly drawing. (B) Thermal conductivity test sample.
Cement powder and thermal insulation materials were mixed before the thermal insulation cement was made. Then the mixture was poured into a water-bearing agitator with low stirring speed. Meanwhile, the pouring process was completed in 15 s. The slurry was then cured in a curing chamber with curing temperatures of 60°C, 90°C, and 120°C for 24 h, and the curing pressure was set at 10 MPa.
After curing, the thermal conductivity of the cement sample was tested by DRPL-Ⅲ high precision thermal conductivity tester (measuring range 0.001–3 W/(m.K), and the measurement accuracy was 1%. In this study, we use “hot plate temperature—cold plate temperature” to represent the test temperature combination. When the hot plate temperature is 70°C and the cold plate temperature is 30°C, it is expressed as “70–30°C.” Two conditions were set for analyzing pure cement thermal conductivity. One set the hot plate temperature at 70°C with different w/c ratios (i.e., 0.5, 0.55, 0.6, and 0.7) and curing temperature (i.e., 60°C, 90°C, and 120°C). The other set the curing temperature at 60°C with varied w/c ratios (i.e., 0.5, 0.55, 0.6, and 0.7) and hot plate temperatures (i.e., 50°C, 70°C, and 90°C). Moreover, the analysis of the thermal conductivity of thermal insulation cement was also conducted under two different conditions. One was set the hot plate temperature at 70 °C with varied content of thermal insulation materials (i.e., 5%, 10%, 15%, and 20%) and curing temperatures (i.e., 60°C, 90°C, and 120°C). The other was set the curing temperature at 60 °C with different w/c ratios (i.e., 5%, 10%, 15%, and 20%) and hot plate temperatures (i.e., 50°C, 70°C, and 90°C).
The microstructures of pure cement and thermal insulation cement were observed by using Nova NanoSEM 450 and AxioCam MRc5. YAW-300B automatic pressure testing machine was used to test compressive strength. The maximum test value of this device is 300 kN, and the test error is within 1%. During the test, the loading speed was kept at 71.7 ± 7.2 kN/min. Dry density and the median pore throat size of cement were achieved through AutoPore Ⅳ 9505. Test pressure was set at 1.0 MPa, and the chosen test temperature was 20°C. Rigaku Ultima Ⅳ was used to test changes in mineral types and the content of cement. All the equipment was calibrated before use.
3 Results and Discussion
3.1 Pure Cement
3.1.1 Microstructure and Related Parameters
The microstructure of pure cement under a microscope and scanning electron microscope (SEM) is shown in Figures 2A–D. As the w/c ratio increases from 0.5 to 0.7, the number and size of primary macropores and micropores in pure cement increases significantly, whereas the per unit volume of small cracks was reduced (Figures 2A–D).
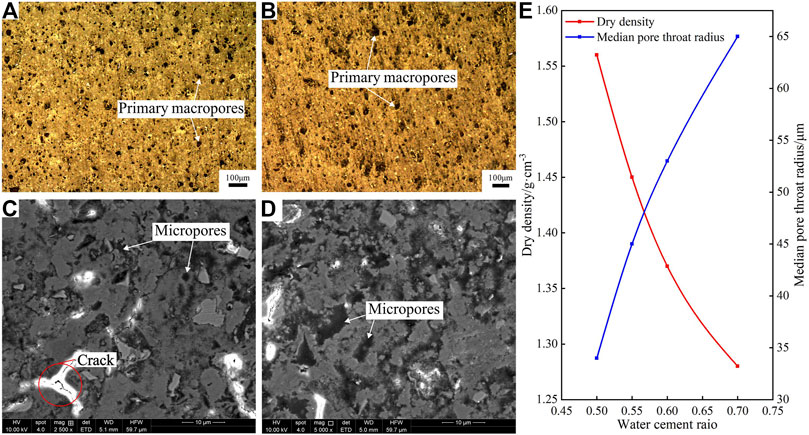
FIGURE 2. Microstructure and related parameters of pure cement. (A) Microstructure of pure cement (w/c = 0.5) under the microscope. (B) Microstructure of pure cement (w/c = 0.7) under the microscope. (C) Microstructure of pure cement (w/c = 0.5) under SEM. (D) Microstructure of pure cement (w/c = 0.7) under SEM. (E) Dry density and median pore throat radius of pure cement.
The test results of dry density and the median pore throat radius of pure cement under different w/c ratios are shown in Figure 2E. With the increase of w/c ratio, the dry density gradually decreases, whereas the median pore throat radius gradually increased (Figure 2E). In a word, the change rates of dry density and median pore throat radius were gradually reduced. That is when the w/c ratio is 0.6, the dry density and median pore throat radius are 1.37 g/cm3 and 53 μm respectively, accounting for 67.9 and 61.3% of the total decrease. The increase in the number and size of the primary macropores is the main reason for the changes in dry density and median pore throat radius.
The XRD results of pure cement with different w/c ratios (0.5 and 0.7) are shown in Figure 3. As shown in the figure, the increase of w/c ratio or curing temperature can effectively improve the hydration degree of C3S, C2S, and C4AF, which will result in an obvious increase of CH and CSH content (Figures 3A–D).
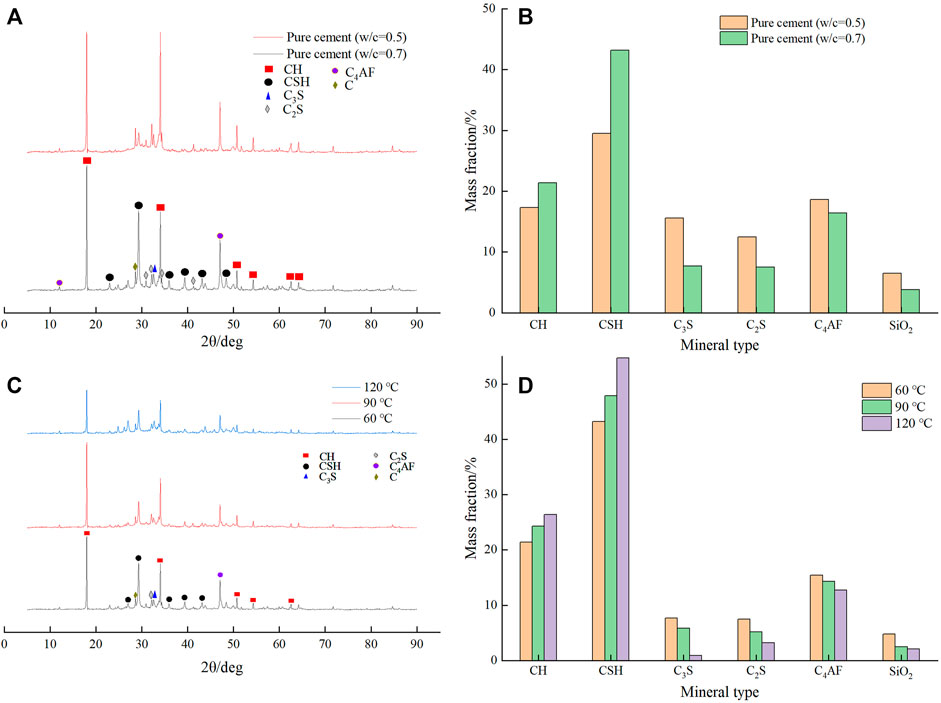
FIGURE 3. XRD test results of pure cement with w/c ratio of 0.5 and 0.7. (A) XRD results of pure cement with w/c ratio of 0.5 and 0.7. The curing temperature is 60°C. (B) Mineral content statistics of Panel (A) results. (C) XRD results of pure cement (w/c = 0.7) under different curing temperatures. (D) Mineral content statistics of Panel (C) results.
3.1.2 Thermal Conductivity
The thermal conductivity obtained under different curing and hot plate temperatures is shown in Table 4 and plotted in Figures 4A,B. Notably, as the content of floating beads increases, the thermal conductivity decreases rapidly at first and then the reduction rate becomes relatively slow (Figures 4A,B). The thermal conductivity of pure cement (w/c = 0.7) is 21.2%, 25.0%, and 25.6% respectively lower than that of pure cement (w/c = 0.5) under three different curing temperatures (i.e., 60°C, 90°C, 120°C) (Figure 4A). In the same case, the decrease percentage is higher than 20.1% under three different hot plate temperatures (Figure 4B). It is believed that the improvement of the degree of hydration of cement particles and cement porosity are two major factors that lead to the decrease of thermal conductivity. Moreover, as the w/c ratio is lower than 0.55, most of the added water is involved in the hydration of the cement particles, and a small number of them are used to form pores. In this process, the increased hydration degree of cement particles will convert more C3S and C3A into CSH with relatively weak heat conduction capacity, which is the main reason for the reduction of heat transfer capacity of cement skeleton (Qomi et al., 2014; Kumar and Mitra, 2021). When the w/c ratio is between 0.55 and 0.6, the increase rate of cement particle hydration degree gradually decreases, and the increased pores become the main result of the w/c ratio increase. In this case, the thermal conduction capacity of air is much lower than that of cement skeleton. Therefore, the increased pores can effectively reduce the cross-sectional area and prolong the path of heat transfer in cement. The above three results are the main way to reduce the pure cement thermal conductivity. When the w/c ratio is higher than 0.6, the free water required for cement particle hydration reaches saturation, and the main function of increased free water is to improve porosity. However, as the ratio between the subsequently added free water and total volume of cement slurry continues to decrease, the free water that can be distributed per unit volume slurry also continues to decrease. This leads to a slower change rate in porosity and thermal conductivity.
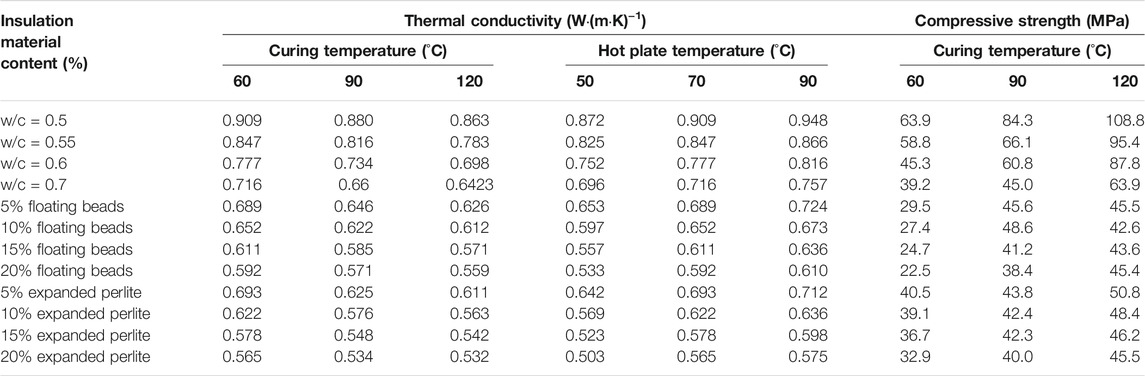
TABLE 4. Thermal conductivity and compressive strength of cement.
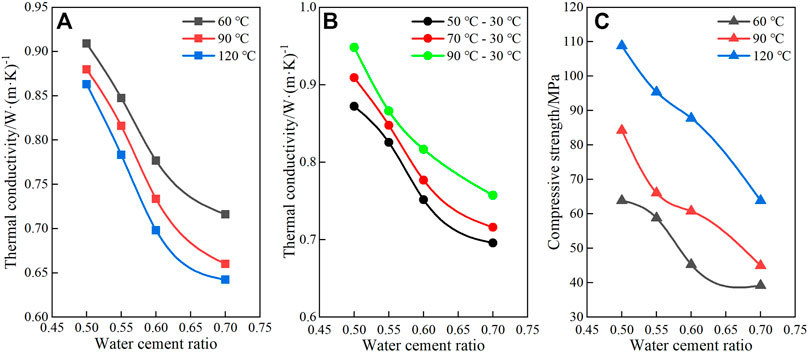
FIGURE 4. Thermal conductivity and compressive strength test results of pure cement under different conditions. (A) Test results of thermal conductivity at different curing temperatures. The test temperature combination is 70–30°C. (B) Test results of thermal conductivity at different hot plate temperatures. The curing temperature is 60°C. (C) Test results of compressive strength at different curing temperatures.
According to Figure 4A, thermal conductivity significantly reduces as the curing temperature increases. Under the condition of w/c = 0.5 and three different curing temperatures (i.e., 60°C, 90°C, 120°C), the thermal conductivity is 0.909 W/(mK), 0.880 W/(mK), and 0.863 W/(mK) respectively. However, as the w/c ratio changes to 0.7, the thermal conductivity decreases to 0.716 W/(mK), 0.660 W/(mK), and 0.642 W/(mK) respectively. Therefore, when the curing temperature increases from 60 to 120°C, the decrease of thermal conductivity is 5% (w/c = 0.5) and 10.3% (w/c = 0.7) respectively. In summary, it can be determined that the increase in the hydration degree of cement particles and the content of substances with low thermal conductivity, caused by the increase of curing temperature, are the main reasons for the decrease in thermal conductivity.
As shown in Figure 4B, as the hot plate temperatures elevate, the thermal conductivity increases obviously. When the hot plate temperature is increased to 90°C, the thermal conductivity is 0.948 W/(mK), 0.816 W/(mK), and 0.757 W/(mK), which correspond with a w/c ratio is 0.5, 0.6 and 0.7, respectively. These values are 8.6% higher than that of the hot plate temperature set at 50°C. The results are mainly attributed to the fact that the improvement of hot plate temperature can enhance the vibration intensity of the heated skeleton. Meanwhile, the convective heat transfer of gas in connecting pores of cement has also been strengthened.
3.1.3 Compressive Strength
Compressive strength test results are shown in Table 3 and plotted in Figure 4C. With the increase of w/c ratio, the cement compressive strength decreases apparently. However, it shows an opposite trend to the ascending curing temperature (Figure 4C). As the curing temperature increases gradually, the compressive strength of cement (w/c = 0.7) is 39.2, 45.0, and 63.9 MPa respectively, which is 38.6%, 46.6%, and 41.3% lower than that of cement (w/c = 0.5). Similarly, the compressive strength is 108.8, 87.8, and 63.9 MPa, which correspond with w/c ratio is 0.5, 0.6, and 0.7 respectively under curing temperature set at 120°C. These results show that the compressive strength increased 70.3%, 93.8%, and 63.0% compared with the curing temperature set at 60°C. Analysis shows that the increase in the number and size of primary macropores and micropores is the main reason for the reduction of compressive strength (Figure 2). The increase of curing temperature contributes to the ascending CSH content. The enhancement of CSH content is the primary factor leading to the improvement of compressive strength.
The increase of the w/c ratio can effectively improve the size and number of primary macropores and micropores, as well as the hydration degree of cement particles. This can result in the reduction of the heat transfer capacity of the cement skeleton and heat transfer area. However, the heat transfer path appears to have an opposite trend. Similarly, the increase of curing and hot plate temperature can also change the thermal conductivity. Furthermore, the increase in the number and size of primary macropores and micropores is the main reason for the significant decrease in compressive strength.
3.2 Thermal Insulation Cement With Floating Beads
3.2.1 Microstructure and Related Parameters
The macropores and micropores of the thermal insulation cement are shown in Figures 5A,B,E,F. The microstructure of the floating beads in the cement is shown in Figures 5C,D. Dry density and median pore throat radius are shown in Table 5 and plotted in Figure 5G.
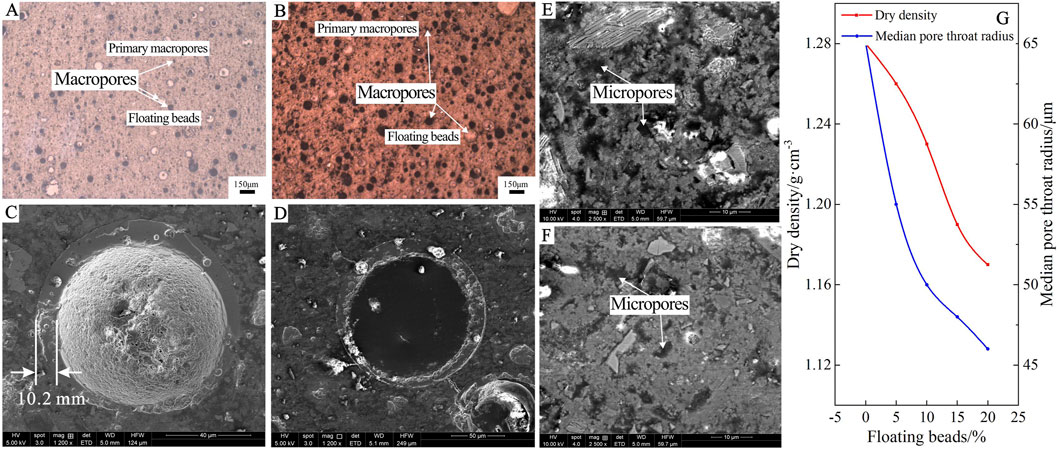
FIGURE 5. Microstructure and related parameters of thermal insulation cement with floating beads. (A) Microstructure of thermal insulation cement with 10% floating beads under the microscope. (B) Microstructure of thermal insulation cement with 20% floating beads under the microscope. (C, D) Microstructure of floating beads under SEM. (E) Microstructure of thermal insulation cement with 10% floating beads under SEM. (F) Microstructure of thermal insulation cement with 20% floating beads under SEM. (G) Dry density and median pore throat radius of thermal insulation cement with floating beads.
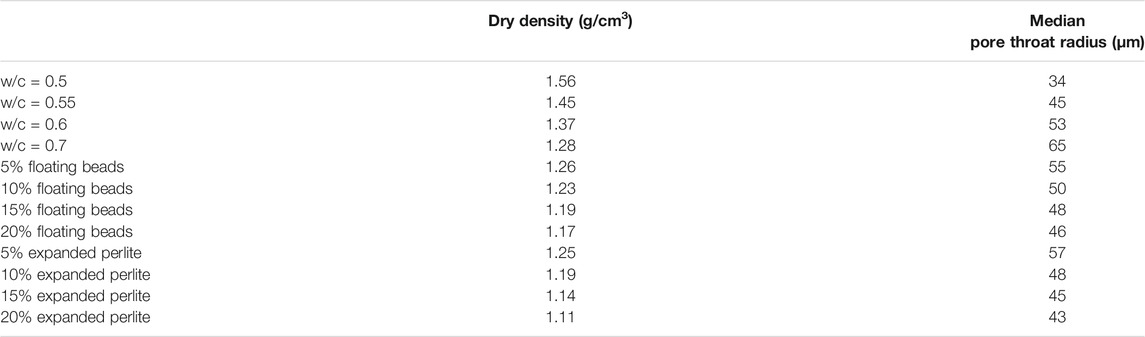
TABLE 5. Dry density and median pore throat radius of cement.
Floating beads distribute evenly in the cement (Figures 5A,B). The surface can be closely combined with the cement skeleton, and its hollow structure can effectively replace the skeleton (Figures 5C,D). Increasing the content of floating beads can not only significantly increase the number and size of macropores, but also effectively reduce the number of micropores and increase the density of skeleton (Tylor, 1997; Figures 5A,B,E,F).
The dry density and median pore throat radius decrease as the increase of floating beads. Besides, the reduction rate gradually slows down (Figure 5G). At the same time, most floating beads can stay closed, so there is no effect on the distribution of internal communicating pore in cement. Therefore, the reduction of dry density is mainly attributed to the increase of floating beads. However, the decrease in the size of primary macropores and micropores in the cement leads to a decrease in the median pore throat radius. In addition, the analysis shows that when the content of floating beads is 0–5%, its main function is to replace the primary macropores and compress the micropores. Therefore, the dry density changes are relatively small, whereas the median pore throat radius varies greatly. When the dosage of floating beads changes to 5%, the decreased value of dry density and median pore throat radius accounts for 18.2 and 52.6% of the total decrease, respectively. As the dosage varies from 5 to 15%, the main function of floating beads further replaces the cement skeleton and compresses the original pores. This will make the reduction rate of dry density changed larger than the median pore throat radius. When the dosage of floating beads reaches 15%, a decrease in dry density and median pore throat particle size account for 81.8 and 89.5% of the total decrease, respectively. In addition, as the dosage is 15–20%, the ratio of the floating beads to the total volume of cement slurry is greatly reduced, so the decrease in dry density is also significantly reduced.
The SEM results of floating beads and skeleton in thermal insulation cement are shown in Figures 6A,B. Among them, points of spectrogram 1 and spectrogram 2 are selected from the surface of floating beads, and spectrogram 3 is from the cement skeleton. The XRD results of pure cement (w/c = 0.7) and thermal insulation cement with 20% floating beads are shown in Figures 6C,D.
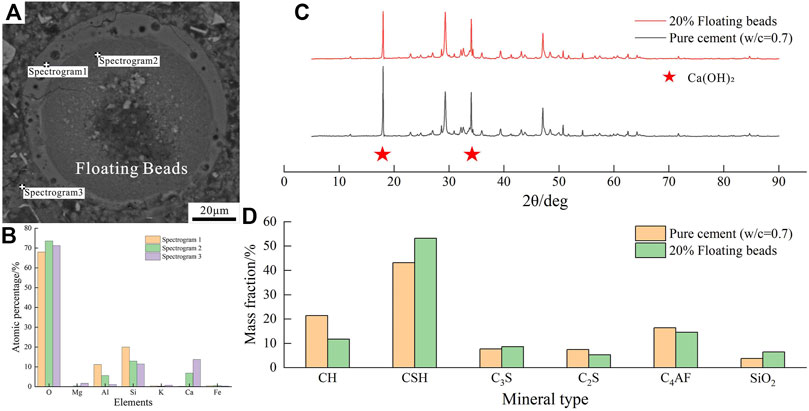
FIGURE 6. Energy spectrum analysis and XRD results of thermal insulation cement with floating beads. (A) The selected points of spectrograms. (B) Atomic number statistics from energy spectrum analysis results. (C) XRD test results of pure cement (w/c = 0.7) and thermal insulation cement with 20% floating beads. (D) Mineral content statistics of XRD test results.
The result of spectrogram 1 can further confirm that mainly two types of oxides i.e., SiO2 and Al2O3, exist on the surface of float beads. Comparing spectrogram 2 with 3, it can be found that the calcium content has increased in some areas of the surface of the floating bead. It may be generated by the reaction between oxides and calcium-containing substances in cement slurry (Figures 6A,B). In addition, the research of XRD shows that the addition of floating beads will reduce the content of Ca(OH)2 and increase the content of CSH in cement (Figures 6C,D). This can further support the opinion that the oxides that existed on the surface of the floating beads can react with Ca(OH)2 and form CSH at the end (Equation 1, 2).
3.2.2 Thermal Conductivity
The test results of thermal conductivity for thermal insulation cement with floating beads are shown in Table 4 and plotted in Figures 7A,B. The thermal conductivity gradually decreases with the increase of floating beads. Specifically, the reduction rate of thermal conductivity gradually increases at first, and then gradually decreases (Figures 7A,B). This is similar to the change rule of dry density, as the effect of the floating beads varies under different dosages.
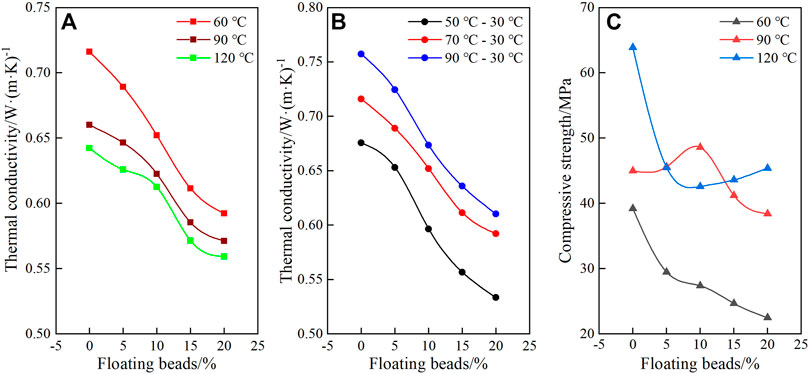
FIGURE 7. Thermal conductivity and compressive strength test results of thermal insulation cement with floating beads under different conditions. (A) Test results of thermal conductivity at different curing temperatures. The test temperature combination is 70–30°C. (B) Test results of thermal conductivity at different hot plate temperatures. The curing temperature is 60°C. (C) Test results of compressive strength at different curing temperatures.
The increased curing temperature can effectively reduce thermal conductivity (Figure 7A). When the curing temperature is 60°C, 90°C, and 120°C, the thermal conductivity of thermal insulation cement with 20% float beads is 0.5922 W/(mK), 0.5713 W/(mK), and 0.5591 W/(mK) respectively. Compared with pure cement (w/c = 0.7), the thermal conductivity decreases by 17.3%, 13.4%, and 12.9%. In addition, for heat insulation cement with 20% floating beads, the thermal conductivity reduction rate is 4.5 and 6.1%, respectively, which corresponds with the curing temperatures of 60–90 and 120°C. For the thermal insulation cement with 10% floating beads, as the curing temperature is increased, the thermal conductivity reduction rate is 3.5 and 5.6%. The test results clearly show that the reduction rate of thermal conductivity gradually decreases, which is caused by the increase of curing temperature. The increase of porosity and hydration degree of cement particles are the main factors for the decrease in thermal conductivity.
The thermal conductivity increases with the improvement of the hot plate temperature (Figure 7B). Moreover, the change rules of thermal conductivity at three different hot plate temperatures are the same. The thermal conductivity of thermal insulation cement with 10 and 20% floating beads is 0.5966 W/(mK) and 0.5335 W/(mK) respectively, with the hot plate temperature is set at 50°C. When the hot plate temperature is increased to 70°C, the thermal conductivity increase rate is 9.3 and 11.0%, respectively. The increased rate of thermal conductivity is 12.9 and 14.4% respectively, with the hot plate temperature is set at 90°C. As the hot plate temperature increases, the increase rate of the thermal conductivity decreases. Based on these results, we can conclude that the increase of hot plate temperature can enhance the convective strength of gas inside the floating beads. This is different from the enhancement of gas flow in the connected pores of pure cement.
3.2.3 Compressive Strength
The compressive strength of thermal insulation cement with floating beads is shown in Table 4 and plotted in Figure 7C. An increase in the content of floating beads will reduce thermal conductivity, but the effect of increasing curing temperature is the opposite (Figure 7C). The compressive strength of thermal insulation cement with 20% floating beads at different curing temperatures (i.e., 60°C, 90°C, and 120°C) are 22.5, 38.4, and 45.4 MPa, respectively, which are 42.6%, 14.7%, and 28.9% lower than pure cement under the same w/c ratio. Furthermore, when the curing temperature is increased to 90 and 120°C, the increased rate of compressive strength for thermal insulation cement with 20% float beads is 70.7 and 101.8%. Generally, the compressive strength of thermal insulation cement can be maintained at a relatively high level. Research on the microstructure of cement shows that although the addition of floating beads can effectively reduce the number and size of primary pores, the hollow structure of the floating beads can significantly increase the porosity of the cement. This is the main reason for the decrease in compressive strength. In addition, the strength of floating beads derived from the thicker shell (Figure 5C), and hydration of active substances can effectively enhance the strength of the surrounding cement skeleton. This is an important factor for maintaining high compressive strength.
In summary, the addition of floating beads can effectively reduce the thermal conductivity of cement and maintain its compressive strength. Specifically, the increase in porosity is the main reason for the decrease in thermal conductivity. However, the extension of the heat conduction path and hydration of active substances on the surface of the floating beads are other reasons. Moreover, the increase in hydration degree of cement particles, the thicker shell of floating beads, as well as the increase in strength of the surrounding cement skeleton, are important factors for maintaining the cement compressive strength.
3.3 Thermal Insulation Cement With Expanded Perlite
3.3.1 Microstructure and Related Parameters
The analyzed results of macropores and micropores for thermal insulation cement with expanded perlite are shown in Figures 8A,B,E,F. The microstructure of the expanded perlite in the cement under the SEM is shown in Figures 8C,D. Dry density and median pore throat radius are shown in Table 5 and plotted in Figure 8G.
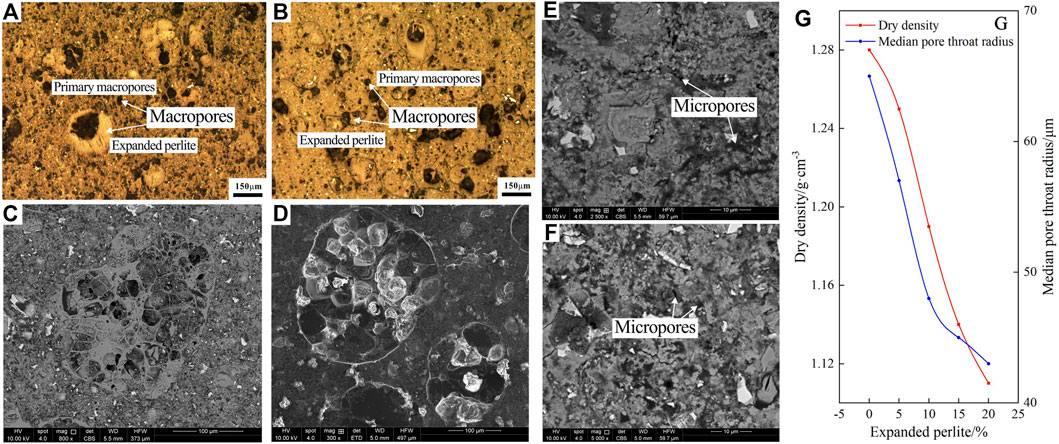
FIGURE 8. Microstructure and related parameters of thermal insulation cement with expanded perlite. (A) Microstructure of thermal insulation cement with 10% expanded perlite under the microscope. (B) Microstructure of thermal insulation cement with 20% expanded perlite under the microscope. (C,D) Microstructure of expanded perlite under SEM. (E) Microstructure of thermal insulation cement with 10% expanded perlite under SEM. (F) Microstructure of thermal insulation cement with 20% expanded perlite under SEM. (G) Dry density and median pore throat radius of thermal insulation cement with expanded perlite.
The addition of expanded perlite can notably replace the primary macropores and compress micropores. As a result, with the addition of expanded perlite, the number and size of primary macropores and micropores are gradually reduced (Figures 8A,B,E,F). This ultimately leads to the continuous decrease of the median pore throat radius (Figure 8G). Simultaneously, an increase in the expanded perlite content will also significantly reduce the dry density because of its internal honeycomb-like structure (Figures 8C,D,G). When the content of expanded perlite is 10%, the dry density and median pore throat radius is 1.23 g/cm3 and 50 μm, and the decreased value under this amount accounts for 45.4 and 78.9% of the total decrease value. Compared with the thermal insulation cement with floating beads, the cement with expanded perlite has significant advantages for reducing the dry density, and the effect on reducing the median pore throat radius is equivalent.
The SEM results of expanded perlite and skeleton in thermal insulation cement are shown in Figures 9A,B. Among them, points of spectrogram 1 and spectrogram 2 are selected from the surface of expanded perlite, and spectrogram 3 is from the cement skeleton. The XRD results of pure cement (w/c = 0.7) and thermal insulation cement with 20% expanded perlite are shown in Figures 9C,D.
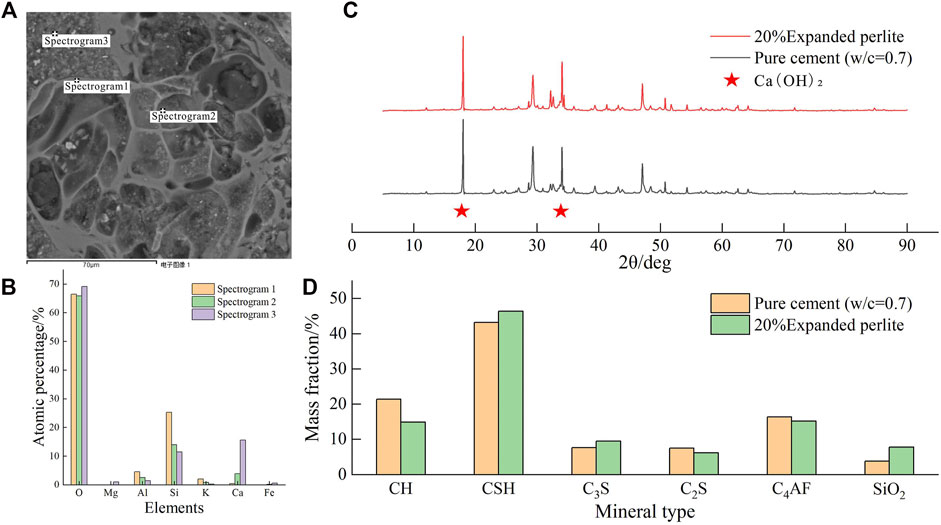
FIGURE 9. Energy spectrum analysis and XRD test results of thermal insulation cement with expanded perlite. (A) The selected points of spectrograms. (B) Atomic number statistics from energy spectrum analysis results. (C) XRD test results of pure cement (w/c = 0.7) and thermal insulation cement with 20% expanded perlite. (D) Mineral content statistics of XRD test results.
Comparing the results of spectrogram 1, spectrogram 2, and spectrogram 3, it can be deduced that the main substances that existed on the surface of expanded perlite are SiO2 and Al2O3, which are similar to floating beads. These oxides can react with Ca(OH)2 in the slurry to form CSH (Figures 9A,B). Eventually, the content of Ca(OH)2 is reduced, and the content of CSH is increased (Figures 9C,D).
3.3.2 Thermal Conductivity
The test results of thermal conductivity for thermal insulation cement with expanded perlite at different curing and hot plate temperatures are shown in Table 4 and plotted in Figures 10A,B.
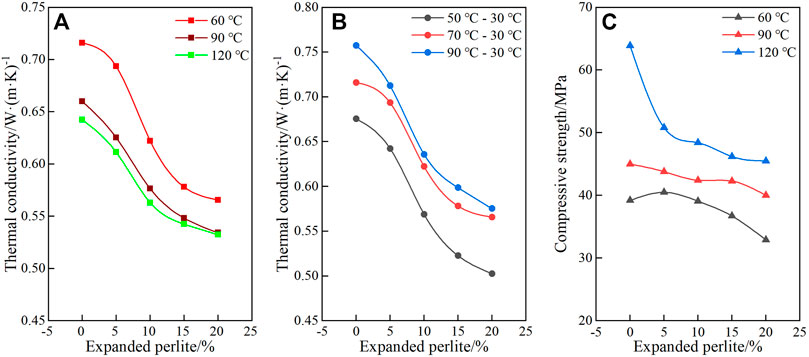
FIGURE 10. Test results of thermal conductivity and compressive strength of thermal insulation cement with expanded perlite under different conditions. (A) Test results of thermal conductivity at different curing temperatures. The test temperature combination is 70–30°C. (B) Test results of thermal conductivity at different hot plate temperatures. The curing temperature is 60°C. (C) Test results of compressive strength at different curing temperatures.
In addition to expanded perlite, the thermal conductivity gradually decreases, and the reduction rate increased first and then decreased (Figures 10A,B). This change rule and reasons are identical to that of cement with floating beads. The thermal conductivity of thermal insulation cement with 20% expanded perlite at a curing temperature of 60°C, 90°C, and 120°C are 0.5656 W/(mK), 0.5343 W/(mK) and 0.5436 W/(mK), respectively, which are 21.0%, 19.0%, and 17.1% lower than that of pure cement with a w/c ratio of 0.7 (Figure 10A). Similarly, under three different hot plate temperatures, the thermal conductivity of thermal insulation cement with 20% expanded perlite has a reduced rate of larger than 21%. Combined with the analyzed data, the thermal conductivity of thermal insulation cement with expanded perlite is generally lower than that of cement with floating beads. This may be caused by the relatively small density of expanded perlite. Therefore, with the same mass fraction addition, the amount of expanded perlite that can be added to the cement slurry is much more. Furthermore, the honeycomb-like structure in the expanded perlite is another factor. This structure is more effective in reducing fluid convection in the insulation material (Table 3 and Figure 8C).
The thermal conductivity decreases with the increase of curing temperature (Figure 10A). This can be attributed to an increase in the hydration degree of cement particles and surface oxides of expanded perlite. The thermal conductivity of thermal insulation cement with 10% expanded perlite can be reduced by 7.3 and 9.5% when the curing temperature is 60–90°C and 120°C, respectively. Under the situation with the expanded perlite content is 20%, the reduction rate is 5.5 and 5.9%.
Similarly, the thermal conductivity increases with the increase of the hot plate temperature. The higher the temperature, the lower the growth rate. The thermal conductivity of thermal insulation cement with 20% expanded perlite can be increased by 12.5 and 14.4% when the hot plate temperature is 50–70°C and 90°C, respectively.
3.3.3 Compressive Strength
The test results of compressive strength for thermal insulation cement with expanded perlite are shown in Table 4 and plotted in Figure 10C. With the addition of expanded perlite, the compressive strength gradually decreases. The results indicate that the increase of curing temperature can significantly enhance the cement compressive strength (Figure 10C). When the content of expanded perlite is 20%, the compressive strength at different curing temperatures (i.e., 60°C, 90°C, and 120°C) are 32.9, 40.0, and 45.5 MPa, respectively. In general, the compressive strength of thermal insulation cement with expanded perlite can maintain a high value under the above test conditions, especially higher than that of cement with floating beads. This may be caused by the relatively higher SiO2 content on the surface of the expanded perlite. It can effectively increase the skeleton strength around the expanded perlite and reduce the possibility of stress concentration. Moreover, the existence of the honeycomb-like structure can greatly improve the plasticity of the cement skeleton, and finally improve the compressive capacity (Figures 8C,D).
In a word, with the addition of expanded perlite and floating beads, thermal conductivity and compressive strength have similar varied trends and mechanisms. However, the honeycomb-like structure inside the expanded perlite is favorable to obtain lower thermal conductivity and maintain the higher compressive strength of cement.
4 Conclusion
This paper has introduced a steady-state test method. The thermal conductivity and compressive strength of cement under different conditions were tested. The microscopic mechanism of the thermal conductivity and compressive strength change were also explained. The conclusions are as follows:
1) The use of thermal insulation materials can effectively reduce the thermal conductivity of cement and maintain its compressive strength. Specifically, the increase of w/c ratio, thermal insulation material, and curing temperature can significantly reduce cement thermal conductivity. However, the first two factors and the last factor have opposite effects on the compressive strength. Furthermore, the increase in hot plate temperature will increase thermal conductivity. In comparison, the effect of expanded perlite is better than that of floating beads.
2) The increase of porosity and hydration degree of cement particles can effectively reduce the heat transfer area and heat transfer capacity of the skeleton. They are the main reasons for the decrease in thermal conductivity. The extension of the heat transfer path and hydration of active substances on the insulation material surface can effectively reduce the thermal transfer efficiency of the skeleton, which are other reasons for the decrease of thermal conductivity. In addition, the hydration of cement particles is the basis for cement to maintain the necessary compressive strength. The strength of the insulation material, the hydration of the surface-active substance, and the internal honeycomb-like structure are important factors to maintain the compressive strength at a high level.
3) Combined with the actual conditions of the formations and engineering, the lower formation temperature of the upper well section will result in a relatively low curing temperature and a relatively large temperature difference (between the hot water and formations) during the pumping process. This will result in a relatively high thermal transfer capacity of cement in the upper well section, and thus this area is the main thermal loss area.
Data Availability Statement
The original contributions presented in the study are included in the article/supplementary material, further inquiries can be directed to the corresponding author.
Author Contributions
FZ wrote the manuscript and is responsible for providing overall idea, experimental design, and data analysis, LL is responsible for instrument operation. All authors approve the article for publication.
Funding
This work was financially supported by the National Key Research and Development Program of China (Grant No. 2019YFB1504102) and a project of the Chinese Academy of Geological Sciences (Grant No. JKY202008).
Conflict of Interest
The authors declare that the research was conducted in the absence of any commercial or financial relationships that could be construed as a potential conflict of interest.
Publisher’s Note
All claims expressed in this article are solely those of the authors and do not necessarily represent those of their affiliated organizations, or those of the publisher, the editors, and the reviewers. Any product that may be evaluated in this article, or claim that may be made by its manufacturer, is not guaranteed or endorsed by the publisher.
Acknowledgments
We thank the editor, associate editor, and reviewers for their constructive comments, which helped greatly improve the paper.
References
Bildirici, M. E., and Gökmenoğlu, S. M. (2017). Environmental Pollution, Hydropower Energy Consumption and Economic Growth: Evidence from G7 Countries, Hydropower Energy Consumption and Economic Growth: Evidence from G7 Countries. Renew. Sust. Energ. Rev. 75 (C), 68–85. doi:10.1016/j.rser.2016.10.052
Fang, Y., Zhang, Y., and Ran, Z. Z. (2020). Thermal Conductivity of Cementing Conductive Cement in Medium and Deep Geothermal Well. Mater. Rep. 34 (20), 32–37+56. doi:10.11896/cldb.19030004
Gorman, J. M., Abraham, J. P., and Sparrow, E. M. (2014). A Novel, Comprehensive Numerical Simulation for Predicting Temperatures within Boreholes and the Adjoining Rock Bed. Geothermics 50, 213–219. doi:10.1016/j.geothermics.2013.10.001
Hamm, S., and Metcalfe, E. (2019). Harnessing the Heat beneath Our Feet: Geothermal Energy. Front. Young Minds 7, 105. doi:10.3389/frym.2019.00105
Hasan, A. R., and Kabir, C. S. (2002). Fluid Flow and Heat Transfer in Wellbores. Texas: Society of Petroleum Engineers, 64–73.
Ichim, A., Teodoriu, C., and Falcone, G. (2016). “Influence of Cement Thermal Properties on Wellbore Heat Exchange,” in Proceeding of the 41st Workshop on Geothermal Reservoir Engineering Stanford University, Stanford, California, Feb 2016.
Ichim, A., Teodoriu, C., and Falcone, G. (2018). Estimation of Cement Thermal Properties through the Three-phase Model with Application to Geothermal Wells. Energies 11 (10), 2839. doi:10.3390/en11102839
Kanev, K., Ikeuchi, J., Kimurat, S., and Okajima, A. (1997). Heat Loss to the Surrounding Rock Formation from a Geothermal Wellbore. Geothermics 26, 329–349. doi:10.1016/S0375-6505(96)00046-6
Li, X. Y., He, H. P., Duan, Y. Z., and Li, Y. F. (2017). Analysis on the Thermal Efficiency Improvement Process for Geothermal Well in Porous Sandstone. Oil Drilling Prod. Tech. 39 (4), 484–490. doi:10.13639/j.odpt.2017.04.016
Ma, B., Cao, Y., Wang, Y., Jia, Y., Qin, H. S., and Chen, Y. (2016). Origin of Carbonate Cements with Implications for Petroleum Reservoir in Eocene Sandstones, Northern Dongying Depression, Bohai Bay basin, China. Energy Exploration & Exploitation 34 (2), 199–216. doi:10.1177/0144598716629871
Qomi, M. J. A., Bauchy, M., Ulm, F.-J., and Pellenq, R. J.-M. (2014). Anomalous Composition-dependent Dynamics of Nanoconfined Water in the Interlayer of Disordered Calcium-Silicates. J. Chem. Phys. 140 (5), 054515. doi:10.1063/1.4864118
Sarkar, P. K., and Mitra, N. (2021). Thermal Conductivity of Cement Paste: Influence of Macro-Porosity. Cement Concrete Res. 143, 106385. doi:10.1016/j.cemconres.2021.106385
Tekin, S., and Akin, S. (2011). “Estimation of the Formation Temperature from the Inlet and Outlet Mud Temperatures while Drilling Geothermal Formations,” in Proceedings of 36th Workshop on Geothermal Reservoir Engineering, Stanford (Stanford University).
Tóth, A. (2006). “Heat Losses in a Planned Hungarian Geothermal Power Plant,” in Proceedings of the Thirsty-First Workshop on Geothermal Reservoir Engineering, Stanford, Feb 2016 (Stanford University).
Wang, G. L., Zhang, W., Liang, J. Y., Lin, W. J., and Wang, W. L. (2017). Evaluation of Geothermal Resources Potential in China. Acta Geoscientica 38 (04), 449–450+134+451. doi:10.3975/cagsb.2017.04.02
Won, J., Lee, D., Na, K., Lee, I.-M., and Choi, H. (2015). Physical Properties of G-Class Cement for Geothermal Well Cementing in South Korea. Renew. Energ. 80, 123–131. doi:10.1016/j.renene.2015.01.067
Yang, M., Meng, Y. F., Li, G., Deng, J. M., and Zhao, X. M. (2013). A Transient Heat Transfer Model of Wellbore and Formation during the Whole Drilling Process. Acta Petrolei Sinica 34 (2), 366–371. doi:10.7623/syxb201302021
Yang, T., Zhao, P., Li, Q., Zhao, Y., and Yu, T. (2021). Study on Thermophysical Properties of a Lead-Bismuth-Based Graphene Nanofluid. Front. Energ. Res. 9, 727447. doi:10.3389/fenrg.2021.727447
Zhao, J. (2020). Discussion on Technical Feasibility of Thermal Insulation Cement in Jiangsu Oilfield. Inner Mongolia Petrochemical Industry 3, 86–88. doi:10.3969/j.issn.1006-7981.2020.11.032
Zhao, X. T., and Fu, H. Y. (2019). Analysis of Current Status and Prospects of Geothermal Energy Development and Utilization. Environ. Dev. 31 (5), 233. doi:10.16647/j.cnki.cn15-1369/X.2019.05.139
Keywords: insulation cement, thermal conductivity, geothermal well, insulation material, compressive strength
Citation: Zhang F and Li L (2022) Study on Thermal Conductivity of Thermal Insulation Cement in Geothermal Well. Front. Earth Sci. 10:784245. doi: 10.3389/feart.2022.784245
Received: 27 September 2021; Accepted: 20 January 2022;
Published: 22 February 2022.
Edited by:
Yinhui Zuo, Chengdu University of Technology, ChinaReviewed by:
Wei Xu, Xi’an Jiaotong University, ChinaJie Hu, Chengdu University of Technology, China
Copyright © 2022 Zhang and Li. This is an open-access article distributed under the terms of the Creative Commons Attribution License (CC BY). The use, distribution or reproduction in other forums is permitted, provided the original author(s) and the copyright owner(s) are credited and that the original publication in this journal is cited, in accordance with accepted academic practice. No use, distribution or reproduction is permitted which does not comply with these terms.
*Correspondence: Fengyan Zhang, emhhbmdmeTE4QGNhZ3MuYWMuY24=