- 1School of Atmospheric Sciences, Chengdu University of Information Technology, Chengdu, China
- 2Plateau Atmosphere and Environment Key Laboratory of Sichuan Province, Chengdu University of Information Technology, Chengdu, China
- 3School of Atmospheric Sciences, Nanjing University, Nanjing, China
In this study, we examine the different seasonal precipitation anomaly patterns in Central Asia associated with the cold-tongue (CT) El Niño and warm-pool (WP) El Niño from the El Niño developing autumn to the decaying spring based on the Global Precipitation Climatology Centre (GPCC) full data reanalysis version 2018 (GPCC V2018) data set. Overall, El Niño are associated with more precipitations over Central Asia, but significant discrepancies can be found in the precipitation anomaly spatial patterns associated with the two types of El Niño from the El Niño developing autumn to the decaying spring. The precipitation associated with CT El Niño is mostly concentrated in the plains and hilly areas of Central Asia and is more dispersed in space. Whereas the precipitation associated with WP El Niño is mostly concentrated along Pamirs and Tian Shan Mountains with consistency throughout the autumn before El Niño peaks to the spring when El Niño decays. Also, the strength of the positive precipitation anomaly associated with WP El Niño is significantly stronger than that of CT El Niño. The analysis of anomalous atmospheric circulation caused by two types of El Niño shows that the interconfiguration of anomalous high pressure in the south side of Central Asia at low and middle latitudes and anomalous low pressure and anomalous high pressure in the high latitudes of Eurasia affects the southwest water vapor flux and north side water vapor flux in Central Asia, thus causing different effects of different types of El Niño on precipitation in Central Asia at different stages. The spatial consistency of the WP El Niño effect on precipitation in Central Asia over three seasons may be related to the upward branch of the anomalous Walker circulation over the Indian Ocean induced by it.
Introduction
El Niño-Southern Oscillation (ENSO) is the most important interannual signal of climate variability on earth. It influences the world climate through the ocean-atmospheric coupling process globally. Canonical El Niño is characterized with maximum warm sea surface temperature (SST) anomalies in the eastern equatorial Pacific. However, since the 1990s, a new type of El Niño has begun to occur frequently with the largest SST warm anomaly located in the central equatorial Pacific. It is often referred to as Dateline El Niño (Larkin and Harrison, 2005), El Niño Modoki Ashok et al. (2007), Weng et al. (2007), Weng et al. (2009), central Pacific (CP) El Niño (Kao and Yu, 2009), and warm pool (WP) El Niño (Kug et al., 2009). Furthermore, it was recently shown that this new type of El Niño may become even more frequent under global warming scenarios (Yeh et al., 2009). In this study, this new type of El Niño and the canonical El Niño are referred to as warm pool (WP) El Niño and cold tongue (CT) El Niño, respectively.
Previous studies have discussed the different impacts of the two types of El Niño on Atlantic hurricane frequency (Kim et al., 2009), western North Pacific tropical cyclone frequency (Chen and Tam, 2010), precipitation patterns over the western United States during boreal winter (Weng et al., 2009), winter climate extremes over the eastern and central United States (Ning and Bradley, 2015) and the austral spring and autumn rainfall in Australia (Wang and Hendon 2007; Taschetto and England 2009). Recently, their impacts on the variations of precipitation and temperature over East and Southeast Asia, the summer rainfall anomaly patterns in northeast China and the summer heat extremes in China have also been investigated in many studies (Weng et al., 2011; Feng et al., 2011, Feng and Li, 2011; Yuan and Yang 2012; Luo and Lau 2020; Gao et al., 2020; Qin and Shuang-lin, 2009).
As one of the largest semi-arid to arid regions, Central Asia is located in the hintland of Eurasia, acting as a bond of cultural and economic communication between Europe and Asia. Central Asia expands from 34.3°to 55.4°N and from 46.5°to 96.4°E geographically and encompasses five countries: Kazakhstan, Kyrgyzstan, Tajikistan, Turkmenistan, Uzbekistan (hereafter ‘CAS5’), and Xinjiang Uygur Autonomous Region of China. This region is characterized by typical continental climate with an annual total precipitation less than 300 mm, implying a fragile ecosystem that is highly vulnerable to climate change (IPCC 2013; Huang et al., 2016, Huang J. et al., 2017; Hu et al., 2017; Peng et al., 2020a, Peng et al., 2020b). Thus, changes in precipitation have a great impact on people’s living condition and ecosystem in Central Asia. Many studies of the precipitation in Central Asia focus on changes of precipitation under global warming (Chen et al., 2011; Hu et al., 2017), under CMIP6 future projections (Jiang et al., 2020) and the impacts of SST warming in the tropical Indian Ocean on the projected change in summer rainfall over Central Asia (Zhao and Zhang 2016). Some previous studies have documented the linkage between ENSO and the hydroclimatic variability of the southwest central Asia region (Mariotti, 2007). And the relationship between the changes of the seasonal precipitation over Central Asia and ENSO over the last century have be investigated recently (Chen et al., 2018). However, there are significant differences in the anomalous Walker circulation caused by the two types of El Niño, and there are also differences in the mid- and high-latitude teleconnection types caused, so are there also differences in the effects of the two types of El Niño on precipitation in Central Asia? In addition, previous studies have shown seasonal differences in the impact of ENSO on precipitation in Central Asia (Chen et al., 2018), so what is the impact of the two types of El Niño on precipitation in Central Asia at different stages of their lifetime? And what are the possible physical mechanisms behind this? These are the questions that this study intends to answer.
The remainder of the study is organized as follows. In Section Data and Methods, we introduce the datasets and analysis methods applied in this study. In Section Results, we compare the different seasonal precipitation anomaly patterns in Central Asia associated with the two types of El Niño from the El Niño developing autumn to the decaying spring and possible physical mechanisms responsible for these features are investigated. Section Summary and Discussion gives a brief summary of the study.
Data and Methods
The latest version of Global Precipitation Climatology Centre (GPCC) full data reanalysis version 2018 (GPCC full V2018) dataset (Schneider et al., 2018) with a spatial resolution of 1.0°×1.0° is used in this study. This gridded dataset is based on 75,000 meteorological stations world-wide with record durations of 10 years or longer. It has been widely used to support regional climate monitoring, model validation, climate variability analysis, and water resources assessment studies because of its high-quality control (Becker et al., 2013; Wan et al., 2013; Schneider et al., 2014; Gu and Adler, 2015). In addition, Hu et al. (2017) suggested that GPCC V7 has the higher accuracy than Climatic Research Unit (CRU) products and the data sets developed by Willmott and Matsuura from the University of Delaware (UDEL) when compared with the observed precipitation data from meteorological stations over Central Asia. Monthly SST data from the Hadley Centre Global Sea Ice and Sea Surface Temperature (Rayner et al., 2003) and monthly atmospheric reanalysis data sets NCEP/NCAR Reanalysis 1 from January 1948 to December 2020 (Kalnay et al., 1996) are also used in this study.
For the GPCC precipitation dataset and the HadISST, the temporal coverage we used in this study is from January 1891 to December 2016 for data consistency and reliability; and for reanalysis we used data from January 1948 to December 2020. Anomalies of all variables are obtained by removing the annual mean of the whole period accordingly. Seasonal means are constructed by averaging data from March–May (MAM), September–November (SON), and December–February (DJF).
In order to describe the two types of El Niño quantitatively, the CT and WP ENSO indices proposed by Ren and Jin (2011) are used in this study. These indices are defined as follows:
Here,
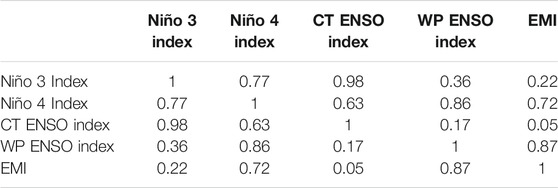
TABLE 1. Correlations between the Niño indices, the CT and WP ENSO indices and EMI calculated using the monthly HadISST. Correlation coefficients are all statistically significant at the confidence levels of 99%.
To investigate the possible impacts of CT and WP El Niño on the seasonal precipitation in Central Asia, composite analyses are conducted, and lag correlations are calculated between the normalized DJF CT and WP ENSO indices and other physical variables from El Niño developing autumn to the decaying spring. Although the correlation between monthly CT and WP ENSO indices is weak (R = 0.17), the correlation coefficient between them in the mature phase (boreal winter DJF) of El Niño is higher (R = 0.35) which is significant for the sample size of n = 66 at the confidence levels of 99%. Therefore, partial correlations
are considered throughout this study to exclude the possible influence dominated by any particular event (Sankar-Rao et al., 1996; Behera and Yamagata 2003). All statistical significance tests for correlations are performed using the two-tailed Student’s t test. The degrees of freedom (dof) are 64 for a time series of 66-season long (1951–2016) and 71 for a time series of 73-season long (1948–2020). The correlation coefficients at the confidence level of 95% (90%) are 0.24 (0.20) for dof = 64 and 0.23 (0.19) for dof = 71.
Results
Precipitation Anomaly Patterns Associated With Two Types of El Niño
Figure 1 shows the partial correlations between seasonal SST anomalies and normalized DJF CT ENSO index (left panel) and WP ENSO index (right panel) from El Niño developing summer (JJA0) to the decaying summer (JJA1), respectively. For the CT El Niño, significant warming is always concentrated along the equatorial eastern Pacific from the developing summer to the decaying summer. The warming patterns extend from the west coast of the Americas up to the dateline with warming centers located at the equatorial eastern Pacific. Meanwhile, negative SST anomalies develop in the western Pacific to the east of the Philippines and extend both northeastward and southeastward (Figures 1A–E) forming a cold ‘‘boomerang’’ (Trenberth and Stepaniak 2001). The CT El Niño is characterized by such a dipole SSTA pattern over the tropical Pacific throughout its life cycle. As for the WP El Niño, the center of the warming SSTA pattern is located persistently at the equatorial central Pacific from the developing to the decaying phase, with a weak cold SSTA to the equatorial eastern Pacific around 90W (Figures 1F–J). On the other hand, the cold ‘‘boomerang’’ SSTA pattern is less significant than that of the CT El Niño. This triple pattern along the tropical Pacific denotes a WP El Niño. Overall, the CT and WP ENSO indices are capable of capturing the SSTA progression patterns for the two types of El Niño events.
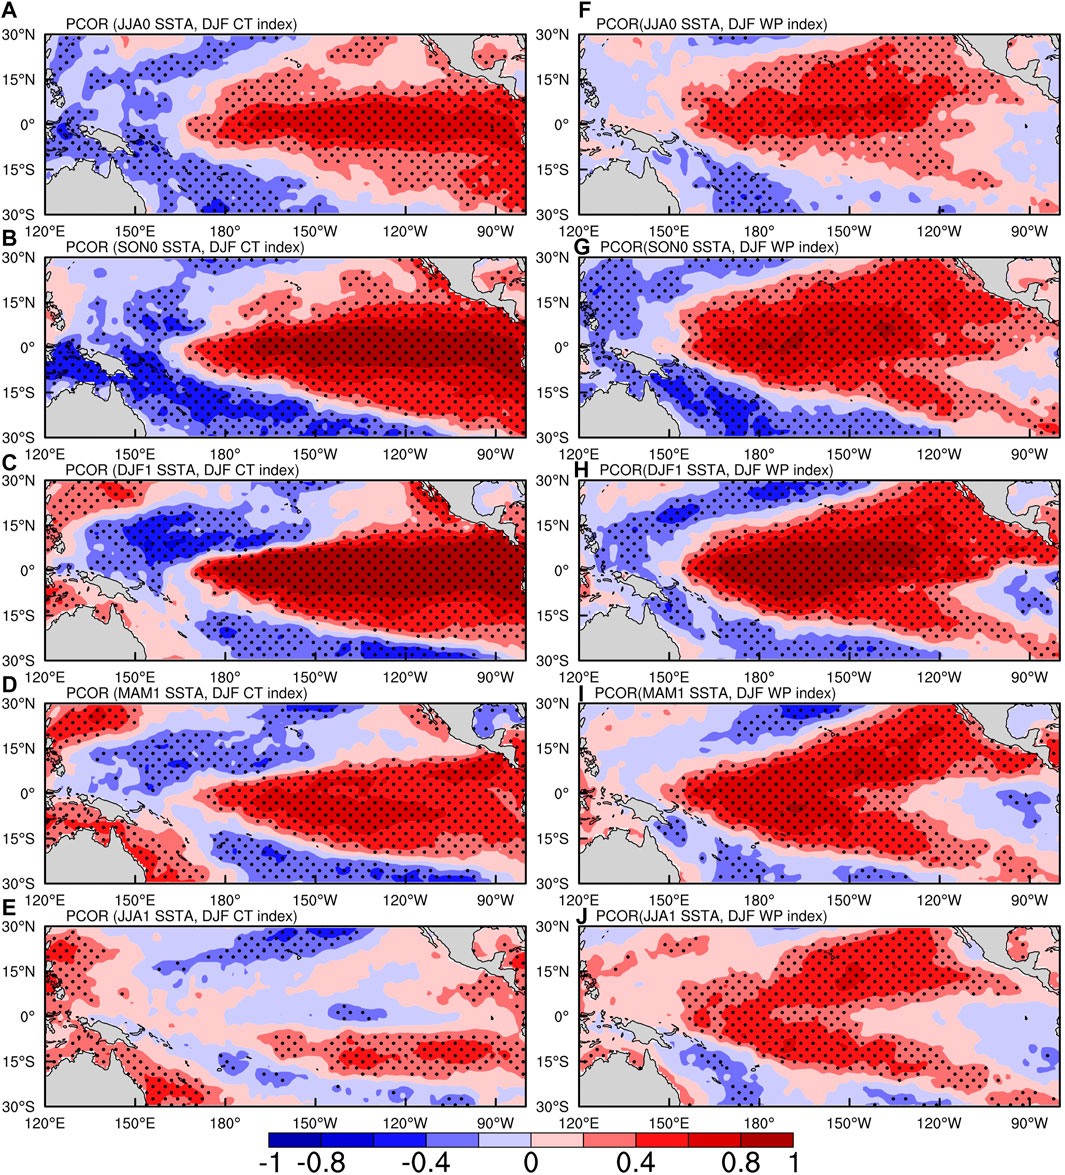
FIGURE 1. Partial correlations (shading) of seasonal SSTA with normalized DJF CT ENSO index (A–E) and WP ENSO index (F–J) for (A), (F) JJA(0), (B,G) SON(0), (C,H) DJF(0), (D,I) MAM(1), and (E,J) JJA(1) in which 0 means the El Niño developing year, 1 the next year. Correlation coefficients significant above the 95% confidence levels are marked with dots.
Chen et al. (2018) concluded that ENSO has significantly positive impact on the precipitation of Central Asia in during 1951–2013. Further, we found differences in the spatial patterns and intensity of the effects of the two types of El Niño on monthly precipitation in Central Asia. Figure 2 shows the regression coefficients of the monthly precipitation anomalies averaged through SON0 to MAM1 in Central Asia on the Niño3.4 index (Figure 2A), CT ENSO index (Figure 2B), and WP ENSO index (Figure 2C) during 1891–2016, respectively. Note that only regression coefficients that passed the 95% significance test are shown in these figures. It is shown that there are significant differences in the impact of the two types of El Niño on precipitation in Central Asia. The positive precipitation anomalies associated with CT El Niño are mainly located in the western Pamir Plateau (magnitudes about 2–4 mm/°C), with no significant impact on most of the rest parts of Central Asia (Figure 2B). In contrast, the positive precipitation anomalies associated with WP El Niño cover most of Central Asia except Xinjiang, China. The positive precipitation anomaly has a maximum center on the Pamir Plateau and in the Tian Shan Mountains, with magnitude of 10–12 mm/°C. In the hills, plains and desert areas of central and western Central Asia, the magnitude of the positive precipitation anomaly is about 2–4 mm/°C (Figure 2C). When the two types of El Niño events are considered together, the positive precipitation anomalies associated with the Niño3.4 index are found in the Pamir Plateau and Tian Shan Mountains regions (Figure 2A).
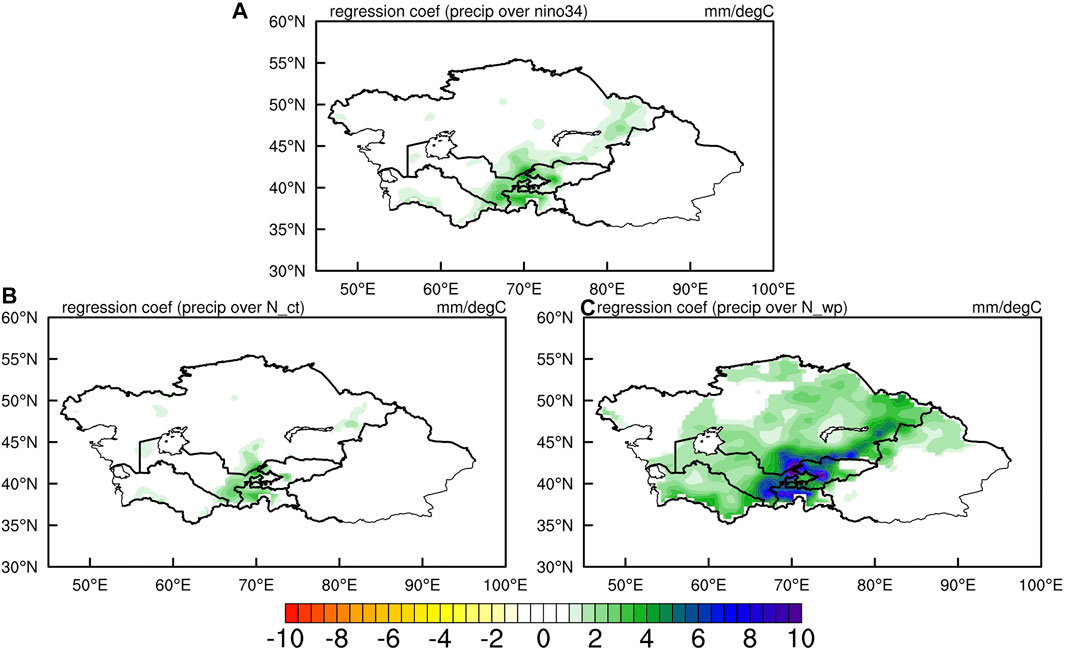
FIGURE 2. Regression coefficients of the monthly precipitation anomalies averaged through SON0 to MAM1 in Central Asia on the (A) Niño3.4 index, (B) CT ENSO index, and (C)WP ENSO index during 1891–2016. Shades indicate regression coefficients with significance above the 95% confidence levels.
Moreover, we further explore the seasonal precipitation anomalies patterns associated with the two types of El Niño during their life cycle. Chen et al. (2018) found that ENSO has the largest impact on the precipitation in Central Asia in boreal winter, followed by spring and autumn and there is no significant correlation between ENSO and the summer precipitation. Therefore, we mainly focus on the precipitation anomalies in the autumn before the El Niño peaks (SON0), the El Niño peaking winter (DJF0), and the next spring (MAM1). Composite analyses are conducted here to illustrate these patterns. First, we define the two types of El Niño events according to Ren and Jin (2011), that is, when the WP (CT) index is positive greater than one standard deviation of its own, then the warm SST anomaly is regarded as a WP (CT) El Niño state. Based on this criterion, the two types of El Niño events that were determined using detrended monthly HadISST from 1891-2020 are as follows:
CT El Niño: 1896, 1899, 1902, 1905, 1911, 1913, 1918, 1925, 1930, 1940, 1941, 1951, 1957, 1965, 1972, 1976, 1982, 1986, 1991, 1997, 2009, 2015
WP El Niño: 1900, 1940, 1941, 1957, 1958, 1968, 1977, 1986, 1987, 1990, 1991, 1992, 1993, 1994, 2002, 2003, 2004, 2006, 2009, 2014, 2015
It can be seen that several events (1940, 1941, 1957, 1986, 1991, 2009, 2015) are defined as both CT and WP El Niño events based on this determination criterion, which is due to the fact that these events show significant warming in both Niño3 and Niño4 regions and are basin-wide warm events. Therefore, some studies also refer to these events as “strong basin-wide” events and do not regard them as a regular CT or WP El Niño (Wang et al., 2019; Wang et al., 2020). In following analyses, we still keep these events in their respective categories.
The composites of seasonal precipitation anomaly associated with the CT El Niño (left panel) and WP El Niño (right panel) years during 1891–2020 from SON0 to MAM1 are shown in Figure 3. Only anomalies that passed the 90% significance test are shown in these figures. Consistent with the result in Figure 2, the impacts of WP El Niño on precipitation anomalies in Central Asia is stronger than CT El Niño in terms of intensity and spatial extent. In addition, there are prominent discrepancies between the precipitation anomalies associated with the CT and WP El Niño during every stage of the El Niño lifetime. In the CT El Niño developing autumn, positive precipitation anomalies are found in the plains of southwestern Central Asia and the northwestern Pamir Plateau (Figure 3A). In the following winter, as the El Niño peaks, the distribution of positive precipitation anomalies shifts northward, with more scattered wet conditions occurring in Kazakhstan (Figure 3B). In the El Niño decaying spring, a continuous positive precipitation anomaly appears in the Kazakh Hills and northern Xinjiang along with more precipitation in the northwestern Pamir Plateau (Figure 3C).
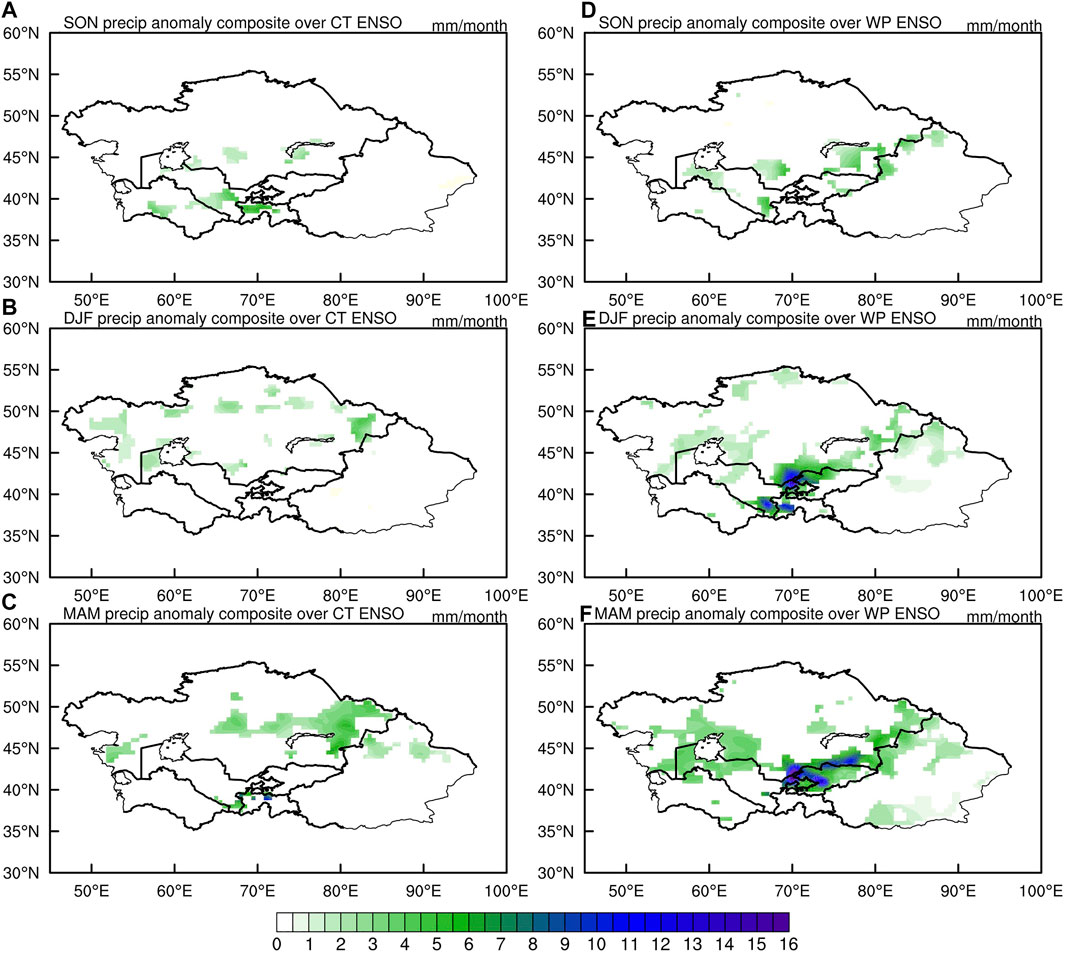
FIGURE 3. Composites of seasonal precipitation anomaly in Central Asia over all CT El Niño years (A–C) and WP El Niño years (D–F) during 1891–2016 for SON0, DJF0 and MAM1. Shades indicate regions with significance above the 90% confidence levels.
There are prominent discrepancies between the precipitation anomalies associated with the CT and WP El Niño during every stage of the El Niño lifetime. More precipitation appears in the Tian Shan Mountains and the Turan Plain in the WP El Niño developing autumn (Figure 3D). The positive precipitation anomalies in the mountainous region along Pamir Plateau and Tian Shan Mountains become conspicuous in the WP El Niño peaking winter along with some relatively weak positive rainfall anomalies in Xinjiang and plains around the Aral Sea (Figure 3E). In the following spring, the positive rainfall anomaly patterns are quite similar to that in the last winter with more precipitation in the mountainous region and a wider range of rainfall around the Aral Sea (Figure 3F). We also investigate the partial correlations between seasonal precipitation anomalies in Central Asia and the normalized DJF CT/WP ENSO indices in the same three seasons. And the results from the partial correlation are compatible with the above composite analyses (Figures not shown). Only that the area where the partial correlation coefficient between the precipitation anomaly and the CT/WP ENSO indices can pass the 90% significance test that is broader than that of the composite analysis. This is related to the size of the samples for which significance tests were carried out.
In summary, when comparing the precipitation anomalies in Central Asia associated with the CT and WP El Niño, three conspicuous characteristics need to be emphasized. First, overall, El Niño are associated with more precipitations over Central Asia in SON(0), DJF(0) and MAM(1) which is consistent with the findings of Chen et al. (2018), although the wet condition patterns are not consistent spatially and temporally. Second, the impacts of WP El Niño on Central Asia precipitation are stronger, more extensive, and longer lasting than that of CT El Niño. Third, the precipitation anomaly spatial patterns associated with the two types of El Niño is different from the El Niño developing autumn to the decaying spring. To be specific, the precipitation associated with CT El Niño is mostly concentrated in the plains and hilly areas of Central Asia and is more dispersed in space. Whereas the precipitation associated with WP El Niño is mostly concentrated in the mountainous areas of Central Asia. In its peaking winter and decaying spring, WP El Niño also brings a small amount of precipitation to Xinjiang and the plains around the Aral Sea.
Atmospheric Circulation Associated With Two Types of El Niño Over Central Asia
The different impacts of CT and WP El Niño on precipitation in Central Asia in time and space suggest that precipitation in Central Asia in different seasons may be controlled by different atmospheric circulations when the two types of ENSO occur. In this section, we explore the possible physical mechanisms for the above features of precipitation in Asia, based on composite analyses of the geopotential height (Figures 4, 5) and wind field (Figures 6, 7) of the lower and middle troposphere, the vertical integral of eastward and northward water vapor flux and the vertical integral of divergence of moisture flux (Figure 8) using the NCEP/NCAR Reanalysis 1 data. Previous studies suggested that ENSO has strong influences on the south-westerly water vapor flux coming from the Arabian Sea and tropical Africa and northeastern water vapor flux from Russia and thus can cause precipitation anomalies over Central Asia (Mariotti, 2007; Hu et al., 2017; Chen et al., 2018). In the following content, we focus on the difference between these two sources of water vapor flux in the developing, peaking, decaying season of two types of El Niño.
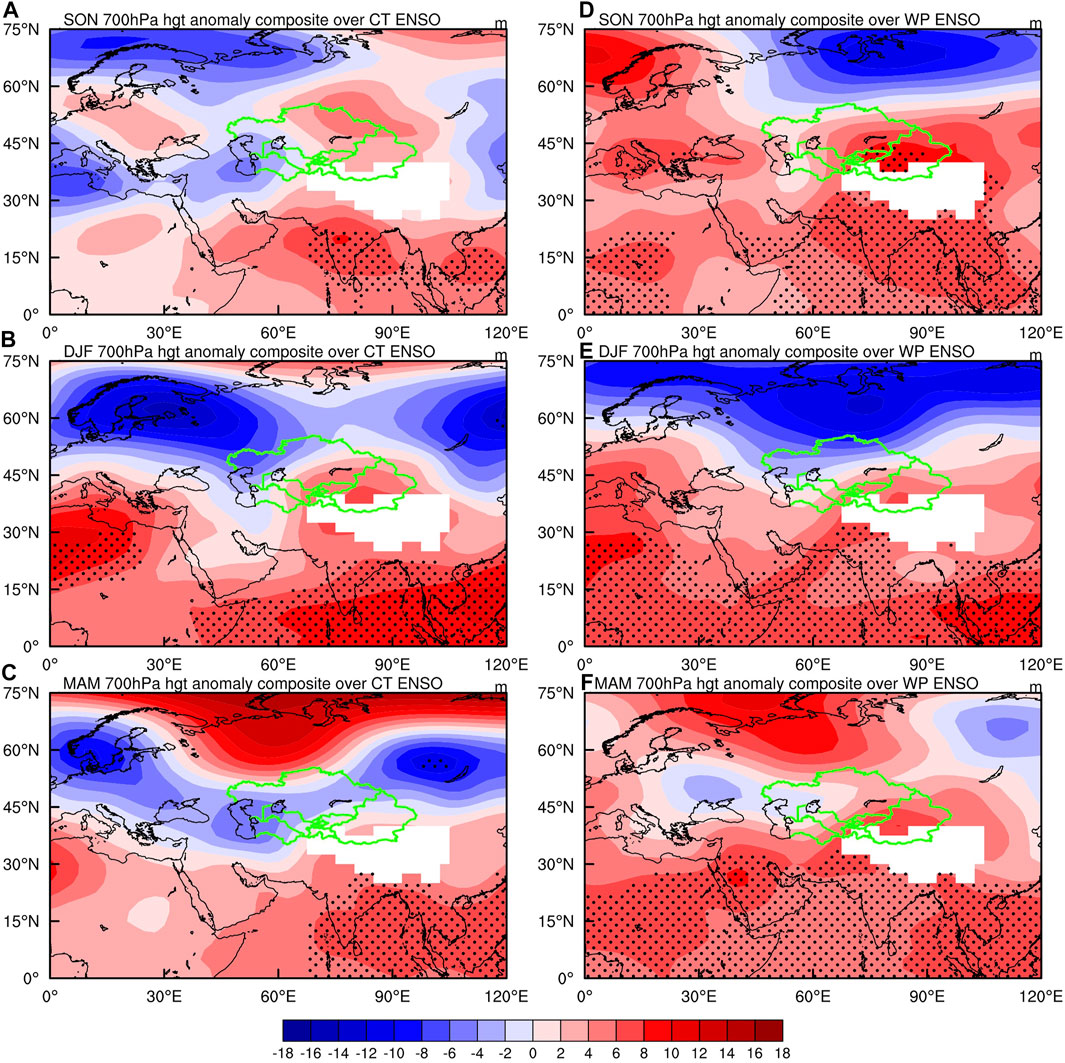
FIGURE 4. Composites of 700hPa geopotential height (hgt) anomalies in Central Asia over all CT El Niño years (A–C) and WP El Niño years (D–F) during 1948–2020 for SON0, DJF0 and MAM1. Dots denote regions with significance above the 90% confidence levels.
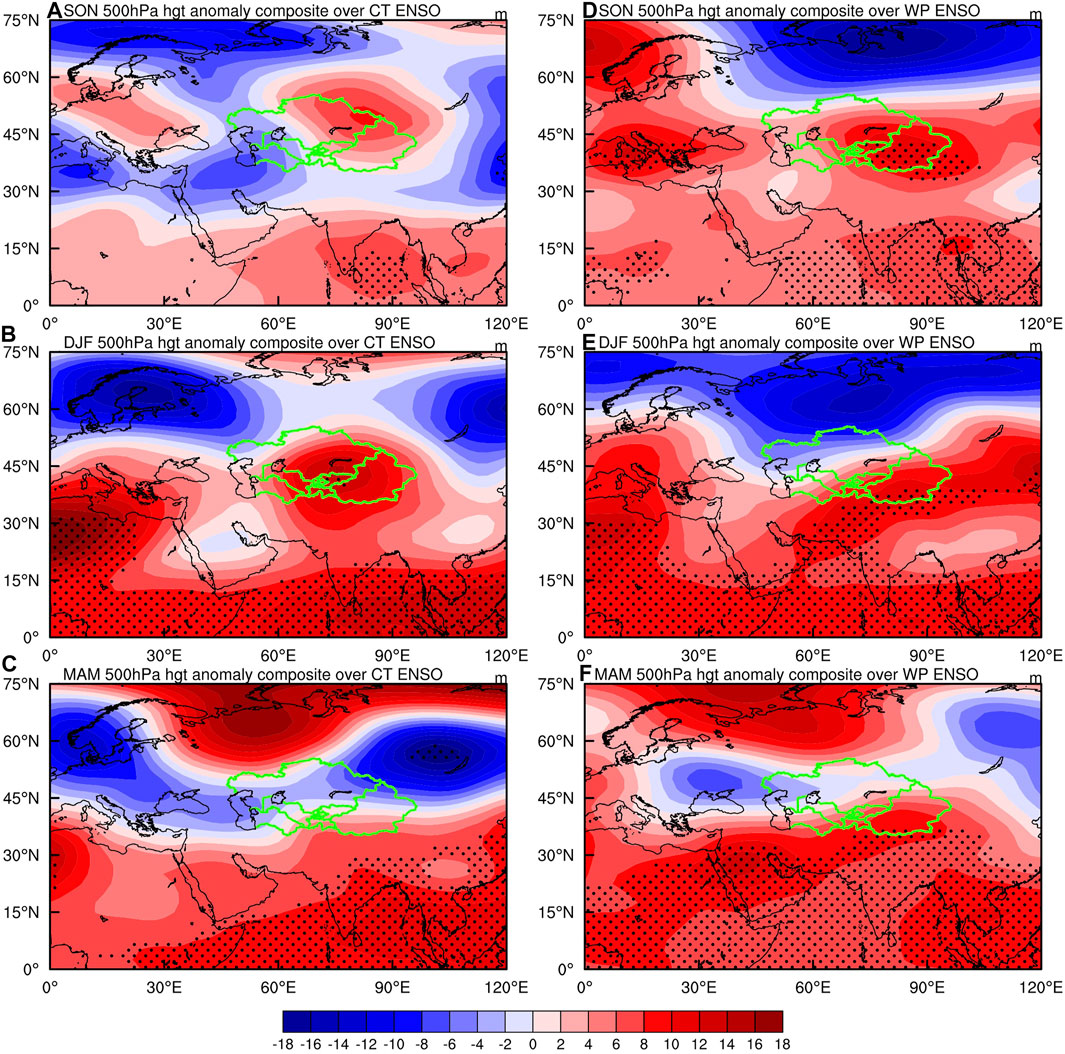
FIGURE 5. Same as Figure 4, but for 700 hPa anomalous wind field. Grey areas denote regions with significance above the 90% confidence levels.
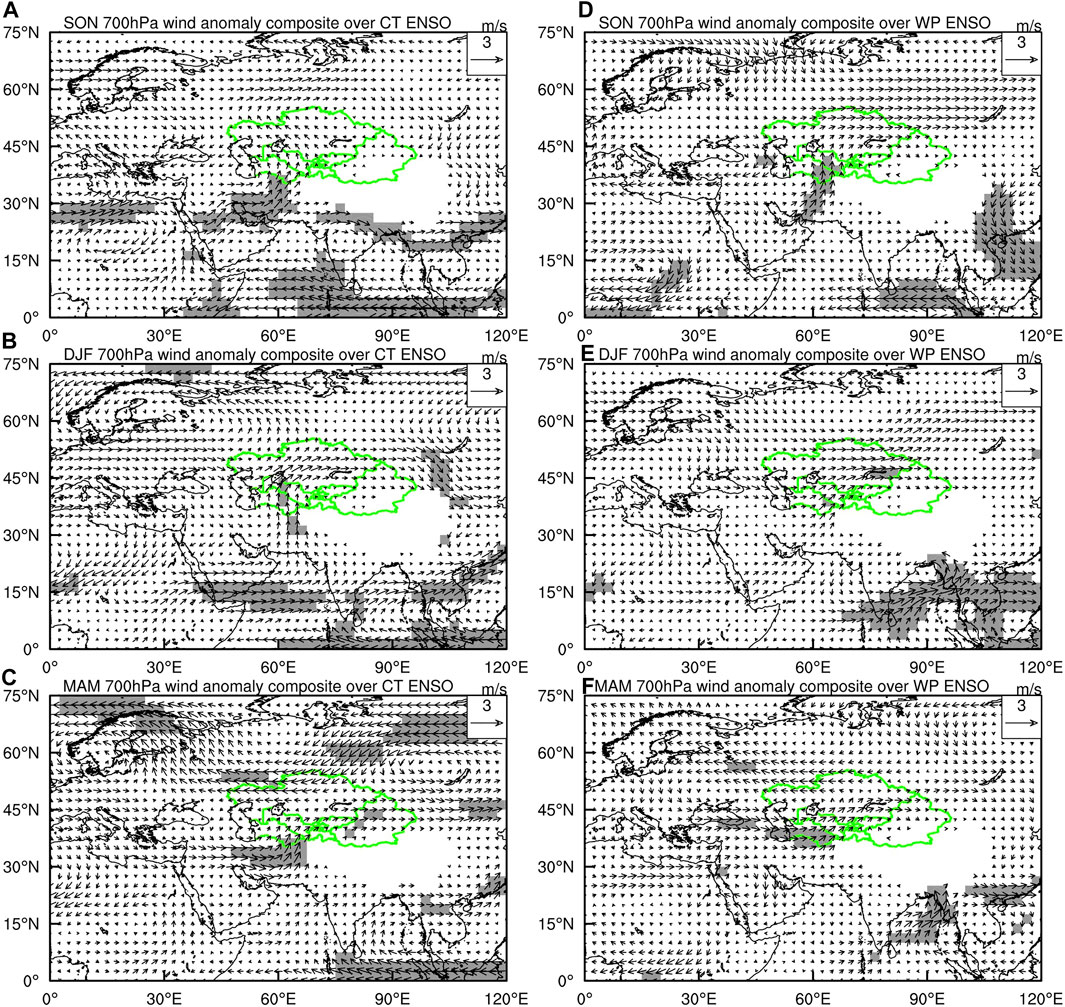
FIGURE 6. Same as Figure 4, but for 500 hPa anomalous geopotential height.
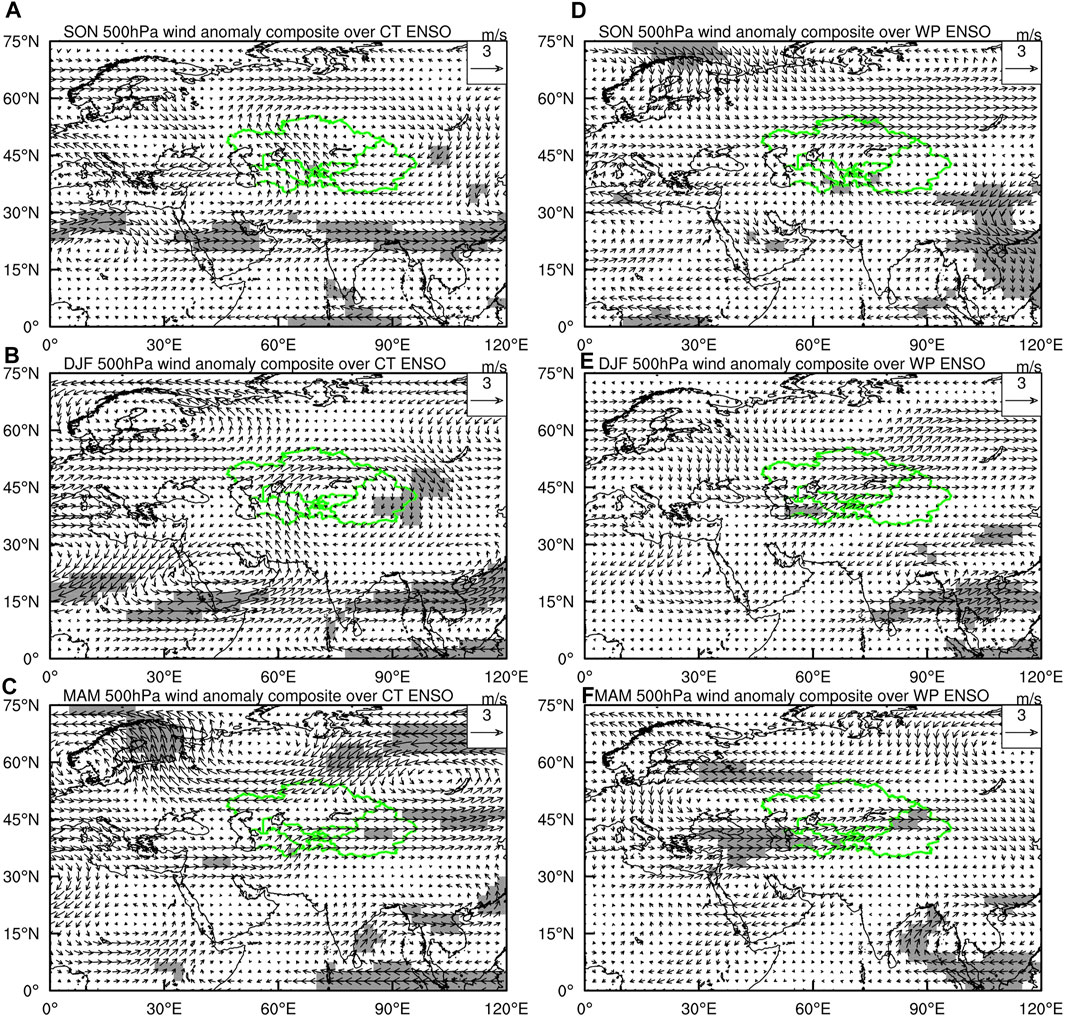
FIGURE 7. Same as Figure 6, but for 500 hPa anomalous wind field.
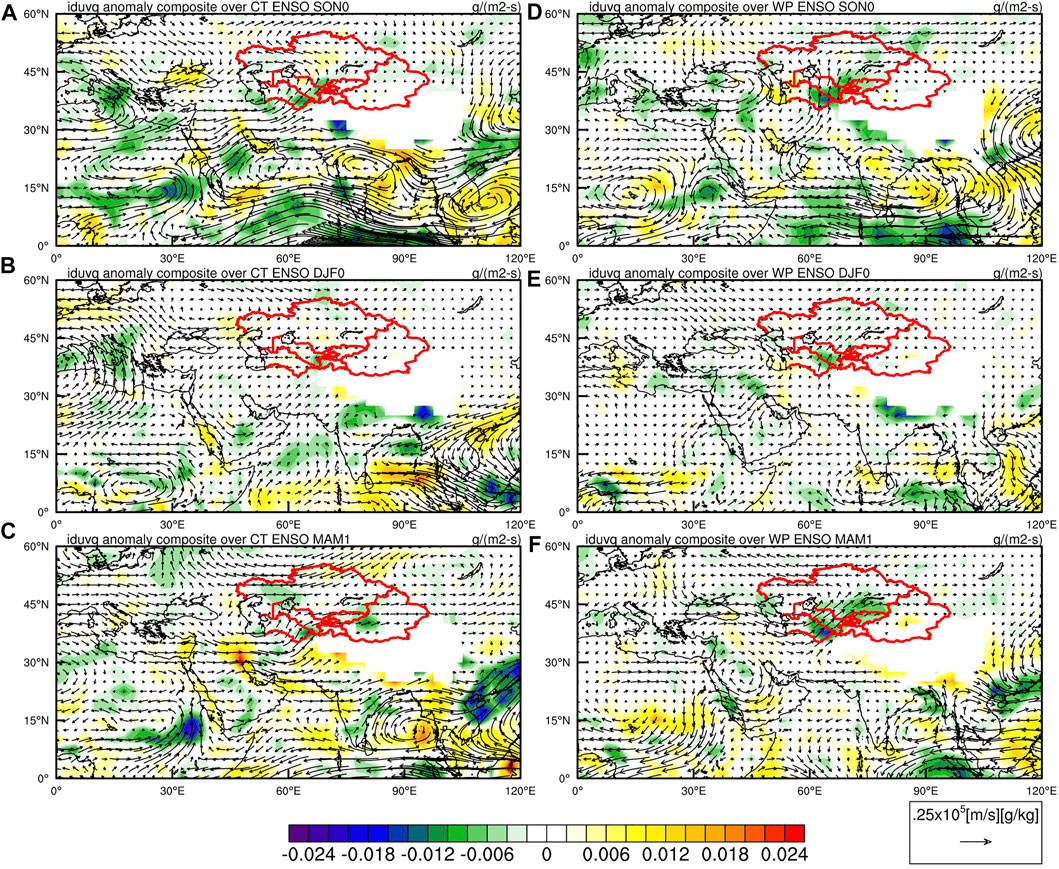
FIGURE 8. Same as in Figure 4, but for vertically integrated water vapor flux (integrated from 1000 hPa to 300 hPa) (vectors) and its divergence (shades).
In the autumn before the CT El Niño peaks, anomalous high pressure dominates most of the low latitudes south of 30°N, and north of this anomalous high pressure there are two weaker low pressure centers located in the eastern Mediterranean and over the Caspian Sea, with a deeper trough near the Mediterranean Sea (Figures 4A, 5A), such that the atmospheric circulation pattern enhances westerly winds (Figures 6A, 7A) and facilitates the transport of water vapor from the Mediterranean and Arabian Sea to the Central Asian region (Figure 8A); while in Central Asia a weak high-pressure anomaly exists in northeastern Central Asia, which cooperates with the low-pressure center over the Caspian Sea (Figures 4A, 5A), resulting in an easterly wind anomaly (Figures 6A, 7A) in central Asia and a convergence of water vapor fluxes in south-central Central Asia (Figure 8A), thus causing precipitation in these regions (Figure 3A).
In the winter when CT El Niño matures, the strength of anomalous high pressure at low latitudes increases significantly, the Mediterranean Sea and North Africa are controlled by anomalous high pressure, a weak low pressure center exists in the Arabian Peninsula, and a significant anomalous high pressure exists over the Tianshan Mountains (Figures 4B, 5B), thus enhancing the northward transport of water vapor from the Indian Ocean (Figures 6B, 7B, 8B); at the same time, the disappearance of anomalous low pressure over the Mediterranean Sea (Figures 4B, 5B) weakens the southwest water vapor flux in Central Asia (Figure 8B), resulting in more scattered precipitation in the northern part of the region (Figure 3B).
In the spring when CT El Niño decays, anomalous high pressure dominates most of the middle and low latitudes south of 40°N, and a narrow anomalous low pressure exists at middle and high latitudes with two centers, one in western Europe and one near Siberia (Figures 4C, 5C), and the above atmospheric circulation pattern also leads to stronger westerly winds (Figures 6C, 7C), thus strengthening the western water vapor path in Central Asia (Figure 8C); Meanwhile, there is anomalous high pressure at high latitudes, whose center is located near the Ural Mountains, and together with the anomalous low pressure at middle and low latitudes (Figures 4C, 5C), it causes significant northeasterly wind anomalies in northern Central Asia (Figures 6C, 7C), which makes water vapor from high latitudes transport to northern Central Asia and strengthens the northern water vapor path in Central Asia (Figure 8C).
For WP El Niño, in the autumn prior to its maturation, most of the low and middle latitudes south of 45°N are controlled by significant anomalous high pressure, and anomalous high pressure exists at high latitudes in western Europe, while a widespread low pressure anomaly exists north of 45°N in northeastern Europe and northern Asia (Figures 4D, 5D), such a circulation pattern enhances northwesterly winds in northern Central Asia (Figures 6D, 7D), allowing water vapor transport from high latitudes to Central Asia (Figure 8D). Unlike CT El Niño, a high-pressure anomaly center exists in eastern Central Asia, and a significant southwesterly wind anomaly exists at the low troposphere (Figures 4D, 5D), enhancing the southwesterly water vapor path in Central Asia, and water vapor fluxes converge in the Tianshan Mountains and the Pamir Plateau (Figure 8D), causing positive precipitation anomalies in these regions (Figure 3D).
During the peaking season of WP El Niño, anomalous low pressure in the higher latitudes of Eurasia further intensified and pushed southward, and anomalous high pressure in the middle and low latitudes also strengthened (Figures 4E, 5E), thus enhancing the southwestern water vapor flux and northern water vapor flux in Central Asia (Figures 6E, 7E, 8E) and bringing stronger precipitation to the aforementioned areas (Figure 3E).
During its decaying season, a significant high pressure anomaly is maintained over most of the low latitudes south of 40°N, and what was originally an anomalous low pressure at high Eurasian latitudes becomes a weak anomalous high pressure, while a low pressure center develops over central Europe at mid-latitudes, and a narrow low pressure trough exists in western Central Asia (Figures 4F, 5F), such a circulation situation enhances water vapor transport from the Mediterranean, which is particularly significant in the troposphere (Figures 6F, 7F). This circulation enhances water vapor transport from the Mediterranean, especially in the middle troposphere, resulting in increased southwest water vapor fluxes in Central Asia (Figure 8F). Unlike CT El Niño, the anomalous low pressure near Siberia is weak at this time, and there is no significant northeasterly wind level in the middle and lower troposphere, so the water vapor flux in the northern part of Central Asia fails at this time (Figure 8F).
Possible Teleconnection
There are bound to be differences in the Walker circulation excited by the different SSTA patterns of the two types of El Niño illustrated in Figure 1, and such differences may have different effects on precipitation in more countries and regions around the world through the transmission of atmospheric bridges. To further analyze how the two types of El Niño affect seasonal precipitation in Central Asia through changes in atmospheric circulation, we first examine the Walker circulation anomaly (Figure 9) excited by the two types of El Niño, and the local meridional circulation anomaly between 45°E-75°E (Figure 10). Figure 9 shows the partial correlations between the anomalous Walker circulation averaged in 5°S-5°N and normalized DJF CT ENSO index (left panel) and WP ENSO index (right panel) from El Niño developing autumn (SON0) to the decaying spring (MAM1). Figure 10 shows the partial correlations between the anomalous Hadley circulation averaged in 45°E-75°E and normalized DJF CT ENSO index (left panel) and WP ENSO index (right panel). In both figures, shadings indicate correlations above the 95 and 90% confidence levels.
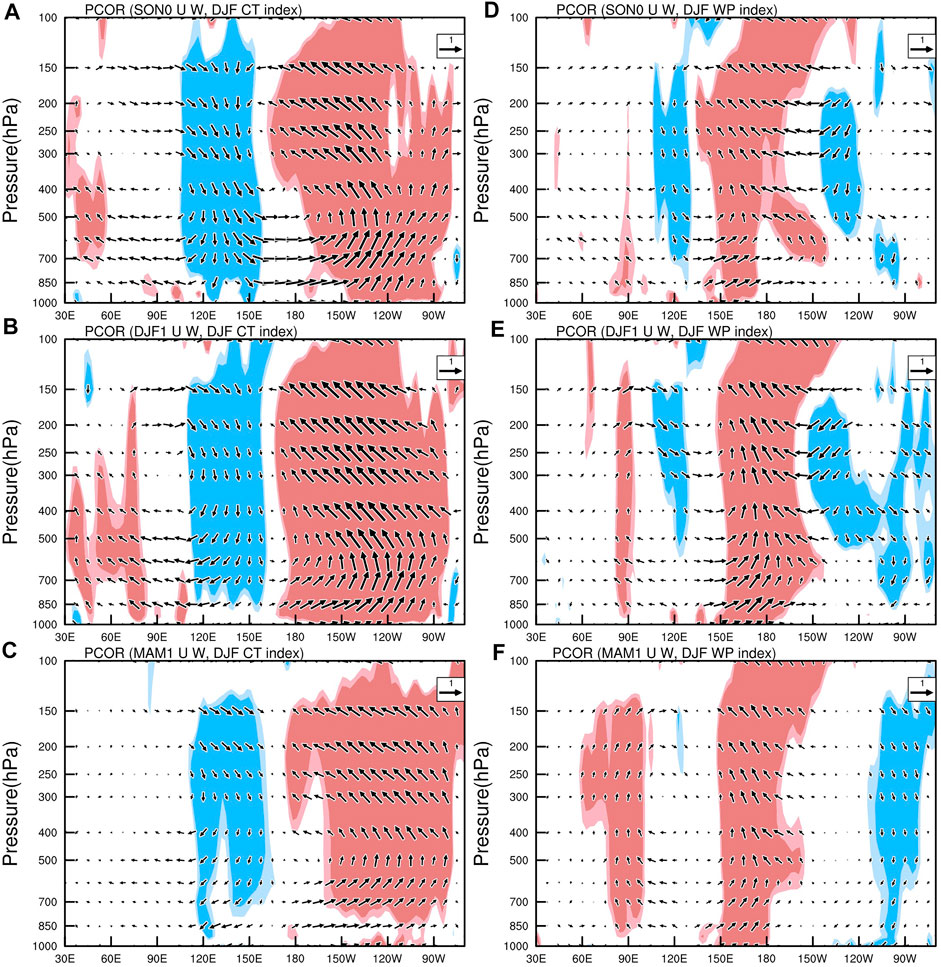
FIGURE 9. Partial correlations (shading) of anomalous Walker circulation averaged over 5°S-5°N with normalized DJF CT ENSO index (A–C) and WP ENSO index (D–F) for SON0, DJF0 and MAM1. Light (Heavy) Shades indicate correlations above the 90% (95%) confidence levels.
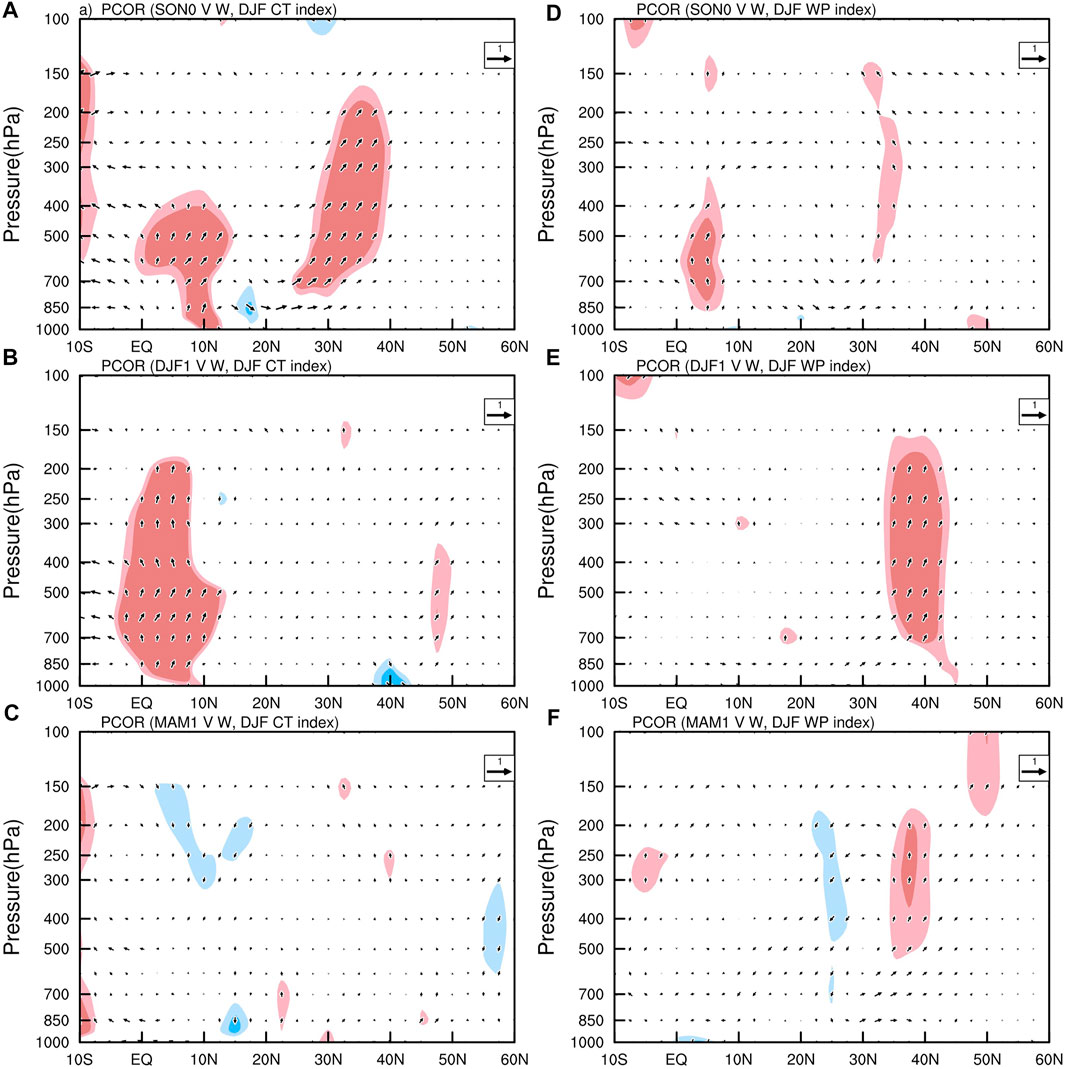
FIGURE 10. Same as Figure 9, but for meridional circulation averaged over 45°E-75°E.
For the CT El Niño, two anomalous cells form over the equatorial Indian-Pacific Ocean in DJF when it peaks (Figure 9B), a strong one over the Pacific and a weak one over the Indian Ocean. The rising branch over the Indian Ocean is weaker in autumn (Figure 9A), strengthens in winter, and disappears in spring when CT El Niño decays (Figure 9C). The anomalous Walker circulation caused by WP El Niño is significantly different from CT El Niño. The most dominant upwelling branch is located in the equatorial central Pacific at 150°E-180°, with two sinking branches on each side of it (Figures 9D,E). In the autumn before the peak of WP El Niño, there is no significant rising motion over the Indian Ocean (Figure 9D), and in the winter when WP El Niño matures, there is a significant rising motion near 90E (Figure 9E), and the extent of the rising branch over the Indian Ocean continues to expand as WP El Niño decays (Figure 9F). To sum up, there are significant differences in the evolution of the upwelling branch over the Indian Ocean during the development of the two types of El Niño.
To examine the possible impact of the Indian Ocean upwelling branch on precipitation in Central Asia during the two El Niño development phases, we next examine the anomalous Hadley circulation averaged over 45°E-75°E (Figure 10). Note that since our results in Section Possible Teleconnection indicate that the two types of El Niño have no significant effect on precipitation in Xinjiang, China, during their lifecycle, here we narrow the meridional range of the region of interest to 45°E-75°E to exclude the blocking effect of the Tibetan Plateau. It can be seen that around 30°N-40°N over Central Asia, there is a clear rising motion in the autumn before the peak of CT El Niño, extending to the top of the troposphere (Figure 10A); during the peaking winter of El Niño, this rising branch moves northward to around 50°N and weakens significantly (Figure 10B); in the spring when El Niño decays, there is no clear rising motion over Central Asia (Figure 10C). For WP El Niño, upward motion is present over Central Asia (30°N-55°N) in the autumn before its peak, in the winter when it matures, and in the spring when it decays (Figures 10D–F). This upward branch is strongest in the winter of El Niño’s maturation and reaches its widest extent and extends to the top of the troposphere (Figure 10E). In spring, this upwelling branch is weaker but still present, which is a significant difference from CT El Niño (Figure 10F). That is, the influence of the Walker circulation anomaly over the Indian Ocean on precipitation anomalies in Central Asia differs during the life cycle of the two types of El Niño, especially in winter and spring. We further examine the 200 hPa velocity potential (VP200) composite over the two types of El Niño (Figure 11). A clear, persistent pattern of upper-level convergence over the Indian Ocean is present throughout the WP El Niño peaking winter and decaying spring. Whereas the positive VP200 anomalies are weak in the winter of CT El Niño peaks and disappear in the following spring.
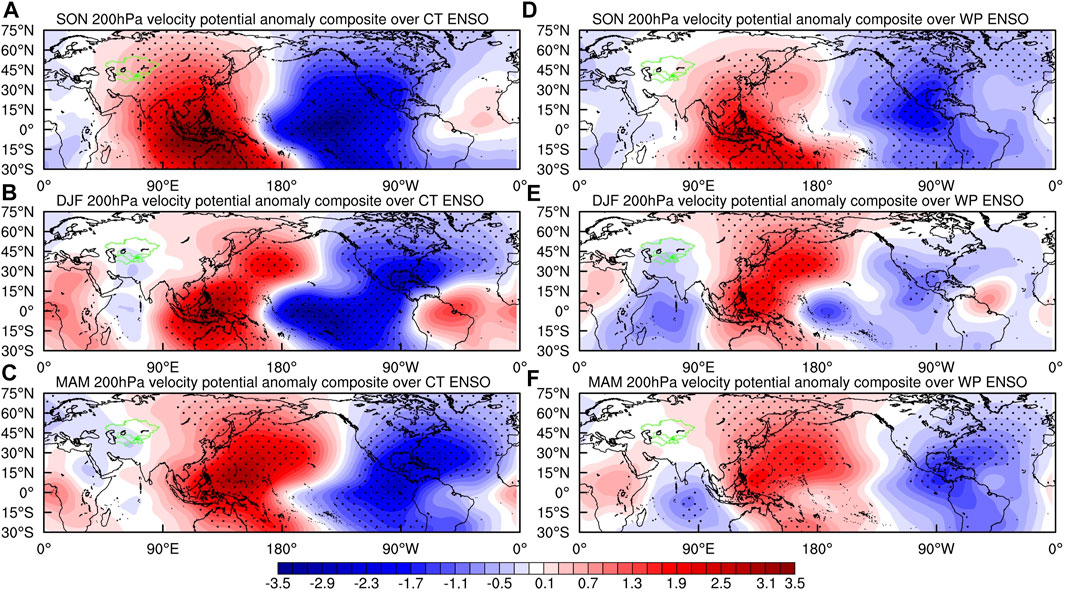
FIGURE 11. Same as Figure 4, but for 200 hPa anomalous velocity potential.
Summary and Discussion
In this study, we examine the different seasonal precipitation anomaly patterns in Central Asia associated with the CT El Niño and WP El Niño from the El Niño developing SON to the decaying MAM based on GPCC monthly precipitation data version 2018 and discover that there are distinguished differences between the effects of the two types of El Niño on precipitation in Central Asia in terms of intensity, spatially and temporally. We then discuss two types of El Niño-induced atmospheric circulation anomalies and water vapor flux anomalies in Central Asia and compare the effects of the rising branch of the Indian Ocean on precipitation in Central Asia in different Walker circulation anomalies patterns. The conclusion are as follows:
Overall, El Niño are associated with more precipitations over Central Asia in SON, DJF and MAM which is consistent with the findings of Chen et al. (2018), but significant discrepancies can be found in the precipitation anomaly spatial patterns associated with the two types of El Niño from the El Niño developing autumn to the decaying spring. The strength of the positive precipitation anomaly associated with WP El Niño is significantly stronger than that of CT El Niño. The precipitation associated with CT El Niño is mostly concentrated in the plains and hilly areas of Central Asia and is more dispersed in space. With the development and extinction of CT El Niño, the positive anomaly regions of precipitation in Central Asia have a tendency to move northwestward, but the spatial pattern of precipitation anomalies lacks consistency from SON(0) to MAM(1). Whereas the precipitation associated with WP El Niño is mostly concentrated along Pamirs and Tian Shan Mountains with consistency throughout the autumn before El Niño peaks to the spring when El Niño decays. Note that, among the three seasons studied, its influence on precipitation in Central Asia is most widespread and strongest in the spring when WP El Niño decays. What we found in this study echoes the previous findings based on a synoptic diagnose for summertime extreme precipitation in Northwest China (e.g., Huang W. et al., 2017; Ning et al., 2021).
Previous studies have indicated that the southwesterly water vapor fluxes from the Arabic Sea and Africa are the source of Central Asia precipitation during El Nino and the north water vapor fluxes from Russia are only detected in MAM which account for the maximum precipitation of Central Asia in this season (Mariotti, 2007; Hu et al., 2017; Chen et al., 2018). We further found that the southwestern water vapor fluxes from the Indian Ocean are significantly greater during the maturing winter of WP El Niño than during the winter of CT El Niño, and this contribution persists from winter to the following spring and is enhanced in spring. In addition, the effect of northern water vapor fluxes on precipitation in Central Asia is mainly found in the spring when CT El Niño begins to decay, which is not evident in the WP El Niño event.
The analysis of anomalous atmospheric circulation caused by two types of El Niño shows that the interconfiguration of anomalous high pressure in the south side of Central Asia at low and middle latitudes and anomalous low pressure and anomalous high pressure in the high latitudes of Eurasia affects the southwest water vapor flux and north side water vapor flux in Central Asia, thus causing different effects of different types of El Niño on precipitation in Central Asia at different stages. The spatial consistency of the WP El Niño effect on precipitation in Central Asia over three seasons may be related to the rising branch of the anomalous Walker circulation over the Indian Ocean induced by it.
Data Availability Statement
The original contributions presented in the study are included in the article/Supplementary Material, further inquiries can be directed to the corresponding author.
Author Contributions
YZ and AH contributed to the development and planning of the study. FF performed the data analysis and wrote the manuscript. YL and XZ assisted with data pre-processing and figure enhancement. All authors contributed to the article and approved the submitted version.
Funding
This work was jointly supported by the Sichuan Science and Technology Program (Grant No. 2020JDJQ0050), National Natural Science Foundation of China (Grant No. U1903113, 41875102, 41805054, 41905037), and the Scientific Research Foundation of Chengdu University of Information Technology (Grant No. KYTZ201736).
Conflict of Interest
The authors declare that the research was conducted in the absence of any commercial or financial relationships that could be construed as a potential conflict of interest.
Publisher’s Note
All claims expressed in this article are solely those of the authors and do not necessarily represent those of their affiliated organizations, or those of the publisher, the editors and the reviewers. Any product that may be evaluated in this article, or claim that may be made by its manufacturer, is not guaranteed or endorsed by the publisher.
References
Ashok, K., Behera, S. K., Rao, S. A., Weng, H., and Yamagata, T. (2007). El Niño Modoki and its Possible Teleconnection. J. Geophys. Res. Oceans. 112 (C11), C11007. doi:10.1029/2006jc003798
Becker, A., Finger, P., Meyer-Christoffer, A., Rudolf, B., Schamm, K., Schneider, U., et al. (2013). A Description of the Global Land-Surface Precipitation Data Products of the Global Precipitation Climatology Centre with Sample Applications Including Centennial (Trend) Analysis from 1901-present. Earth Syst. Sci. Data. 5 (1), 71–99. doi:10.5194/essd-5-71-2013
Behera, S. K., and Yamagata, T. (2003). Influence of the Indian Ocean Dipole on the Southern Oscillation. J. Meteorol. Soc. Jpn. 81 (1), 169–177. doi:10.2151/jmsj.81.169
Chen, F., Huang, W., Jin, L., Chen, J., and Wang, J. (2011). Spatiotemporal Precipitation Variations in the Arid Central Asia in the Context of Global Warming. Sci. China Earth Sci. 54 (12), 1812–1821. doi:10.1007/s11430-011-4333-8
Chen, G., and Tam, C. Y. (2010). Different Impacts of Two Kinds of Pacific Ocean Warming on Tropical Cyclone Frequency over the Western North Pacific. Geophys. Res. Lett. 37 (1), L01803. doi:10.1029/2009gl041708
Chen, X., Wang, S., Hu, Z., Zhou, Q., and Hu, Q. (2018). Spatiotemporal Characteristics of Seasonal Precipitation and Their Relationships with ENSO in Central Asia during 1901-2013. J. Geogr. Sci. 28 (9), 1341–1368. doi:10.1007/s11442-018-1529-2
Feng, J., and Li, J. (2011). Influence of El Niño Modoki on spring Rainfall over south China[J]. J. Geophys. Res. Atmospheres. 116 (D13), D13102. doi:10.1029/2010jd015160
Feng, J., Chen, W., Tam, C.-Y., and Zhou, W. (2011). Different Impacts of El Niño and El Niño Modoki on China Rainfall in the Decaying Phases. Int. J. Climatol. 31 (14), 2091–2101. doi:10.1002/joc.2217
Gao, T., Luo, M., and Lau, N. C. (2020). Spatially Distinct Effects of Two El Niño Types on Summer Heat Extremes in China[J]. Geophys. Res. Lett. 47 (6), e2020GL086982. doi:10.1029/2020gl086982
Gu, G., and Adler, R. F. (2015). Spatial Patterns of Global Precipitation Change and Variability during 1901–2010[J]. J. Clim. 28 (11), 44. doi:10.1175/jcli-d-14-00201.1
Hu, Z., Zhou, Q., Chen, X., Qian, C., Wang, S., and Li, J. (2017). Variations and Changes of Annual Precipitation in Central Asia over the Last century. Int. J. Climatol. 37, 157–170. doi:10.1002/joc.4988
Huang, J., Ji, M., Xie, Y., Kao, H.-Y., and Yu, J.-Y. (2016). Global Semi-arid Climate Change over Last 60 years[J]. Clim. DynamicsJournal Clim. 4622 (3-43), 1131615–1150632. doi:10.1007/s00382-015-2636-8
Huang, J., Yu, H., Dai, A., Wei, Y., and Kang, L. (2017). Drylands Face Potential Threat under 2 °C Global Warming Target. Nat. Clim Change. 7 (6), 417–422. doi:10.1038/nclimate3275
Huang, W., Chang, S.-Q., Xie, C.-L., and Zhang, Z.-P. (2017). Moisture Sources of Extreme Summer Precipitation Events in North Xinjiang and Their Relationship with Atmospheric Circulation. Adv. Clim. Change Res. 8 (1), 12–17. doi:10.1016/j.accre.2017.02.001
IPCC (2013). Climate Change 2013: The Physical Science Basis: Working Group I Contribution to the Fifth Assessment Report of the Intergovernmental Panel on Climate Change. [Stocker, T.F., D. Qin, G.-K. Plattner, M. Tignor, S.K. Allen, J. Boschung, A. Nauels, Y. Xia, V. Bex and P.M. Midgley (eds.)]. Cambridge University Press, Cambridge, United Kingdom and New York, NY, USA, 1535 pp.
Jiang, J., Zhou, T., Chen, X., and Zhang, L. (2020). Future Changes in Precipitation over Central Asia Based on CMIP6 Projections. Environ. Res. Lett. 15 (5), 054009. doi:10.1088/1748-9326/ab7d03
Kalnay, E., Kanamitsu, M., Kistler, R., Collins, W., Deaven, D., Gandin, L., et al. (1996). The NCEP/NCAR 40-Year Reanalysis Project. Bull. Amer. Meteorol. Soc. 77 (3), 437–471. doi:10.1175/1520-0477(1996)077<0437:tnyrp>2.0.co;2
Kim, H.-M., Webster, P. J., and Curry, J. A. (2009). Impact of Shifting Patterns of Pacific Ocean Warming on North Atlantic Tropical Cyclones. Science. 325 (5936), 77–80. doi:10.1126/science.1174062
Kug, J.-S., Jin, F.-F., and An, S.-I. (2009). Two Types of El Niño Events: Cold Tongue El Niño and Warm Pool El Niño. J. Clim. 22 (6), 1499–1515. doi:10.1175/2008jcli2624.1
Larkin, N. K., and Harrison, D. (2005). Global Seasonal Temperature and Precipitation Anomalies during El Niño Autumn and winter. Geophys. Res. Lett. 32 (16), L16705. doi:10.1029/2005gl022860
Luo, M., and Lau, N.-C. (2020). Summer Heat Extremes in Northern Continents Linked to Developing ENSO Events. Environ. Res. Lett. 15 (7), 074042. doi:10.1088/1748-9326/ab7d07
Mariotti, A. (2007). How ENSO Impacts Precipitation in Southwest central Asia[J]. Geophys. Res. Lett. 34 (16), L16706. doi:10.1029/2007gl030078
Ning, G., Luo, M., and Zhang, Q. (2021). Understanding the Mechanisms of Summer Extreme Precipitation Events in Xinjiang of Arid Northwest China[J]. J. Geophys. Res. Atmospheres. 126 (15), e2020JD034111. doi:10.1029/2020jd034111
Ning, L., and Bradley, R. S. (2015). Influence of Eastern Pacific and central Pacific El Niño Events on winter Climate Extremes over the Eastern and central United States. Int. J. Climatol. 35 (15), 4756–4770. doi:10.1002/joc.4321
Peng, D., Zhou, T., and Zhang, L. (2020a). Moisture Sources Associated with Precipitation during Dry and Wet Seasons over Central Asia. J. Clim. 33 (24), 10755–10771. doi:10.1175/jcli-d-20-0029.1
Peng, D., Zhou, T., and Zhang, L. (2020b). Observationally Constrained Projection of the Reduced Intensification of Extreme Climate Events in Central Asia from 0.5° C Less Global Warming[J]. Clim. Dyn. 54 (1), 543–560. doi:10.1007/s00382-019-05014-6
Qin, W., and Shuang-lin, L. (2020). Different Summer Rainfall Anomaly Patterns in Northeast China Associated with Two Kinds of El NiɁo Events. J. Trop. Meteorol. 26 (2).
Rayner, N. A. A., Parker, D. E., and Horton, E. B. (2003). Global Analyses of Sea Surface Temperature, Sea Ice, and Night marine Air Temperature since the Late Nineteenth Century[J]. J. Geophys. Res. Atmospheres. 108 (D14), 4407. doi:10.1029/2002jd002670
Sankar-Rao, M., Lau, K. M., and Yang, S. (1996). On the Relationship between Eurasian Snow Cover and the Asian Summer Monsoon[J]. Int. J. Climatology: A J. R. Meteorol. Soc. 16 (6), 605–616. doi:10.1002/(SICI)1097-0088(199606)
Schneider, U., Becker, A., and Finger, P. (2018). GPCC Full Data Monthly Product Version 2018 at 0.5°: Monthly Land-Surface Precipitation from Rain-Gauges Built on GTS-Based and Historical Data[J]. Glob. Precipitation Climatology Centre.. doi:10.5676/DWD_GPCC/FD_M_V2018_050
Schneider, U., Becker, A., and Finger, P. (2014). GPCC's New Land Surface Precipitation Climatology Based on Quality-Controlled In Situ Data and its Role in Quantifying the Global Water Cycle[J]. Theor. Appl. Climatology. 115 (1), 15–40. doi:10.1007/s00704-013-0860-x
Taschetto, A. S., and England, M. H. (2009). El Niño Modoki Impacts on Australian Rainfall. J. Clim. 22 (11), 3167–3174. doi:10.1175/2008jcli2589.1
Trenberth, K. E., and Stepaniak, D. P. (2001). Indices of El Niño Evolution. J. Clim. 14 (8), 1697–1701. doi:10.1175/1520-0442(2001)014<1697:lioeno>2.0.co;2
Wan, H., Zhang, X., Zwiers, F. W., and Shiogama, H. (2013). Effect of Data Coverage on the Estimation of Mean and Variability of Precipitation at Global and Regional Scales. J. Geophys. Res. Atmos. 118 (2), 534–546. doi:10.1002/jgrd.50118
Wang, B., Luo, X., and Sun, W. (2020). El Niño Diversity across Boreal spring Predictability Barrier[J]. Geophys. Res. Lett. 47 (13), e2020GL087354. doi:10.1029/2020gl087354
Wang, B., Luo, X., Yang, Y.-M., Sun, W., Cane, M. A., Cai, W., et al. (2019). Historical Change of El Niño Properties Sheds Light on Future Changes of Extreme El Niño. Proc. Natl. Acad. Sci. USA. 116 (45), 22512–22517. doi:10.1073/pnas.1911130116
Wang, G., and Hendon, H. H. (2007). Sensitivity of Australian Rainfall to Inter-el Niño Variations. J. Clim. 20 (16), 4211–4226. doi:10.1175/jcli4228.1
Weng, H., Wu, G., and Liu, Y. (2011). Anomalous Summer Climate in China Influenced by the Tropical Indo-Pacific Oceans[J]. Clim. Dyn. 36 (3-4), 769–782. doi:10.1007/s00382-009-0658-9
Weng, H., Ashok, K., Behera, S. K., Rao, S. A., and Yamagata, T. (2007). Impacts of Recent El Niño Modoki on Dry/wet Conditions in the Pacific Rim during Boreal Summer. Clim. Dyn. 29 (2), 113–129. doi:10.1007/s00382-007-0234-0
Weng, H., Behera, S. K., and Yamagata, T. (2009). Anomalous winter Climate Conditions in the Pacific Rim during Recent El Niño Modoki and El Niño Events. Clim. Dyn. 32 (5), 663–674. doi:10.1007/s00382-008-0394-6
Yeh, S.-W., Kug, J.-S., Dewitte, B., Kwon, M.-H., Kirtman, B. P., and Jin, F.-F. (2009). El Niño in a Changing Climate. Nature. 461 (7263), 511–514. doi:10.1038/nature08316
Yuan, Y., and Yang, S. (2012). Impacts of Different Types of El Niño on the East Asian Climate: Focus on ENSO Cycles. J. Clim. 25 (21), 7702–7722. doi:10.1175/jcli-d-11-00576.1
Keywords: Central Asia, semi-arid to arid area, seasonal precipitation, two types of El Niño, partial correlation
Citation: Feng F, Zhao Y, Huang A, Li Y and Zhou X (2022) Different Seasonal Precipitation Anomaly Patterns in Central Asia Associated With Two Types of El Niño During 1891–2016. Front. Earth Sci. 10:771362. doi: 10.3389/feart.2022.771362
Received: 06 September 2021; Accepted: 03 February 2022;
Published: 25 February 2022.
Edited by:
Shangfeng Chen, Institute of Atmospheric Physics (CAS), ChinaReviewed by:
Ming Luo, Sun Yat-sen University, ChinaJiepeng Chen, South China Sea Institute of Oceanology (CAS), China
Copyright © 2022 Feng, Zhao, Huang, Li and Zhou. This is an open-access article distributed under the terms of the Creative Commons Attribution License (CC BY). The use, distribution or reproduction in other forums is permitted, provided the original author(s) and the copyright owner(s) are credited and that the original publication in this journal is cited, in accordance with accepted academic practice. No use, distribution or reproduction is permitted which does not comply with these terms.
*Correspondence: Fan Feng, ZmVuZ2ZhbkBjdWl0LmVkdS5jbg==
 Fan Feng
 Yong Zhao
 Anning Huang
 Yang Li
 Xin Zhou