 Adam Mitton*
 Diana Allen
- Department of Earth Sciences, Simon Fraser University, Burnaby, BC, Canada
Periods of streamflow cessation and stream drying are increasing in frequency and intensity in many regions of the world due to climate change, land-use change, and increased groundwater pumping. Thus, streams with intermittent flow will likely continue to grow in their global extent, which is thought to already surpass that of perennial streams. Yet, variability in streamflow and aquifer-stream exchange associated with flow cessation and drying is not well understood, nor is the influence of hydrological variability on aquatic communities and their habitat. This study aimed to characterize the heterogeneity of physical and chemical characteristics of habitat and the associated variability in benthic macroinvertebrate (BMI) communities in relation to spatial and temporal variability in streamflow and aquifer-stream exchange. Habitat conditions and BMI communities varied between individual sites, riffle and pool habitat, and between an intermittent riffle and a perennial riffle maintained by groundwater discharge. Unlike other studies, BMI richness, diversity, and abundance were consistently higher at intermittent riffle sites than perennial riffle sites, which were similar in BMI community composition to pool sites. High velocity distinguished the intermittent riffle sites, while two flow-loving BMI taxa distinguished their communities. This suggests that site-specific heterogeneity in habitat conditions was a key control on spatial and temporal variability in BMI communities due to the habitat preferences of certain BMI taxa. Low richness, diversity, and high dominance of highly tolerant taxa across the site suggested long-term patterns of extreme variability in habitat conditions associated with flow cessation and drying were the primary control on BMI communities. Thus, the interactive effects of these controls may produce unexpected patterns in BMI community richness, diversity, and composition in relation to longitudinal patterns of groundwater discharge and flow persistence. These findings demonstrate the importance of considering the influence of heterogeneity in environmental conditions at multiple spatial and temporal scales when interpreting relationships between hydrological and abiotic or biotic ecological variable in streams with intermittent flow.
1 Introduction
Hydrological variability is a main control on instream habitat conditions and communities of stream biota (Poff et al., 1997). Therefore, characterization of physical and chemical attributes of distinct habitats and associated dynamics of biotic communities over a range of flows helps us estimate potential ecological consequences of natural and modified hydrological variability (Poff and Ward 1990). Flow cessation and drying are key aspects of hydrological variability for a large portion of streams on most continents (Larned et al., 2010; Datry et al., 2014). As they occur in a variety of different climates and landscapes, streams that experience flow cessation and drying at some point along their course are highly diverse but can be referred to generally as intermittent rivers and ephemeral streams (Datry et al., 2017; Stubbington et al., 2018; Borg Galea et al., 2019; Gómez-Gener et al., 2021). In many regions, IRES are growing in extent and are expected to become increasingly common due to climate change, land-use change, and rising groundwater demands (Larned et al., 2010; Datry et al., 2014; de Graaf et al., 2019). However, much of our current understanding of how habitat conditions and biotic communities vary with flow conditions is founded on studies in perennial streams (Larned et al., 2010; Buttle et al., 2012; Datry et al., 2014; Gómez-Gener et al., 2021).
Fundamental differences in habitat heterogeneity and biotic communities between perennial streams and IRES can be linked to their unique and complex dynamics of connectivity (Buttle et al., 2012; Datry et al., 2014; Gómez-Gener et al., 2021). While some portion of flow in perennial streams is typically maintained by groundwater input year-round, aquifer-stream exchanges in IRES are typically highly spatially and temporally dynamic (Woessner 2020; Gómez-Gener et al., 2021). Often, IRES are assumed to be gaining groundwater during flowing phases and losing to the groundwater system as streamflow declines and sections begin to dry (Rau et al., 2017; Woessner 2020). Yet, IRES may still be gaining even when a network of stagnant pools is all that remains (Bourke et al., 2020); Gómez-Gener et al., 2021). However, connections between pools through the hyporheic zone and vertical connections between pools and the groundwater system can become severed with progressive drying (Boulton 2003; Lake 2003). Variations in connectivity that mark changes in the flow system are often met with shifts in instream habitat conditions (Boulton 2003; Lake 2003).
Flow cessation and drying are typically associated with extreme changes in habitat conditions as flow declines and habitats shrink and become disconnected (Boulton 2003; Lake 2003). For example, stream temperature may increase with streamflow decline, and extreme temperature events may become more frequent (Sinokrot and Gulliver 2000; Poole and Berman 2001; Caissie 2006; Rosenfeld 2017). Dissolved oxygen (DO) may decline rapidly prior to flow cessation due to interactive effects of rising temperature and decreasing flow (Rosenfeld 2017). Rates and magnitudes of changes in habitat conditions can vary between habitat types (e.g., riffles and pools), or at other spatial scales (Boulton 2003; Bonada et al., 2006). For example, decline in water depth and loss of wetted habitat area is often more rapid in riffles, which are shallow stream segments with turbulent flow during flowing phases (Bonada et al., 2006; Rolls et al., 2012; Rosenfeld 2017). Deep stream segments with slower laminar flow, known as pools, typically persist longer, resulting in a patchwork of stagnant pools between dry riffles (Lake, 2003; Bonada et al., 2006). Although they may persist longer, isolated pools can experience rapid temperature increases, decreased DO, and nutrient loading (Lake, 2003; Datry et al., 2017). Ultimately, specific changes in habitat conditions faced by aquatic organisms will depend on the location and type of habitat they occupy.
Benthic macroinvertebrates (BMIs) are ubiquitous in streams and play critical roles in ecosystem functioning. Therefore, understanding the dynamics of BMI communities associated with streamflow decline, flow cessation, and drying, is crucial to our understanding of IRES ecosystems. Responses of BMI taxa depend on their adaptations and the nature of how conditions change in the habitats they occupy or may access (Poff et al., 1997; Lytle and Poff 2004; Bonada et al., 2006). For example, taxa with strong flow requirements that typically reside in riffles may be eliminated as streamflow declines, potentially leading to lower richness, abundance, and diversity in riffles (Lytle and Poff 2004; Stubbington et al., 2009). Conversely, taxa may avoid adverse changes in habitat conditions by seeking refuges, such as isolated pools, or upstream or downstream perennial reaches (Stubbington et al., 2009; Chester and Robson 2011; Vander Vorste et al., 2016; Doretto et al., 2018). Because one or more traits are required to persist in IRES, it is often assumed that diversity and richness will be greater in perennial reaches or streams, and diversity and richness will decline throughout flow cessation and drying (Poff and Ward 1989; Clarke et al., 2010; Datry et al., 2014). However, greater habitat heterogeneity in IRES may promote higher richness relative to perennial sites (Dieterich and Anderson, 2000), and changes in diversity in richness can be influenced by the initial composition of BMI communities (Clarke et al., 2010; Datry et al., 2014; Storey 2016; Doretto et al., 2018). Therefore, when interpreting BMI community responses in IRES, it is important to account for spatial and temporal variability in habitat conditions and how the BMI community has been shaped by recurring periods of flow cessation and drying over time.
Previous studies in IRES have explored differences in BMI communities between intermittent and perennial riffles and pools, and various refuge habitats in intermittent streams (Boulton 2003; Bonada et al., 2006; Clarke et al., 2010; Chester and Robson 2011; Burk and Kennedy 2013; Storey 2016; Doretto et al., 2018; White et al., 2018). However, few have examined potential influences of heterogeneity in instream habitat conditions (Bonada et al., 2006) or aquifer-stream exchanges (Burk and Kennedy 2013). The purpose of this study was to characterize spatial and temporal variability of physical and chemical habitat characteristics and associated dynamics of BMI communities throughout streamflow decline and flow cessation. Aquifer-stream exchange dynamics were monitored to determine whether groundwater played a role in maintaining instream habitat conditions and BMI communities and whether that role changed over time. A better understanding of how variability in both surface and subsurface flow influences instream habitat and BMI communities is needed to promote long-term ecological integrity in IRES through research and management practices (Datry et al., 2017).
2 Methods and Materials
2.1 Description of Study Site
2.1.1 Location
The field study was conducted in Bertrand Creek at Otter Park in the Township of Langley, which is situated in the Lower Fraser Valley of British Columbia (BC). The Bertrand Creek Watershed encompasses an area of 110 km2, extending from its headwaters near Aldergrove, BC to its confluence with the Nooksack River in Washington, United States (Figure 1). The land within the watershed is characterized by rolling hills and low relief topography (Clague et al., 1983). Bertrand Creek is an unregulated low (second) order stream. Reflective of the lowland setting, it is a low gradient stream with many slow-moving segments.
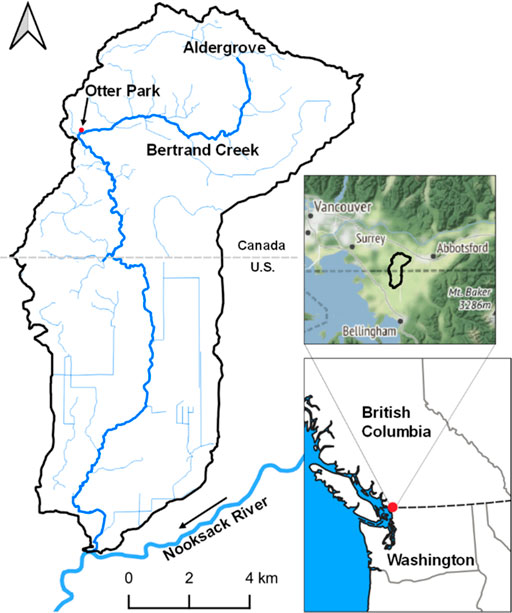
FIGURE 1. Bertrand Creek Watershed boundary and the location of Otter Park in the lower Fraser Valley of British Columbia, Canada. Figure courtesy of Alex Nott (MSc Student, Earth Sciences).
2.1.2 Climate
The regional climate of the Lower Fraser Valley is temperate with dry summers (Peel et al., 2007). Based on climate normals for the Environment and Climate Change Canada (ECCC) station at the Abbotsford International Airport (Climate ID: 1100030), located 13 km from the field site, over 400 mm of precipitation (mostly rain) falls during the winter months (December to February), while summers (June to August) see just over 150 mm. July and August are the driest and hottest months, each with just over 40 mm of precipitation and average daily air temperatures topping just over 18°C. September typically has more precipitation, but the first half of the month is often as dry as August.
2.1.3 Otter Park Field Site
The Otter Park field site is located in the upper reaches of Bertrand Creek where the orientation of the stream channel changes sharply from east-west to north-south just downstream of the park (Figure 1). The reach is approximately 215 m in length. Two segments of the reach are the focus of this study: one upstream segment that is roughly 80 m in length and one downstream segment that is roughly 40 m in length. Like other reaches in the watershed, Otter Park is characterized by wide, deep, slow-moving pool segments alternating with shallow, narrow riffles. Otter Park is a unique reach of Bertrand Creek because flow has ceased there regularly during periods of minimal precipitation in the summer, despite flow persisting in other upstream and downstream segments. Avery-Gomm (2013) reported that flow had ceased regularly at Otter Park prior to 2010, and presumably since. Flow cessation and drying were also documented in 2018 during a previous field study at Otter Park (Allen et al., 2020). Although most of the channel dried in 2018, some isolated pools remained (Figure 2). The regular (almost seasonal) occurrence of flow cessation and associated changes in instream conditions documented in previous studies suggest Otter Park is an intermittent reach, but Bertrand Creek is a spatially intermittent stream, with perennial flow dominating most of its extent.
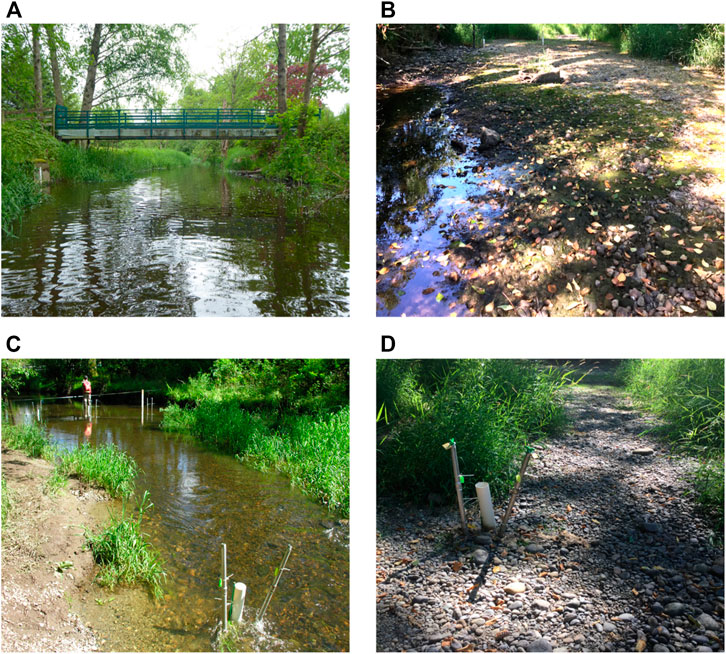
FIGURE 2. (A) Pool habitat in the upstream segment of the Otter Park reach in May 2018 and (B) August 2018. (C) Riffle habitat in the upstream segment of the Otter Park reach in May 2018 and (D) August 2018.
Streamflow conditions in Bertrand Creek have been a concern over the last 2 decades due to potential impacts on ecological health (Avery-Gomm et al., 2014; Fisheries and Oceans Canada 2019a) Specifically, low flows, flow cessation, and drying are threats to the recovery of Nooksack Dace (Rhinichthys cataractae ssp; Avery-Gomm et al., 2014; Fisheries and Oceans Canada 2019a) and Salish sucker (Catostomus sp.; Fisheries and Oceans Canada 2019b), both of which are endangered fish. The focal reach at Otter Park is considered critical habitat for the Nooksack Dace because it contains greater than 10% riffle habitat by length (Fisheries and Oceans Canada 2019a). Deteriorating water quality in response to summer flow decline is also a concern for fish species in Bertrand Creek (Fisheries and Oceans Canada 2019a; Fisheries and Oceans Canada 2019b). Lack of precipitation during the summer is thought to be a key driver of low flows and flow cessation in Bertrand Creek (Avery-Gomm et al., 2014); however, groundwater abstraction may also play a role (Fisheries and Oceans Canada 2019a).
In the Bertrand Creek Watershed, groundwater is primarily relied on for domestic and agricultural water uses (Solano 2006; Allen et al., 2020). In the vicinity of Otter Park, land is mostly occupied by hobby farms and some larger agricultural operations. Groundwater pumping in wells near Bertrand Creek in the vicinity of Otter Park could cause streamflow depletion because the primary unconfined aquifer at the site, The Abbotsford-Sumas Aquifer, is classified as having a high likelihood of hydraulic connection to the stream. A 72-h pumping test conducted at Otter Park by Allen et al. (2020) resulted in streamflow depletion of approximately 1,510 m3/s. Therefore, groundwater abstraction, in addition to surface water abstraction, may influence the timing, duration, frequency, and predictability of flow cessation at Otter Park. Unfortunately, a lack of information on historical and present-day water withdrawals prevents the determination of what degree of flow cessation is caused by natural versus anthropogenic factors.
2.2 Hydrological Monitoring Network
A hydrological monitoring network was installed at Otter Park to monitor groundwater level, streamflow, and vertical flux across the streambed (Figure 3). The network includes one pumping well (PW01) and three groundwater monitoring wells (MW01, MW02, and MW03) drilled into the surficial aquifer adjacent to the site. Only MW02 was monitored in this study. It is screened in very coarse sand from 16.8–18.3 m depth. Two hydrometric stations were installed in 2019: HS2 was installed in a pool habitat in the intermittent upstream segment of the site and HS5 was installed in a downstream perennial riffle.
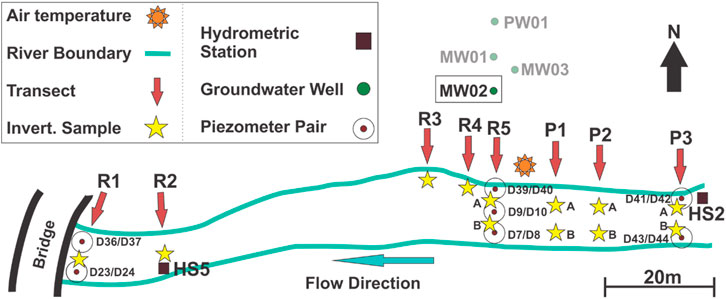
FIGURE 3. Hydrological monitoring network at the Otter Park field site showing the configuration and locations of macroinvertebrate and habitat sampling sites. The macroinvertebrate sampling sites (yellow stars) are numbered the same as the flow transects (red arrows). Where there are two macroinvertebrate sampling sites along a flow transect, the north location is A and the south location is B. Stream width is representative of wetted width in June.
The hydrometric stations are maintained by the BC Ministry of Forests, Lands, Natural Resource Operations and Rural Development (FLNRORD). Discharge measurements were made by FLNRORD staff following standard procedures (see Resources Information Standards Committee, 2018) to develop station-specific rating curves to calculate streamflow from the continuous stage data. Rating curve development was done using AQUARIUS software by FLNRORD staff. Seven nested instream piezometer pairs (i.e., one deep and one shallow) were installed, with the deeper piezometers (denoted by lower numbers in Figure 3) screened at depths of around 1.05 m and the shallow piezometers (denoted by higher numbers in Figure 3) screened at depths of around 0.4 m to create a separation of around 0.65 m for each pair. Piezometer D37 was knocked down during winter high flows, so D36/D37 data are omitted from this study. Solinst Leveloggers were deployed in each of the instream piezometers, and Onset HOBO loggers were installed in the groundwater wells and hydrometric stations to log water levels and temperatures continuously. Loggers were hung from trees to measure barometric pressure. All instruments were set to record data continuously from 1 May 2020 to 16 October 2020 at 15-min intervals with some short interruptions due to data downloads.
2.3 Macroinvertebrate Sampling
BMI sampling was carried out to examine spatial and temporal variability in BMI communities as flows declined over the summer. BMI samples were collected at 12 sites within the Otter Park study reach (Figure 3). Six sites were assigned to riffle habitat (R1-R5) and six to pool habitat (P1-P3) to ensure an equal number of locations in each habitat type. In the upstream area where the wetted width was greater, two BMI samples were collected along each transect; the sample location to the north is denoted with an A, while the south location is denoted with a B (Figure 3). The six sites within each habitat type were evenly distributed among locations with relatively high streambed elevation and relatively low streambed elevation in case water preferentially pooled in low elevation sections as flow declined. The upstream pool habitat unit, extending from P3 downstream to P1, had lower streambed elevations than the upstream riffle habitat unit, which extended from R5 downstream to R3 (Figure 3). The downstream riffle habitat unit, extending from R2 downstream to R1 had lower streambed elevations than both upstream habitats units (Supplementary Figure 1).
BMI samples were collected at each site once per month from June to September in 2020 (June 11, July 14, August 10, and September 17). The sampling events were timed to occur roughly 30 days apart to allow for macroinvertebrates to recolonize substrates disturbed during each sampling event. Each visit began at site R3 and progressed upstream to not disturb other sites during sampling. The two furthest downstream sites, R1 and R2, were sampled last because the channel length and complex channel features between R2 and R3 likely prevented disturbance from upstream activity.
For each BMI sample, the 30.5 × 30.5 cm frame of a 500 µm mesh Surber sampler was centered next to the site marker and the substrate within the frame was disturbed by hand vigorously for 2 minutes to dislodge macroinvertebrates into the net on the downstream end. After 2 minutes, the net was removed, and its contents were placed in sample containers and preserved with isopropyl alcohol. In September, flow was too low in pools to direct dislodged macroinvertebrates into the net, so the substrates were scooped by hand into the net. Various techniques may be used to sample stagnant pools (e.g., Bonada et al., 2006; Chester and Robson 2011), but modifying the Surber procedure allowed for consistency in sample area, substrate disturbance mechanism (hand), and the steps involved in removing specimens from the net. Macroinvertebrate specimens were stored and identified within 2 weeks after their collection to the family level using a taxonomic key (Bouchard, 2004).
2.4 Habitat Monitoring
Habitat variables were measured after each macroinvertebrate sample to characterize spatial and temporal variability in habitat conditions. First, discharge measurements were made using the Sontek FlowTracker2 along transects crosscutting cutting each site. Depth and velocity were measured in equal increments along each transect for a total of approximately 23 measurements per transect. By keeping the number of measurements relatively constant for all transects, the spacing of measurements was smaller for transects with smaller wetted widths. Discharge for each transect was calculated in the FlowTracker2 desktop application using the mean-section method (Sontek 2019). After each transect was completed, dissolved oxygen, pH, and conductivity were measured with a YSI 600 XLM multiparameter water quality sonde at the macroinvertebrate sampling points.
The depth and velocity measurements made on either side of the Surber net were averaged to assign a two-point average to each macroinvertebrate sample. Velocity data were missing for sites R3 and R4 in September because the water was not deep enough to measure velocity with the FlowTracker2. The missing values were estimated by multiplying the measured September depths by the average velocity:depth ratios for each corresponding site. Depth measurements were not available to replace missing June data for P2A and P2B.
A substrate survey was conducted at each site in June. Turbid water at some of the upstream sites prevented visual assessment of the substrate composition. Instead, the 100-stone count used by the Canadian Aquatic Biomonitoring Network (CABIN) to characterize substrate at the mesohabitat scale was adapted to characterize substrate for smaller habitat sizes (Environment Canada 2011). Twenty random stones were selected from the 50 cm radius surrounding each site marker and the intermediate axis of the stone was measured and recorded. The intermediate axis is perpendicular to the longest axis of a stone and the measurement is taken at the point resulting in the longest intermediate axis measurement (Environment Canada 2011).
To examine potential differential temperature patterns in riffle and pool habitat, temperature recorded by the HOBO loggers installed at HS2 and HS5 were used to represent stream temperature in pools and riffles, respectively. Groundwater temperature, air temperature, and canopy coverage were taken into consideration to support the analysis of stream temperature. Groundwater temperature was represented by the temperature recorded by the HOBO logger in MW02. Canopy coverage for the area around the hydrometric stations was visually assessed and recorded as a percentage of the stream section adjacent to each station with overhead canopy cover (Environment Canada 2011). One HOBO TidbiT v2 temperature logger was attached to a tree adjacent to the site to monitor air temperature.
2.5 Hydrological Analysis
Data manipulation, visualization, and analysis were carried out in R Version 4.0.3 through the integrated development environment R-Studio Version 1.3.1093 (R Core Team 2020). The R packages ggplot2 (Wickham 2016), ggfortify (Tang et al., 2016), RcolorBrewer (Neuwirth 2014), dplyr (Wickham et al., 2020), tidyr (Wickham 2021) were used frequently.
Hydrological monitoring network data were analyzed to characterize variability in groundwater level, streamflow, and vertical flow. Daily precipitation data recorded at the Abbotsford International Airport climate station were compared to mean daily groundwater level, discharge at HS2 and HS5, and vertical flow at each piezometer pair. Discharge data from the two hydrometric stations, HS2 and HS5, were plotted on a pseudo-log scale using the R package scales (Wickham and Seidel 2020) to characterize flow variability, specifically in relation to low flows and zero-flow events. Hydraulic gradients across the streambed were calculated at each 15-minute time step for each piezometer pair by taking the difference in water levels between the nested pair and dividing by the difference in their depth. The vertical flow across the upstream section of streambed between transects R5 and P3 (Figure 3) was estimated for each 15-min time step from the instantaneous hydraulic gradient values calculated from instream piezometer water level data (See Supplementary Material for gradient calculations), the streambed area (510 m2), and the average streambed hydraulic conductivity (2.5 × 10⁻⁵ m/s), which was estimated from slug tests carried out in the instream piezometers during a previous phase of field investigations at the site (Allen et al., 2020).
2.6 Analysis of Hydraulic Habitat Variables
Hydraulic habitat variables (depth, velocity, and substrate) were analyzed to characterize differences between riffles and pools, and variability in habitat conditions over the summer. For both depth and velocity, a two-way analysis of variance (ANOVA) was used to analyze the potential effects of habitat type, month, and the interaction between habitat type and month. Velocity was transformed using Tukey’s Ladder of Powers transformation through the R package rcompanion (Mangiafico 2016). One-way ANOVA was used to test for differences in substrate size among sites.
A Welch’s Two Sample t-test was used to see if substrate differed between all sites in pools and all sites in riffles. The df and p are reported in brackets for t-tests.
For all ANOVA performed in this study (including those detailed in Sections 2.7 and 2.8.1), results are provided in brackets starting with the F-statistic (F), with the degrees of freedom (df) and sample size (n) as the first and second subscripts, respectively (e.g., Fdf,n). The p-values (p) are reported after F in each set of brackets (e.g., Fdf,n = 1, p < 0.05). Post-hoc Tukey’s Honestly Significant Difference (HSD) tests were used to test for significant differences between all possible levels of each factor (i.e., month, site). Tukey’s HSD results are reported in brackets, with p < 0.05 indicating significant differences and p > 0.05 indicating no significant differences. Levene’s test of homogeneity of variance was performed through the R package car (Fox and Weisberg, 2019), and diagnostic plots were visually inspected to ensure that the assumptions of the tests were met (Supplementary Figures 2–8).
2.7 Analysis of Water Quality Variables
Water quality variables (DO, pH, EC, and temperature) were analyzed to characterize spatiotemporal variability and assess their potential influence on BMI communities. Time series of stream temperature, groundwater temperature, and air temperature were plotted. Data missing from June due to a malfunctioning DO probe were replaced with DO recorded 13 days after the original sampling event. Discrete DO and pH data, and stream temperature time series data from HS2 and HS5, were evaluated against water quality guidelines (Canadian Council of Ministers of the Environment (CCME), 1999; ECCS 2019). EC was evaluated against the typical values of EC found in freshwater streams. If some values of a water quality variable exceeded the guideline, a two-way ANOVA test was performed to see if the variable differed between sample sites or months.
2.8 Analysis of Benthic Macroinvertebrate Communities
2.8.1 ANOVA Tests
Counts of BMI taxa from each Surber sample were analyzed to assess variability in BMI communities between sites, habitat types, and months. The analyses involved three community metrics: total abundance, family richness (i.e., the number of unique families), and diversity. Diversity was represented using the Shannon Index (H’), which was calculated for each sample:
where
2.8.2 ANOSIM
Analysis of similarities (ANOSIM) tests were performed using the R package vegan (Oksanen et al., 2020) to determine if there were significant differences in BMI community composition between months or habitat types (i.e., riffles and pools). ANOSIM tests used the Bray-Curtis Dissimilarity Index. All taxa identified in each sample were included in the community abundance matrix used as input, but samples with BMI counts of zero were removed as required by the test. Samples with BMI counts of zero included samples taken at P1A and P3B in June; R1A in August; and R5A, R5B, P2A, P2B, P3A, and P3B in September.
2.8.3 Indicator Families Analysis
To examine whether certain taxa were disproportionately driving differences in community composition between habitat types and months, indicator species analyses were identified using the R-package indicspecies (De Caceres and Legendre 2009; De Caceres and Legendre 2009). However, the tests were used to identify indicator families, not species. The community abundance matrix used for ANOSIM test was used as input.
2.8.4 Non-metric Multi-Dimensional Scaling Plot
A Non-metric Multi-dimensional Scaling (NMDS) plot was constructed using the R-package vegan (Oksanen et al., 2020) to compliment the ANOSIM tests and support the assessment of spatiotemporal variability in BMI community structure. The NMDS plot is an ordination plot that shows the multidimensional community composition data in two dimensions (Legendre and Legendre 1998). The distance between samples is indicative of the degree of dissimilarity of their community compositions. The Bray-Curtis measure was used as the distance measure and the community matrix used for the ANOSIM tests and indicator species tests was used here again as input. The function envfit from the vegan package (Oksanen et al., 2020) was used to overlay vectors of the habitat variables to visualize how each variable might be influencing BMI community composition. envfit performs a regression in which each habitat variable is modelled as a function of the ordination axes. The significance of the relationships is tested by a permutation test.
2.9 Generalized Additive Model for Macroinvertebrate Abundance
A generalized additive model (GAM) was built to assess the potential effects of habitat variables on macroinvertebrate abundance. GAMs are generalized linear models in which the response variable depends on the sum of smooth functions of one or more predictor variables (Wood 2017). Potential complex non-linear relationships between predictor variables and response variables justified the use of GAMs over linear models.
Predictor variables included in the analysis were EC, pH, DO, velocity, depth, and substrate size. For depth and velocity, the two-point averages calculated for each sample were used in the GAM. Substrate was incorporated as a combined substrate index designed to better capture the variability in substrate sizes (Jowett et al., 1991). To calculate the substrate index, stones comprising each 20-stone sample were classified using the modified Wentworth particle size scale (Bovee and Milhous 1978) adjusted to include a fine gravel category (Jowett et al., 1991). The weighted percentages of each size class were then summed to get the final substrate index (Jowett et al., 1991):
The GAM for macroinvertebrate abundance was fit using the R package mgcv. The functional form of the relationship between the predictor variables and the response variable was defined as:
where
3 Results
3.1 Hydrological Variables
Total monthly precipitation decreased from 111 mm in May to 44 mm in August, with July and September totals just exceeding 50 mm (Figure 4A). The frequency of precipitation events also decreased over the summer, with just a few events punctuating extended dry periods. In response to decreasing precipitation, the groundwater level in MW02 decreased by 0.4 m from 2.9 m below ground surface at the start of May to a low of 3.3 m below ground surface by mid-September (Figure 4A).
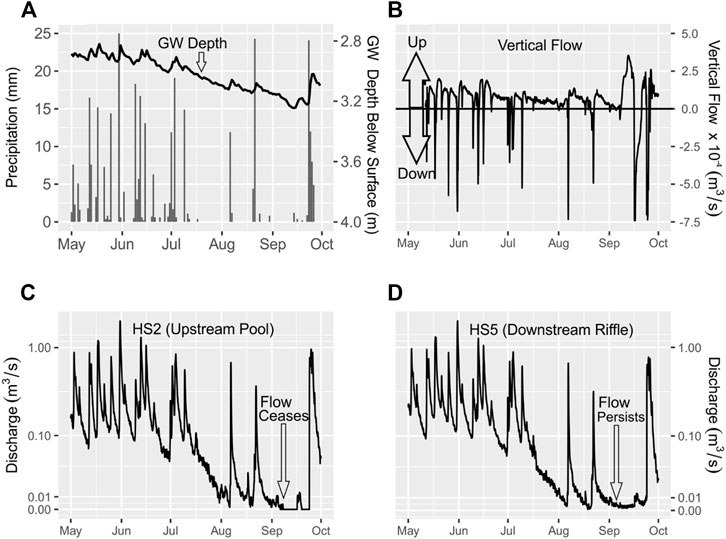
FIGURE 4. (A) Mean daily depth to groundwater level below the ground surface in MW02 and total daily precipitation recorded at the Abbotsford International Airport Station. (B) Vertical flow across the streambed between transect R5 and transect P3. Positive values above the black horizontal line indicate upward flow (gaining stream), and negative values below the red line indicate downward flow (losing stream). (C) Discharge at HS2, which is located in a pool in the upstream segment of the Otter Park reach (D) Discharge at HS5, which is located in a riffle in the downstream segment of the Otter Park reach. Discharge is plotted on a pseudo-log scale, which plots values closer to zero on a linear scale. Refer to Figure 3 for locations of instrumentation.
Vertical flow across the streambed, averaged over the stream segment between HS2 and R5, was highly variable over the summer (Figure 4B). Precipitation events caused abrupt increases in the magnitude of vertical flow in the downward direction (from stream to aquifer). However, the mean vertical flow was 5.7 × 10⁻⁵ m3/s and was generally in the upward direction when it was not raining. Vertical flow peaked above 2.5 × 10⁻⁴ m3/s in early September when precipitation was low and infrequent.
Over the study period, mean streamflow values at HS2 (Figure 4C) and HS5 (Figure 4D) were 0.15 m3/s and 0.015 m3/s, respectively. Streamflow at both stations generally remained above 0.1 m3/s from May to early July and then decreased to values near 0.01 m3/s by August. Flow persisted at both stations from August to September. However, flow ceased at HS2 on September 6. Flow cessation was punctuated by a few hours of measurable flow, which coincided with the macroinvertebrate sampling event carried out on September 17. Otherwise, the period of flow cessation generally extended until September 23.
During this period of flow cessation at HS2, flow persisted at HS5 and there was an increase in the magnitude of vertical flow in the upward direction in the upstream section between transect R5 and transect P3. The increase in upward vertical flow indicates an increase in the groundwater discharge to the stream. Since there was no precipitation during this period, groundwater discharge to the stream likely maintained streamflow downstream at HS5. In turn, the role of groundwater in maintaining instream flow conditions likely became more important over time as precipitation decreased.
3.2 Habitat Variables
3.2.1 Hydraulic Habitat Variables
Velocity varied spatially and generally decreased as streamflow declined from June to September (Figure 5A). A two-way ANOVA revealed that there were significant differences in velocity between habitat type (F1,38 = 34.6, p = 8.18 × 10⁻⁷), and between months (F3,38 = 2.97, p = 4.36 × 10⁻²), but there was no significant interaction between habitat type and month (F3,38 = 0.913, p = 4.40 × 10⁻¹). A Tukey’s HSD test confirmed that velocities were significantly higher in riffles than in pools (p = 8 × 10⁻⁷). The average decrease in velocity from June to September was also greater for riffle habitat (0.154 ± 0.132 m/s) than for pool habitat (0.039 ± 0.007 m/s), as velocities were consistently low for pool sites (Figure 5A). Aside from R3 and R4, velocities at riffle sites were similar to velocities at most pool sites in September. A Tukey’s HSD test revealed that velocity, across all sites, was significantly greater in July than in September (p = 4.78 × 10⁻⁷).
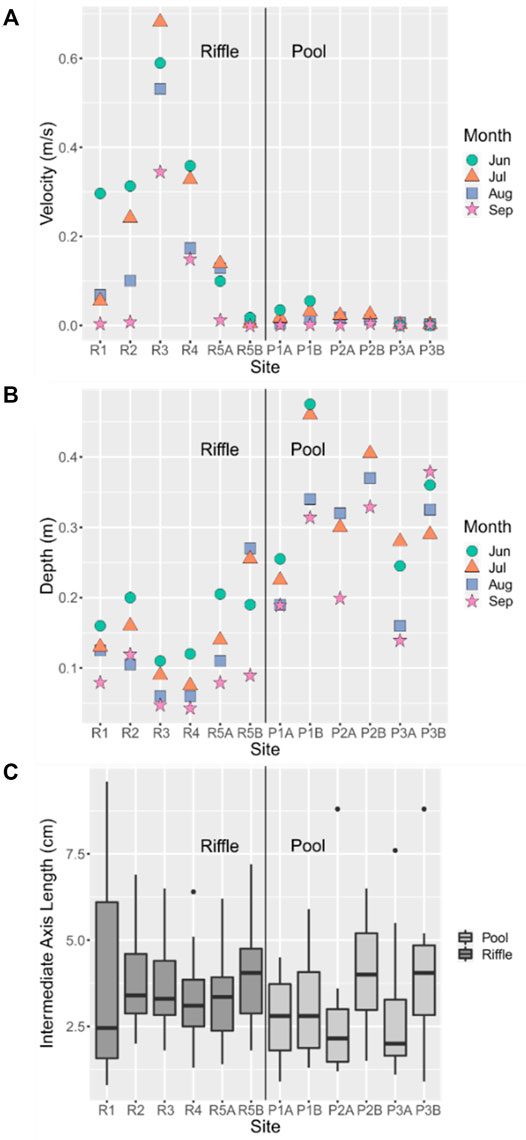
FIGURE 5. Two-point average (A) velocity and (B) depth at each site in June, July, August, and September. Variability of (C) intermediate axis length of the 20 stones collected at each site in June. Lines extending from each box indicate the range; top and bottom of boxes indicate the upper and lower quartiles, respectively; horizontal lines crossing each box indicate the median; and single points indicate potential outliers. Sites are ordered downstream (left) to upstream (right) for each of pools and riffles.
Depth also varied spatially and temporally (Figure 5B). A two-way ANOVA revealed that there was a significant difference in depth between habitat types (F1,38 = 58.79, p = 3.13 × 10⁻⁹), but not among months (F3,38 = 2.54, p = 7.03 × 10⁻²). The interaction between habitat type and month was also insignificant for depth (F3,38 = 0.058, p = 9.81 × 10⁻¹). While depth decreased each month from June to September for most riffle sites, monthly changes in depth were not consistent across pool sites. Depths were lowest for the two sites, R3 and R4, in the upstream riffle where flow ceased.
For substrate (Figure 5C), there was variability among sites, but there were no significant pairwise differences between sites (F11,228 = 2.4, p = 7.67 × 10⁻³; Tukey’s HSD: p > 0.05). A Welch’s Two Sample t-test revealed that the mean substrate size was greater in riffles than in pools (df = 237.26, p = 2.09 × 10⁻²). Other than site D1, the ranges in substrate size at individual sites were similar. There were no obvious lateral or longitudinal patterns in substrate size.
In summary, there was little spatial variability in substrate, but depth and velocity varied between and within each habitat type. Pools were deeper and slower, while riffles were shallower and faster. Riffle sites R3 and R4 were consistently lower in depth and higher in velocity than other sites.
3.2.2 Water Quality Variables
There was little variation in EC and pH over the study period (Table 1). EC values were typical of freshwaters (ECCS 2019; Table 1), and pH remained within the guideline of suitability for aquatic life (CCME, 1999; Table 1).
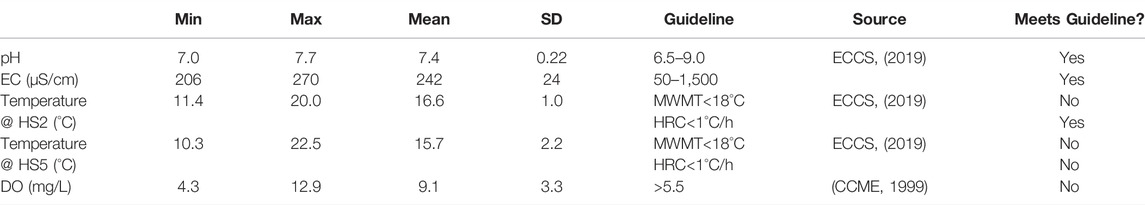
TABLE 1. Summary statistics for water quality variables and evaluation against water quality guidelines. Mean weekly maximum temperature (MWMT) is the average of the warmest daily short-term temperatures for seven consecutive days. SD = standard deviation, HRC = hourly rate of change.
In contrast to EC and pH, some values for temperature exceeded water quality guidelines (Table 1). The mean weekly maximum temperature (MWMT), which is the average of the warmest daily short-term temperatures for seven consecutive days, frequently exceeded the 18°C guideline at the upstream hydrometric station in pool habitat, HS2. The MWMT guideline was exceeded more frequently at the downstream hydrometric station in riffle habitat, HS5. Also, in the riffle at HS5, the 1°C/h guideline was exceeded once on 16 August 2020.
In addition to exceeding water quality guidelines more frequently, temperature in the downstream riffle at HS5 was more variable than temperature in the upstream pool at HS2 (Figure 6). The mean daily variability of 3.0°C at HS5 was nearly nine times greater than the 0.3°C mean daily variability at HS2. However, mean temperature was greater at HS2 than HS5 with a mean of 16.4°C at HS2 and 15.9°C at HS5 in 2020. Temperature at both stations followed air temperature, and remained above groundwater temperature until the end of September.
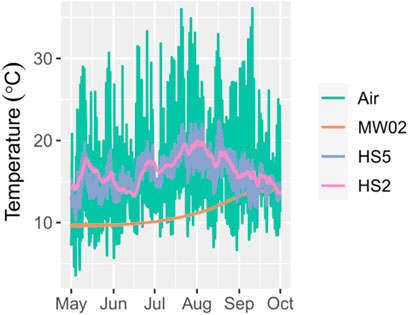
FIGURE 6. Temperature variability in air (teal lines), groundwater (MW02) (orange line), and the stream in the upstream pool at HS2 (pink) and downstream riffle at HS5 (purple).
DO levels were mostly above 6 mg/L until they dipped below the guideline of 5.5 mg/L in September (Figure 7). Only two riffle sites, R3 and R4, had DO concentrations above 5.5 mg/L in September. While there were no significant differences in DO among sites (F3,31 = 1.5, p = 0.189), there were significant differences in DO among months (F11,31 = 275.0, p < 2 × 10⁻¹⁶). DO in September and August was lower than DO in June, and DO in September was the lowest of all months (Tukey’s HSD: p < 0.05).
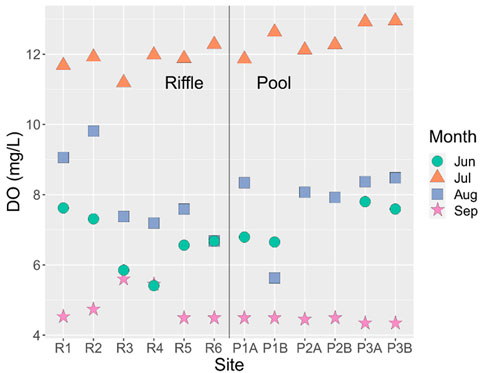
FIGURE 7. Dissolved oxygen (DO) concentrations recorded in June, July, August, and September at each macroinvertebrate sampling site in the Otter Park study reach. Sites are ordered from downstream (left) to upstream (right).
In summary, EC and pH varied little. However, water quality deteriorated as streamflow declined in terms of DO and temperature. While only two riffle sites, R3 and R4, had DO levels above the 5.5 mg/L guideline, temperature was more variable and exceeded guidelines more frequently in the perennial riffle relative to the intermittent pool. However, while temperature did not increase during the period of flow cessation, DO was still below the 5.5 mg/L guideline at most sites 1 day after flow resumed in September.
3.2.3 Macroinvertebrate Counts
A total of 6109 invertebrate specimens were collected across the study period (Figure 8). Most specimens belonged to 12 invertebrate families representing four orders of insects (Insecta), and one crustacean (Amphipoda) family, Gammaridae (gammarids). Of the 12 families of insects, six were flies (Diptera), and the remaining families represented the mayflies (Ephemeroptera).
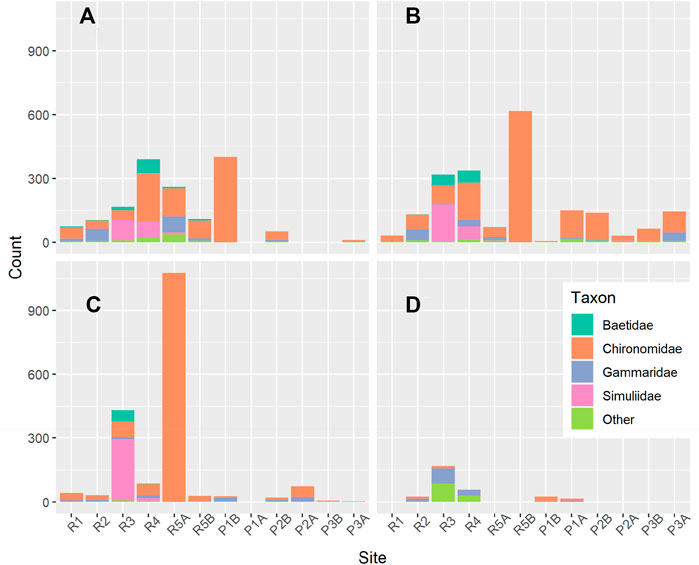
FIGURE 8. Abundance of BMI families at each site in (A) June, (B) July (C) August, and (D) September. For each month, sites are ordered downstream (left) to upstream (right). Sites labeled A are the north sites and sites labeled B are the south sites in cases where two samples were collected across the channel.
Chironomids (Chironomidae) were the most abundant taxon at most sites in riffles and pools from June to August and constituted 64% of the total abundance across the study period (Figure 8). Prior to September, black flies (Simuliidae) were the second most abundant taxon in riffles, but 96% of black fly specimens were collected at the upstream riffle sites, R3 and R4. Eighty-seven percent of baetid mayflies (Baetidae) were also found at R3 and R4. Few baetid mayflies and black flies were found at pool sites and the perennial riffle sites, R1 and R2. Instead, the communities at these sites were mostly constituted by chironomids and gammarids before September.
The BMI sampling event on September 17th occurred 1 day after flow resumed in the upstream segment of the study reach (between R3 and P3). Before BMI sampling, the flow had ceased for roughly 10 days. From the samples collected in pool habitat, sites P1A and P1B were the only sites where specimens were found. The only non-chironomids remaining at P1A and P1B in September were a few gammarids and a few non-insects from the “Other” group. At riffle sites in September, there were no baetid mayflies or black flies, leaving gammarids as the dominant taxon in riffles (Figure 8). Prior to September, the maximum horse fly abundance per sample was one, but abundances of 29 and 84 were recorded at R3 and R4, respectively. Between the two downstream riffle sites, R1 and R2, just a few gammarids and chironomids, and one Hydroptilidae were found. No specimens were found at R5A and R5B.
A two-way ANOVA revealed that BMI abundance was significantly greater in riffles than in pools (F1,38 = 10.8, p = 2.20 × 10⁻³). There were also significant differences in BMI abundance between months (F3,38 = 3.69, p = 2.00 × 10⁻²), but there was no significant interaction between habitat type and month (F3,38 = 0.514, p = 6.75 × 10⁻¹). A Tukey’s HSD test showed that BMI abundance across all sites was significantly higher in July than in September (p = 1.43 × 10⁻²). A one-way ANOVA revealed abundance differed significantly among the upstream riffle, the upstream pool, and the downstream riffle (F2,19 = 15.15, p = 1.16 × 10⁻⁵), with abundance being significantly greater at the upstream riffle than the other habitats (Tukey’s HSD, p < 0.05). In September, BMI abundance for the two upstream riffle sites, R3 and R4, was 58 and 168, respectively. In contrast, BMI abundance at the sites in the riffle where flow persisted, R1 and R2, was 2 and 25, respectively.
Similar to the results for BMI abundance, a two-way ANOVA showed family richness in riffles exceeded richness in pools (F1,38 = 16.1, p = 2.70 × 10⁻⁴). There was no significant interaction between habitat type and month (F3,38 = 0.140, p = 2.58 × 10⁻¹), but family richness did differ significantly between months (F3,38 = 8.31, p = 2.26 × 10⁻⁴). A Tukey’s HSD test revealed that relative to September, family richness was significantly higher in June (p = 5.62 × 10⁻³), July (p = 2.22 × 10⁻⁴), and August (p = 5.44 × 10⁻³). A one-way ANOVA revealed family richness differed significantly among the upstream riffle, the upstream pool, and the downstream riffle (F2,19 = 16.01, p = 8.38 × 10⁻⁵), with richness being significantly greater at the upstream riffle than the other habitats (Tukey’s HSD, p < 0.05). The maximum family richness in September was 4, and six sites had a richness of zero. The upstream riffle sites, R3 and R4, had richness values of 3, while R1 and R2 had one and three families, respectively. In contrast, the maximum family richness in June was 11, and only two sites were without one of the 12 families identified in this study.
Diversity (represented by the Shannon index) was also significantly greater in riffles than in pools (F1,38 = 16.4, p = 2.42 × 10⁻⁴). The two-way ANOVA for diversity also revealed no significant interaction between habitat type and month (F3,38 = 1.53, p = 2.22 × 10⁻¹). Although there were significant differences among months (F3,38 = 3.05, p = 4.02 × 10⁻²), no significant pairwise differences between months were found using Tukey’s HSD Test (p > 0.05). A one-way ANOVA revealed diversity differed significantly among the upstream riffle, the upstream pool, and the downstream riffle (F2,19 = 16.01, p = 8.42 × 10⁻⁵), with diversity being significantly greater at the upstream riffle than the other habitats (Tukey’s HSD, p < 0.05). In September, the sites in the riffle that ceased to flow, R3 and R4, had Shannon Index values of 0.77 and 0.88, respectively. The sites in the riffle where flow persisted, R1 and R2, had scores of 0.00 and 0.78, respectively.
3.2.4 ANOSIM Results
ANOSIM tests showed that BMI community composition differed significantly between months (p = 6.8 × 10⁻²), and between riffles and pools (p = 4.46 × 10⁻²). For the ANOSIM test grouped by habitat type (riffle vs. pool), the ANOSIM R statistic of 0.09 did not suggest a high degree of dissimilarity between riffle and pool compositions, as a value of zero indicates no dissimilarity, while a value of one indicates high dissimilarity. For the ANOSIM test grouped by month, the ANOSIM R statistic was 0.15, suggesting a greater degree of dissimilarity between months than between habitat types.
3.2.5 Indicator Species Results
Indicator species analyses were performed to examine if certain BMI taxa were driving differences in community composition between habitat types and months more than others. BMI families Baetidae (p = 1.33 × 10⁻²), Hydroptilidae (p = 1.25 × 10⁻²), and Simuliidae (p = 1.92 × 10⁻²) were significantly associated with riffle habitat, suggesting these families strongly influence differences in community composition between pool habitat and riffle habitat. BMI families that were significant drivers of monthly differences were Ceratopogonidae in June (p = 1.00 × 10⁻³) and Tabanidae in September (p = 1.38 × 10⁻²).
3.2.6 Non-Metric Multi-Dimensional Scaling Plot
BMI community composition differed between riffle habitat and pool habitat, and between sites within each habitat type (Figure 9). BMI community composition varied through time at each site, but some sites saw greater month-to-month changes than others. As indicated by the clustering of multiple months for a single site, site R3 maintained a similar community composition from June to August. Other riffle sites showed similar degrees of variability from June to August. In contrast, the furthest downstream perennial riffle site, R1, varied in community composition to a similar degree as many pool sites. In September, riffle sites experienced a similar shift in community composition, as suggested by the clustering of September data points for riffle sites in the top right of the NMDS plot (Figure 9). The two pool sites where BMI individuals were still found, P1B and P2B, shifted in the same direction on the NMDS plot.
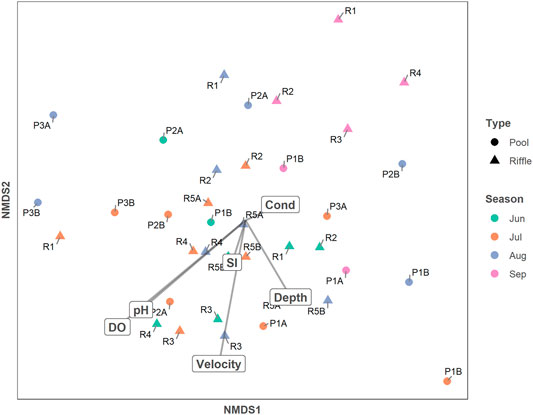
FIGURE 9. Non-metric Multi-Dimensional Scaling (NMDS) Plot depicting pairwise dissimilarities in BMI community composition for samples collected in riffles (triangles) and pools (circles) in June (green), July (orange), August (blue), and September (pink). Dissimilarity increases with distance between samples. The axes and the orientation of the plot are arbitrary. Straight dark lines are vectors for dissolved oxygen (DO), pH, substrate index (SI), velocity, depth, and electrical conductivity (Cond).
Fitted vectors of habitat variables onto the NMDS ordination plot revealed potential drivers of these changes in community composition (Figure 9). The orientations of all vectors other than conductivity suggest that most habitat variables change most rapidly moving downward along the y-axis. The length of the vector for DO indicates that DO had the strongest correlation with community composition (r2 = 0.16). This was also the only significant correlation (p = 0.05), suggesting DO might be a key control on BMI community composition. Velocity had the second strongest correlation (p = 0.09, r2 = 0.13). As the season progressed (green to orange to blue to purple), DO and velocity decreased and the community composition shifted.
3.2.7 Generalized Additive Model
A GAM was used to assess the potential relationships of EC, pH, DO, velocity, depth, and substrate size with BMI abundance. Model selection, which consisted of removing insignificant variables one by one from the model, left only DO and velocity as predictors of BMI abundance (Figure 10). The BMI abundance GAM had an adjusted r2 of 0.39. The effective degrees of freedom (edf) tell us about the linearity of each function in that edf = 1 indicates a linear function, whereas edf = 2 indicates a quadratic function, and so on (Wood 2017). Velocity had a significant non-linear relationship with total abundance with 1.78 effective degrees of freedom (Figure 10A). DO had a significant linear relationship with total abundance with 0.87 effective degrees of freedom (Figure 10B).
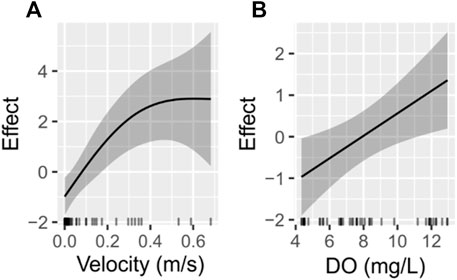
FIGURE 10. The partial effects of (A) velocity and (B) dissolved oxygen (DO) on total macroinvertebrate abundance estimated by the macroinvertebrate GAM. The solid dark lines show the estimated smooth function of each variable, and the surrounding dark bands are 95% confidence intervals.
4 Discussion
4.1 Hydrological System
Variability in streamflow and aquifer-stream exchange drives expansion and contraction of IRES networks and therefore dictates the timing, magnitude, and duration of drying, which controls stream biodiversity at large scales (Boulton et al., 2017). High variability in flow systems across IRES, as suggested by their large global extent, stresses the importance of research on IRES flow systems (Datry et al., 2014). Like other IRES (Gómez-Gener et al., 2021), flow paths likely differed between the flowing phase (Figure 11A) and the period of flow cessation (Figure 11B). During the flowing phase, maintenance of streamflow by precipitation and groundwater input is common in IRES (Woessner 2020). At Otter Park, the flowing phase lasted from May to early September. The average vertical flow across the streambed between transect R5 and transect P3 was frequently upward, indicating the stream was gaining groundwater. The hypothetical flow paths during this phase as illustrated in Figure 11A would resemble flow paths of a perennial stream (Winter et al., 1998; Sophocleous 2002). Shallow hyporheic flow is driven by streambed topography and interacts with local groundwater flow paths (Harvey and Bencala 1993; Sophocleous 2002).
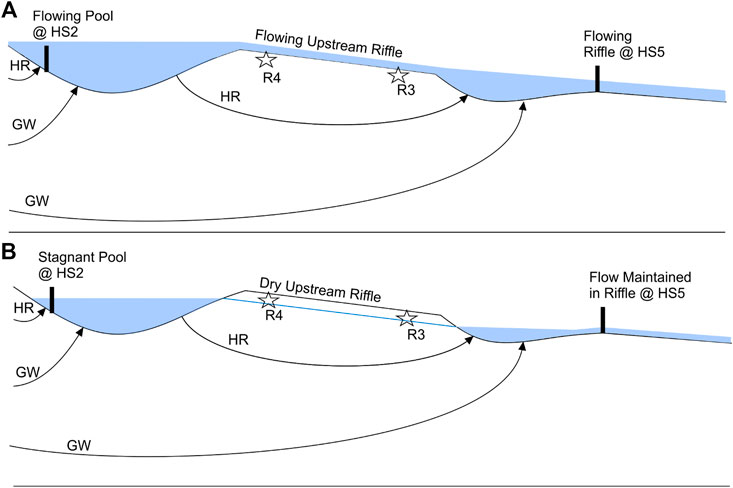
FIGURE 11. Conceptual model of surface and subsurface flow at Otter Park during (A) flowing phases and (B) periods of flow cessation. The stream section located between the intermittent riffle and HS5 (Figure 3) was omitted to highlight the focal segments of the study reach. During flowing phases (A), surface flow occurs in each habitat unit. Vertical exchanges in the upstream pool and downstream riffle are constituted by hyporheic (HR) and groundwater (GW) flow. During periods of flow cessation (B), surface flow persists only in the downstream riffle. The upstream riffle where sites R4 and R3 are located dries when flow ceases in the pool. HR and GW flow paths help maintain water level in the upstream pool, which supplies water to the downstream riffle via HR flow paths.
During the period of flow cessation, the hypothesized flow system illustrated in Figure 11B was formulated by referencing the hydrometric and vertical flow data against conceptual models found in the literature. Firstly, the maintained connectivity between the upstream pool and the downstream riffle is consistent with previous conceptual models of flow systems occurring in isolated pool networks in IRES during flow cessation (Datry et al., 2014; Rau et al., 2017; Gómez-Gener et al., 2021). The persistence of flow at HS5 through the entire period of flow cessation indicates that water was at least being sourced from draining of upstream pools through the hyporheic zone. Without some source of water to replenish what was flowing out of the downstream pool and riffle at HS5, the downstream segment would have ceased to flow and likely dried. In addition to hyporheic flow from the upstream pool to the downstream pool, groundwater discharge along the stream, as evidenced by the large positive vertical flow observed for the upstream pool, also likely helped maintain flow at HS5. As the influence of groundwater is typically diluted at higher flows (Gómez-Gener et al., 2021), groundwater contribution to the stream became more important for maintaining wetted instream conditions as precipitation decreased and streamflow declined. Perennial reaches are often assumed to be valuable refuges where the persistence of ideal habitat conditions yields more diverse and rich communities (Burk and Kenney 2013; Datry et al., 2014).
4.2 Habitat Conditions
Physical and Chemical habitat characteristics differed between riffles and pools. Depth decreased more rapidly in riffles than in the upstream pool. Faster drying and habitat loss in riffles is a key characteristic of habitat variability in IRES (Gomez Gener et al., 2021). Higher velocity and lower depth for most riffle sites across most months relative to pools are typical of riffle-pool differences in all stream types since depth and velocity are two variables used to distinguish between habitat types (Brown and Brussock, 1991; Wohl et al., 1993). Finer substrate is often a distinguishing characteristic of pools. But fine material may be scoured from the streambed during periods of higher flow and deposited during periods of lower flow. Since streamflow was at least an order of magnitude higher in June relative to much of the remainder of the study period, spatial heterogeneity in substrate size may have been greater in other months.
In addition to depth and velocity in riffles being more sensitive to streamflow decline relative to pools, stream temperature in the riffle was more sensitive to changes in air temperature. Maintenance of lower temperatures relative to the riffle through the period of flow cessation can likely be attributed to pool depth remaining near 30 cm (Poole and Berman 2001; Caissie 2006). The decline in both riffle and pool temperature from August to October, including over the period of flow cessation, indicates that temperature was not the only driver of dissolved oxygen decreases over the summer. Instead, low DO in September was likely the result of oxidation of organic matter in isolated pools over the period of flow cessation. Similar DO in riffles and pools is common for low gradient streams like Bertrand Creek because re-aeration by turbulent flow in riffles generally declines with channel slope (Rosenfeld 2017).
Differences in habitat conditions between individual sites suggest that habitat heterogeneity occurs at the site scale in addition to the scale of habitat type. For example, R3 and R4 were consistently higher in velocity and lower in depth than all other sites, DO was likely highest at R3 and R4 in September because their high velocity and low depth allowed for local re-aeration by turbulent flow. While turbulent flow did not appear to be an important control on DO, riffle aeration might have a greater influence on local DO concentration later in the summer when DO is already low.
4.3 Benthic Macroinvertebrate Communities
In this study, BMI community composition, richness, abundance, and diversity differed between riffles and pools, but also between the downstream perennial riffle and the upstream intermittent riffle. The greater abundance of most taxa in riffles but more even distribution of chironomids between riffles and pools are not uncommon (Brown and Brussock, 1991). Baetidae and Simuliidae are significant identifiers of riffle communities because they are rheophilic (flow-loving) taxa (Scullion et al., 1982; Boulton 2003; Bonada et al., 2006; Stubbington et al., 2009). However, 87% of Baetidae and 96% Simuliidae individuals were found at the two upstream riffle sites, indicating heterogeneity at the site scale may be more important than heterogeneity between habitat types for predicting the spatial variability in the abundance of these taxa. While some baetid mayflies and black flies were found at the downstream perennial riffle sites in some months, they had a similar dominance of chironomids and gammarids as the intermittent pool sites. Consequently, richness, abundance, and diversity did not differ between the upstream pool and the perennial riffle, but all metrics were significantly higher for the upstream riffle, which contrasts the common finding that community compositions at intermittent sites are subsets of those found at perennial sites (Feminella, 1996; Price et al., 2003; Bonada et al., 2006; Datry et al., 2014). Even in September, 1 day after flow resumed following 10 days of flow cessation, richness, diversity, and abundance remained elevated at the two intermittent riffle sites. In Mediterranean climate streams in California, Bonada et al. (2006), also found that community compositions were similar in perennial riffles and pools during the flowing phase; however, this was attributed to the direct connection between the riffle and the pool. At Otter Park, the pool and perennial riffle are separated by over 100 m. Bonada et al. (2006) asserts that sites in different habitat types in the same stream reach or the same stream are more likely to be similar than communities in the same habitat type but different streams because larger scale catchment characteristics act as the first filter, while differences at the scale of habitat type act as the second filter. Therefore, larger scale filters could be responsible for the similar communities found in the upstream pool and the downstream perennial riffle. However, the consistently higher diversity, abundance, and richness at the two intermittent riffle sites still suggests high importance of habitat heterogeneity at the site scale.
The consistently low richness and diversity of BMI communities across the site likely reflects how recurring patterns of extreme variability in physical and chemical habitat characteristics associated with streamflow decline, flow cessation, and drying have sculpted the BMI community in that only taxa with optimal traits for persistence inhabit reaches near Otter Park. Each taxon present in reasonable abundance from June to September possesses traits that promote their survival through flow cessation and drying. For example, taxa present immediately following flow cessation included Chironomidae, Tabanidae, and Gammaridae, which are common inhabitants of IRES (Nimmo et al., 2015; Datry et al., 2017). During a period of flow cessation in Sycamore Creek, Arizona, Tabanidae were commonly found taking refuge in dry substratum and also took refuge below dried leaf litter (Boulton 2003). The refuges were also occupied by chironomids, which are also commonly found taking refuge in the hyporheic zone (Boulton 2003; Datry et al., 2017). Gammarids also often enter the hyporheic zone during flow cessation and drying and are early colonists when flow resumes (Vander Vorste et al., 2016; Stubbington et al., 2018). Gammarids also have strong swimming abilities, which allow them to swim upstream from reaches where flow persists to recolonize the upstream riffle when flow resumes (Poff et al., 1997). At Otter Park, these taxa likely still dominate at the downstream riffle because low flows, low dissolved oxygen, and high temperature variability are still fundamental aspects of the natural variability of habitat conditions at the downstream riffle.
Although flow cessation and drying filter out intolerant taxa across the entire reach, the high abundances of black flies and baetid mayflies suggest that the habitat preferences of certain taxa can still be important controls on spatial and temporal variability in abundance. In Canada, the abundances of baetid mayflies are strongly correlated with velocity (Monk et al., 2017). Black fly abundances have also been shown to increase with velocity (Rivers-Moore et al., 2006). Burgazzi et al. (2020) found that baetid mayflies and chironomids occupied a wide range of habitat conditions, but abundances were driven by habitat preferences. However, gammarid abundances show a negative relationship with velocity (Monk et al., 2017).
Dissolved oxygen may have contributed to higher abundances at the intermittent riffle sites following flow resumption, but our confidence in the effect of DO is low because the DO was not consistently higher than other sites like velocity was. The GAM analysis and the NMDS environmental vector overlay analysis indicated DO and velocity were likely important controls on total abundance and BMI community composition, respectively. However, the results of these two analyses should be interpreted as an indication that velocity and DO may be important drivers of BMI abundance and community composition until they have been replicated. Other factors, such as predation, food availability, habitat availability, and potential seasonal effects related to the life cycles of different taxa could influence the accuracy of the results. Regardless, four consecutive months of higher abundance, diversity, and richness at two intermittent riffle sites relative to an intermittent pool and perennial riffle likely indicate that site-scale habitat heterogeneity influences spatial variability of BMI communities even though flow cessation and drying act as a primary filter, which limits the overall taxonomic richness across the site (Bonada et al., 2006).
Although groundwater discharge to the stream likely helped maintain streamflow in the downstream riffle during the period of flow cessation, BMI communities did not increase in diversity, richness, and abundance as predicted in other studies (Datry et al., 2014). However, these findings likely highlight the immense complexity of groundwater dependence in IRES rather than a lack of ecological dependence on groundwater. For example, upward vertical flow across the streambed in the upstream pool suggests that groundwater helped maintain water level in the pool, even during flow cessation. Unravelling the complex dynamics of aquifer-stream exchanges in IRES will likely continue to reveal how changes in hydrological connectivity help organize aquatic communities and their physical habitat templates.
4.4 conclusion
Flow cessation and drying are recurring events for a majority of streams in many regions, and are expected to be more common in response to climate change and increased groundwater pumping (Datry et al., 2014; Datry et al., 2017). Despite the widespread occurrence of intermittent rivers and ephemeral streams (IRES), most of our understanding of how hydrological variability molds patterns of habitat conditions and biotic communities derives from studies conducted in perennial streams. Due to their complexity, a proper understanding of the hydrology and ecology of IRES necessitates more studies of the linkages between groundwater, surface water, the physical and chemical habitat characteristics, and the composition, richness, abundance, and diversity of biotic communities across a range of systems and scales (Datry et al., 2014; Gomez-Gener et al., 2021). The findings of this study put into question the transferability of a common assumption of IRES, specifically the presumed increase in richness, diversity, and abundance of BMI communities with increasing flow persistence along a stream (Datry et al., 2014). In turn, the results of this study demonstrate the importance of considering the influence of habitat heterogeneity across multiple spatial scales, and how natural dynamics of surface and subsurface flow might have structured BMI communities over time. Our understanding of factors influencing transferability of empirical hydrological-ecological relationships for IRES will improve with the increasing spatial extent of ongoing research, likely increase.
Data Availability Statement
The raw data supporting the conclusions of this article will be made available by the authors, without undue reservation.
Author Contributions
AM and DA conceptualized the study. AM carried out the sampling, performed the analyses, and drafted the manuscript. Both authors discussed the results and commented on the manuscript.
Funding
This study was supported by the Canadian Mountain Network, and the British Columbia Ministry of Forests, Lands, Natural Resource Operations and Rural Development.
Conflict of Interest
The authors declare that the research was conducted in the absence of any commercial or financial relationships that could be construed as a potential conflict of interest.
Publisher’s Note
All claims expressed in this article are solely those of the authors and do not necessarily represent those of their affiliated organizations, or those of the publisher, the editors and the reviewers. Any product that may be evaluated in this article, or claim that may be made by its manufacturer, is not guaranteed or endorsed by the publisher
Acknowledgments
Alex Nott (Simon Fraser University) is thanked for his assistance with data collection. The authors also acknowledge Jonathan Moore (Simon Fraser University) who assisted with the study design.
Supplementary Material
The Supplementary Material for this article can be found online at: https://www.frontiersin.org/articles/10.3389/feart.2022.768836/full#supplementary-material
References
Allen, D. M., Johnson, B., Garnet, A., Howe, K., Lepitre, M., and Simpson, M. (2020). Assessment of Aquifer-Stream Connectivity Related to Groundwater Abstraction in the Lower Fraser Valley: Phase 2 Field Investigation at Otter Park, Langley. BC Water Science Series 2020-03. Victoria: Province of British Columbia.
Armanini, D. G., Horrigan, N., Monk, W. A., Peters, D. L., and Baird, D. J. (2011). Development of a Benthic Macroinvertebrate Flow Sensitivity Index for Canadian Rivers. River Res. Applic. 27, 723–737. doi:10.1002/rra10.1002/rra.1389
Avery-Gomm, S. (2013). Determining the Impacts of Hydrological Drought on Endangered Nooksack Dace (Rhinichthys Cateractae) at the Population and Individual Level: Implications for Minimum Environmental Flow Requirements. [Vancouver, BC]: University of British Columbia. [master’s thesis].
Avery-Gomm, S., Rosenfeld, J. S., Richardson, J. S., and Pearson, M. (2014). Hydrological Drought and the Role of Refugia in an Endangered Riffle-Dwelling Fish, Nooksack Dace (Rhinichthys Cataractae Ssp.). Can. J. Fish. Aquat. Sci. 71, 1625–1634. doi:10.1139/cjfas-2013-0585
Bonada, N., Rieradevall, M., Prat, N., and Resh, V. H. (2006). Benthic Macroinvertebrate Assemblages and Macrohabitat Connectivity in Mediterranean-Climate Streams of Northern California. Available at: www.guadalmed.org.doi:10.1899/0887-3593(2006)25[32:bmaamc]2.0.co;2
Borg Galea, A., Sadler, J. P., Hannah, D. M., Datry, T., and Dugdale, S. J. (2019). Mediterranean Intermittent Rivers and Ephemeral Streams: Challenges in Monitoring Complexity. Ecohydrology 12. doi:10.1002/eco.2149
Bouchard, R. W. (2004). Guide to Aquatic Macroinvertebrates of the Upper Midwest. St. Paul, Minnesota: Water Resources Center, University of Minnesota
Boulton, A. J. (2003). Parallels and Contrasts in the Effects of Drought on Stream Macroinvertebrate Assemblages. Fresw. Biol. 48, 1173–1185. doi:10.1046/J.1365-2427.2003.01084.X
Boulton, A. J., Rolls, R. J., Jaeger, K. L., and Datry, T. (2017). Hydrological Connectivity in Intermittent Rivers and Ephemeral Streams. Intermittent Rivers Ephemeral Streams: Ecol. Manage., 79–108. doi:10.1016/B978-0-12-803835-2.00004-8
Bourke, S. A., Shanafield, M., Hedley, P., and Dogramaci, S. (2020). A Hydrological Framework for Persistent River Pools in Semi-arid Environments. Hydrol. Earth Syst. Sci. Discuss., 1–18. doi:10.5194/hess-2020-133
Bovee, K. D., and Milhous, R. (1978). Hydraulic Simulation in Instream Flow Studies: Theory and Techniques. Instream Flow Information Paper 5. U.S.D.I. Fish and Wildlife Service, Office of Biological Services. FWS/OBS-78/33.
Brown, A. v., and Brussock, P. P. (1991). Comparisons of Benthic Invertebrates Between Riffles and Pools. Hydrobiologia 220, 99–108. doi:10.1007/BF00006542
Burk, R. A., and Kennedy, J. H. (2013). Invertebrate Communities of Groundwater-dependent Refugia with Varying Hydrology and Riparian Cover during a Supraseasonal Drought. J. Freshw. Ecol. 28, 251–270. doi:10.1080/02705060.2012.753121
Burgazzi, G., Laini, A., Ovaskainen, O., Sacco, M., Stubbington, R., and Viaroli, P. (2000). Communities in High Definition: Spatial and Environmental Factors Shape the Micro-Distribution of Aquatic Invertebrates. Freshwater Biol. 65, 2053–2065. doi:10.1111/fwb.13599
Buttle, J. M., Boon, S., Peters, D. L., Spence, C., van Meerveld, H. J., and Whitfield, P. H. (2012). An Overview of Temporary Stream Hydrology in Canada. Can. Water Resour. J./Revue canadienne des ressources hydriques 37, 279–310. doi:10.4296/cwrj2011-903
CCME (Canadian Council of Ministers of the Environment), (1999). Canadian Water Quality Guidelines for the Protection of Aquatic Life - Dissolved Oxygen (Freshwater).
Cáceres, M. D., and Legendre, P. (2009). Associations between Species and Groups of Sites: Indices and Statistical Inference. Ecology 90, 3566–3574. doi:10.1890/08-1823.1
Caissie, D. (2006). The thermal Regime of Rivers: A Review. Freshw. Biol 51, 1389–1406. doi:10.1111/j.1365-2427.2006.01597.x
Chester, E. T., and Robson, B. J. (2011). Drought Refuges, Spatial Scale and Recolonisation by Invertebrates in Non-perennial Streams. Freshw. Biol. 56, 2094–2104. doi:10.1111/j.1365-2427.2011.02644.x
Clague, J. J., Luternauer, J. L., and Hebda, R. J. (1983). Sedimentary Environments and Postglacial History of the Fraser Delta and Lower Fraser Valley, British Columbia. Can. J. Earth Sci. 20, 1314–1326. doi:10.1139/e83-116
Clarke, A., mac Nally, R., Bond, N., and Lake, P. S. (2010). Flow Permanence Affects Aquatic Macroinvertebrate Diversity and Community Structure in Three Headwater Streams in a Forested Catchment. Can. J. Fish. Aquat. Sci. 67, 1649–1657. doi:10.1139/F10-087
Datry, T., Bonada, N., and Boulton, A. (2017). Intermittent Rivers and Ephemeral Streams. San Diego: Elsevier Science & Technology.
Datry, T., Larned, S. T., and Tockner, K. (2014). Intermittent Rivers: A challenge for Freshwater Ecology. BioSci 64, 229–235. doi:10.1093/biosci/bit027
de Graaf, I. E. M., Gleeson, T., van Beek, L. P. H., Sutanudjaja, E. H., and Bierkens, M. F. P. (2019). Environmental Flow Limits to Global Groundwater Pumping. Nature 574, 90–94. doi:10.1038/s41586-019-1594-4
Dieterich, M., and Anderson, N. H. (2000). The Invertebrate Fauna of Summer-Dry Streams in Western Oregon. Archiv. fur Hydrobiol. 147, 273–295.
Doretto, A., Piano, E., Falasco, E., Fenoglio, S., Bruno, M. C., and Bona, F. (2018). Investigating the Role of Refuges and Drift on the Resilience of Macroinvertebrate Communities to Drying Conditions: An experiment in Artificial Streams. River Res. Applic 34, 777–785. doi:10.1002/rra.3294
ECCS (Environment and Climate Change Strategy) (2019). British Columbia Approved Water Quality Guidelines: Aquatic Life, Wildlife & Agriculture, Summary Report. Available at: https://www2.gov.bc.ca/gov/content/environment/air-land-water/water/water-quality/water-quality-guidelines/approved-water-quality-guidelines (Accessed September, , 2020).
Environment Canada (2011). Canadian Aquatic Biomonitoring Network Field Manual - Wadeable Streams. Available at: https://publications.gc.ca/site/eng/422979/publication.html (Accessed 20th August, 2019).
Feminella, J. W. (1996). Comparison of Benthic Macroinvertebrate Assemblages in Small Streams along a Gradient of Flow Permanence. Available at: https://www.jstor.org/stable/1467814
Fisheries and Oceans Canada. (2019a). Recovery Strategy for the Nooksack Dace (Rhinichthys Cataractae Ssp.) in Canada, 2019 (Proposed). Species Risk Act Recover. Strateg. Ser. Available at: https://www.canada.ca/en/environment-climate-change/services/species-risk-public-registry/recovery-strategies/nooksack-dace-2019-proposed.html [Accessed September 20, 2019].
Fisheries and Oceans Canada. (2019b). Recovery Strategy for the Salish Sucker (Catostomus Sp. Cf. Catostomus) in Canada, 2019 (Proposed). Species Risk Act Recover. Strateg. Ser. Available at: https://www.canada.ca/en/environment-climate-change/services/species-risk-public-registry/recovery-strategies/salish-sucker-2019-proposed.html [Accessed September 20, 2019].
Fox, J., and Weisberg, S. (2019). An {R} Companion to Applied Regression, Third Edition. Thousand Oaks, CA: Sage.
Gómez-Gener, L., Siebers, A. R., Arce, M. I., Arnon, S., Bernal, S., Bolpagni, R., et al. (2021). Towards an Improved Understanding of Biogeochemical Processes across Surface-Groundwater Interactions in Intermittent Rivers and Ephemeral Streams. Earth-Science Rev. 220, 103724. doi:10.1016/J.EARSCIREV.2021.103724
Harvey, J. W., and Bencala, K. E. (1993). The Effect of Streambed Topography on Surface-Subsurface Water Exchange in Mountain Catchments. Water Resour. Res. 29, 89–98. doi:10.1029/92WR01960
Jowett, I. G., Richardson, J., Biggs, B. J. F., Hickey, C. W., and Quinn, J. M. (1991). Microhabitat Preferences of Benthic Invertebrates and the Development of generalisedDeleatidiumspp. Habitat Suitability Curves, Applied to Four New Zealand Rivers. New Zealand J. Mar. Freshw. Res. 25, 187–199. doi:10.1080/00288330.1991.9516470
Knief, U., and Forstmeier, W. (2018). Violating the Normality assumption May Be the Lesser of Two Evils. BioRxiv. doi:10.1101/498931
Larned, S. T., Datry, T., Arscott, D. B., and Tockner, K. (2010). Emerging Concepts in Temporary-River Ecology. Freshw. Biol. 55, 717–738. doi:10.1111/j.1365-2427.2009.02322.x
Lytle, D. A., and Poff, N. L. (2004). Adaptation to Natural Flow Regimes. Trends Ecol. Evol. 19, 94–100. doi:10.1016/j.tree.2003.10.002
Mangiafico, S. S. (2016). Summary and Analysis of Extension Program Evaluation in R. version 1.18.8Available at: rcompanion.org/handbook/(Accessed January 20th, 2021).
Monk, W. A., Compson, Z. G., Armanini, D. G., Orlofske, J. M., Curry, C. J., and Peters, D. L. (2018). Flow Velocity Ecology Thresholds in Canadian Rivers: A Comparison of Trait and Taxonomy-Based Approaches. Freshwater Biol., 891–905. doi:10.1111/fwb.13030
Marra, G., and Wood, S. N. (2011). Practical Variable Selection for Generalized Additive Models. Comput. Stat. Data Anal. 55, 2372–2387. doi:10.1016/j.csda.2011.02.004
Neuwirth, N. (2014). RColorBrewer: ColorBrewer Palettes. R Package Version 1.1-2. Available at: https://CRAN.R-project.org/package=RColorBrewer (Accessed January 15th, 2021).
Nimmo, D. G., mac Nally, R., Cunningham, S. C., Haslem, A., and Bennett, A. F. (2015). Vive la Resistance: Reviving Resistance for 21st Century Conservation. Trend. Ecol. Evol. 30, 516–523. doi:10.1016/j.tree.2015.07.008
Oksanen, J. F., Blanchet, G., Friendly, M., Kindt, R., Legendre, P., McGlinn, D., et al. (2020). Vegan Community Ecology Package. R Package Version 2.5-7. Available at: https://CRAN.R-project.org/package=vega.
Peel, M. C., Finlayson, B. L., and McMahon, T. A. (2007). Updated World Map of the Köppen-Geiger Climate Classification. Hydrol. Earth Syst. Sci. 11, 1633–1644. doi:10.5194/hess-11-1633-2007
Poff, N. L., Allan, J. D., Bain, M. B., Karr, J. R., Prestegaard, K. L., Richter, B. D., et al. (1997). The Natural Flow Regime. BioScience 47, 769–784. doi:10.2307/1313099
Poff, N. L., and Ward, J. V. (1989). Implications of Streamflow Variability and Predictability for Lotic Community Structure: A Regional Analysis of Streamflow Patterns. Can. J. Fish. Aquat. Sci. 46, 1805–1818. doi:10.1139/f89-228
Poff, N. L., and Ward, J. V. (1990). Physical Habitat Template of Lotic Systems: Recovery in the Context of Historical Pattern of Spatiotemporal Heterogeneity. Environ. Manage. 14, 629–645. doi:10.1007/bf02394714
Poole, G. C., and Berman, C. H. (2001). An Ecological Perspective on In-Stream Temperature: Natural Heat Dynamics and Mechanisms of Human-CausedThermal Degradation. Environ. Manage. 27, 787–802. doi:10.1007/s002670010188
Price, K., Suski, A., McGarvie, J., Beasley, B., and Richardson, J. S. (2003). Communities of Aquatic Insects of Old-Growth and Clearcut Coastal Headwater Streams of Varying Flow Persistence. Can. J. For. Res., 1416–1432. doi:10.1139/x03-089
R Core Team (2020). R: A Language and Environment for Statistical Computing. Vienna, Austria: R Foundation for Statistical Computing. https://www.R-project.org/.
Rau, G. C., Halloran, L. J. S., Cuthbert, M. O., Andersen, M. S., Acworth, R. I., and Tellam, J. H. (2017). Characterising the Dynamics of Surface Water-Groundwater Interactions in Intermittent and Ephemeral Streams Using Streambed thermal Signatures. Adv. Water Resour. 107, 354–369. doi:10.1016/J.ADVWATRES.2017.07.005
Rivers-Moore, N. A., de Moor, F. C., Birkholz, S. A., and Palmer, R. W. (2006). Estimation of Preferred Water Flow Parameters for Four Species of Simulium (Diptera: Simuliidae) in Small Clear Streams in South Africa. Afr. J. Aquatic Sci. 31, 261–269. doi:10.2989/16085910609503895
Rolls, R. J., Leigh, C., and Sheldon, F. (2012). Mechanistic Effects of Low-Flow Hydrology on Riverine Ecosystems: Ecological Principles and Consequences of Alteration. Freshw. Sci. 31, 1163–1186. doi:10.1899/12-002.1
Rosenfeld, J. S. (2017). Developing Flow-Ecology Relationships: Implications of Nonlinear Biological Responses for Water Management. Freshw. Biol. 62, 1305–1324. doi:10.1111/fwb.12948
Scullion, C., Parish, N., Morgan, J. A., and Edwards, R. W. (1982). Comparison of Benthic Macroinvertebrate Fauna and Substratum Composition in Riffles and Pools in the Impounded River Elan and the Unregulated River Wye, Mid-Wales.
Simpson, G. L. (2021). Gratia: Graceful 'ggplot'-Based Graphics and Other Functions for GAMs Fitted Using 'mgcv'. R Package Version 0.5.1. Available at: https://CRAN.R-project.org/package=gratia (Accessed January 12th, 2021).
Wohl, E. E., Vincent, K. R., and Merritts, D. J. (1993). Pool and Riffle Characteristics in Relation to Channel Gradient. Geomorphology 6, 99–110. doi:10.1016/0169-555X(93)90041-Y
Simpson, G. L. (2019). Model Selection with GAM in R. https://stats.stackexchange.com/users/1390/gavin-simpson. Available at: https://stats.stackexchange.com/questions/405129/model-selection-for-gam-in-r (Accessed January 3rd, 2021).
Sinokrot, B. A., and Gulliver, J. S. (2000). In-stream Flow Impact on River Water Temperatures. J. Hydraulic Res. 38, 339–349. doi:10.1080/00221680009498315
Solano, M. G. (2006). “Land Use Impacts on Ground and Surface Water Quality in the Bertrand Creek Watershed (Township of Langley, B.C.),” in Retrospective Theses and Dissertations, 1919-2007 (T, University of British Columbia). doi:10.14288/1.0092582
Sontek (2019). Sontek FlowTracker2 User’s Manual. Available at: http://www.sontek.com (Accessed April 25th, 2020).
Sophocleous, M. (2002). Interactions between Groundwater and Surface Water: The State of the Science. Hydrogeology J. 10, 52–67. doi:10.1007/s10040-001-0170-8
Storey, R. (2016). Macroinvertebrate Community Responses to Duration, Intensity and Timing of Annual Dry Events in Intermittent Forested and Pasture Streams. Aquat. Sci. 78, 395–414. doi:10.1007/s00027-015-0443-2
Stubbington, R., Chadd, R., Cid, N., Csabai, Z., Miliša, M., Morais, M., et al. (2018). Biomonitoring of Intermittent Rivers and Ephemeral Streams in Europe: Current Practice and Priorities to Enhance Ecological Status Assessments. Sci. Total Environ. 618, 1096–1113. doi:10.1016/j.scitotenv.2017.09.137
Stubbington, R., Wood, P. J., and Boulton, A. J. (2009). Low Flow Controls on Benthic and Hyporheic Macroinvertebrate Assemblages during Supra-seasonal Drought. Hydrol. Process. 23, 2252–2263. doi:10.1002/hyp10.1002/hyp.7290
Tang, Y., Horikoshi, M., and Li, W. (2016). Ggfortify: Unified Interface to Visualize Statistical Results of Popular R Packages. R. J. 8 (2), 474–485. doi:10.32614/RJ-2016-060
Vander Vorste, R., Mermillod-Blondin, F., Hervant, F., Mons, R., Forcellini, M., and Datry, T. (2016). Increased Depth to the Water Table during River Drying Decreases the Resilience ofGammarus Pulexand Alters Ecosystem Function. Ecohydrol. 9, 1177–1186. doi:10.1002/eco.1716
Ver Hoef, J. M., and Boveng, P. L. (2007). Quasi-poisson vs. Negative Binomial Regression: How Should We Model Overdispersed Count Data? Ecology 88 (11), 2766–2772. doi:10.1890/07-0043.1
White, J. C., House, A., Punchard, N., Hannah, D. M., Wilding, N. A., and Wood, P. J. (2018). Macroinvertebrate Community Responses to Hydrological Controls and Groundwater Abstraction Effects across Intermittent and Perennial Headwater Streams. Sci. Total Environ. 610-611, 1514–1526. doi:10.1016/j.scitotenv.2017.06.081
Wickham, H., François, R., Henry, L., and Müller, K. (2020). Dplyr: A Grammar of Data Manipulation. R package version 1.0.2. Available at: https://CRAN.R-project.org/package=dplyr.
Wickham, H. (2016). ggplot2: Elegant Graphics for Data Analysis. R package version 3.3.5. Available at: https://cran.r-project.org/web/packages/ggplot2/index.html.
Wickham, H., and Seidel, D. (2020). Scales: Scale Functions for Visualization. R package version 1.1.1. Available at: https://CRAN.R-project.org/package=scales.
Wickham, H. (2021). Tidyr: Tidy Messy Data. R package version 1.1.3. Available at: https://CRAN.R-project.org/package=tidyr.
Winter, T. C., Harvey, J. W., Franke, O. L., and Alley, W. M. (1998). Ground Water and Surface Water: A Single Resource. Uni. Stat. Geol. Surv. Circ. 1139, 1–79. doi:10.3133/cir1139
Wohl, E. E., Vincent, K. R., and Merritts, D. J. (1993). Pool and Riffle Characteristics in Relation to Channel Gradient. Geomorphology 6, 99–110. doi:10.1016/0169-555X(93)90041-Y
Wood, P. J., Agnew, M. D., and Petts, G. E. (2000). Flow Variations and Macroinvertebrate Community Responses in a Small Groundwater-Dominated Stream in South-East England. Hydrol. Process. 14, 3133–3147. doi:10.1002/1099-1085(200011/12)14:16/17<3133::aid-hyp138>3.0.co;2-j
Keywords: groundwater, instream habitat, benthic macroinvertebrates, aquifer-stream exchange, groundwater dependent ecosystem (GDE), flow cessation, intermittent stream
Citation: Mitton A and Allen D (2022) Aquifer-Stream Exchanges and the Importance of Groundwater Discharge for Maintaining Instream Habitat and Benthic Macroinvertebrates. Front. Earth Sci. 10:768836. doi: 10.3389/feart.2022.768836
Received: 01 September 2021; Accepted: 10 February 2022;
Published: 28 March 2022.
Edited by:
Eric Rosa, Université du Québec en Abitibi Témiscamingue, CanadaReviewed by:
Guillaume Grosbois, Université du Québec en Abitibi Témiscamingue, CanadaSilvia Quadroni, University of Insubria, Italy
Copyright © 2022 Mitton and Allen. This is an open-access article distributed under the terms of the Creative Commons Attribution License (CC BY). The use, distribution or reproduction in other forums is permitted, provided the original author(s) and the copyright owner(s) are credited and that the original publication in this journal is cited, in accordance with accepted academic practice. No use, distribution or reproduction is permitted which does not comply with these terms.
*Correspondence: Adam Mitton, YWRhbV9taXR0b25Ac2Z1LmNh