 Takeshi Ohba1*
 Yu Oginuma1
 Kazuto Saiki2
 Minoru Kusakabe3
 Issa4Takounjou A. Fouepe5Romaric Ntchantcho5
 Gregory Tanyileke5Joseph V. Hell5
- 1Department of Chemistry, School of Science, Tokai University, Hiratsuka, Japan
- 2Graduate School of Science, Osaka University, Suita, Japan
- 3Department of Environmental Biology and Chemistry, Faculty of Science, University of Toyama, Toyama, Japan
- 4Water Resources Manager, Flood Emergency Project, Yagoua, Cameroon
- 5Institute for Geological and Mining Research, Yaounde, Cameroon
In 1984, a limnic eruption occurred in Lake Monoun, Cameroon, and the CO2 gas released from the lake surface resulted in casualties in the neighboring communities. Subsequent scientific research revealed that the CO2 gas released from the lake surface was CO2 of magmatic origin dissolved in the lake water; however, the mechanism of that limnic eruption remains unclear. In this study, we analyzed in detail the lake-bottom bathymetry of the eastern basin, i.e., one of the three basins in Lake Monoun, to understand the mechanism of the 1984 limnic eruption. We discovered two significant depressions at the lake bottom near the scarp and obtained vertical profiles of several parameters of the lake water at the depression locations. The northeastern depression (D1) was ∼ 1.2 m deeper than the lake bottom and contained water with higher temperature and electrical conductivity and lower pH relative to the lake water. Conversely, the southern depression (D2) was ∼ 2.2 m deeper than the lake bottom, and there were no anomalies regarding its water parameters. Although the warm water discharged from the bottom of D1 was not saturated with dissolved CO2, bubbles likely existed at the bottom of D1, influenced by the partial pressure of dissolved CH4 in the lake water. Our results suggest that just before the 1984 limnic eruption, water containing high concentrations of dissolved CO2 was discharged from D1; this water would have reached the lake surface with bubbles. According to earlier numerical simulations of the limnic eruption, rising bubbles could have induced the limnic eruption. The rising bubbles entrained the surrounding lake water containing high concentrations of dissolved CO2, which amplified the flow rate of CO2 degassing from the lake water and resulted in a limnic eruption. The limnic eruption that occurred just above D1 displaced lake water on the eastern shore. It is estimated that the impact of the displaced water eroded the scarp and deposited sediment as a mound near D1. A similar mound also exists near D2, suggesting that D2 is a trace of another limnic eruption that occurred earlier than 1984. Of the three basins that make up Lake Monoun, the two smaller basins to the west have high concentrations of dissolved CO2 in their deep waters. This dissolved CO2 was not supplied from the bottom of the basins but is likely a remnant of the dissolved CO2 that existed in 2003 before the start of artificial CO2 degassing. Our results suggest that another limnic eruption occurred before 1984. Lake Monoun may have experienced several limnic eruptions in the past. If the artificial degassing of CO2 is not continued, the water released from D1, containing high concentrations of dissolved CO2, will increase the concentration of dissolved CO2 in the lake water, and the bubbles rising from D1 will cause another limnic eruption. In the future, the flux of CO2 supplied from D1 may increase and exceed the flux of CO2 removed by the artificial degassing, potentially increasing the amount of CO2 accumulated in the lake water. The regular monitoring of the CO2 amount in lake water should be also continued.
Introduction
Two maars in Cameroon, i.e., lakes Monoun and Nyos, caused natural disasters in 1984 and 1986, respectively, when CO2 was explosively released from the lake waters and resulted in casualties in the nearby communities (Tanyileke et al., 2019). Such explosive CO2 releases are known as limnic eruptions; the term was first used by J. C. Sabroux at the conference regarding the Lake Nyos disaster, which was organized by UNESCO and the Cameroon government at Yaoundé, Cameroon, in March 1987 (Sigvaldason, 1989; Halbwachs et al., 2004).
A limnic eruption is an extremely rare geological phenomenon; other than the two cases at lakes Monoun and Nyos, no other limnic eruptions have been reported. In addition, it is not known whether limnic eruptions occurred in lakes Monoun and Nyos before the 1980s. In general, magmatic eruptions are driven by the degassing of H2O dissolved in magma; conversely, limnic eruptions are driven by degassing of CO2 dissolved in lake water. During limnic eruptions, the entire lake body corresponds to the magma chamber during a magmatic eruption. Magmatic eruptions can be initiated by the depressurization of the upper part of the magma chamber; conversely, the initiation of limnic eruptions is not clear. During the limnic eruptions, lake water was blown up from the lake surface by the explosive degassing of CO2, and CO2 dissolved in the lake water mixed with the ambient air and formed an air mass with low oxygen concentration. This air mass diffused from the lake to the surrounding area (Costa and Chiodini, 2015) and suffocated the people (Baxter and Kapila, 1989). Magmatic eruptions cannot be artificially suppressed; conversely, limnic eruptions can be suppressed by artificially removing dissolved CO2 from the lake water (Halbwachs et al., 2020). Research on limnic eruptions has focused on the triggering mechanism and history of limnic eruptions in lakes Monoun and Nyos before the 1980s.
The Cameroon Volcanic Line (CVL) consists of alkaline volcanoes extending from Annobon Island in the Atlantic Ocean to the interior of the African continent (Fitton and Dunlop, 1985) and has branches within Cameroon. One of the branches extends to the east, reaching the Ngaoundéré Plateau; another branch goes to the north, reaching the Biu Plateau in Nigeria. Lake Monoun (5.579,784 °N, 10.587,654 °E) and Lake Nyos (6.438,545 °N, 10.298,798 °E) are located in the central part of the CVL.
Many maars are located on the CVL, of which 39 have been investigated by Kling (1988). Except for lakes Monoun and Nyos, no other lakes have high concentrations of dissolved CO2 in their water, thereby causing limnic eruptions (Kling, 1988). Geologically, Lake Nyos is a young maar; it formed approximately 9 ka before present (BP) according to 226Ra/230Th of the lava (Aka and Yokoyama, 2013). CO2 in lakes Monoun and Nyos is accompanied by He with a high 3He/4He ratio and MORB-type Ne (Nagao et al., 2010), suggesting the existence of mantle-derived degassing magmas beneath both lakes. Nagao et al. (2010) discovered also that magmatic He-laden water was discharged into Lake Nyos at −190 m depth, i.e., 20 m higher than the lake bottom; they suggested that the magmatic He-laden water traveled along the ring fault of a potential diatreme structure (Lockwood and Rubin, 1989). The consensus is that the driving force of the limnic eruptions was CO2 dissolved in the lake water (Kling et al., 1987; Sigurdsson et al., 1987).
To prevent the recurrence of limnic eruptions in lakes Monoun and Nyos, degassing pipes were installed in both lakes; these pipes transport deep lake water safely to the lake surface (Halbwachs et al., 2004, 2020). CO2 is separated from the lake water and diffused into ambient air. The amount of CO2 dissolved in the water of Lake Nyos was 14.8 Gmol in 2001 (Kusakabe et al., 2008), when degassing started; by 2015, the amount had been reduced to 3.9 Gmol (Ohba et al., 2015). In Lake Monoun, the amount of dissolved CO2 was 0.61 Gmol in 2003 (Kusakabe et al., 2008), when degassing started; by 2007, the amount had been reduced to 0.25 Gmol. The force transporting lake water through degassing pipes is the buoyancy of the CO2 bubbles that are separated from the lake water. When the concentration of dissolved CO2 decreases below a certain threshold, the transportation of lake water stops. Water flowing through the degassing pipe at Lake Monoun decreased significantly in 2010 (Yoshida et al., 2015), at which point the operation of the degassing pipe stopped; however, the water in Lake Monoun would inevitably become again saturated with CO2, likely resulting in limnic eruptions. A mechanical device consisting of an electric rotary pump powered by a solar panel was installed to restore the water flow in the degassing pipe at Lake Monoun, thereby successfully resuming the degassing (Yoshida et al., 2015).
By 1987, when the conference on the Lake Nyos disaster took place, there was a consensus that limnic eruptions are caused by the CO2 gas dissolved in the lake water; however, the mechanism of their early eruptive stages remained unknown, and several hypotheses were proposed. Sigurdsson et al. (1987) suggested that the limnic eruption in Lake Monoun was caused by sediment that fell to the bottom of the lake because of a landslide on the scarp of the lake and disturbed the lake water saturated with CO2. Giggenbach (1990) suggested that the limnic eruption in Lake Nyos was caused by the inflow of cold rainwater into the deeper layers of the lake, thereby lifting the CO2-saturated lake water. Kusakabe et al. (2008) proposed that limnic eruptions at Lake Monoun occurred spontaneously without any triggering events.
Woods and Phillips (1999) conducted laboratory experiments and numerical analyses regarding Lake Nyos, when its lake water contained high concentrations of CO2; they found that the upwelling of a small amount of CO2 bubbles at the bottom of the lake could be magnified 104–105 times at the lake surface, thereby resulting in a limnic eruption. Kozono et al. (2016) estimated numerically that the upwelling of small CO2 bubbles in the middle depths of Lake Monoun could be amplified, thereby leading to a limnic eruption. Elucidating the mechanism of limnic eruptions is important for forecasting potentially catastrophic future limnic eruptions. In this study, we attempted to elucidate the limnic eruption process at Lake Monoun based on the detailed lake-bottom bathymetry obtained by Alain et al. (2019) and the original observations of CO2-enriched lake water.
Materials and Methods
The most important material in this study was a detailed bathymetric map of the bottom of Lake Monoun. The following information is necessary for interpreting the lake-bottom bathymetry. According to Sigurdsson et al. (1987), lava flowing from the Mfomben Crater dammed the Panke River and formed Lake Monoun (Figure 1); after the formation of Lake Monoun, the Makwet scoria cone adjacent to Lake Monoun was deposited. Although the radioactive formation age of Lake Monoun has not been obtained, the age of the last eruptive activity in the area surrounding Lake Monoun may have been a few centuries ago, considering the young volcanic topography of the Makwet scoria cone (Sigurdsson et al., 1987). Lake Monoun is a part of the Panke River; the river water enters the lake through the northeast inlet, and the lake water exits the lake through the west outlet. According to Sigurdsson et al. (1987), the 1984 limnic eruption caused waves of 5 m higher than the surface, which crashed onto the eastern shore of Lake Monoun (W in Figure 1). These large waves destroyed the vegetation within 100 m from the shore.
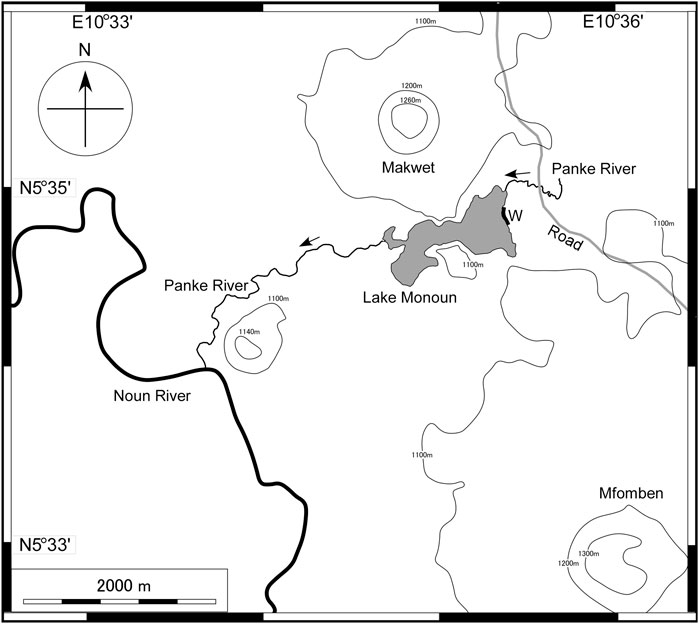
FIGURE 1. Location of Lake Monoun in Cameroon. The shaded region indicates lake water. Arrows indicate the direction of river flow. W is the area affected by the waves generated during the limnic eruption in 1984 (Sigurdsson et al., 1987).
The bathymetric map of the lake bottom shown in Figure 2 was obtained through a multibeam sonar survey conducted in November 2014 (Alain et al., 2019). An image of the basin with resolution higher than that of Figure 2 is provided as the supplementary figure. The high-resolution image was analyzed for extracting features that seemed to be related to the 1984 limnic eruption.
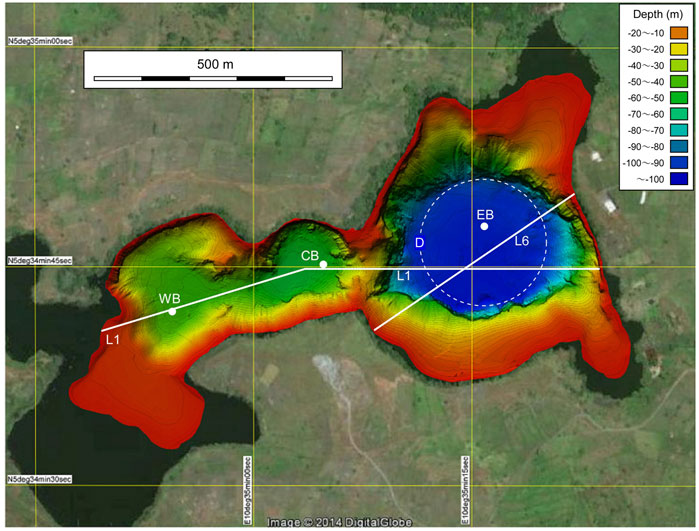
FIGURE 2. Bathymetries of the three basins WB, CB, and EB in Lake Monoun. Dots indicate the location of CTD measurements. The vertical cross sections along lines L1 and L6 are shown in Figure 3A, Figure 9, respectively. D is a potential diatreme ring fault, assuming that the shape of the fault is a true circle, and the fault includes D1, D2, and D3.
We obtained vertical profiles of temperature, electrical conductivity, and pH using a CTD probe (Ocean Seven Model 316, IDRONAUT) at several points in the lake in 2015. After submerging the probe in the lake water, temperature, electrical conductivity, and pH were measured every second. In situ lake-water sampling revealed the total concentration of carbonate species. Owing to the high concentration of dissolved CO2, effervescence from deep water reaching the surface would result in loss of most of dissolved CO2; to address this problem, a plastic syringe containing 10 ml of 5 M KOH solution was used (Kusakabe et al., 2000). This method is known as the “MK method.” The syringe was attached to a mechanical device and would be sent to the desired depth, where approximately 30 ml lake water would be obtained by the syringe. The amount of sampled lake water would be determined more accurately based on the weight difference of the syringe before and after sampling. Each sample was analyzed in the laboratory for the total carbonate content (i.e., CO2aq + HCO3‾ + CO32‾) using the microdiffusion–titration method (Conway, 1950). This total concentration of carbonate species is denoted as Ct. In this study, CO2 dissolved in lake water is expressed as “CO2aq” and was the driving force behind the limnic eruption; however, the CO2aq concentration cannot be measured directly and was theoretically estimated from the Ct and pH values of lake water. The advantage of the MK method is its high accuracy in determining Ct values. The analytical error of the method is approximately ±2.5 mmol/L. The data from the CTD probe were combined with the analytical results of the MK method to estimate the CO2aq concentration profile.
Results
Based on the high-resolution images obtained from the multibeam sonar survey (Alain et al., 2019), three basins were recognized within Lake Monoun (Figure 2). The maximum depths in the eastern basin (EB), central basin (CB), and western basin (WB) were −100, −56, and −44 m, respectively (Figure 2). To define the water exchange between basins, the depth profile, as shown in Figure 3A, was obtained along line L1 (Figure 2), which passed through the saddles on the ridges separating WB, CB, and EB. The depth of the ridge separating WB and CB was −42 m, i.e., 2 m higher than the bottom of WB. Below −22 m depth, the waters in WB and CB mixed laterally (Figure 3A). The depth of the ridge separating CB and EB was −22 m, i.e., 34 m higher than the bottom of CB. Below −22 m depth, the waters in CB and EB could not be laterally mixed (Figure 3A).
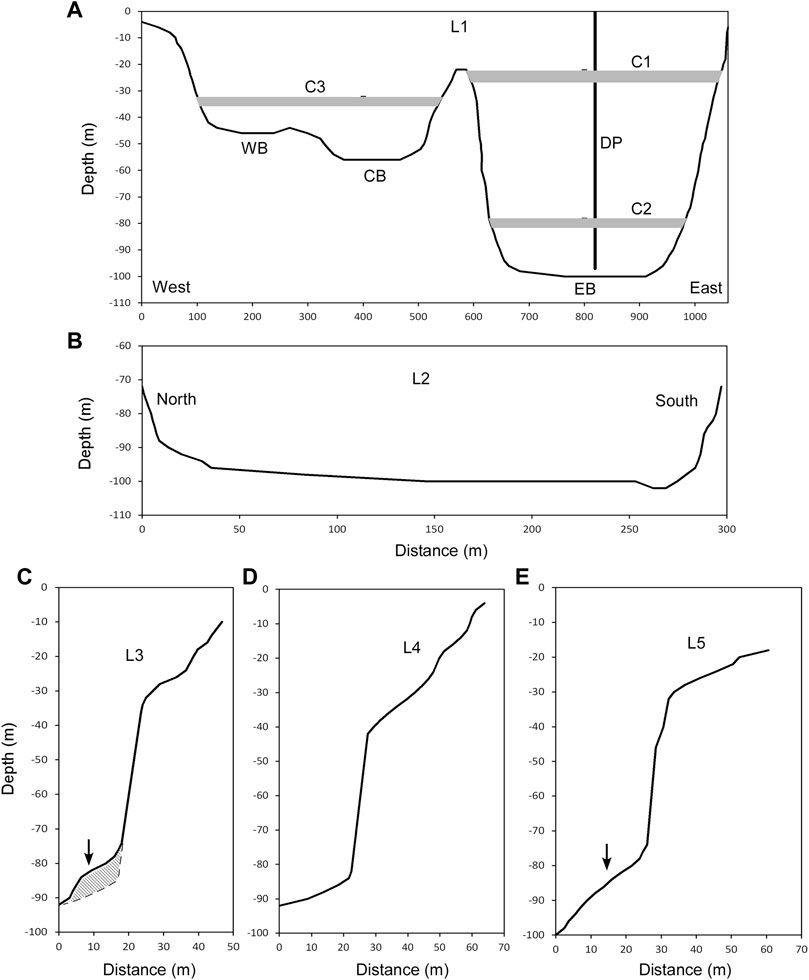
FIGURE 3. Cross sections in Lake Monoun. (A) Cross section along L1 in Figure 2. C1 is the shallow chemocline in 2003. C2 and C3 are the chemoclines in 2015. DP is an artificial degassing pipe with 97 m length. (B) Cross section along L2 in Figure 4. (C) Cross section along L3 in Figure 4. The arrow indicates the position of M1. The shaded area indicates the body of M1. (D) Cross section along L4 in Figure 4. (E) Cross section along L5 in Figure 4. The arrow indicates the position of M2.
The bathymetric features of EB were extracted (Figure 4) by visual inspection of the supplementary high-resolution images. Three major depressions (i.e., D1, D2, and D3) were found in the area near the basin scarp. The depths at points p1 and p1o were −98.3 and −97.1 m, respectively. The depth ranging from −98.3 to −97.1 m corresponds to the interior of D1. The depth of D1 relative to the surrounding lake bottom was 1.2 m. The depths at points p2 and p2o were −102.1 and −99.9 m, respectively. The depth ranging from −102.1 to −99.9 m corresponds to the interior of D2. The depth of D2 relative to the surrounding lake bottom was 2.2 m. The depth of D3 relative to the surrounding lake bottom was not precisely determined but appeared to be approximately 1 m or less. Besides the aforementioned major depressions, small depressions were also evident (blue spots in Figure 4). Four major mounds (i.e., M1, M2, M3, and M4) were found near the scarp of the basin. Besides the aforementioned major mounds, smaller mounds were also evident (red spots in Figure 4). Many grooves (green curves in Figure 4) were evident on the scarp of the basin. Most of the grooves were located in the northern half of the scarp. An area free of grooves was found on the northern wall of the basin (F in Figure 4). This area is adjacent to a small ridge (R in Figure 4).
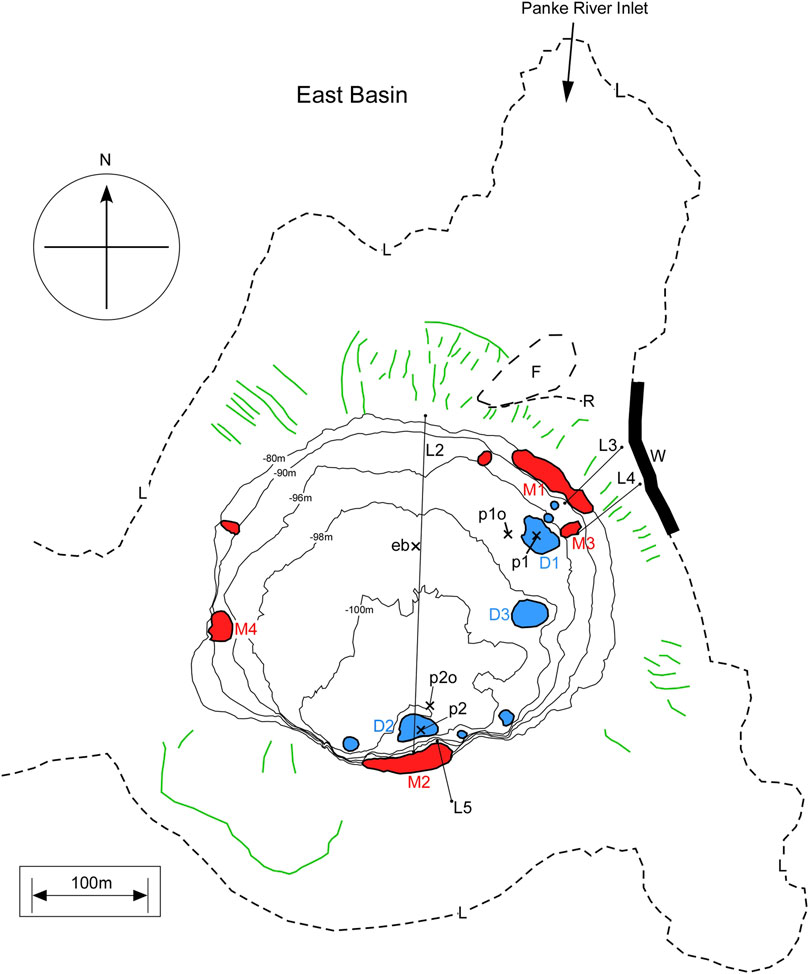
FIGURE 4. Bathymetric features found in EB. The dashed line L indicates the outline of the lake water. The green curves indicate the grooves on the scarp of the basin. F is the region free of grooves. R is a small ridge on the scarp of the basin. W is the area affected by the wave generated by the 1984 limnic eruption (Sigurdsson et al., 1987). The red areas (i.e., M1, M2 M3, M4 and other small ones) indicate the mounds. The blue areas (i.e., D1, D2, D3 and other small ones) indicate the depressions. Points p1, p1o, p2, p2o, and eb are the locations of CTD measurements. The vertical cross sections are drawn in Figure 3 along lines L2, L3, L4, and L5. The thin-solid curves are the depth contours.
Figure 3B shows the depth profile along line L2 in Figure 4. The EB was gently inclined from north to south. The cross sections along lines L3, L4, and L5 in Figure 4 are shown in Figures 3C–E, respectively. Lines L3 and L5 straddle mounds M1 and M2, respectively. The depth profiles along lines L3 and L5 revealed a raised section in the corresponding mound section (Figures 3C,E).
The temperature, electrical conductivity (C25), and pH of the lake water were measured along the depth of each basin using a CTD probe, in which C25 is the electrical conductivity normalized at 25°C using the following equation:
where C is the raw electrical conductivity measured at Tc (°C). On 28 February 2015, CTD observations were conducted at points p1, p1o, p2, p2o, and eb (Figure 4). On 1 March 2015, CTD observations were conducted at the points of the closed circles in WB and CB (Figure 2). The closed circle for EB in Figure 2 is identical to point eb in Figure 4. The measured temperature, C25, and pH values are shown in Figures 5A–C, respectively.
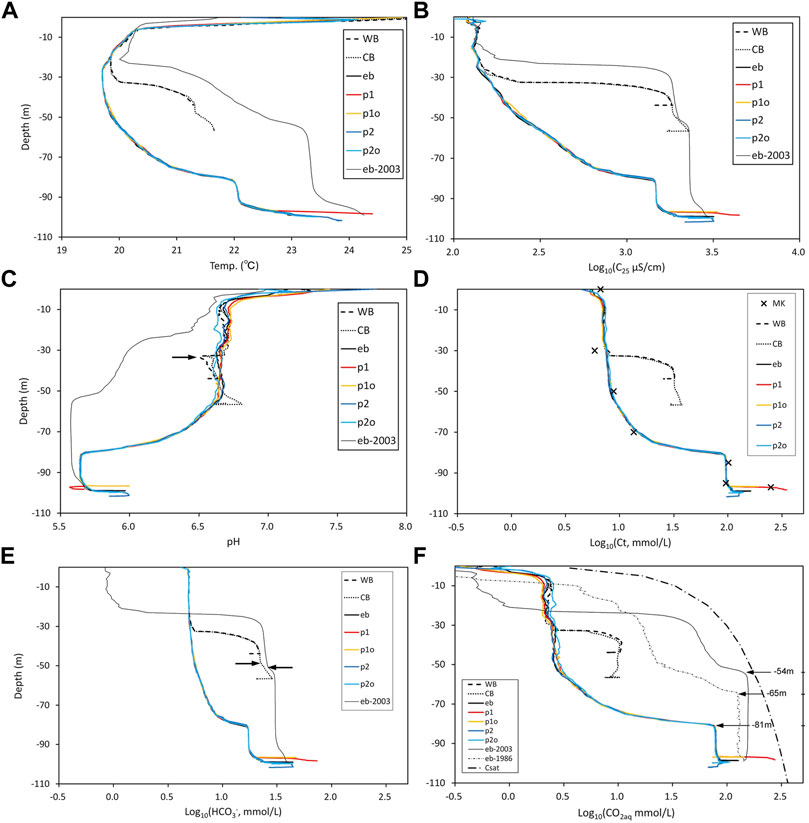
FIGURE 5. Vertical profiles in Lake Monoun. (A) Temperature profiles measured in 2015 at point eb in Figure 4 along with the profile in 2003 (Kusakabe et al., 2008).(B) C25 profiles in 2015 at point eb in Figure 4 along with the 2003 profile (Kusakabe et al., 2008). The x-axis is the logarithm of C25 (µS/cm).(C) pH profiles in 2015 at point eb in Figure 4 along with the 2003 profile (Kusakabe et al., 2008).(D) Estimated Ct profiles in 2015 along with the Ct (“x”) measured using the MK method. The x-axis is the logarithm of Ct (mmol/L).(E) Estimated [HCO3‾] profiles along with the 2003 profile measured at point eb in Figure 4. The x-axis is the logarithm of [HCO3‾] (mmol/L). (F) Estimated [CO2aq] profiles at point eb in Figure 4 along with the 1986 and 2003 profiles (Kusakabe et al., 2008). The bold dashed and dotted line indicates the saturated [CO2aq]. The x-axis is the logarithm of [CO2aq] (mmol/L). The depths of the [CO2aq] chemocline in 1986, 2003, and 2015 were −65, −54, and −81 m, respectively, as indicated by arrows.
The temperature profile of Lake Monoun has features that are not found in ordinary lakes (Figure 5A). In EB, the temperature at the surface was high, while it reached a minimum at approximately −30 m depth. Further below, the temperature increased as the depth increased, and a thermocline appeared at approximately −80 m depth. Under the thermocline, a mixed layer of approximately 10 m thick was developed. Under the mixed layer, the water temperature increased further toward the bottom of the lake. In WB and CB, the thermocline appeared at approximately −33 m depth. Below the thermocline, the temperature increased slightly toward the bottom of WB and CB. Toward the bottom of WB, the temperature profile in CB was almost identical to that in WB. Over the entire depth range, excluding the surface, the temperature in EB significantly decreased relative to the temperature in 2003 (Kusakabe et al., 2008).
C25 in EB was low and approximately constant from the surface to approximately −30 m depth (Figure 5B); further below, it increased with depth, and a chemocline appeared at approximately −80 m (the term “chemocline” used here refers to the boundary in which the chemical properties of lake water change rapidly). Below the chemocline, a mixed layer of approximately 10 m thick was developed. Under the mixed layer, C25 increased toward the bottom of EB. The C25 profiles in WB and CB revealed chemoclines at approximately −33 m depth (Figure 5B). C25 in CB increased in the layer below the chemocline toward the bottom. The highest C25 value in the CB profile was close to the C25 value observed in 2003 at EB. Over the entire depth range, except for the surface and near the bottom, C25 in EB decreased significantly relative to C25 in 2003.
The pH of the lake water in WB, CB, and EB was weakly alkaline near the surface (Figure 5C). In EB, the lake water was close to neutral, and the pH was almost constant from −10 to −50 m depth. Further below, the pH fell with increasing depth, and a chemocline appeared at approximately −80 m depth. Below the chemocline, a mixed layer of approximately 10 m thick was developed. Below the mixed layer, the pH rose toward the lake bottom. The pH profiles in WB and CB were different from those in EB, exhibiting left-pointing “projections” locally falling pH at the chemocline at around −33 m depth (right arrow in Figure 5C). Over the entire depth range, except for the surface and near the bottom, the pH in EB significantly rose relative to the pH in 2003.
Figure 6 shows the profiles in Figure 5 enhanced near the bottom of EB. At all points, temperature increased toward the lake bottom (Figure 6A). Except for the profile at point p1, the thermal gradient (i.e., −dT/dz; T: temperature; z: depth) was common and almost constant, suggesting an established stable thermal gradient in the lake water near the bottom. Inside D1, the thermal gradient was high, suggesting discharged hot water at the bottom of D1. However, the thermal gradient inside D2 was similar to that at points other than p1. At point p1, C25 increased toward the bottom, where the highest C25 value was recorded (Figure 6B), suggesting discharged high C25 water at the bottom of D1. At points eb and p1o, C25 sharply increased at the lake bottom. At point p2o, C25 peaked before reaching the lake bottom. The interior of D2 was filled with high C25 water, with values close to the maximum value at point p2o. At point p2, C25 decreased toward the bottom, suggesting no discharge of water with high C25 within D2. At point p1, the pH started to fall at the upper limit of D1 and then turned to rise toward the bottom (Figure 6C). At points p1, p1o, and eb, pH rose at the lake bottom. At point p2o, the pH peaked before the bottom. The interior of D2 was filled with high-pH water; the value was close to the maximum value at point p2o. At point p2, the pH fell at the bottom, suggesting no discharge of water with high pH at the bottom of D2.
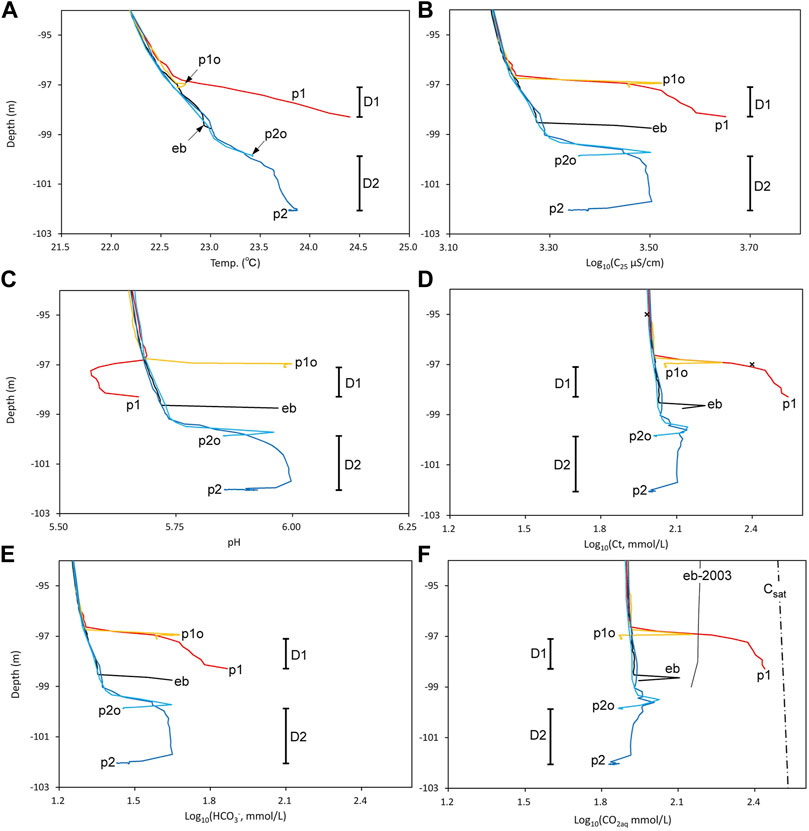
FIGURE 6. Profiles below −94 m depth in EB. (A) Temperature, (B) Log (C25 µS/cm), (C) pH, (D) Log (Ct mmol/L), (E) Log ([HCO3‾] mmol/L), and (F) Log ([CO2aq] mmol/L). Vertical bars indicate the ranges of depth inside D1 and D2. In (F), the CO2aq saturation curves and the profile in 2003 (Kusakabe et al., 2008) measured at point eb in Figure 4 are indicated.
On 2 March 2015, lake water was collected at point p1 using the MK method. Supplementary Table S1 lists the Ct values determined by the MK method. The Ct values are plotted in Figure 5D, Figure 6D. Supplementary Table S1 also presents the theoretically estimated [CO2aq] and [HCO3‾] based on the chemical equilibrium among CO2aq, HCO3‾, and CO32‾ (in this study, brackets, i.e., [ ] indicate the concentration of chemical species in mmol/L). The theoretical relationship between [HCO3‾] and Ct is given by the following equation (Stumm and Morgan, 1996):
Here, aH is the activity of H+ ion given by,
Ka1 and Ka2 in Equation 2 denote the acidity constants of CO2aq and HCO3‾, respectively. Ka1 and Ka2 are functions of temperature, and the concrete formula is given by Ohba et al. (2015). γHCO3 and γCO3 in Equation 2 are the activity coefficients of HCO3‾ and CO32‾, respectively, given by the Davies equation (Butler, 1991):
where z, I, and T denote the charge of the species, ionic strength, and temperature in Kelvin, respectively. Based on the cationic composition of the water at −96.5 m depth in Lake Monoun in 2006 (Kusakabe et al., 2008), I can be estimated as follows:
[HCO3‾] was calculated from Ct using the following procedure:
Step 1. γHCO3 and γCO3 were initially set equal to 1.
Step 2. Ka1 and Ka2 were calculated from the temperature of the lake water.
Step 3. aH was calculated from the pH of the lake water.
Step 4. Substituting the above values into Equation 2, the initial [HCO3‾] was calculated from Ct obtained using the MK method.
Step 5. Substituting the initial [HCO3‾] into Equation 5, I was obtained.
Step 6. Substituting the ionic strength, ion charge, and lake water temperature into Equation 4, γHCO3 and γCO3 were obtained.
Step 7. Finally, steps 2, 3, and 4 were repeated.In general, the electrical conductivity (C25) of lake water is proportional to the concentration of the dissolved ions. According to Kusakabe et al. (2008), the main anion contained in the lake water of Lake Monoun was HCO3‾. The concentrations of anions other than HCO3‾, such as Cl‾ and SO42‾, were negligibly lower than [HCO3‾]. Therefore, a positive correlation is expected between C25 and [HCO3‾]. Figure 7 depicts C25 versus [HCO3‾] (Supplementary Table S1), in which the correlation is approximated by the following quadratic equation in terms of C25:
where x and y denote C25 and [HCO3‾], respectively. Based on Equation 6, the C25 profiles were converted to continuous profiles of [HCO3‾], as shown in Figures 5E, 6E. The Ct profiles can be calculated from the [HCO3‾] profile using Equations 2–5. The Ct profiles are shown in Figures 5D, 6D and are consistent with the discrete Ct values obtained using the MK method. [CO2aq] is obtained from [HCO3‾] using the following equation:
Since [CO32‾] is less than one-thousandth of [HCO3‾] at a pH of 7.3 or lower, [CO32‾] can be safely neglected in the case of Lake Monoun, while [CO2aq] can be simply expressed as the difference between Ct and [HCO3‾] as follows:
The obtained [CO2aq] profiles are shown in Figures 5F, 6F.The Ct profiles at all points exhibited almost constant values from the surface to approximately −33 m depth (Figure 5D). At points in WB and CB, a chemocline appeared at −33 m depth; at points outside WB and CB, a chemocline appeared at around −80 m depth, while a mixed layer of approximately 10 m thick was developed below. The characteristics of the Ct profile (Figure 5D) are similar to those of the C25 profile (Figure 5B); nevertheless, they exhibit the following differences: the C25 value at the bottom of CB was close to the C25 value at the bottom of points eb, p2, and p2o (Figure 5D), whereas the Ct value at the bottom of CB was only one-tenth of the Ct value at the bottom of points eb, p2, and p2o (Figure 5D). At point p1, Ct continued to rise toward the lake bottom within D1 (Figure 6D), suggesting the discharge of high-Ct water at the bottom. At point p1o, adjacent to point p1, Ct peaked near the bottom (Figure 6D). Point p2, in the interior of D2, was filled with water; the value of Ct at point p2 was slightly higher than that of the ambient lake water represented by the water at point eb, except for near the bottom. The Ct value at point p2 decreased at the lake bottom, suggesting that no high-Ct water was discharged at the bottom of D2. The Ct values at points eb and p2o peaked near the lake bottom (Figure 6D). The [HCO3‾] profiles (Figure 6E) were similar to the Ct profiles (Figure 6D), except for points p1o and eb, in which [HCO3‾] did not decrease at the lake bottom. The [CO2aq] profiles (Figure 6F) were similar to the Ct profiles (Figure 6D). Allowing equilibrium between CO2aq and HCO3‾, the [HCO3‾]/[CO2aq] ratio was 0.19 and 0.43, respectively, when the pH was 5.65 and 6.00, which was the pH range of lake water below −95 m depth (Figure 6C). The similarity between the [CO2aq] and Ct profiles is reasonable, considering the dominance of CO2aq over HCO3‾. At point p1, [CO2aq] increased toward the lake bottom, suggesting the discharge of high-[CO2aq] water at the bottom of D1. Inside D1, [CO2aq] exceeded the value observed at point eb in 2003 (Figure 6F), suggesting that the high-[CO2aq] water at the bottom of D1 could be the source of the high-[CO2aq]-mixed layer developed below the chemocline at approximately −81 m depth. The [CO2aq] profile at point p1 did not reach the saturation concentration of CO2aq estimated using Henryʼs constant of CO2 (Fernandez-Prini et al., 2003).
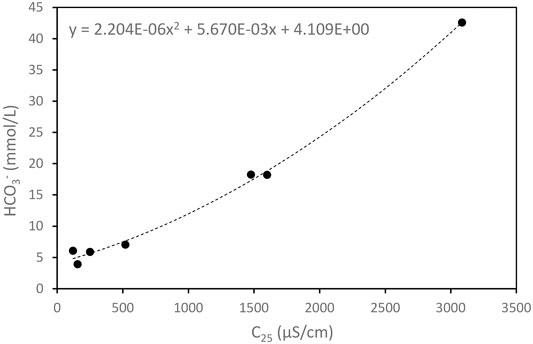
FIGURE 7. Correlation between the HCO3‾ concentration and electrical conductivity. The correlation was approximated by the quadratic equation as shown in the figure.
Discussion
Three large depressions, i.e., D1, D2, and D3, were found at the bottom of EB, and hot water rich in CO2aq and HCO3‾ was discharged at the bottom of D1. However, within D2, [CO2aq] and [HCO3‾] decreased toward the bottom, indicating no discharge of water rich in CO2aq and HCO3‾. At points p1o, eb, and p2o, [CO2aq] peaked above the lake bottom (Figure 6F). The [CO2aq] peak height was the highest at p1o, followed by eb and p2o, while it decreased with distance from D1 (Figure 4). The above observations suggest the wide horizontal distribution of high-[CO2aq] hot water along the bottom of EB.
At points p1o and eb, pH rose sharply at the lake bottom (Figure 6C). The pH behavior indicated that the [HCO3‾]/[CO2aq] ratio increased near the lake bottom. The [HCO3‾]/[CO2aq] ratio and pH are related through the following formula:
FeCO3 siderites were present in the bottom sediments of Lake Monoun, and the lake water near the bottom was supersaturated with respect to FeCO3 (Sigurdsson et al., 1987). Fine FeCO3 particles could be suspended in the lake water near the bottom. The pH increase, i.e., the [HCO3‾]/[CO2aq] ratio increase, near the bottom of the lake is indicative of the reaction between CO2aq and FeCO3 particles as follows:
In the above reaction, 1 mol CO2aq is consumed, and 2 mol HCO3‾ is generated; when it occurs, the [HCO3‾]/[CO2aq] ratio as well as the pH rises. Figure 8A shows the relationship between water temperature and [HCO3‾] below −95 m depth. As shown, LW is an end-member representing the lake water. The water temperature, [CO2aq], and [HCO3‾] of LW were assumed to be 22.3°C, 80 mmol/L, and 18 mmol/L, respectively. End-member E2 represents lake water after reaction with FeCO3. The temperature, [CO2aq], and [HCO3‾] of E2 were assumed to be 23.9°C, 74 mmol/L, and 30 mmol/L, respectively. Through the reaction, the [CO2aq] decrease of LW was 6 mmol/L, and the [HCO3‾] increase was 12 mmol/L. The data points distributed on the line connecting LW and E2 (Figure 8A) indicate a linear relationship between temperature and [HCO3‾] near the lake bottom, especially in the range of low [HCO3‾]. The hot water at the bottom of D1 is assumed to be end-member E1. As shown in Figure 8A, the lake water located in the area to the right of the line connecting LW and E2 can be a mixture of LW and E1. Figure 8B shows the relationship between [CO2aq] and [HCO3‾] below −95 m depth. The bottom-water compositions at points p2 and p2o were close to E2, suggesting that the bottom water at p2 and p2o was lake water reacting with FeCO3. The other points cannot be easily explained by a simple mixture of LW and E1. As shown by the red dashed line and arrow, if mixing between LW and E1 is followed by the reaction with FeCO3, the observed relationship between [CO2aq] and [HCO3‾] can be explained because [HCO3‾] increases and [CO2aq] decreases, as indicated by the red arrow.
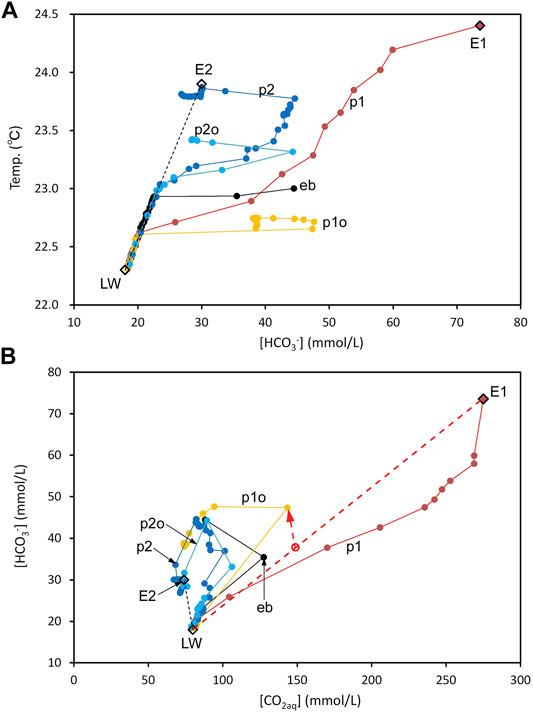
FIGURE 8. Correlations among the temperature, [HCO3‾], and [CO2aq] in lake water below −95 m depth. (A) Correlation between temperature and [HCO3‾]. LW is the end-member representing lake water. E2 is the end-member representing lake water reacted with postulated FeCO3 particles. E1 is the end-member representing lake water at the bottom of D1. (B) Correlation between [HCO3‾] and [CO2aq]. The red dashed line and arrow indicate the formation process of water located above the line connecting LW and E1, namely, a simple mixture between LW and E1, followed by the reaction with postulated FeCO3 particles suspended in the lake water.
In the numerical simulation of limnic eruptions by Kozono et al. (2016), the following initial conditions were adopted: the lake water was saturated with CO2 at approximately −50 m depth. The [CO2aq] of the lake water below −50 m depth was equal to [CO2aq] at −50 m depth. Below −50 m depth, the lake water was unsaturated with CO2. The conditions described previously were based on the CO2aq profile (eb-2003 in Figure 5F) observed by Kusakabe et al. (2008). Sigurdsson et al. (1987) supposed that the lake water was supersaturated with respect to CO2aq before the 1984 limnic eruption, which was triggered by the disturbance of the lake water by a landslide. However, in the initial condition by numerical simulation, the lake water below −50 m depth is unsaturated with CO2. Actually, in 1986, when 2 years later of limnic eruption, the [CO2aq] of lake water deeper than −65 m was unsaturated with respect to CO2aq (Figure 5F). The falling sediment displaced lake water from near the chemocline to the deep layer. Because the difference between the CO2 partial pressure of the displaced lake water and the surrounding pressure increases, degassing of CO2 from the displaced lake water is not likely to occur. Therefore, it is unlikely that any falling sediment triggered the limnic eruption.
In this study, [CO2aq] at the bottom of D1 was estimated to be 275 mmol/L. From Henryʼs constant of CO2 (Fernandez-Prini et al., 2003), the equilibrium gas pressure of CO2 was estimated to be 8.2 × 10⁵ Pa, which was lower than the hydrostatic pressure at the lake bottom (i.e., 1.0 × 10⁶ Pa). At the bottom of D1, CO2aq was unsaturated. According to Issa et al. (2013), CO2 dissolved in the water of Lake Monoun was accompanied by CH4; they found that the contributions of CO2 and CH4 to the total pressure of the gas phase equilibrated with water near the lake bottom were 63 and 37%, respectively. This suggests that the total gas pressure in equilibrium with the lake water could be 1.3 × 10⁶ Pa, thereby exceeding the hydrostatic pressure, and the bubbles consisting of CO2 and CH4 were always present at the bottom of D1.
Sigurdsson et al. (1987) discovered a trace of a landslide in W, as shown in Figure 4. Mound M1 is located close to W, and it has likely formed by the sediment slumped from W. All mounds at the bottom of the EB were located along the scarp of the basin. The volume of M1 can be estimated by comparing the cross section along L3, which straddles M1, and the cross section along L4 (Figures 3C,D). The shaded area in Figure 3C corresponds to the body of M1 by comparing the cross sections and assuming that the terrain below M1 is equal to the cross section along L4. The cross-sectional area, length, and volume of M1 were 73 m2, 83 m, and 6 × 10³ m3, respectively. The horizontal cross-sectional area of the EB at −50 m depth was 1.02 × 10⁵ m2. If the entire mass of M1 slumped from W, then the mass pushed the chemocline at −50 m depth upward by approximately 0.06 m.
According to the limnic eruption scenario of Sigurdsson et al. (1987), a landslide occurred at W, and the collapsed sediment agitated the lake water near the bottom, thereby triggering the limnic eruption. What role does D1 play in the limnic eruption scenario described by Sigurdsson et al. (1987)? D1 was an outlet for hot water supplying CO2aq, which was the driving force of limnic eruption. In the limnic eruption scenario of Sigurdsson et al. (1987), D1 can play its role regardless of its location at the bottom of the lake. Because M1 is located directly under W, M1 is considered to be sediment deposited by a landslide. D1 does not necessarily need to be adjacent to M1. In the limnic eruption scenario of Sigurdsson et al. (1987), the coupling of M1 and D1 was considered to be a coincidence; however, in our limnic eruption model, the coupling of M1 and D1 is not a coincidence but an inevitable consequence.
As shown in Figure 5F, [CO2aq] near the bottom of the lake in 1986, 2003, and 2015 was similar and approximately equal to 160 mmol/L, suggesting that the hot water with high [CO2aq] discharging at D1 was diluted by the lake water with low [CO2aq]. The mixing ratio between the two waters was probably constant throughout the period between 1986–2015. It is likely that the sustained discharge of hot water with high [CO2aq] at D1 occurred even before the 1984 limnic eruption.
Woods and Phillips (1999) reproduced the limnic eruption in Lake Nyos at −210 m depth through laboratory experiments and numerical analysis. They found that a small amount of CO2 bubble flow at the lake bottom entrained CO2aq-saturated lake water, and the rising flow was strengthened by CO2 degassing. The CO2 flux at the lake surface could reach 105 times that at the bottom of the lake. Under the initial conditions in the numerical simulation by Kozono et al. (2016) for Lake Monoun, the lake water is only saturated with CO2aq at −50 m depth, and a slow upward flow of lake water (i.e., >0.01 m/s) near −50 m depth is necessary for initiating the first degassing of CO2 (Figure 9A). Kozono et al. (2016) suggested a perturbation of the layer boundary caused by double-diffusive convection and a seiche induced by external forcings, such as strong wind causing the slow updrift of lake water. In this study, we propose that bubbles rising from D1 cause a slow upward flow of lake water. The first degassing of CO2 generates buoyancy in the lake water, and a parcel of lake water containing CO2 bubbles starts to rise. The rising parcel of lake water entrains lake water enriched in CO2aq below −50 m depth (Figure 9B). The degassing of the entrained lake water increases the rising speed. The increased velocity of lake water results in explosive degassing (i.e., limnic eruption). Considering the chemocline of [CO2aq] in 1986 (Figure 5F), the layer above −65 m depth suffered degassing. The slow upward flow of lake water around −50 m depth was the “seed” of the limnic eruption. The hot water discharged from D1 was accompanied by bubbles. The bubbles rising from D1 and reaching −50 m depth probably produced a slow upward flow of lake water (Figure 9A). As shown in Figure 9B, the 1984 limnic eruption was likely initiated above D1. The lake-water wave generated by the limnic eruption impacted the lake shoreline at W, thus causing a landslide and resulting in the M1 deposits. In this model, the coupling between D1 and M1 was not a coincidence but an inevitable consequence.
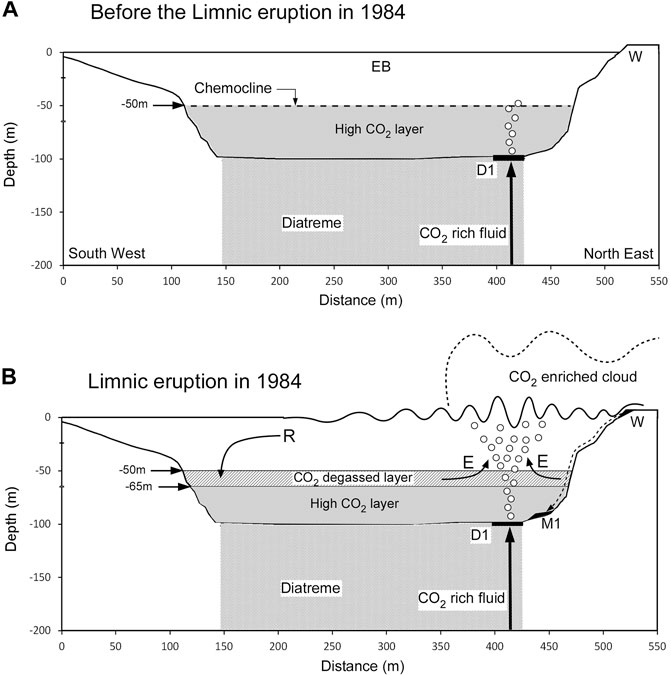
FIGURE 9. Estimated structure beneath Lake Monoun and the situation of limnic eruption.(A) Presumed situation in EB of Lake Monoun before the 1984 limnic eruption. The shape of the basin corresponds to the cross section along line L6 in Figure 2. The lake water at −50 m depth was assumed to be saturated with respect to CO2aq, based on the CO2aq profile in 2003 (Kusakabe et al., 2008). The layer below −50 m depth was undersaturated with respect to CO2aq. A CO2-rich fluid was transported along the diatreme ring fault and discharged at the bottom of D1. The discharged water at the bottom of D1 was accompanied by bubbles. The bubbles would rise to the chemocline developed at −50 m depth. (B) Presumed situation of the 1984 limnic eruption. E: entrainment of high-CO2aq lake water into the ascending turbulent flow of CO2 bubbles, which amplified the CO2 flux at the lake surface. W: east shore of Lake Monoun impacted by the waves generated by the limnic eruption. A landslide started at W, and the mound M1 was deposited beside D1. R: return flow depleted in CO2aq, which invaded the high-CO2aq layer above −65 m depth, which was the depth of the [CO2aq] chemocline in 1986 (Figure 5F).
The coupling of D2 and M2 may be the trace of another limnic eruption before 1984, strongly implying the probability of future recurrence of limnic eruptions at Lake Monoun if the artificial CO2 degassing stops. Shanklin (1992) collected oral testimonies by several traditional ethnic groups in the area near Lake Monoun from 1981 to 1986. Several oral testimonies showed that the lake exploded, and subsequently the ethnic groups left the lake area. The oral testimonies suggest that limnic eruptions have occurred in the past at Lake Monoun or another lake, which is consistent with the idea that the coupling of D2 and M2 is likely the trace of a limnic eruption that occurred before 1984.
Many grooves were observed on the scarps of EB (Figure 4). It is likely that the waves generated by the limnic eruption collided with the scarp, thereby destabilizing the surface layer while part of the surface layer collapsed to form grooves. The distribution of grooves was limited to the slopes of the northern half, suggesting that the waves arriving at the southern shore were weak. These probabilities are consistent with the estimation that the starting point of the limnic eruption was directly above D1 and far from the southern shore. Near the inlet of the Panke River, there was an area free of grooves (F in Figure 4). As shown in Figure 3B, EB gently inclined from north to south. It is likely that the gentle inclination was caused by the sedimentation of suspended materials carried by the Panke River, which flowed into EB from the north side. The grooves in area F may have been filled with a suspended material carried by river water, thereby erasing the grooves.
A diatreme structure generally develops beneath a maar (Lorenz, 1973). Nagao et al. (2010) suggested that CO2-rich fluid rose along the ring fault of the potential diatreme structure developed beneath Lake Nyos. In Lake Monoun, D1, D2, D3, and other small depressions are distributed on the bottom of EB along its scarp. This distribution suggests that a diatreme structure also exists beneath Lake Monoun (Figure 2), while the CO2-containing fluid rose along the ring fault of the diatreme and was discharged on D1. However, D2 seems to be a trace of the outlet, in which CO2-enriched water was discharged before 1984.
The [HCO3‾] profile near the bottom of CB in 2015 was similar to that of EB in 2003 (Figure 5E). For example, in 2003, the [HCO3‾] value near the bottom of CB was close to the [HCO3‾] value at the same depth in EB. Furthermore, the [HCO3‾] profile in CB had a bending point near −49 m depth (right arrow in Figure 5E). The [HCO3‾] profile in EB in 2003 also had a bending point at −50 m depth (left arrow in Figure 5E). This suggests that the estimated profiles in WB and CB in 2003 were identical to those in EB in 2003, and the [HCO3‾] profiles in WB and CB in 2015 were remnants of the profile established in 2003. As shown in Figure 3A, the depth of the EB chemocline in 2003 was close to the depth of the saddle between CB and EB. By 2003, the dense lake water that had accumulated in the hypolimnion of EB may have flowed into CB and WB beyond the saddle. Here, the hypolimnion is the region beneath the chemocline where mass transfer is restricted to and from the shallow layer of lake water. Since 2003, when artificial degassing began, the EB chemocline has deepened rapidly; however, the dense lake water that flowed into CB and WB could not return to the EB beyond the saddle and was left behind as of 2015.
The [CO2aq] profiles in WB and CB in 2015 were almost vertical toward the lake bottom (Figure 5F), suggesting no discharge of high-[CO2aq] water at the bottoms of WB and CB. In 2015, the highest [CO2aq] value in WB and CB was 10.8 mmol/L at −39 m depth, which was much lower than the [CO2aq] value of 58.7 mmol/L in EB in 2003 at the same depth. Considering the above difference in [CO2aq] and the similar [HCO3‾] profiles, CO2aq in the hypolimnion of WB and CB was preferentially lost. The difference between the properties of CO2aq and HCO3‾ is that the former has no electrical charge, whereas the latter has an electrical charge. Therefore, CO2aq escapes as it can diffuse into the atmosphere as gas through the lake surface while HCO3‾ does not.
The flux of CO2 gas released from the surface of a crater lake can be interpreted as a sign of volcanic activity (e.g., Mazot and Bernard, 2015). It would be interesting to see how much CO2aq stored in the hypolimnion of Lake Monoun contributed to the CO2 gas released from the lake surface. According to Issa et al. (2014), CO2 gas was released from the entire lake surface of Lake Monoun to the ambient atmosphere at a rate of 21.8 ton/day in 2013. The volume of WB and CB below −22 m depth is 1.5 × 10⁶ m3. The total amount of CO2aq was estimated at 8.4 Mmol by integrating the [CO2aq] value in 2015. Assuming that the [CO2aq] profiles in WB and CB are the same as those in EB in 2003, the total amount of CO2aq stored in lake water below −22 m depth was 74 Mmol. Therefore, 74 Mmol of CO2aq dissolved in the lake water in WB and CB in 2003 was estimated to have decreased to 8.4 Mmol in 2015. Assuming a constant rate of the CO2aq decrease, the rate is estimated at 14.7 kmol/day (or 0.647 ton/day). This amount of flux is only approximately 3% of the flux observed by Issa et al. (2014), which was 21.8 ton/day. Among the CO2 gases emitted from the entire lake surface of Lake Monoun, CO2 originating from the hypolimnion of WB and CB is expected to be negligible.
Conclusion
Near the lake bottom in EB of Lake Monoun, a stratified structure developed in which the temperature and [HCO3‾] increased toward the bottom while maintaining a linear relationship between temperature and [HCO3‾]. The [HCO3‾] increase could be due to the reaction between CO2aq in the lake water and possible FeCO3 particles suspended in lake water. The reacted CO2aq is converted to HCO3‾. In addition to the stratified structure, hot water enriched in CO2aq and HCO3‾ was diffused horizontally along the lake bottom. Hot water was discharged from D1. At the bottom of D1, the temperature, pH, [CO2aq], and [HCO3‾] were 24.4°C, 5.67, 275 mmol/L, and 73.6 mmol/L, respectively.
In WB and CB of Lake Monoun, a hypolimnion was sustained below −30 m depth. In 2015, the hypolimnion seemed to keep CO2aq and HCO3‾ dissolved in the lake water in 2003. The total amount of CO2aq stored in the hypolimnion in 2015 and 2003 was estimated to be 8.4 and 74 Mmol, respectively. If CO2aq in the hypolimnion diffused out through the lake surface, a 14-kmol/day flux would be expected, corresponding to 3% of the CO2 flux through the entire lake surface in 2013. The CO2 flux through the lake surface in 2003 seemed to be dominated by the CO2 originating from EB, and the contributions of CO2aq stored in the hypolimnion of WB and CB were limited.
The hot water discharged from the bottom of D1 could have been accompanied by bubbles affected by the partial pressure of CH4 dissolved in the lake water. The bubbles rising from D1 reached the chemocline at −50 m depth and formed a weak upward flow of lake water. The upward flow of lake water at −50 m depth was the “seed” of the limnic eruption (Kozono et al., 2016). The upward flow of lake water induced the initial degassing of CO2. The initial degassing of CO2 was amplified by the entrainment of CO2-enriched lake water below −50 m depth, resulting in the 1984 limnic eruption. The wave generated by the limnic eruption impacted the east shore, causing a landslide and forming mound M1 beside D1. The coupling of D1 and M1 was regarded as a trace of the limnic eruption in 1984. Another coupling, i.e., that of D2 and M2, is likely the trace of another limnic eruption that occurred earlier than 1984. Lake Monoun may have experienced several limnic eruptions in the past. If the artificial degassing of CO2 is not continued in Lake Manoun, the water containing high concentrations of CO2aq released from D1 will increase the CO2aq concentration in the lake water, and the bubbles rising from D1 will cause a limnic eruption. In the future, the flux of CO2aq supplied from D1 may increase and exceed the flux of CO2aq removed by the artificial degassing, potentially increasing the amount of CO2aq accumulated in the lake water. The regular monitoring of the CO2aq amount in lake water should also be continued.
Data Availability Statement
The original contributions presented in the study are included in the article/Supplementary Material, further inquiries can be directed to the corresponding author.
Author Contributions
TO drafted the manuscript. TO, YO, KS, MK, Issa, TF, RN and GT conducted the lake observations. All authors participated in the discussion of the content of the manuscript and read and approved its final version.
Funding
This study was funded by the Japan Science and Technology Agency (JST) and Japan International Cooperation Agency (JICA).
Conflict of Interest
The authors declare that the research was conducted in the absence of any commercial or financial relationships that could be construed as a potential conflict of interest.
Publisher’s Note
All claims expressed in this article are solely those of the authors and do not necessarily represent those of their affiliated organizations, or those of the publisher, the editors, and the reviewers. Any product that may be evaluated in this article, or claim that may be made by its manufacturer, is not guaranteed or endorsed by the publisher.
Acknowledgments
This study was part of the project “Magmatic Fluid Supply into Lakes Nyos and Monoun, and Mitigation of Natural Disasters through Capacity Building in Cameroon” under the program “Science and Technology Research Partnership for Sustainable development (SATREPS).” We also thank the researchers and engineers at IRGM and the local people around Lake Monoun who supported our research expedition. We express our sincere gratitude to the two reviewers. Their careful review and constructive suggestions have improved the initial draft. We also thank Dr. Corentin Caudron and Dr. Valerio Acocella for the editorial handling of the manuscript. We would like to thank Editage (www.editage.com) for English language editing.
Supplementary Material
The Supplementary Material for this article can be found online at: https://www.frontiersin.org/articles/10.3389/feart.2022.766791/full#supplementary-material
References
Aka, F. T., and Yokoyama, T. (2013). Current Status of the Debate about the Age of Lake Nyos Dam (Cameroon) and its Bearing on Potential Flood Hazards. Nat. Hazards 65, 875–885. doi:10.1007/s11069-012-0401-4
Alain, F. T., Romaric, N., Kazuto, S., Takeshi, O., Brice, K., Gregory, T., et al. (2019). New Insights into Volume Estimates and Gas Contents from the Acoustic Investigation at Lake Monoun, Cameroon. J. Afr. Earth Sci. 160. doi:10.1016/j.jafrearsci.2019.103604
Baxter, P. J., and Kapila, M. (1989). Acute Health Impact of the Gas Release at Lake Nyos, Cameroon, 1986. J. Volcanology Geothermal Res. 39, 265–275. doi:10.1016/0377-0273(89)90064-4
Butler, J. N. (1991). Carbon Dioxide Equilibria and Their Applications. Michigan, United State: Lewis pub.
Conway, E. J. (1950). Microdiffusion Analysis and Volumetric Error. 3rd edn. London: Crosby-Lockwood.
Costa, A., and Chiodini, G. (2015). “Modeling Air Dispersion of CO2 from Limnic Eruptions. Volcanic Lakes,” in Advances in Volcanology. (Berlin Heidelberg: Springer-Verlag).
Fernández-Prini, R., Alvarez, J. L., and Harvey, A. H. (2003). Henry's Constants and Vapor-Liquid Distribution Constants for Gaseous Solutes in H2O and D2O at High Temperatures. J. Phys. Chem. Reference Data 32, 903–916. doi:10.1063/1.1564818
Fitton, J. G., and Dunlop, H. M. (1985). The Cameroon Line, West Africa, and its Bearing on the Origin of Oceanic and continental Alkali basalt. Earth Planet. Sci. Lett. 72, 23–38. doi:10.1016/0012-821x(85)90114-1
Giggenbach, W. F. (1990). Water and Gas Chemistry of Lake Nyos and its Bearing on the Eruptive Process. J. Volcanology Geothermal Res. 42, 337–362. doi:10.1016/0377-0273(90)90031-a
Halbwachs, M., Sabroux, J.-C., Grangeon, J., Kayser, G., Tochon-Danguy, J.-C., Felix, A., et al. (2004). Degassing the "Killer Lakes" Nyos and Monoun, Cameroon. Eos Trans. AGU 85, 281–288. doi:10.1029/2004eo300001
Halbwachs, M., Sabroux, J. C., and Kayser, G. (2020). Final Step of the 32-year Lake Nyos Degassing Adventure: Natural CO2 Recharge Is to Be Balanced by Discharge through the Degassing Pipes. J. Afr. Earth Sci. 167. doi:10.1016/j.jafrearsci.2019.103575
Issa, T., Ohba, T., Chako Tchamabé, B., Padrón, E., Hernández, P., Eneke Takem, E. G., et al. (2014). Gas Emission from Diffuse Degassing Structures (DDS) of the Cameroon Volcanic Line (CVL): Implications for the Prevention of CO2-related Hazards. J. Volcanology Geothermal Res. 283, 82–93. doi:10.1016/j.jvolgeores.2014.07.001
Issa, T., Ohba, T., Fantong, W., Fouepe, A., Tchamabe, B. C., Yoshida, Y., et al. (2013). Contribution of Methane to Total Gas Pressure in Deep Waters at Lakes Nyos and Monoun (Cameroon, West Africa). Geochem. J. 47, 349–362. doi:10.2343/geochemj.2.0250
Kling, G. W., Clark, M. A., Wagner, G. N., Compton, H. R., Humphrey, A. M., Devine, J. D., et al. (1987). The 1986 Lake Nyos Gas Disaster in Cameroon, West Africa. Science 236, 169–175. doi:10.1126/science.236.4798.169
Kling, G. W. (1988). Comparative Transparency, Depth of Mixing, and Stability of Stratification in Lakes of Cameroon, West Africa1. Limnol. Oceanogr. 33, 27–40. doi:10.4319/lo.1988.33.1.0027
Kozono, T., Kusakabe, M., Yoshida, Y., Ntchantcho, R., Ohba, T., Tanyileke, G., et al. (2016). “Numerical Assessment of the Potential for Future Limniceruptions at Lakes Nyos and Monoun, Cameroon, Based on Regular Monitoring Data,” in Geochemistry and Geophysics of Active Volcanic Lakes (London: Geological SocietySpecial. Publications), 437. doi:10.1144/sp437.8
Kusakabe, M., Ohba, T., IssaYoshida, Y., Yoshida, Y., Satake, H., Ohizumi, T., et al. (2008). Evolution of CO2 in Lakes Monoun and Nyos, Cameroon, before and during Controlled Degassing. Geochem. J. 42, 93–118. doi:10.2343/geochemj.42.93
Kusakabe, M., Tanyileke, G. Z., McCord, S. A., and Schladow, S. G. (2000). Recent pH and CO 2 Profiles at Lakes Nyos and Monoun, Cameroon: Implications for the Degassing Strategy and its Numerical Simulation. J. Volcanology Geothermal Res. 97, 241–260. doi:10.1016/s0377-0273(99)00170-5
Lockwood, J. P., and Rubin, M. (1989). Origin and Age of the Lake Nyos Maar, Cameroon. J. Volcanology Geothermal Res. 39, 117–124. doi:10.1016/0377-0273(89)90052-8
Mazot, A., and Bernard, A. (2015). “CO2 Degassing from Volcanic Lakes. Volcanic Lakes,” in Advances in Volcanology. (Berlin Heidelberg: Springer-Verlag).
Nagao, K., Kusakabe, M., Yoshida, Y., and Tanyileke, G. (2010). Noble Gases in Lakes Nyos and Monoun, Cameroon. Geochem. J. 44, 519–543. doi:10.2343/geochemj.1.0101
Ohba, T., Ooki, S., Oginuma, Y., Kusakabe, M., Yoshida, Y., Ueda, A., et al. (2015). “Decreasing Removal Rate of the Dissolved CO2 in Lake Nyos, Cameroon, after the Installation of Additional Degassing Pipes,” in Geochemsitry and Geophysics of Active Volcanic Lakes. Editors T. Ohba, B. Capaccioni, and C. Caudron (Bath, United Kingdom: The Geological Society of London, special publication), 437. doi:10.1144/sp437.6
Shanklin, E. (1992). “Natural Disasters in the Oral History of West Cameroon,” in Natural Hazards in West and Central Africa. Editor S. J. Freeth (Vieweg Pub). doi:10.1007/978-3-663-05239-5_7
Sigurdsson, H., Devine, J. D., Tchua, F. M., Presser, F. M., Pringle, M. K. W., and Evans, W. C. (1987). Origin of the Lethal Gas Burst from Lake Monoun, Cameroun. J. Volcanology Geothermal Res. 31, 1–16. doi:10.1016/0377-0273(87)90002-3
Sigvaldason, G. E. (1989). International Conference on Lake Nyos Disaster, Yaoundé, Cameroon 16-20 March, 1987: Conclusions and Recommendations. J. Volcanology Geothermal Res. 39, 97–107. doi:10.1016/0377-0273(89)90050-4
Tanyileke, G., Ntchantcho, R., Fantong, W. Y., Aka, F. T., and Hell, J. V. (2019). 30 Years of the Lakes Nyos and Monoun Gas Disasters: A Scientific, Technological, Institutional and Social Adventure. J. Afr. Earth Sci. 150, 415–424. doi:10.1016/j.jafrearsci.2018.11.022
Woods, A. W., and Phillips, J. C. (1999). Turbulent Bubble Plumes and CO2-driven lake Eruptions. J. Volcanology Geothermal Res. 92, 259–270. doi:10.1016/s0377-0273(99)00028-1
Yoshida, Y., Kusakabe, M., Issa, O., T., Tanyileke, G., and Hell, J., V. (2015). “Decreasing Capability of the Degassing Systems at Lakes Nyos and Monoun (Cameroon): A New Gas Removal System Applied to Lake Monoun to Prevent a Future Limnic Eruption,” in Geochemistry and Geophysics of Active Volcanic Lakes. Editors T. Ohba, B. Capaccioni, and C. Caudron (London: Geological SocietySpecial Publications), 437.
Keywords: Lake Monoun, limnic eruption, CO2, bathymetry, lake basin, hypolimnion
Citation: Ohba T, Oginuma Y, Saiki K, Kusakabe M, Issa , Fouepe TA, Ntchantcho R, Tanyileke G and Hell JV (2022) A Depression Containing CO2-Enriched Water at the Bottom of Lake Monoun, Cameroon, and Implications for the 1984 Limnic Eruption. Front. Earth Sci. 10:766791. doi: 10.3389/feart.2022.766791
Received: 30 August 2021; Accepted: 07 March 2022;
Published: 25 May 2022.
Edited by:
Corentin Caudron, Université Libre de Bruxelles, BelgiumReviewed by:
John Stix, McGill University, CanadaAlain Bernard, Université Libre de Bruxelles, Belgium
Copyright © 2022 Ohba, Oginuma, Saiki, Kusakabe, Issa, Fouepe, Ntchantcho, Tanyileke and Hell. This is an open-access article distributed under the terms of the Creative Commons Attribution License (CC BY). The use, distribution or reproduction in other forums is permitted, provided the original author(s) and the copyright owner(s) are credited and that the original publication in this journal is cited, in accordance with accepted academic practice. No use, distribution or reproduction is permitted which does not comply with these terms.
*Correspondence: Takeshi Ohba, dGFrZXNoaV9vaGJhQHRva2FpLXUuanA=