
94% of researchers rate our articles as excellent or good
Learn more about the work of our research integrity team to safeguard the quality of each article we publish.
Find out more
ORIGINAL RESEARCH article
Front. Earth Sci., 21 February 2022
Sec. Sedimentology, Stratigraphy and Diagenesis
Volume 10 - 2022 | https://doi.org/10.3389/feart.2022.766145
This article is part of the Research TopicAdvance in Carbonate Sedimentation and DiagenesisView all 4 articles
 Dimitrios Charlaftis1*
 Katherine J. Dobson2
 Stuart J. Jones1
 Dmitry Lakshtanov3Jonathan Crouch3Jennie Cook4
Characterization of deeply buried sandstones and their reservoir quality is of paramount importance for exploring, developing, and subsurface storage of energy resources. High reservoir quality in deeply buried sandstones is commonly correlated with the occurrence of grain coatings that inhibit quartz cementation. The development of reliable models that can predict reservoir quality relies on incorporating quantitative understanding of these diagenetic processes. Hydrothermal experiments simulating burial diagenesis were integrated with multi-scale X-ray tomography to quantify the 3-dimensional evolution of grain coating volume and porosity with increasing temperature; while microscopic and automated quantitative mineralogy analysis were used to track the associated mineralogical alterations. To simulate reservoir evolution, sandstone samples from the Lower Jurassic Cook Formation (Oseberg Field, 30/6-17R, Norway) were exposed to a silica supersaturated Na2CO3 (0.1 M) solution for up to 360 h at temperatures of 100–250°C. The experimental results show the main porosity and permeability reduction window is associated with pore-filling kaolinite, and lies between 150 and 200°C, above which little change occurs. Volumetric increases in grain coating start to occur at ∼150°C through precipitation of authigenic chlorite, and continue to 250°C, irrespective of the experimental duration. Together with preexisting siderite coatings, the newly precipitated chlorite prevents the loss of reservoir quality by inhibiting quartz overgrowth development. Pore flow simulations based on the observed temperature-dependent 3-dimensional pore networks allow us to characterize pore-throat and permeability evolution and gain quantitative understanding of the impact of diagenetic overprinting on deeply buried sandstone reservoirs.
A wide range of geoscience applications, including hydrocarbon extraction, CO2 storage, aquifer development and geothermal exploration, rely on predictive models that describe the reservoir properties of a target formation. Realistic reservoir quality predictions require an understanding of how diagenesis, and associated factors, influence porosity and permeability.
Quartz cementation and clay authigenesis profoundly influence the quality of sandstone reservoirs by modifying the nano- to macroscale reservoir properties (Morad, 1998; Worden and Morad, 2000; Worden and Morad, 2003; Taylor et al., 2010; Bjørlykke, 2014). Quartz cementation, typically initiating at temperatures from ∼80°C, is the main cause of porosity and permeability reduction during progressive burial in sandstone reservoirs (McBride, 1989; Bjørlykke and Egeberg, 1993; Worden and Morad, 2000), but grain coating clays can limit extensive quartz cementation by forming a barrier at the interface between detrital grains and intergranular pore space. Authigenic chlorite is thought to be the main clay coating controlling porosity preservation (Ehrenberg, 1993; Ehrenberg et al., 1998; Jahren et al., 1998; Anjos et al., 2003; Berger et al., 2009; Dutton et al., 2018; Stricker and Jones, 2018), with numerous detrital and early diagenetic precursor minerals, including berthierine and siderite, allowing authigenic chlorite formation during burial. Authigenic chlorite grows perpendicular to grain surfaces and can indiscriminately coat any mineral grain, at any orientation (Worden et al., 2020), and so it is the continuity of the coating that dictates the effectiveness of quartz cement inhibition (Ajdukiewicz and Lander, 2010; Ajdukiewicz and Larese, 2012; Dowey et al., 2012). In contrast, authigenic pore filling clays, such as kaolin minerals, have a detrimental effect on reservoir quality by blocking primary intergranular pore space (Osborne et al., 1994; Martín-Martín et al., 2007; Mahmic et al., 2018).
Experimental simulation of diagenesis is critical to provide accurate data of porosity (microscopic pore texture, referring to the shape, size and distribution of pores and throats and their interconnectivity) and permeability evolution during diagenesis; data essential for reconstructing more realistic reservoir models, and for larger-scale basin modeling (Bloch, 1994). Temperature-controlled laboratory experiments have investigated clay mineral coating growth and quartz cement nucleation (Pittman et al., 1992; Hillier, 1994; Aagaard et al., 2000; Lander et al., 2008; Ajdukiewicz and Larese, 2012; Haile et al., 2015), and while these studies provide valuable insight into the effect of diagenesis on rock properties, quantitative understanding of diagenetic processes remains challenging.
Numerous techniques, such as imbibition, buoyancy, He pycnometry, gas adsorption, and Mercury intrusion porosimetry, can be employed to directly measure porosity and examine pore-throat textures in reservoir rocks. However, these techniques can only characterize the interconnected porosity at the time of analysis (Anovitz and Cole, 2015). Additionally, microscopic methodologies, such as light and scanning electron microscopy, can reflect the nature of porosity and its association with mineralogy but, since they only examine the 2D rock surface, are incapable of analyzing 3D pore-throat distributions and their interconnectivity. 3D pore characterization is possible via statistical (Hazlett, 1997; Liang et al., 2000; Keehm et al., 2004) and process-based modeling (Bakke and Øren, 1997; Øren and Bakke, 2002). However, statistical models cannot capture the complexity of pore morphology and tortuosity in natural rock samples, and process-based models cannot adequately replicate the fabrics of heterogeneous and diagenetically complex units.
The direct measurement of mineral and pore space characteristics in the 3D domain has become possible through the use of X-ray computed tomography (XCT) (Ketcham and Carlson, 2001; Cnudde and Boone, 2013; Wildenschild and Sheppard, 2013). It has been applied to both sandstone (Lindquist et al., 2000; Golab et al., 2010; Bin et al., 2013; Schmitt et al., 2016; Thomson et al., 2018; Zhang et al., 2019; Thomson et al., 2020) and carbonate (Youssef et al., 2007; Bultreys et al., 2015; Pak et al., 2016; Fheed et al., 2018) units to qualitatively and quantitatively characterize porosity and microscopic pore textures. XCT is a non-invasive and non-destructive technique that provides a unique opportunity to record volume and geometry alterations of mineral and pore structures during experiments. When combined with other characterization methods, it allows a high-resolution 3D representation of the pore system and mineral distribution which can then further assist in improving our understanding of the mechanisms that govern fluid flow (Andrä et al., 2013; Markussen et al., 2019).
In this study, we extend the methods developed by Charlaftis et al. (2021) to analyze hydrothermally treated samples; applying a multi-scale X-ray tomography (XCT) approach allows the volumetric quantification of the mineralogical and pore-throat alterations, induced by the experimental process in the 3D domain. High-resolution scanning electron microscopy (SEM) imaging and automated quantitative mineralogy (AQM) were used as complementary methods. Additional experiments are performed using samples from the same formation (e.g., Lower Jurassic Cook Formation, Oseberg Field, Norway) and depth to compare the simplified single-stage heating experiments described in Charlaftis et al. (2021) with new multi-stage heating experiments which better simulate burial diagenesis. The captured 3D geometry of the pore phase is used to computationally simulate fluid flow and determine permeability. This research presents a new integrated approach on experimental diagenesis that can lead to improved characterization of mineralogical and petrophysical properties, thus enabling more accurate reservoir quality prediction of sandstone reservoirs.
The six sandstone samples used in this study are obtained from core material from the Lower Jurassic Cook Formation of the Oseberg Field (Norway, Well 30/6-17R). All samples are selected from a depth of 7988.18 ft (2434.8 m) based on their initial mineralogical content (e.g., increased berthierine and siderite content) and to exclude heterogeneity from the experimental process. The composition of the Cook Formation comprises medium- to fine-grained, moderately sorted, angular to subangular grains. X-ray diffraction analysis suggests the dominance of quartz as a primary mineral, with kaolinite and berthierine being the clay minerals, and siderite the main carbonate mineral identified. Comprehensive mineralogical evaluation of the starting material can be found in Charlaftis et al. (2021).
The single-stage experiments entail the 3D analysis of five plugs (samples S1-S5), ∼4 mm in diameter and length varying between ∼5 and ∼9 mm, each of which was subjected to hydrothermal treatment at specific temperature conditions and equivalent duration. The experiments were carried out in a Parker Autoclave Engineers 500 ml cylindrical 316 stainless steel pressure vessel. During all experimental runs, silica gel granules and an aqueous solution of 0.1 M Na2CO3 (reagent grade) dissolved in high purity water (Milli-Q) were used as a source of silica and pore fluid, respectively. The experiments were conducted under zero flow conditions mimicking closed-system diagenesis, with a solution that is non-reactive (e.g., Fe-free chemical composition) with the Fe-rich minerals, and proved to generate strong quartz-cementing conditions (Ajdukiewicz and Larese, 2012). For detailed information on the experimental process and justification regarding the experimental conditions chosen, see Charlaftis et al. (2021).
The multi-stage experiments use the same configuration, but a single, ∼0.3 × 2.4 cm, plug (sample S6) was subjected to sequential hydrothermal treatment at temperatures of 70, 100, 150, 200 and 250°C with a duration of 72 h at each temperature. Between each experimental stage, the sample was removed and air dried allowing the analysis discussed in turn.
XCT data of samples S1 to S5 were collected using a Zeiss Xradia VersaXRM 410 microscope operated at 100 kV and 125 μA (no beam filtration), and the reconstructed datasets have a spatial resolution of 3.8 μm/voxel (3D equivalent of a pixel). All samples were imaged before and after each experiment. XCT data of sample S6 was collected using a BP proprietary XCT system [double-helix scanning trajectory (Varslot et al., 2012)], at Sunbury-on-Thames (United Kingdom), operated at 80 kV and 120 μA. The sample was imaged with a spatial resolution of 5.57 μm/voxel (S6A) between each experimental stage, and higher resolution (1.7 μm/voxel, S6B and S6C1-C3) images collected from a smaller region. The data were reconstructed using an algorithm that corrects for geometric motion errors via passive auto-focus (Kingston et al., 2011) and iterative reprojection alignment (Latham et al., 2018). For more information on the XCT acquisition characteristics of the raw data and the analyzed subvolumes please refer to the Supplementary Material.
To aid the reader, XCT resolution is color-coded in all figures as green (5.57 μm/voxel), light blue (3.8 μm/voxel), and orange (1.7 μm/voxel). The image processing workflow was performed in Thermo Scientific Avizo® (v 2019.2). All scans for each sample were spatially registered to enable direct comparison of the microstructure before and after each temperature treatment. An anisotropic diffusion filter was employed to denoise all low and medium resolution datasets (Weickert et al., 1998), but was not required for the highest resolution data. Cylindrical and cuboidal subvolumes were extracted from the samples (Figures 1A,B) and used for the XCT image analysis.
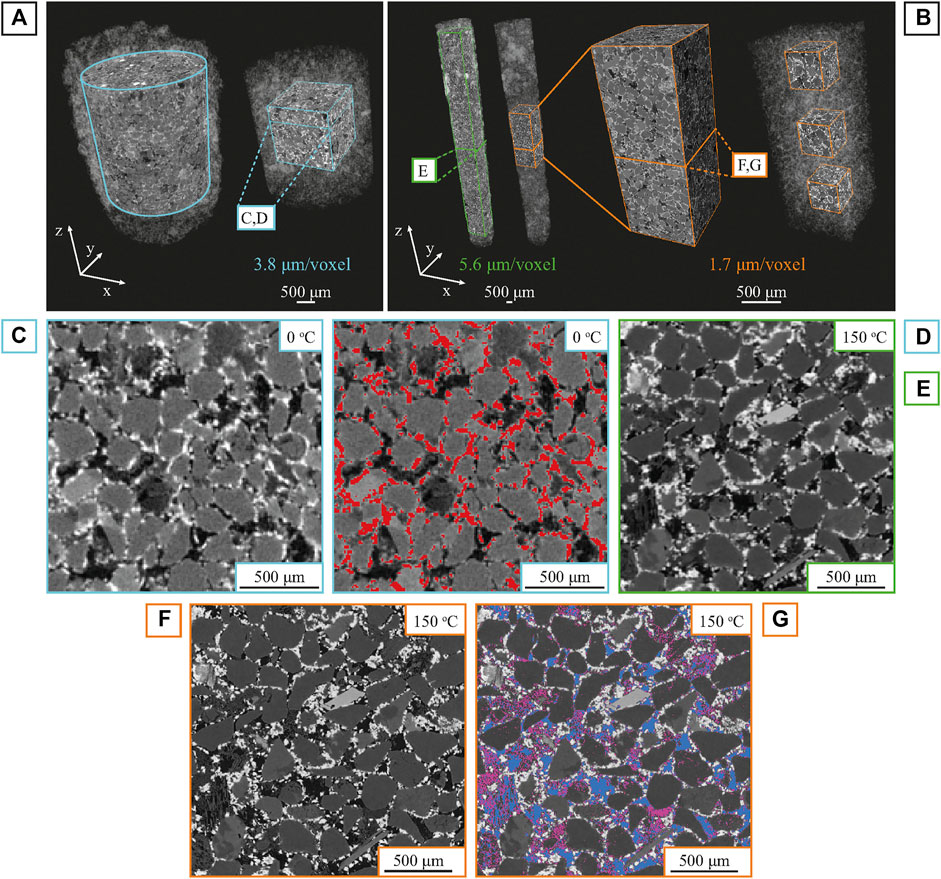
FIGURE 1. Multi-scale XCT analysis. (A) 3D Volume rendering of the cylindrical and cubic subvolumes extracted from samples S1-S5 scanned with a resolution of 3.8 μm/voxel (outlined in light blue). (B) 3D volume renders of sample S6 divided into S6A, S6B and S6C1-C3 based resolution and volume size. S6A is scanned with a resolution of 5.57 μm/voxel (outlined in green), whereas subsection S6B and subsequent cubic subvolumes S6C1 (top), S6C2 (middle) and S6C3 (bottom) are scanned with a resolution of 1.7 μm/voxel (outlined in orange). (C) 2D slice through the tomography data showing the gray scale image before the experiments. (D) 2D slice showing the grain coating phase (red) before the experiments. (E,F) 2D registered slices from data collected at different resolutions (e.g., sample S6A and S6B after being hydrothermally treated up to 150°C). (G) Selection of the macropore (blue) and microporous (purple) volume phases.
Minerals have X-ray absorption characteristics dependent on their density and atomic mass, which is represented in the 3D images as differences in grayscale value (Figures 1C,E,F). These differences were exploited to perform segmentation using a histogram-based, moment-preserving threshold algorithm (Tsai, 1985) to identify all voxels associated with grain coatings (Figure 1D) and porosity (Figure 1G, blue phase). This algorithm preserves the mathematical moments of the original grayscale image, giving a more realistic segmentation than single value based global methods. At higher resolutions (S6B and S6C1-C3), it was also possible to segment microporous material (mainly clay phases, Figure 1G, purple phase) using a combination of the moment preserving and a watershed threshold algorithm. This material occupies some primary pore spaces and exerts a major influence on the reservoir properties of the experimentally treated samples, and microfractures within framework grains. For more information on the segmentation process see the Supplementary Material.
Sub-micron scale features that are challenging to quantify with high accuracy in the 3D image can be captured through direct correlation of volume image data with high-resolution 2D microscopy after image registration. After the hydrothermal experiments, sample S6 was mounted in a block of resin and polished to expose a planar surface that lies within the 3D tomograpic volume. Backscatter SEM imaging of the carbon-coated polished block was carried out uisng a Hitachi SU-70 Field Emission Gun (FEG) SEM scanning electron microscope with an energy-dispersive detector (EDS) at an acceleration voltage of 20 kV and measured beam current of 0.6 nA.
Automated quantitative mineralogy (AQM) was performed on a Zeiss Gemini SUPRA 40VP field emission scanning electron microscope coupled with a Bruker XFlash® 60 EDS detector. Images were collected using a high-resolution raster, with a step size of 3.5 μm at a 255x magnification and a 20 kV acceleration voltage. Dwell time was adjusted to capture approximately 20,000 counts per pixel. The 2D section image was then registered to the corresponding slice of the 3D data to support the XCT segmentation (Figure 2).
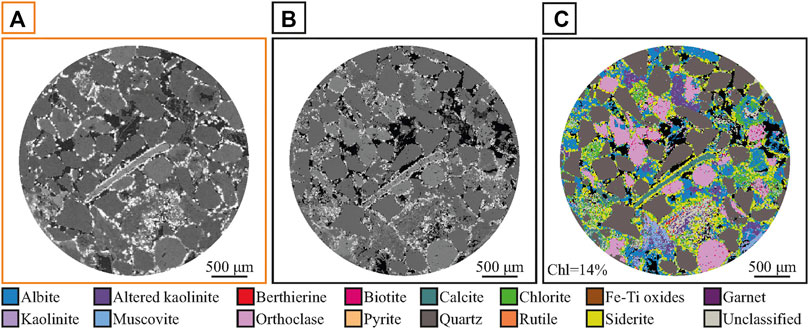
FIGURE 2. Registered XCT and SEM slice with associated AQM analysis of sample S6 after being hydrothermally treated up to 250°C. (A) 2D slice through 3D grayscale XCT data. (B) Registered SEM slice. Variations in grain and pore size in the images are due to damage during the polished section preparation for SEM analysis. (C) In-situ mineral map. Where Chl = chlorite.
Pores disconnected from the axial through going network were removed (as inaccessible to flow) and a conservative separation algorithm (marker extent = 7), was applied to define individual pores and pore throats (see Supplementary Material for details). Pore network modeling (PNM) extraction, using the maximum ball algorithm (Silin et al., 2003; Silin and Patzek, 2006; Dong et al., 2007) was applied to the binarized pore volume to extract a topologically equivalent network of the pores and throats. The maximal ball algorithm fits maximum inscribed spheres to each pore. The largest spheres are defined as pore bodies, and chains of smaller spheres connecting these pore bodies are defined as throats. Pore radius represents the radius of a sphere with equivalent volume as the analyzed pore. Throat radius is defined as the minimal distance between the central axis and the border of the throat. Coordination number is the number of throats connected to a given pore, which reflects the connectivity of the pore space.
The Absolute Permeability Experiment Simulation (APES) built-in Avizo module was used to compute a scalar estimate of permeability at each experiment. This simulates single-phase fluid flow by implementing the finite volume method (Harlow and Welch, 1965) to solve the Stokes equations for the velocity and pressure fields. APES fluid flow simulations were run with flow parallel to the long axis (e.g., z-direction) of the sample, driven by a pressure differential (ΔP = 30 kPa) imposed across the analyzed subvolume and a convergence criterion set to a value of 10−6 (e.g., the simulation converges using a low tolerance error to ensure a reliable, repeatable value of permeability). The simulation assumes no loss of fluid through the faces parallel to the flow direction, and adds accommodation zones to inflow and outflow faces to ensure a quasi-static pressure field over the faces. The APES then solves for the velocity field in the interconnected pore space, and the volumetric flux across the sample end faces is computed. Permeability (k) is then obtained using Darcy’s Law.
The XCT-analyzed grain coatings are defined as all the Fe-rich minerals (e.g., siderite, berthierine, chlorite) fringing primary minerals such as quartz and k-feldspars. The separation of the Fe-rich phases is not possible as the density of the phases and close association and intergrowths prevent attenuation-based segmentation. The microporous material is mainly kaolinite pore-filling clay and to a lesser extent micropores within fractured grains. For both the single- and multi-step treatment, we present the volumetric changes of each phase of interest and compare the pre- and post-reaction pore network characteristics and permeability models of each sample.
To aid the reader, XCT resolution is color-coded in the bounding boxes of the relevant figures (as per Materials and Methods, green = 5.57 μm/voxel, light blue = 3.8 μm/voxel, and orange = 1.7 μm/voxel). Where data from multiple resolutions are plotted on the same graph, the data series themselves are color-coded.
In these experiments each sample was scanned entirely, i.e., at the scale of the experiments each sample is the representative elementary volume (REV). However, for computational efficiency, we selected smaller sample volumes for the permeability simulations. On each sample from both the single- and multi-stage experimental treatment, a porosity analysis was performed on multiple volumes for calibration and validation purposes. Representative cylindrical subvolumes were extracted from samples S1-S5 to exclude voxels from potentially contaminated exterior surfaces, containing approximately 2/3 of the whole sample. The porosity of these, and the smaller subvolumes used for permeability simulation (e.g., 5003 voxel cubes covering about 1/3 of the whole sample) were comparable; implying the smaller volume is representative of the sample. The 5.57 μm/voxel resolution scan of the entire sample S6 (e.g., sample S6A) was used to define a region of relatively homogeneous and average porosity for the higher resolution (e.g., sample S6B, 1.7 μm/voxel) XCT. At this higher resolution we see an increase in the pore volume and heterogeneity as is to be expected given the smaller voxel sizes. For computational efficiency three cubic subvolumes (e.g., samples S6C1-S6C3) were selected from this high-resolution data bracketing the range of porosity seen along the length of the high-resolution scan.
The XCT results show that the initial porosity of the cylindrical subvolumes was ∼5–7% with the cubic subvolumes showing slightly higher values (∼10%). This validates the approach for subvolume selection and suggests that the large subvolumes (relative to sample size) are an appropriate REV. This difference is caused by the smaller volume of the analysis and the natural heterogeneity within the samples. Both sample sets show no change in porosity at 100°C, and only modest (<1% reduction, cubic sample only) at 150°C. Porosity decreases significantly at the experimental temperatures of 200, 225 and 250°C (Figure 3A).
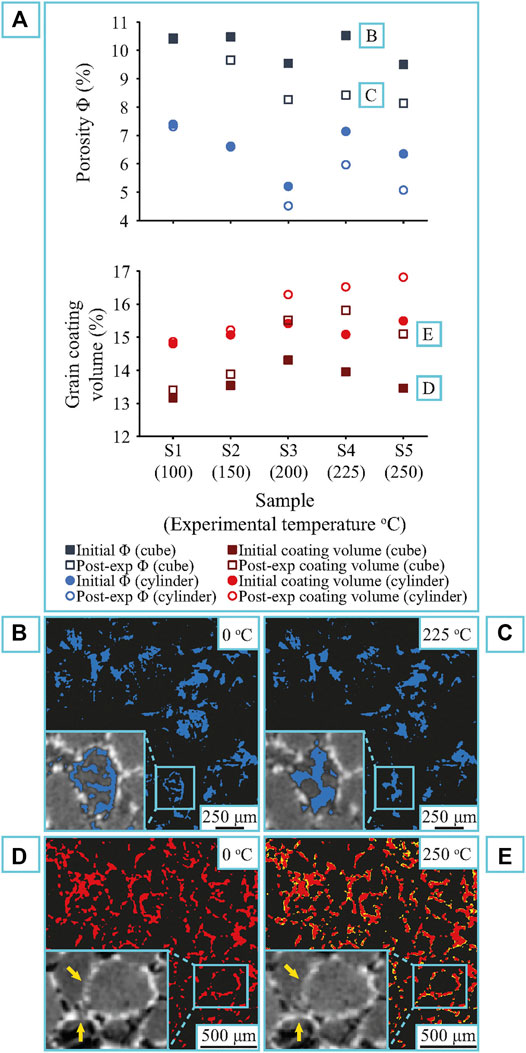
FIGURE 3. Quantification of porosity and grain coating volume, pre- and post-reaction, of samples S1-S5. (A) Porosity and grain coating volumetric change of the cylindrical and cubic (500 voxel3) subvolumes of each sample/temperature. Significant porosity reduction and grain coating volume increase occurs at the experimental temperatures of 200, 225 and 250°C. The grain coating volumetric increase corresponds to the stabilization of porosity reduction at temperatures higher than 200 °C. (B) 2D slice of the thresholded porosity phase (blue) of sample S4 before the experiment. (C) 2D slice of the thresholded porosity phase of sample S4 after the experiment at 225°C showing the porosity decrease. Note the development of secondary porosity due to feldspar dissolution. (D) Initial grain coating volume (red). (E) Final grain coating volume (yellow) after the hydrothermal treatment at 250°C. The newly precipitated phase contributes to the increase of the thickness and continuity (yellow arrows) of the initial coatings.
At temperatures >200°C the bulk porosity change hides additional complexity. The S4 (cylindrical subvolume) shows a reduction in porosity from 7.1 to 6%, and in S5 porosity shows a very similar decrease from 6.3 to 5.1%. The ceasing of further porosity loss is associated with grain coating growth (Figures 3A,D,E). Local increases in porosity are caused by the development of dissolution pores (Figures 3B,C).
Grain coating volume increases from 15.1 to 16.5% for sample S4 and, from 15.5 to 16.8% for sample S5 (Figure 3A). The 3D observations indicate increase of both the coating thickness and coating continuity (Figures 3D,E). Previous microscopic analysis has identified this as precipitation of authigenic chlorite coatings (Charlaftis et al., 2021). The porosity and grain coating volume measured on the smaller cubic subvolumes show the same trend as the larger cylindrical subvolumes, but with small differences (mean 3.6% difference in porosity, 1.5% difference in grain coating volume) because of the heterogeneity of the local microstructure.
A comparison of the pre- and post-reaction pore network and permeability models of each sample show the effect of these alterations, in terms of pore connectivity, pore and throat size and, absolute permeability (Figure 4). In agreement with the total porosity, up to temperatures of 150°C we see negligible changes in the volume of the connected pore network (Figure 4B), or in the mean pore diameter, although there is still some pore isolation and minor breaks in some areas of the pore network. While there is some heterogeneity in the initial permeability, controlled by the sample structure, no significant change in permeability is seen in samples subjected to temperatures up to 150°C.
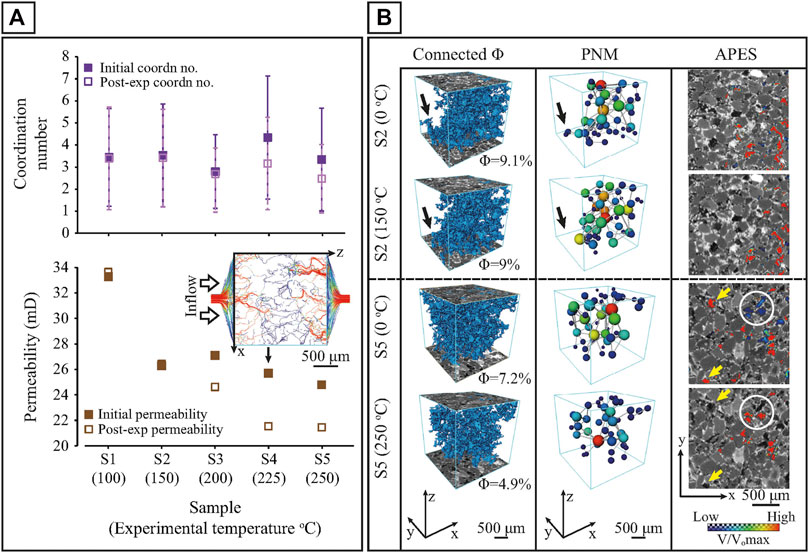
FIGURE 4. PNM and APES of the cubic subvolumes of samples S1-S5. (A) Evolution of the mean coordination number (number of contacts a pore has with its neighbors) and permeability per sample and experimental temperature, derived from the pore network modeling and permeability simulations, respectively. Error bars correspond to the standard deviation. Included is a schematic diagram of the permeability simulation along the z-axis of sample S4 prior to hydrothermal treatment. The model is color-coded with slower streams being near the blue end of the spectrum, and faster streams near the red end of the spectrum. (B) 3D renders of the connected porosity (left), pore network models (middle) and fluid velocity magnitude maps (right) of samples S2 and S5 before and after the hydrothermal experiments. The pore space of the pore network models is represented as a lattice of wide pores (shown as spheres) connected by narrower throats (shown as cylinders). The size of the pore and throat indicates the inscribed radius and length, respectively. Red indicates volumetrically larger pores and blue indicates pores with smaller radius. The fluid velocity maps are normalized to the maximum velocity value of each sample as derived from the permeability simulation prior to the experiment. Note that slight changes between the pre- and post-reaction connected porosity network of sample S2 (black arrows) do not affect the flow pathways. Significant alterations occur at 250°C with extinction of pre-reaction preferential pathways (yellow arrows) and flow enhancement of initially low fluid flow velocity regions (circled). For interpretation of the references to color in this figure legend, the reader is referred to the web version of this article.
As the temperature increases, we see volume reductions of the connected porosity of up to 30% (reduction from 7.2 to 4.9% at 250°C), accompanied by reductions in both mean pore diameter (9% reduction, from 126 to 115 μm at 250°C) and throat radii (15% reduction, from 27 to 23 μm at 250°C), and mean co-ordination number (from 3.3 to 2.5 at 250°C). Consequently, the observed pore network changes start to reduce permeability (∼2.5 mD reduction at 200°C; ∼ 4 mD reduction at 225 and 250°C) (Figure 4A). Visualisation of the fluid velocity magnitude maps before and after treatment at 250°C shows changes to the location of the main flow pathways (Figure 4B).
Compared to the single-stage thermal treatment, the multi-stage thermal treatment allows us to apply our new understanding of temperature-dependent behavior to a scenario that simulates progressive burial.
Figure 5A presents the porosity, grain coating, and microporous material evolution with increasing temperature for each of the extracted subvolumes (e.g., cuboids and 5003 voxel cubes). As with the single-stage experiments, negligible change was observed between 0 and 100°C and only temperatures ≥100°C are shown here. Porosity reduction initiates at 100°C, with the main reduction window occurring between 150 and 200°C, irrespective of subvolume size and scan resolution. The porosity in sample S6A (5.57 μm resolution) reduces from 8.6% at 100°C to 8% at 150°C to 6.5% at 200°C. With higher spatial resolution and a smaller scan volume (S6B, 1.7 μm resolution), we see higher absolute values (a result of the higher resolution) and a reduction from 14.2 to 13.2%–9.8% over the same temperatures; a 25-30% reduction at both image resolutions. The smaller cubic subvolumes (1.7 μm resolution, S6C1-S6C3, taken from areas of low, medium and high initial porosity) show the same trend in porosity reduction, but have greater variability in both the initial value and the reductions because of the greater heterogeneity preserved between these smaller volumes.
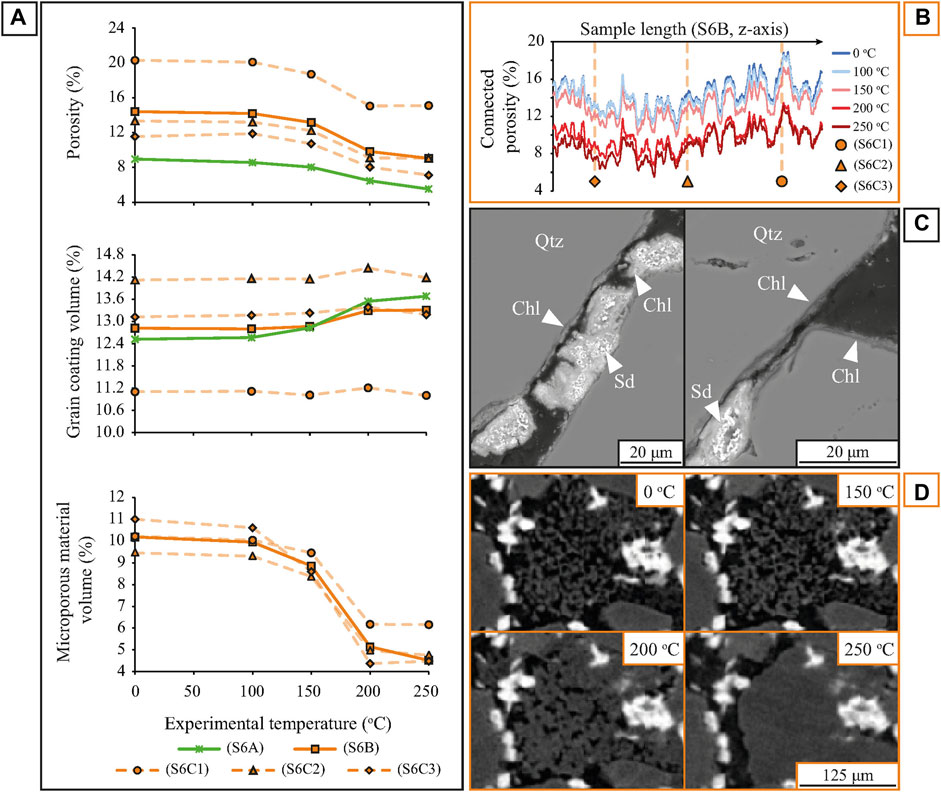
FIGURE 5. Porosity, grain coating, and microporous volume evolution of sample S6 subjected to sequential hydrothermal treatment up to 250°C. (A) Porosity, grain coating, and microporous volume plots with increasing temperature of sample S6 at different resolutions and scales. Note that porosity and microporous volume decrease occurs, primarily, between 150 and 200°C followed by a stabilization phase. Grain coating increase is observed mainly on samples S6A and S6B at temperatures higher than 150°C. (B) Connected porosity distribution along sample length of sample S6B, color-coded per experimental temperature, with the position of samples S6C1-SC3 (i.e., cubic subvolumes) indicated along that length. Porosity reduction is evident between 150 and 200°C. (C) Backscatter SEM images of the newly precipitated chlorite coatings associated with siderite dissolution. Where Chl = chlorite; Qtz = quartz; Sd = siderite. (D) 2D XCT images of the pore-filling kaolinite evolution destroying primary pore space.
Above 200°C porosity reduction is retarded (as for the single-stage experiments), with reductions from 6.5 to 5.5% (5.57 μm resolution) and from 9.8 to 9% (1.7 μm resolution), and two the cubic subvolumes (S6C1 and S6C2) show no reduction at all. This porosity loss retardation can also be seen in the along-axis evolution of the connected porosity of sample S6B (Figure 5B). In all cases, the reduction of the connected pore volume occurs between 150 and 200°C.
Grain coating volumes show little change below 150°C, and increases at higher temperatures are smaller than those seen in the single-stage experiments, from 12.5 to 13.7% (S6A, 5.57 μm resolution) and from 12.8 to 13.3% (S6B, 1.7 μm resolution). As in the single-stage experiments, the coating volume increase is associated with the development of authigenic chlorite coatings (Figure 5C), and little net change in porosity. The SEM analysis revealed a progressive loss of the rhombohedral morphology of siderite crystals leading to replacement by chlorite, as well as precipitation on clean host-grain surfaces. Pre-experimental X-ray diffraction (XRD) and AQM analysis have shown an initial chlorite content of less than 2% by weight in all samples (Charlaftis et al., 2021), increasing to ∼14% by weight chlorite after the experimental treatment (Figure 2C).
Microporous material is diminished by ∼ 50% in all the analyzed volumes. This is due to the gradual coarsening and morphological evolution of the kaolinite crystals from an initial booklet morphology with pseudohexagonal habit to a more euhedral blocky habit at 200°C and a completely cemented phase with no visible microporosity at 250°C (Figure 5D).
Based on XCT and SEM observations, albite dissolution generating secondary pore space is apparent from 150°C onwards. Minor albitization of K-feldspar detrital grains and the formation of albite overgrowths were also observed. Albitization is generally incomplete and occurs preferentially along cleavage surfaces or microcracks presenting narrow irregular networks. Albite overgrowths form euhedral outlines on parts of the detrital feldspar grains that are not occupied by chlorite or siderite coatings. Finally, authigenic quartz overgrowth precipitation was not observed in the analyzed samples.
The visualizations in Figure 6A demonstrate a clear difference between the initial and final pore network model of the hydrothermally treated sandstone sample. The post-experiment network is less dense, owing to the porosity loss, with the number of the extracted pore bodies and throats decreasing from 1,188 to 750 and from 4,758 to 1822, respectively. Pore connectivity has been drastically decreased with the mean coordination number being dropped from 8 (0°C) to 4.9 (250°C). Equally, pore and throat radius distributions reveal a shift towards smaller pore and throat sizes with the mean pore radius decreasing from ∼75 to ∼73 μm and the mean throat radius from ∼17 to ∼15 μm (Figures 6B–D).
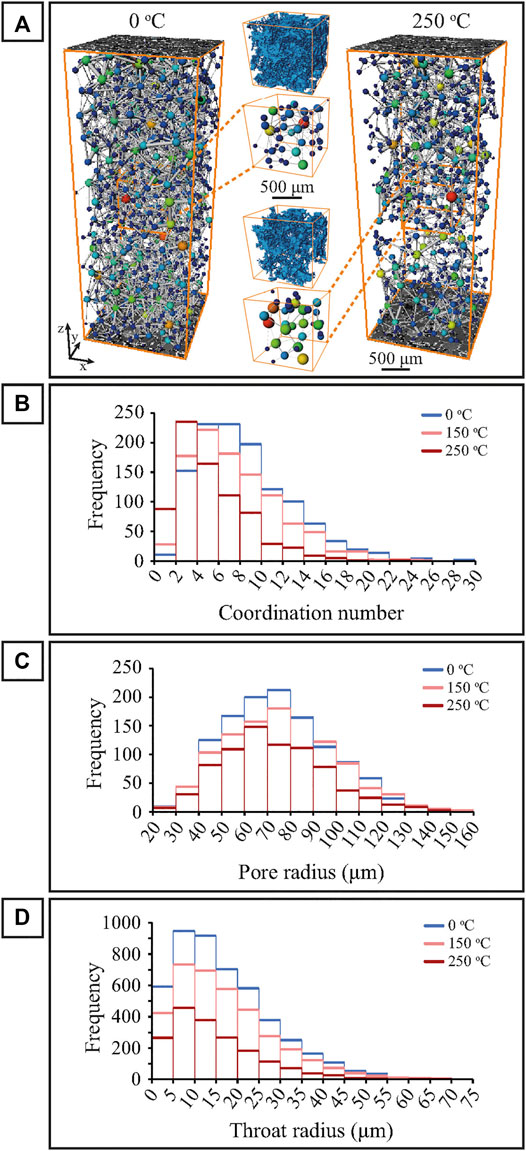
FIGURE 6. Comparison between the PNM data of the initial (0°C), middle (150°C) and final (250 °C) experimental stage of sample S6B. (A) 3D visualization of pore network model of the whole sample (S6B) and a zoomed-in cubic subset (S6C2) with the equivalent 3D volume rendering of the connected porosity. Pore and throat size of the porosity models indicates the inscribed radius and length, respectively. Larger pores are shown in red and smaller pores are shown in blue. Frequency distribution plot of the coordination number of pores (B), pore radius (C) and, the throat radius (D) per experimental temperature. Colors indicating temperature and volume resolution are as on previous figures.
Again, like the single-stage experiments, the APES results show a decrease in permeability with increasing temperature (Figure 7A) for all samples, with the main phase of permeability reduction occurring between 150 and 200°C. These samples show greater variability in both the initial permeability and the reduction, driven by microstructural differences between the sample locations within S6B. Above 200°C the APES shows only small changes (both increase and decrease) in permeability; consistent with the negligible changes in the porosity and microporous volumes at this temperature.
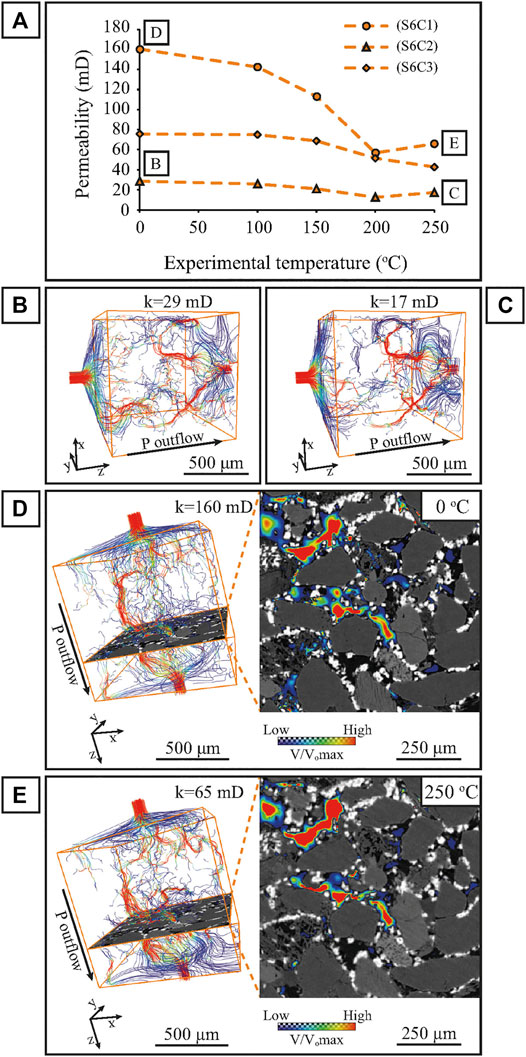
FIGURE 7. APES of 500 voxel3 subvolumes (S6C1-C3) extracted from sample S6B. (A) Permeability evolution with increasing temperature. The main reduction window lies between 150 and 200°C. (B) Permeability model of sample S6C2 prior and after (C) to hydrothermal treatment at 250°C. Red streamlines represent preferential fluid flow pathways while blue indicate areas of reduced velocity magnitude. Color of streamlines shows the velocity normalized to the maximum velocity in the pre-treatment sample. (D) Pre-experiment permeability model of sample S6C1 with associated 2D velocity magnitude map. (E) Permeability model and 2D velocity magnitude map at 250°C. The maps are normalized to the maximum velocity value derived from the pre-experiment permeability simulation. Permeability reduction is attributed to the extinction of low-velocity magnitude pathways, mainly associated with microporous material.
Figures 7B,C display the APES models of sample S6C2 at 0 and 250°C. The results indicate a reduction from an initial value of 29 to 17 mD. S6C1 which is located in a highly porous region within the larger cuboid volume (S6B), has an initial permeability value of 160 mD and presents the largest permeability change. Although the preferential fluid flow pathways are preserved as in sample S6C2, permeability at the end of the experiment is reduced to 65 mD (Figures 7D,E).
The experimental results presented in this research have identified an association between grain coating increase (total volume) and ceasing of porosity loss in the 3D domain. Pore network and permeability models yield similar behavior.
The analysis of the single-stage samples (S1-S5, 3.8 μm/voxel) shows a grain coating volumetric increase of ∼9% at 250°C whereas the multi-step sample (S6B, 1.7 μm/voxel) presents an increase of ∼4%. This difference is partly attributed to the applied multi-scale analysis. To test this, we took a randomly positioned high-resolution subvolume from the pre-treatment S6 data (∼14.1% coating) and down-sampled the data to match the voxel resolution of the S1-S5 datasets. Reapplying the segmentation workflow (see Supplementary Material) on the down-sampled data yields a grain coating volume of ∼18.5%, caused purely by the difference in resolution between the two images. This is further validated by the equal drop of porosity (from ∼13.3 to ∼8.5%) after down-sampling. Considering this difference when calculating the grain coating volume increase from 0 to 250°C we infer a calculated value of ∼5.2% for the down-sampled data, 31% higher than the ∼4% calculated for the high-resolution data. However, this is still lower than the ∼9% volumetric increase recorded for the single-stage sample implying an additional influencing parameter derived from the experimental treatment each sample has experienced (discussed in Diagenetic Evolution and Subsequent Influence on Reservoir Quality).
The accuracy of any image-based analysis of pore geometries or subsequent flow simulation is influenced by the pore segmentation (Iassonov et al., 2009; Peng et al., 2014). Higher resolution images will always allow more precision and better capture of fine porosity but will also mean a smaller area or volume being analyzed. The down-sampled data of the 1.7 μm/voxel dataset yielded a porosity comparable to that of the 3.8 μm/voxel dataset (∼8.5%) suggesting that the 3.8 μm/voxel data are unable to resolve the 50% of the porosity that is in the smallest pores.
When compared with helium pycnometry measurements low-resolution tomography-based porosities are significantly lower. The initial XCT-based image porosity (mean 6.6%, 3.8 μm/voxel) of the single-stage samples is lower than the helium pycnometry value (∼28%) (Charlaftis et al., 2021) for the same sample volume (the cylindrical volume). In accordance with previous studies, significant differences between the two techniques are to be expected, given the spatial scales of the measurements (Callow et al., 2020). Here, the samples being analyzed are the same, and the difference is caused by the spatial resolution of the XCT data. The missing porosity is mainly credited to the unresolved microporous regions (e.g., below the maximum voxel resolution) that contribute to the total porosity (Saxena et al., 2019), and to a lesser extent to partial volume effects occurring between high-contrast edges (e.g., grain coatings and void space).
An appraisal of those parameters was performed on sample S6B (1.7 μm/voxel) which presents an initial XCT-derived porosity and microporous volume of ∼14.5 and ∼10%, respectively (Figure 5A). Pore space within the clay mineral fraction is dominated by disconnected intragranular pores (Milliken and Curtis, 2016). Diagenetic kaolinite, depending on its texture, has microporosity up to 61% (Hurst and Nadeau, 1995), with blocky compact kaolinite minerals presenting an average microporosity of 20% (Alansari et al., 2019). By adding the estimated microporous volume, the XCT-derived total porosity increases to ∼20.5%, compared to a helium-derived value of ∼28%. Although sample S6B is not volumetrically equal to samples S1-S5, the higher resolution imaging increases the pore volume quantified from the XCT data.
The difference in the diagenetic history between the single- and multi-stage samples is reflected in the evolution of the grain coating material.
In both scenarios the grain coating volumetric increase is attributed to the development of chlorite coatings (Figure 5C) which can be formed by siderite replacement and neoformation on precursor-free substrate surfaces. The progressive temperature increase adopted in the multi-stage treatment causes a gradual dissolution of the siderite crystals. In contrast, the single-stage treatment instigates an abrupt decomposition associated with dissolution voids at the central parts of the siderite crystals (Charlaftis et al., 2021). The rapid siderite decomposition promotes higher concentration of Fe ions, thus increased chlorite precipitation rates given sufficient temperatures. Based on our observations, precipitation rates are temperature-dependent and not time-dependent. Irrespective of experimental duration, both treatments suggest a synchronous, temperature-wise, initiation of chlorite development. This validates the widely held view that temperature is the principal control on chlorite coating authigenesis (Hillier, 1994; Ajdukiewicz and Larese, 2012).
The hydrothermal experiments were all performed in a silica supersaturated system, yet the main mineralogical change causing porosity reduction is the evolution of the pore-filling kaolinite (Figure 5D), not the development of quartz cement overgrowths. Temperature increase coupled with silica availability and the observed dissolution of feldspars, assist the transformation of kaolinite to dickite. The initiation of this replacement occurs at ∼ 150°C, comparable to natural systems where it is reported to occur in the temperature range of 110–165°C (Ehrenberg et al., 1993; Beaufort et al., 1998).
The experimental results suggest that the authigenic chlorite coatings develop in preference to quartz cement at temperatures >150°C. The overall grain coating volumetric increase is crucial for the effectiveness of quartz cement inhibition through offering fewer nucleation sites for quartz to precipitate. It also provides a mechanism for preserving effective storage space and connected pathways for unrestricted fluid flow at the pore scale. Figure 8 summarizes the main diagenetic processes observed during the hydrothermal treatment.
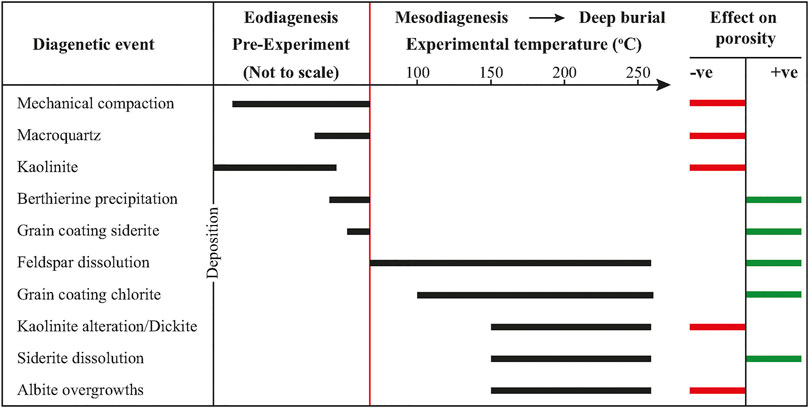
FIGURE 8. Paragenetic sequence of the main diagenetic processes occurring before and during the hydrothermal experiments with an indication regarding the effect on porosity of each. The experimental temperature range of each process is based on the 2D and 3D analysis performed by Charlaftis et al. (2021) and the present study. Red line separates the pre-to post-reaction diagenetic events and marks the early stage of mesodiagenesis.
The evolution of the pore networks indicates that the magnitude of diagenesis governs the pore and throat sizes and pore connectivity. The decrease in size of pore and throat radii is attributed to the progressive kaolinite cement evolution and, to a lesser extent, to albite overgrowth development. Kaolinite progressively chokes primary pores and many of the throats have been completely sealed resulting in fluid flow restriction. The permeability models indicate that, between 150 and 200°C, initial areas of reduced velocity magnitudes are converted to preferential fluid flow pathways whereas others cease to exist. This suggests that microporosity plays an important role not only on the ability of rocks to store fluids but also to permit fluid flow. The dissolution of unstable grains, such as feldspars, and the pore filling kaolinite cement drive increased flow to parts of the network that initially had low flow velocity magnitudes. At temperatures higher than 200°C permeability is stabilized. Dissolution pore space becomes interconnected with intergranular pores, thereby maintaining an open pore system with improved effectiveness.
Natural diagenetic conditions cannot be fully reproduced in the laboratory due to the short experimental time compared to a geological timeframe and the simplification and uncertainties associated with the chosen aqueous chemistry. However, the experimental approach presented here, reveals the changing pore-throat characteristics and identifies the critical threshold temperature above which the increase in grain coating volume prevents further porosity reduction. Targets for future experiments would be prolonged experimental times and an X-ray compatible hydrothermal setup to allow observation during precipitation. This would permit better constraint of the temporal changes in porosity and the associated changes in permeability. From the technical perspective, synchrotron-based imaging with monochromatic X-rays would also help to capture phase distribution (e.g., chlorite and siderite) that cannot be easily resolved by lab scanners. A future target would also be to collect more high-resolution SEM data and permeability measurements at the micrometer scale to enable more advanced numerical modeling and understanding the effective permeability of the pore filling phases.
Sandstone reservoirs are primary targets for hydrocarbon, carbon capture and storage, hydrogen storage, and geothermal exploration operations. This research provides valuable insights into the extent, in terms of volume, of grain coating development and subsequent porosity and permeability evolution with increasing temperature. The ability to better constrain the temperature ranges and the associated volumetric alterations under which grain coating authigenesis occurs will result in more reliable reservoir quality predictions, essential as we undergo a low carbon energy transition.
The integration of hydrothermal experiments coupled with XCT 3D quantitative assessment and, microscopic and modeling techniques provides an opportunity to probe the evolution of petrophysical and mineralogical properties of sandstone reservoirs across a continuum of temperature-scales. This work presents the analysis of two sets of hydrothermal experiments on naturally occurring sandstone samples, using an artificial silica supersaturated solution, at specific temperature steps (i.e., from 0°C up to 250°C), in an attempt to glean more information and gain greater understanding on burial diagenesis and its implication on reservoir quality. Quantitative datasets, per experimental set, regarding; 1) the volume of grain coatings and microporous material, 2) pore-throat characteristics and 3) porosity and permeability, were produced. The main findings of this study are:
1) A 3-dimensional quantitative confirmation of the effectiveness of grain coatings on porosity preservation in high-temperature sandstone reservoirs. Regardless of the experimental duration, the XCT analysis identified that grain coating volumetric increase initiates at ∼150°C and becomes dominant between 200 and 250°C. SEM analysis revealed the synthesis of authigenic chlorite coatings that are morphologically akin to naturally occurring chlorite coatings. The newly precipitated chlorite coatings alongside the pre-existing siderite grain coatings contribute to the inhibition of quartz cementation and the cessation of porosity loss during the same temperature interval.
2) The main porosity reduction window lies between 150 and 200°C and is mainly associated with the evolution of pore filling kaolinite blocking primary pore space and destroying microporosity.
3) The samples from the single-stage heating approach were scanned with a spatial resolution of 3.8 μm/voxels showing a ∼9% volumetric increase of the grain coating material at 250°C. Porosity remained unaltered up to 150°C and reduced by ∼13% at 200°C and ∼20% at 250°C. Porosity models have captured the reduction in the pore-throat connectivity as well as the reduction of the pore and throat sizes with increasing temperature. The mean coordination number was reduced from 3.3 to 2.5, the pore radius from ∼126 to ∼115 μm and the throat radius from ∼27 to ∼23 μm at 250°C. Permeability was reduced from ∼26 mD (200°C) to ∼22 mD (250°C).
4) The higher resolution scans (e.g., 1.7 μm/voxel) of the multi-stage sample showed a volumetric increase of the grain coating material of ∼4% from 200°C onwards. The AQM analysis identified the presence of ∼14%, by weight, chlorite content. Porosity was reduced by ∼32% at 200°C and ∼37% at 250°C. The mean coordination number was decreased from an initial value of 8 to 4.9 at 250°C and the mean pore and throat radius was decreased by 2 μm. The microporous material was diminished by ∼50%. Permeability evolution of three analyzed cubic subvolumes decreases mainly between 150 and 200°C.
The 3D quantitative data can be used to improve predictability of reservoir quality modeling in high-temperature (>150°C), deeply buried reservoir sandstones.
Raw XCT data are available online at http://doi.org/10.15128/r30v838056z (S1, S2, S5), http://doi.org/10.15128/r32514nk484 (S6A), and http://doi.org/10.15128/r3bc386j205 (S6B). Further inquiries can be directed to the corresponding author.
DC performed the hydrothermal experiments and carried out the SEM and AQM analysis, XCT acquisition of samples S1-S5 and, XCT analysis and porosity and permeability modeling of all samples. DC, KJD, and SJJ contributed to the interpretation of the data and writing of the manuscript. DL performed the XCT acquisition of sample S6. JoC assisted in the AQM analysis. JeC performed the XCT reconstruction of sample S6.
The research contained in this paper was undertaken as part of a fully-funded Durham Doctoral Studentship awarded to DC whose support is gratefully acknowledged. KJD was supported by NERC NE/M018687/2.
DL, JoC, and JeC are employed by BP
The remaining authors declare that the research was conducted in the absence of any commercial or financial relationships that could be construed as a potential conflict of interest.
All claims expressed in this article are solely those of the authors and do not necessarily represent those of their affiliated organizations, or those of the publisher, the editors, and the reviewers. Any product that may be evaluated in this article, or claim that may be made by its manufacturer, is not guaranteed or endorsed by the publisher.
We acknowledge support from BP and access to their SEM facilities and extensive advice offered. The authors would like to thank Phil Dyer (Durham University) for help and assistance with the autoclave hydrothermal experiments.
The Supplementary Material for this article can be found online at: https://www.frontiersin.org/articles/10.3389/feart.2022.766145/full#supplementary-material
Aagaard, P., Jahren, J. S., Harstad, A. O., Nilsen, O., and Ramm, M. (2000). Formation of Grain-Coating Chlorite in Sandstones. Laboratory Synthesized vs. Natural Occurrences. Clay miner. 35, 261–269. doi:10.1180/000985500546639
Ajdukiewicz, J. M., and Lander, R. H. (2010). Sandstone Reservoir Quality Prediction: the State of the Art. Bulletin 94, 1083–1091. doi:10.1306/Intro060110
Ajdukiewicz, J. M., and Larese, R. E. (2012). How clay Grain coats Inhibit Quartz Cement and Preserve Porosity in Deeply Buried Sandstones: Observations and Experiments. Bulletin 96, 2091–2119. doi:10.1306/02211211075
Alansari, A., Salim, A. M. A., Janjuhah, H. T., Bin Abd Rahman, A. H., and Fello, N. M. (2019). Quantification of clay mineral Microporosity and its Application to Water Saturation and Effective Porosity Estimation: A Case Study from Upper Ordovician Reservoir, Libya. J. Nat. Gas Geosci. 4, 139–150. doi:10.1016/j.jnggs.2019.04.005
Andrä, H., Combaret, N., Dvorkin, J., Glatt, E., Han, J., Kabel, M., et al. (2013). Digital Rock Physics Benchmarks-Part I: Imaging and Segmentation. Comput. Geosciences 50, 25–32. doi:10.1016/j.cageo.2012.09.005
Andrew, H., and Nadeau, P. H. (1995). Clay Microporosity in Reservoir Sandstones: An Application of Quantitative Electron Microscopy in Petrophysical Evaluation. Bulletin 79, 563–573. doi:10.1306/8D2B1598-171E-11D7-8645000102C1865D
Anjos, S. M. C., De Ros, L. F., and Silva, C. M. A. (2003). “Chlorite Authigenesis and Porosity Preservation in the Upper Cretaceous marine Sandstones of the Santos Basin, Offshore Eastern Brazil,” in Clay Mineral Cements in Sandstones. Editors R. H. Worden, and S. Morad (International Association of Sedimentologists), 34, 289–316. doi:10.1002/9781444304336.ch13
Anovitz, L. M., and Cole, D. R. (2015). Characterization and Analysis of Porosity and Pore Structures. Rev. Mineralogy Geochem. 80, 61–164. doi:10.2138/rmg.2015.80.04
Bakke, S., and Øren, P.-E. (1997). 3-D Pore-Scale Modelling of Sandstones and Flow Simulations in the Pore Networks. Soc. Pet. Eng. J. 2, 136–149. doi:10.2118/35479-PA
Beaufort, D., Cassagnabere, A., Petit, S., Lanson, B., Berger, G., Lacharpagne, J. C., et al. (1998). Kaolinite-to-dickite Reaction in sandstone Reservoirs. Clay miner. 33, 297–316. doi:10.1180/000985598545499
Berger, A., Gier, S., and Krois, P. (2009). Porosity-preserving Chlorite Cements in Shallow-marine Volcaniclastic Sandstones: Evidence from Cretaceous Sandstones of the Sawan Gas Field, Pakistan. Bulletin 93, 595–615. doi:10.1306/01300908096
Bin, B., Rukai, Z., Songtao, W., Wenjing, Y., Jeff, G., Allen, G., et al. (2013). Multi-scale Method of Nano(Micro)-CT Study on Microscopic Pore Structure of Tight sandstone of Yanchang Formation, Ordos Basin. Pet. Exploration Dev. 40, 354–358. doi:10.1016/S1876-3804(13)60042-7
Bjørlykke, K., and Egeberg, P. K. (1993). Quartz Cementation in Sedimentary Basins. Bulletin 77, 1538–1548. doi:10.1306/BDFF8EE8-1718-11D7-8645000102C1865D
Bjørlykke, K. (2014). Relationships between Depositional Environments, Burial History and Rock Properties. Some Principal Aspects of Diagenetic Process in Sedimentary Basins. Sediment. Geology. 301, 1–14. doi:10.1016/j.sedgeo.2013.12.002
Bloch, S. (1994). “Importance of Reservoir Quality Prediction in Exploration,” in Reservoir Quality Assessment and Prediction in Clastic Rocks. Editor M. D. Wilson (Tulsa: SEPM Society for Sedimentary Geology), 5–8. doi:10.2110/scn.94.30.0005
Bultreys, T., Van Hoorebeke, L., and Cnudde, V. (2015). Multi-scale, Micro-computed Tomography-Based Pore Network Models to Simulate Drainage in Heterogeneous Rocks. Adv. Water Resour. 78, 36–49. doi:10.1016/j.advwatres.2015.02.003
Callow, B., Falcon-Suarez, I., Marin-Moreno, H., Bull, J. M., and Ahmed, S. (2020). Optimal X-ray Micro-CT Image Based Methods for Porosity and Permeability Quantification in Heterogeneous Sandstones. Geophys. J. Int. 223, 1210–1229. doi:10.1093/gji/ggaa321
Charlaftis, D., Jones, S. J., Dobson, K. J., Crouch, J., and Acikalin, S. (2021). Experimental Study of Chlorite Authigenesis and Influence on Porosity Maintenance in Sandstones. J. Sediment. Res. 91, 197–212. doi:10.2110/jsr.2020.122
Cnudde, V., and Boone, M. N. (2013). High-resolution X-ray Computed Tomography in Geosciences: A Review of the Current Technology and Applications. Earth-Science Rev. 123, 1–17. doi:10.1016/j.earscirev.2013.04.003
Dong, H., Touati, M., and Blunt, M. J. (2007). “Pore Network Modeling: Analysis of Pore Size Distribution of Arabian Core Samples,” in SPE Middle East Oil and Gas Show and Conference, Manama, Bahrain, March 11-14, 2007 (Society of Petroleum Engineers). doi:10.2118/105156-MS
Dowey, P. J., Hodgson, D. M., and Worden, R. H. (2012). Pre-requisites, Processes, and Prediction of Chlorite Grain Coatings in Petroleum Reservoirs: a Review of Subsurface Examples. Mar. Pet. Geology. 32, 63–75. doi:10.1016/j.marpetgeo.2011.11.007
Dutton, S. P., Hutton, M. E., Ambrose, W. A., Childers, A. T., and Loucks, R. G. (2018). Preservation of Reservoir Quality by Chlorite coats in Deep Tuscaloosa Sandstones, Central Louisiana, U.S.A. Gulf Coast Assoc. Geol. Societies. 7, 46–58.
Ehrenberg, S. N., Aagaard, P., Wilson, M. J., Fraser, A. R., and Duthie, D. M. L. (1993). Depth-dependent Transformation of Kaolinite to Dickite in Sandstones of the Norwegian continental Shelf. Clay miner. 28, 325–352. doi:10.1180/claymin.1993.028.3.01
Ehrenberg, S. N. (1993). Preservation of Anomalously High Porosity in Deeply Buried Sandstones by Grain-Coating Chlorite: Examples from the Norwegian continental Shelf. Bulletin 77, 1260–1286. doi:10.1306/BDFF8E5C-1718-11D7-8645000102C1865D
Ehrenberga, S. N., Dalland, A., Nadeau, P. H., Mearns, E. W., and Amundsen, E. F. (1998). Origin of Chlorite Enrichment and Neodymium Isotopic Anomalies in Haltenbanken Sandstones. Mar. Pet. Geology. 15, 403–425. doi:10.1016/S0264-8172(98)00023-3
Fheed, A., Krzyżak, A., and Świerczewska, A. (2018). Exploring a Carbonate Reef Reservoir - Nuclear Magnetic Resonance and Computed Microtomography Confronted with Narrow Channel and Fracture Porosity. J. Appl. Geophys. 151, 343–358. doi:10.1016/j.jappgeo.2018.03.004
Golab, A. N., Knackstedt, M. A., Averdunk, H., Senden, T., Butcher, A. R., and Jaime, P. (2010). 3D Porosity and Mineralogy Characterization in Tight Gas Sandstones. The Leading Edge 29, 1476–1483. doi:10.1190/1.3525363
Haile, B. G., Hellevang, H., Aagaard, P., and Jahren, J. (2015). Experimental Nucleation and Growth of Smectite and Chlorite Coatings on Clean Feldspar and Quartz Grain Surfaces. Mar. Pet. Geology. 68, 664–674. doi:10.1016/j.marpetgeo.2015.02.006
Harlow, F. H., and Welch, J. E. (1965). Numerical Calculation of Time-dependent Viscous Incompressible Flow of Fluid with Free Surface. Phys. Fluids 8, 2182–2189. doi:10.1063/1.1761178
Hazlett, R. D. (1997). Statistical Characterization and Stochastic Modeling of Pore Networks in Relation to Fluid Flow. Math. Geol. 29, 801–822. doi:10.1007/BF02768903
Hillier, S. (1994). Pore-lining Chlorites in Siliciclastic Reservoir Sandstones: Electron Microprobe, SEM and XRD Data, and Implications for Their Origin. Clay miner. 29, 665–679. doi:10.1180/claymin.1994.029.4.20
Iassonov, P., Gebrenegus, T., and Tuller, M. (2009). Segmentation of X-ray Computed Tomography Images of Porous Materials: A Crucial Step for Characterization and Quantitative Analysis of Pore Structures. Water Resour. Res. 45, 1–12. doi:10.1029/2009WR008087
Jahren, J., Olsen, E., and Bjørlykke, K. (1998). “Chlorite Coatings in Deeply Buried Sandstones - Examples from the Norwegian Shelf,” in Water-Rock Interaction. Editors G. B. Arehart, and J. R. Hulston (Rotterdam: Balkema), 321–324.
Keehm, Y., Mukerji, T., and Nur, A. (2004). Permeability Prediction from Thin Sections: 3D Reconstruction and Lattice-Boltzmann Flow Simulation. Geophys. Res. Lett. 31, 1–4. doi:10.1029/2003GL018761
Ketcham, R. A., and Carlson, W. D. (2001). Acquisition, Optimization and Interpretation of X-ray Computed Tomographic Imagery: Applications to the Geosciences. Comput. Geosciences 27, 381–400. doi:10.1016/S0098-3004(00)00116-3
Kingston, A., Sakellariou, A., Varslot, T., Myers, G., and Sheppard, A. (2011). Reliable Automatic Alignment of Tomographic Projection Data by Passive Auto-Focus. Med. Phys. 38, 4934–4945. doi:10.1118/1.3609096
Lander, R. H., Larese, R. E., and Bonnell, L. M. (2008). Toward More Accurate Quartz Cement Models: The Importance of Euhedral versus Noneuhedral Growth Rates. Bulletin 92, 1537–1563. doi:10.1306/07160808037
Latham, S. J., Kingston, A. M., Recur, B., Myers, G. R., Delgado-Friedrichs, O., and Sheppard, A. P. (2018). Reprojection Alignment for Trajectory Perturbation Estimation in Microtomography. IEEE Trans. Comput. Imaging 4, 271–283. doi:10.1109/TCI.2018.2811945
Liang, Z., Ioannidis, M. A., and Chatzis, I. (2000). Permeability and Electrical Conductivity of Porous media from 3D Stochastic Replicas of the Microstructure. Chem. Eng. Sci. 55, 5247–5262. doi:10.1016/S0009-2509(00)00142-1
Lindquist, W. B., Venkatarangan, A., Dunsmuir, J., and Wong, T.-F. (2000). Pore and Throat Size Distributions Measured from Synchrotron X-ray Tomographic Images of Fontainebleau Sandstones. J. Geophys. Res. 105, 21509–21527. doi:10.1029/2000JB900208
Mahmic, O., Dypvik, H., and Hammer, E. (2018). Diagenetic Influence on Reservoir Quality Evolution, Examples from Triassic Conglomerates/arenites in the Edvard Grieg Field, Norwegian North Sea. Mar. Pet. Geology. 93, 247–271. doi:10.1016/j.marpetgeo.2018.03.006
Markussen, Ø., Dypvik, H., Hammer, E., Long, H., and Hammer, Ø. (2019). 3D Characterization of Porosity and Authigenic Cementation in Triassic Conglomerates/arenites in the Edvard Grieg Field Using 3D Micro-CT Imaging. Mar. Pet. Geology. 99, 265–281. doi:10.1016/j.marpetgeo.2018.10.015
Martín-Martín, J. D., Gómez-Gras, D., Sanfeliu, T., Thiry, M., Ruiz-Cruz, M. D., and Franco, F. (2007). Extensive Dickitization of the Permo-Triassic Fluvial Sandstones from the Eastern Iberian Range, Spain. Clays Clay Miner. 55, 481–490. doi:10.1346/CCMN.2007.0550503
McBride, E. F. (1989). Quartz Cement in Sandstones: a Review. Earth-Science Rev. 26, 69–112. doi:10.1016/0012-8252(89)90019-6
Milliken, K. L., and Curtis, M. E. (2016). Imaging Pores in Sedimentary Rocks: Foundation of Porosity Prediction. Mar. Pet. Geology. 73, 590–608. doi:10.1016/j.marpetgeo.2016.03.020
Morad, S. (1998). “Carbonate cementation in sandstones: Distribution patterns and geochemical evolution,” in Carbonate Cementation in Sandstones. Editors S. Morad (International Association of Sedimentologists, Special Publication), 26, 1–26. doi:10.1002/9781444304893.ch1
Øren, P.-E., and Bakke, S. (2002). Process Based Reconstruction of Sandstones and Prediction of Transport Properties. Transport in Porous Media 46, 311–343. doi:10.1023/A:1015031122338
Osborne, M., Haszeldine, R. S., and Fallick, A. E. (1994). Variation in Kaolinite Morphology with Growth Temperature in Isotopically Mixed Pore-Fluids, Brent Group, UK North Sea. Clay miner. 29, 591–608. doi:10.1180/claymin.1994.029.4.15
Pak, T., Butler, I. B., Geiger, S., Van Dijke, M. I. J., Jiang, Z., and Surmas, R. (2016). Multiscale Pore-Network Representation of Heterogeneous Carbonate Rocks. Water Resour. Res. 52, 5433–5441. doi:10.1002/2016WR018719
Peng, S., Marone, F., and Dultz, S. (2014). Resolution Effect in X-ray Microcomputed Tomography Imaging and Small Pore's Contribution to Permeability for a Berea sandstone. J. Hydrol. 510, 403–411. doi:10.1016/j.jhydrol.2013.12.028
Pittman, E. D., Larese, R. E., and Heald, M. T. (1992). “Clay coats: Occurrence and Relevance to Preservation of Porosity in Sandstones,” in Origin, Diagenesis and Petrophysics of Clay Minerals in Sandstones. Editors D. W. Houseknecht, and E. D. Pittman (SEPM), 47, 241–255. doi:10.2110/pec.92.47.0241
Saxena, N., Hows, A., Hofmann, R., Freeman, J., and Appel, M. (2019). Estimating Pore Volume of Rocks from Pore-Scale Imaging. Transp Porous Med. 129, 403–412. doi:10.1007/s11242-019-01295-x
Schmitt, M., Halisch, M., Müller, C., and Fernandes, C. P. (2016). Classification and Quantification of Pore Shapes in sandstone Reservoir Rocks with 3-D X-ray Micro-computed Tomography. Solid Earth 7, 285–300. doi:10.5194/se-7-285-2016
Silin, D. B., Jin, G., and Patzek, T. W. (2003). “Robust Determination of Pore Space Morphology in Sedimentary Rocks,” in Paper presented at the SPE Annual Technical Conference and Exhibition, Denver, Colorado, October 2003. doi:10.2118/84296-MS
Silin, D., and Patzek, T. (2006). Pore Space Morphology Analysis Using Maximal Inscribed Spheres. Physica A: Stat. Mech. its Appl. 371, 336–360. doi:10.1016/j.physa.2006.04.048
Stricker, S., and Jones, S. J. (2018). “Enhanced Porosity Preservation by Pore Fluid Overpressure and Chlorite Grain Coatings in the Triassic Skagerrak, Central Graben, North Sea, UK,” in Reservoir Quality of Clastic and Carbonate Rocks: Analysis, Modelling and Prediction. Editors P. J. Armitage, A. Butcher, J. Churchill, A. Csoma, C. Hollis, R. H. Landeret al. (London, UK: Geological Society of London), 435, 321–341. doi:10.1144/SP435.4
Taylor, T. R., Giles, M. R., Hathon, L. A., Diggs, T. N., Braunsdorf, N. R., Birbiglia, G. V., et al. (2010). Sandstone Diagenesis and Reservoir Quality Prediction: Models, Myths, and Reality. Bulletin 94, 1093–1132. doi:10.1306/04211009123
Thomson, P.-R., Aituar-Zhakupova, A., and Hier-Majumder, S. (2018). Image Segmentation and Analysis of Pore Network Geometry in Two Natural Sandstones. Front. Earth Sci. 6, 58. doi:10.3389/feart.2018.00058
Thomson, P.-R., Ellis, R., Chiarella, D., and Hier-Majumder, S. (2020). Microstructural Analysis from X-ray Ct Images of the Brae Formation Sandstone, North Sea. Front. Earth Sci. 8, 246. doi:10.3389/feart.2020.00246
Tsai, W.-H. (1985). Moment-preserving Thresolding: A New Approach. Comp. Vis. Graphics, Image Process. 29, 377–393. doi:10.1016/0734-189X(85)90133-1
Varslot, T., Kingston, A., Myers, G., and Sheppard, A. (2012). “Considerations for High-Magnification High-Cone-Angle Helical Micro-CT,” in Proc. SPIE 8506, San Diego, CA, October 17, 2012. doi:10.1117/12.929304
Weickert, J., Romeny, B. M. T. H., and Viergever, M. A. (1998). Efficient and Reliable Schemes for Nonlinear Diffusion Filtering. IEEE Trans. Image Process. 7, 398–410. doi:10.1109/83.661190
Wildenschild, D., and Sheppard, A. P. (2013). X-ray Imaging and Analysis Techniques for Quantifying Pore-Scale Structure and Processes in Subsurface Porous Medium Systems. Adv. Water Resour. 51, 217–246. doi:10.1016/j.advwatres.2012.07.018
Worden, R. H., Griffiths, J., Wooldridge, L. J., Utley, J. E. P., Lawan, A. Y., Muhammed, D. D., et al. (2020). Chlorite in Sandstones. Earth-Science Rev. 204, 103105. doi:10.1016/j.earscirev.2020.103105
Worden, R. H., and Morad, S. (2003). “Clay Minerals in Sandstones: Controls on Formation, Distribution and Evolution,” in Clay Mineral Cements in Sandstones. Editors R. H. Worden, and S. Morad (International Association of Sedimentologists, Special Publication), 34, 1–41. doi:10.1002/9781444304336.ch1
Worden, R. H., and Morad, S. (2000). “Quartz Cementation in Oil Field Sandstones: a Review of the Key Controversies,” in Quartz Cementation in Sandstones. Editors R. H. Worden, and S. Morad (International Association of Sedimentologists), 29, 1–20. doi:10.1002/9781444304237.ch1
Youssef, S., Rosenberg, E., Gland, N. F., Kenter, J. A., Skalinski, M., and Vizika, O. (2007). “High Resolution CT and Pore-Network Models to Assess Petrophysical Properties of Homogeneous and Heterogeneous Carbonates,” in SPE/EAGE Reservoir Characterization and Simulation Conference, Abu Dhabi, UAE, October 19-21, 2009 (Society of Petroleum Engineers). doi:10.2118/111427-MS
Keywords: Cook Formation sandstone, diagenesis, pore network modeling, permeability, grain coatings
Citation: Charlaftis D, Dobson KJ, Jones SJ, Lakshtanov D, Crouch J and Cook J (2022) Experimental Simulation of Burial Diagenesis and Subsequent 2D-3D Characterization of Sandstone Reservoir Quality. Front. Earth Sci. 10:766145. doi: 10.3389/feart.2022.766145
Received: 28 August 2021; Accepted: 24 January 2022;
Published: 21 February 2022.
Edited by:
Michael Andrew Clare, University of Southampton, United KingdomReviewed by:
Hazel Beaumont, University of the West of England, United KingdomCopyright © 2022 Charlaftis, Dobson, Jones, Lakshtanov, Crouch and Cook. This is an open-access article distributed under the terms of the Creative Commons Attribution License (CC BY). The use, distribution or reproduction in other forums is permitted, provided the original author(s) and the copyright owner(s) are credited and that the original publication in this journal is cited, in accordance with accepted academic practice. No use, distribution or reproduction is permitted which does not comply with these terms.
*Correspondence: Dimitrios Charlaftis, ZGltaXRyaW9zLmNoYXJsYWZ0aXNAZHVyaGFtLmFjLnVr
Disclaimer: All claims expressed in this article are solely those of the authors and do not necessarily represent those of their affiliated organizations, or those of the publisher, the editors and the reviewers. Any product that may be evaluated in this article or claim that may be made by its manufacturer is not guaranteed or endorsed by the publisher.
Research integrity at Frontiers
Learn more about the work of our research integrity team to safeguard the quality of each article we publish.