 Benjamin W. Johnson
 Colin Mettam2
 Simon W. Poulton
94% of researchers rate our articles as excellent or good
Learn more about the work of our research integrity team to safeguard the quality of each article we publish.
Find out more
ORIGINAL RESEARCH article
Front. Earth Sci., 13 June 2022
Sec. Biogeoscience
Volume 10 - 2022 | https://doi.org/10.3389/feart.2022.745830
This article is part of the Research TopicRefining the Interpretation of Nitrogen Isotopes in Deep Time SystemsView all 11 articles
The history of the nitrogen cycle on Earth is linked to the redox evolution of the surface environment. Many nitrogen cycle fluxes are microbially mediated, and the particular fluxes operating at any given time in an ecosystem depend on the presence, absence or abundance of oxygen. However, interpreting this relationship is complicated as several isotopic fractionations associated with N-cycling are not diagnostic of a particular redox state. Thus, linking nitrogen isotopic analyses with redox-sensitive proxies is essential when interpretating past environments. Specifically, we use concentrations of U, V and Mo, along with Fe-speciation, to augment and contextualize nitrogen isotopic measurements. As an example, we consider samples from the Neoproterozoic Cryogenian period to suggest that there was oxygenated water, with associated aerobic N cycle fluxes. This interpretation is based on positive δ15N values between 4 to 80/00, Fe-speciation data consistent with anoxic bottom water during the Snowball ocean and oxygenated after, and redox-sensitive trace metals indicative of oxic weathering and surface water. Typically, high δ15N values are interpreted to reflect enhanced denitrification. We propose potential causes including a post-Snowball freshwater melt lid that suppressed deep water ventilation and that denitrification occurred more rapidly at high temperatures after the Snowball. These interpretations are buttressed by combined N isotope and redox analyses. This approach is especially useful during times of dynamic redox in the ocean-atmosphere system to interpret biologic isotopic signals.
Nitrogen is a key nutrient for life, a major component of the atmosphere, and tracks connections between the biosphere, atmosphere, and geosphere over long time scales (Zerkle and Mikhail, 2017). It is possible to investigate changes in the evolution and operation of the ancient nitrogen cycle via stable isotope geochemistry1 as nitrogen undergoes a number of biologically mediated, redox sensitive transformations, each of which is associated with an isotopic fractionation (see Stüeken et al., 2016a).
Atmospheric N2 enters the biosphere via nitrogen fixation by diazotrophic organisms. Such fixing splits the triple bond in N2 using the nitrogenase enzyme. The most common enzyme (Fe - Mo nitrogenase) produces a minimal isotopic effect (Zhang et al., 2014). Nitrogen which is then remineralised from diazotrophic biomass can be stable and bioavailable in the environment as
Denitrification and anammox, which are microbially mediated respiration reactions that transform
We can observe in modern oceans that sedimentary N-isotope values reflect the integrated signal of nitrogen cycling by organisms in the water column (Tesdal et al., 2013). However, interpretation of N-isotope values is complicated by the fact that fractionations produced by transitions between N compounds are not diagnostic (Busigny et al., 2013; Ader et al., 2014, 2016; Stüeken et al., 2016b). For example, a bulk ecosystem δ15N value of 00/00 typically indicates anaerobic conditions (e.g., Garvin et al., 2009), but could also reflect quantitative nitrification without any denitrification. The latter case could occur in a completely aerobic environment, and thus the same bulk δ15N value could be produced under completely opposite redox conditions in the water column. These issues are amplified in ancient sediments and rocks, since we cannot measure contemporaneous water conditions during sediment deposition.
In the Precambrian, most measured δ15N values from sediments are positive (Stüeken et al., 2016a). During this time, anoxic water and potential oxyclines were more widespread. As a result there are multiple scenarios which could lead to positive δ15N values. For example, in a study of the Archean Mount McRae Shale and Brockman Iron Formations Busigny et al. (2013) measured variable but consistently positive δ15N values. Such positive values could reflect partial assimilation of
Previous nitrogen isotope studies of Neoproterozoic sedimentary rocks observed mostly positive δ15N values (Ader et al., 2014; Wang et al., 2017; Stüeken et al., 2019a). Such values have mostly been interpreted to reflect an aerobic nitrogen cycle, due to the similarity of measured δ15N to the modern ocean. As discussed, however, the relationship between N-isotopes as recorded in sediments and water column redox state is not straightforward. There are multiple potential environmental redox structures that can produce similar δ15N values in sediments.
Thus, in order to interpret nitrogen isotope data it is essential to independently establish redox conditions in the depositional environment. This ideally includes both water column and sediment-water interface proxy data. Previous work has combined redox proxies with carbon isotopes (e.g., Kunzmann et al., 2015), and some have combined redox proxies with nitrogen isotopes (Quan et al., 2008, 2013; Zerkle et al., 2017; Stüeken et al., 2019b). This is crucial, given the strong connection between nitrogen cycling and oxygen. In this contribution, we combined redox proxies - redox sensitive trace elements and Fe-speciation - and nitrogen isotopes. Specifically, we apply this approach to sediments from the Neoproterozoic Snowball Earth ocean with new measurements from the Mineral Fork and Kelley Canyon Formations in Utah, United States. We further compare our results to previous data from the Ghaub Formation (Johnson et al., 2017b) and find that syn-glacial sediments have consistently positive δ15N values which increase after the glaciation. Iron speciation suggests mostly anoxic bottom water during the glaciation and oxygenated bottom water after. Redox sensitive trace element concentrations suggest oxic weathering and an oxygenated upper water column throughout both the glaciation and afterwards. Combining all data, we suggest persistent oxygenated shallow water during Snowball glaciations which expands in depth after the glaciations. This finding supports previous interpretations of the Neoproterozoic ocean redox structure, and provides additional evidence for oxygenated water in the syn-glacial ocean.
Samples presented in this study are from the Marinoan Ghaub Formation, Namibia (Johnson et al., 2017b) and the Mineral Fork Tillite and Kelley Canyon Formation, Utah, USA (Figure 1). Detailed description of the Ghaub samples are in Johnson et al. (2017b), but briefly these units are interpreted to be glacial outwash deposited below the ice-grounding line. The sequence was deposited during the Marinoan (
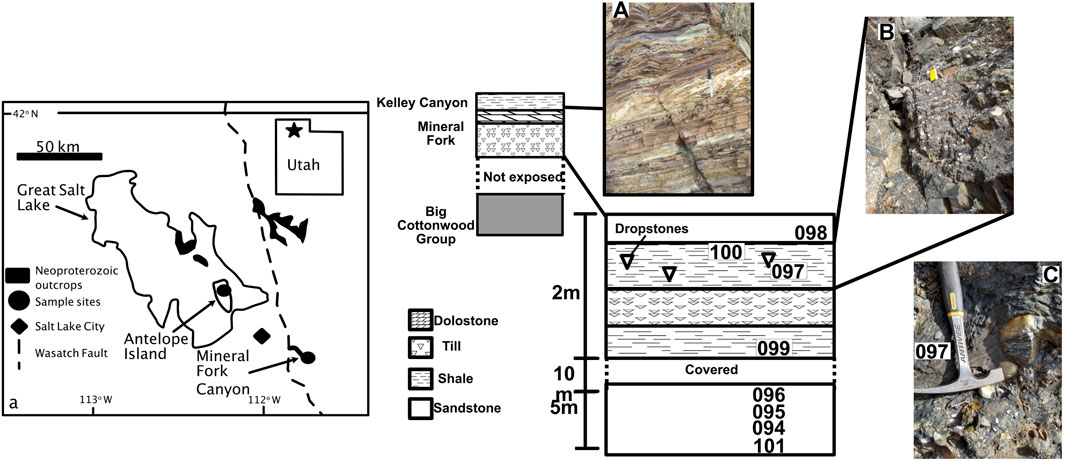
FIGURE 1. Generalized map showing outcrop area of Neoproterozoic strata in Utah, United States. Map is after Crittenden et al. (1983) and (Young, 2002). Generalized cross section is shown, with detail of Mineral Fork Canyon showing sample locations. Photo (A) shows Kelley Canyon Formation, and (B) and (C) show outcrop photos from Mineral Fork Canyon. Samples were taken from finely laminated units away from draping, as seen in photo c.
The Mineral Fork Formation is found in the central Wastach Range and on Antelope Island in Utah, United States. The unit comprises interbedded diamictites, sandstones and mudstones (Ojakangas and Matsch, 1980; Christie-Blick, 1982). The diamictite is typically massive, while the sandstone is subfeldspathic to quartzose, and includes laminated and cross-bedded facies; mudstones contain rare dropstones, several Fe-rich layers (Young, 2002), and carbonaceous layers with microfossils (Knoll et al., 1981). The unit is interpreted as having been deposited in a marginal marine setting, with dynamic glacial activity and periodic connection to the open ocean (Crittenden et al., 1983). Further, the overall geologic setting is consistent with a rifted margin creating accommodation space, but the depositional rate of the diamictite could have been more rapid than the accumulation of space due to tectonic activity (Hoffman P. F. et al., 2017). The relationship between glaciation, rifting, and deposition during the Sturtian in western North America may be complex (e.g., Kennedy and Eyles, 2021). We assume, however, for this study, that the Mineral Fork Formation is the result of glacial deposition in a marginal marine environment.
Age constraints are relatively poor. The Mineral Fork overlies the Big Cottonwood Formation, which is stratigraphically correlated with the
The paleogeographic location and tectonic setting of the Mineral Fork Formation is also not well constrained, due to its uncertain age. If the Mineral Fork is Sturtian, it is likely that it was deposited in a rift basin (Li et al., 2013; Merdith et al., 2017). Such a setting is more likely to have been a restricted basin, and thus would not record global oceanic geochemical conditions. If, however, the Mineral Fork is Marinoan, it was more likely deposited in a basin that was better connected to the global ocean (Li et al., 2013; Merdith et al., 2017). Regardless of this under-constrained geological setting, the main purpose of this study is to demonstrate that interpreting N isotopes in the geologic record is strengthened by combined consideration of independent redox proxies. Providing better constraints on the age of the Mineral Fork Formation, and whether or not these samples represent local or global signals, are beyond the scope of this paper.
We also analyzed samples from the Kelley Canyon Formation, which includes a post-Marinoan cap dolomite and a slate member (Table 1). Specifically, samples are from the slate member and from three distinct facies. The three facies contain layers that are purple and resistant, tan and resistant, and green-gray recessive. Bedding in all facies is thin (∼1–3 cm), supporting a depositional setting that is below wave-base (Table 1).

TABLE 1. Sample location and geologic information.
For all samples, we collected specimens free of obvious weathering or alteration. Prior to analyses, weathered edges of hand samples were trimmed with a rock saw. Samples were broken into smaller pieces with a rock hammer, and crushed to a powder in a motorized agate mortar and pestle. As detailed later, we argue that analyzed values represent primary values. Regional metamorphism was greenschist facies or lower (Yonkee et al., 2014), and measured values are very similar to previous work (Johnson et al., 2017b).
Nitrogen isotopic techniques for the Namibian samples are presented in (Johnson et al., 2017b), and are similar for Mineral Fork and Kelley Canyon Formation samples. Nitrogen concentration and isotope ratios for the Mineral Fork Formation were characterized at the University of Colorado Boulder Earth Systems Stable Isotope Lab (CUBES-SIL), and values for the Kelley Canyon Formation were determined, using identical protocol, at the Earth System Evolution Lab (EaSEL) at Iowa State University. Carbon concentrations were obtained during the same runs as N concentration and isotopic analyses, using the same standards.
Sample powders were decarbonated via reaction with 5 ml of 6 N HCl. Samples were then sonicated for 30 min. All tubes were then placed in a 60°C oven overnight. The next day, samples were centrifuged to settle all undissolved material. Acid was poured off, fresh acid was added as before, and samples sat in the oven overnight. This acid refresh was repeated once more. To clean samples, all were rinsed three times with DI H2O, centrifuging between each rinse. Sample powders then dried at 60 °C for 2 days; all vials containing multiples of the same sample powder were combined and homogenized after drying.
Samples were then analyzed on a Thermo Delta V after combustion in a Thermo Elemental Analyzer at CUBES-SIL and on a Thermo Delta V Plus following combustion in a Thermo Isolink EA at EaSEL. Between 50 and 100 mg of sample powder was weighed into a Sn capsule, as well as standards: two acetanilides (act1, δ15N = 1.180/00 ± 0.02 and act2, δ15N = 19.560/00 ± 0.03) and pugel (δ15N = 5.450/00 ± 0.1) at CUBES-SIL and urea (internal, δ15N = −2.60 ± 0.20/00) and caffeine (USGS62, δ15N = 20.17 ± 0.10/00) at EaSEL. All samples were flash-combusted with an excess of O2 at 1,020° C in a combustion column packed with cobaltous oxide (combustion aid) and silvered cobaltous oxide (sulphur scrubber). Combustion products were passed over a reduced copper to reduce all N to N2 and absorb excess O2. Finally, sample gas was passed through a magnesium perchlorate trap to absorb water and a 3 m gas chromatography column to separate N2 from CO2. All analyses were quantified using IsoDat software and the Isoreader pipeline (Kopf et al., 2021). Errors reported are standard deviations from repeated analyses.
While the dominant mineralogy of the Ghaub at this location is carbonate, the geochemical results presented here, and in Johnson et al. (2017b), reflect analysis of the siliciclastic portion of the Ghaub sediment. Carbonate was removed via dissolution, so that the clay minerals could be analyzed directly. Clays record both the N signal (Ader et al., 2016) and the trace metal budget (Tribovillard et al., 2006; Johnson et al., 2017b).
Mineral Fork and Kelley Canyon samples were analyzed in the same run as previously measured glacial till samples (Timeball Hill and Blaubeker) from published work (Gaschnig et al., 2016; Johnson et al., 2017b). Measured N and δ15N for Timeball (250 ppm, 5.060/00) and Blaubeker (158 ppm, 4.10/00) are similar to published values: 305 ± 5 ppm and 4.9 ± 0.30/00 for Timeball Hill; and 90 ± 20 ppm and 4.4 ± 0.20/00 for Blaubeker. We note that agreement in δ15N values is quite good, though there are differences in N concentration outside uncertainty. Further, we also ensured that organic standards (urea, acetanilide, pugel, and caffeine) used to calculate N concentration included very small standard amounts (
The Fe speciation method targets operationally defined Fe pools, including carbonate-associated Fe (Fecarb), ferric oxide Fe (Feox), magnetite Fe (Femag) and pyrite Fe (Fepy). Extractions were performed according to well-established protocols (Poulton and Canfield, 2005, 2011; Poulton, 2021), with subsequent analysis via atomic absorption spectroscopy (AAS) for Fecarb, Feox and Femag at the University of Leeds. Fepy was determined gravimetrically following chromous chloride distillation at the University of St Andrew’s. Previous studies have shown reproducibility of better than ±2% (Mettam et al., 2017). Total Fe (FeT) was determined after HF–HClO4–HNO3 dissolution via AAS. All Fe extractions gave a relative standard deviation (RSD) of
The sum of Fecarb, Feox, Femag and Fepy defines a highly reactive (FeHR) pool, which is considered to represent Fe that is biogeochemically reactive during deposition and early diagenesis (Raiswell and Canfield, 1998; Poulton et al., 2004). Anoxic waters commonly have FeHR/FeT ratios
Trace element composition was determined by ActLabs following their Ultratrace 4 protocol (https://actlabs.com/geochemistry/exploration-geochemistry/4-acid-near-total-digestion/). This is a total digestion using HF, HNO3 and HCl, followed by analysis via ICP-MS. All measured values are above stated detection limits which are 0.1, 1 and 0.05 ppm for U, V and Mo, respectively. Reported accuracy for all elements are within 1–5% compared to certified standards (GXR-4, SDC-1, DNC-1a, and SBC-1). Reported precisions are ±0.3 ppm for U, ± 2 ppm for V, and ±0.1 ppm for Mo.
We will first discuss the Fe-speciation and U, V and Mo redox proxy data. These establish the geochemical boundary conditions that govern the nitrogen cycle, and within which N isotope data can be interpreted. Then, we place the N isotopic data within this geochemical context. We also include data from Johnson et al. (2017b).
Iron speciation data from the Ghaub Formation are characteristic of anoxic, ferruginous bottom water (Figure 2), with Fepyrite/FeHR ratios below 0.1 and FeHR/Fetotal above 0.38. The Mineral fork and Kelly Canyon Formations, however, have Fe speciation data ranging from ferruginous to oxic conditions. In both Utah and Namibia, there appears to be minor fluctuations between anoxic and possibly oxic conditions, but in the samples from the Kelley Canyon Formation reflect oxygenated bottom waters after the Snowball glaciation (Table 2).
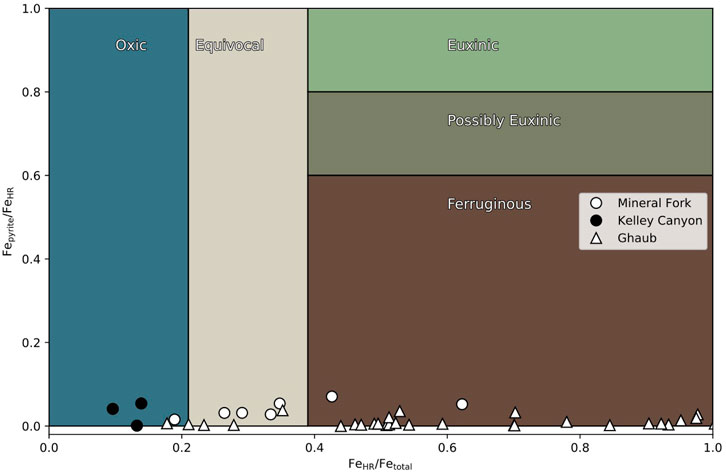
FIGURE 2. Iron speciation data from the Mineral fork tillite (circles), Kelley Canyon Formation (filled circles) and the Ghaub Formation (triangles). Some samples from both settings plot in the fields characteristic of oxic bottom waters. Specifically, Kelley Canyon samples reflect oxic bottom waters with some samples from the Ghaub formation as well.
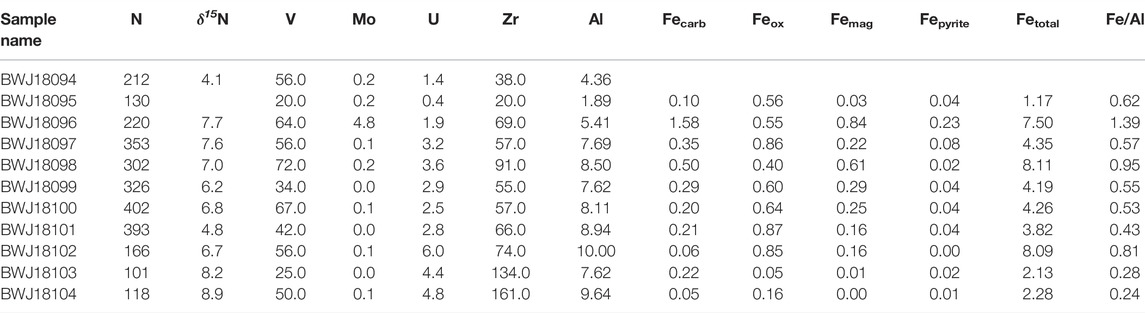
TABLE 2. Geochemical data presented in text. Nitrogen and trace element concentrations are given in ppm, while Al and Fe speciation data are in weight percent. Nitrogen isotope values are in permil (%), compared to atmospheric N2.
In all Utah samples, Mo is low, between detection limit of 0.05 ppm and 0.24 ppm, with the exception of one sample at 4.8 ppm. Vanadium ranges from 20–72 ppm, and U ranges from 0.4 to 6 ppm, with most values above 2.5 ppm (Table 2). These variations are only partially due to differential detrital input, as seen by plotting U normalized to Zr as a function of Al (Figure 3). Zirconium is geochemically similar to U, but Zr is non redox-active, and when plotted against Al (a proxy for detrital input), it is apparent that there is a weak correlation (r2 = 0.36). This indicates that some variation in trace metal abundance may be related to detrital input into the basin, but it is likely not the primary control. In contrast, we observe high U values at low Al concentration in Ghaub samples, indicating authigenic enrichment of U in this location.
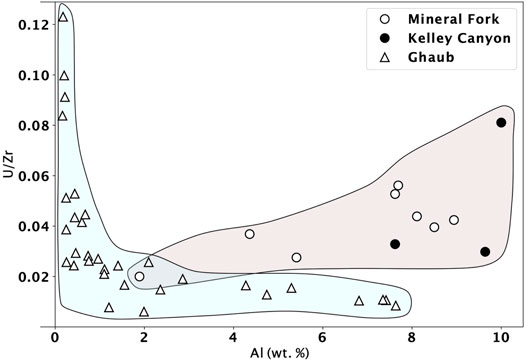
FIGURE 3. U/Zr ratio from the Mineral fork tillite (circles) and the Ghaub Formation (triangles) plotted against Al concentration. Uranium and Zr are similar geochemically, except U is redox sensitive and Zr is not. Therefore, correlation of this ratio with Al, a proxy for detrital influence, can distinguish between changing U concentrations caused by detrital input or redox evolution. We suggest that only moderate control of U concentration by detrital input is evident in samples from Utah (Mineral Fork and Kelley Canyon). In contrast, Ghaub samples show authigenic enrichment in U, with high U at low Al content. Ghaub and Utah samples show a distinct trend, highlighted by the blue and peach fields.
There is no clear correlation, however, between the trace element concentration (U and Mo), normalized to Post-Archean Average Shale (PAAS), and total organic carbon (TOC) (Figure 4). By normalizing to PAAS, we are showing whether or not each trace element is enriched compared to the average over time. Such an “enrichment factor”, when plotted as a function of TOC, is an effective redox proxy (Algeo and Liu, 2020). Specifically, this indicates that scavenging by organic carbon during burial is unlikely to be the primary control on trace element abundance. Rather, the abundance of trace elements indicate oxic weathering and delivery of soluble forms of these elements to the water column.
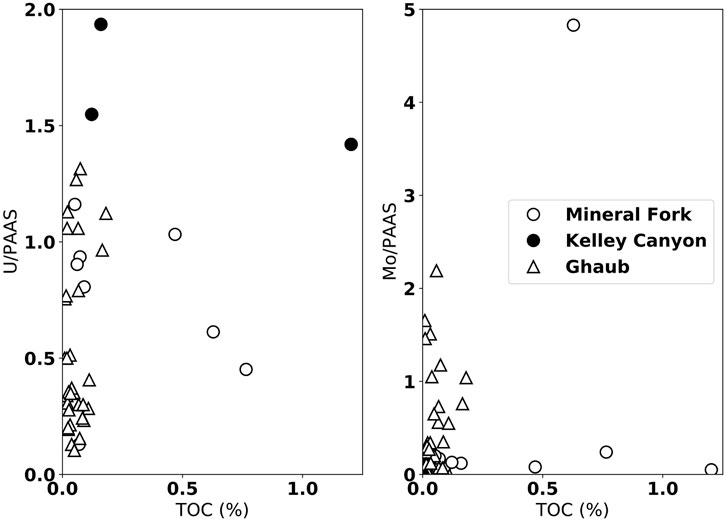
FIGURE 4. Uranium and Mo concentrations, normalized to Post-Archean Average Shale (PAAS), plotted against carbon concentration (ppm) from the Mineral fork (open circles), Kelley Canyon (closed circles), and the Ghaub Formation (triangles). There is no clear correlation between either, suggesting limited influence of organic carbon availability on trace metal concentration in sediments.
Johnson et al. (2017b) interpreted the Mo, U and V data from Namibia to reflect oxic weathering on the continents, followed by delivery to the ocean and scavenging in ferruginous bottom waters. While U supply is controlled by detrital input, by normalizing to Al (Figure 3), Johnson et al. (2017b) demonstrated that changing U concentrations were not due to changing detrital input alone, and were consistent with iron speciation data. Similarly, these redox-sensitive elements from Utah are present in similar concentrations (Figure 5). Uranium, specifically, also displays a negative correlation with FeHR/FeTotal, consistent with higher U concentrations reflecting a more pervasively oxygenated water column.
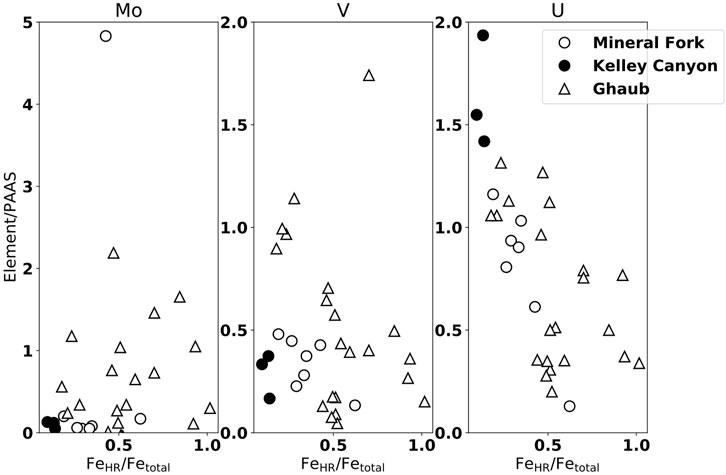
FIGURE 5. Trace element concentrations normalized to Post-Archean Average Shale (PAAS), plotted against iron speciation data from the Mineral Fork (open circles), Kelley Canyon (closed circles), and the Ghaub Formation (triangles). In general, the Ghaub Formation has higher enrichments in all redox sensitive trace elements, but values above one indicate oxic weathering of continental crust (e.g., Algeo and Tribovillard, 2009; Johnson et al., 2017b). Uranium is enriched relative to PAAS in the samples from Utah, while V and Mo are not.
There is no enrichment, however, in Mo or V observed from the Mineral Fork or Kelley Canyon formation. Recent work from the early Cambrian of South China has suggested that in settings with a well developed, dynamic redox-cline, the behavior of Mo, V, and U may be decoupled (Han et al., 2018). Specifically, the presence of a zone of Fe-Mn particulate formation can preferentially enrich sediments in V. If such a zone is absent, or sediments sampled are from shallower water, such V enrichment could be missing. It is likely that the Mineral Fork samples were deposited near the ice-grounding line (Christie-Blick, 1982), and perhaps the water column at this location did not contain a Fe-Mn particulate shuttle, leading to low V concentrations.
Overall concentrations of these elements observed from Utah and Namibia are similar to other work focused on the Cryogenian. For example, a section spanning both Sturtian and Marinoan from the Zavkhan Terrane, southwest Mongolia finds U concentrations of between 0.05 and 2 ppm, very similar to our measurements (Lau et al., 2017). Trace element measurements from the Doushantuo Formation of South China, deposited after the Marinoan glacial period, display quite high concentrations of U (up to 30 ppm), V (1,000 ppm), and Mo (200 ppm) in the immediate deglacial period, with values decreasing rapidly up-section (Sahoo et al., 2012). Since the Kelley Canyon formation overlies the cap carbonate, it would have been deposited sometime after the deglaciation, and thus likely does not capture the immediate deglaciation.
We present N concentration and isotope data in Figure 6. δ15N in both Namibia and Utah are positive, between about 1 to 50/00 from the Ghaub and 4.1 to 7.60/00 in the Mineral Fork (Figures 6, 7). Values from the Kelley Canyon Formation are higher, between 6.7 to 8.90/00. Nitrogen concentration is similar in units from Namibia and Utah, ranging from 100 to 650 ppm. As noted in Section 3.1, analysis of previously measured till samples from the Timeball Hill and Blaubeker formations produced nearly identical δ15N values but different N concentrations. Previous work has noted that within-sample heterogeneity may be an issue for N measurements (Johnson et al., 2017a). Rock hosted N can potentially exist as different species (e.g.,
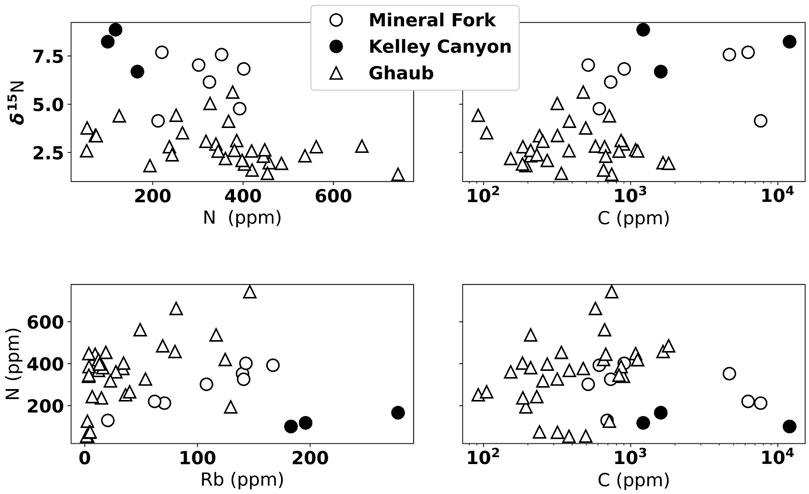
FIGURE 6. Nitrogen isotope and concentration data shown in comparison to C and Rb concentration. We note no clear correlation between δ15N and N or C, indicating no significant N loss due to metamorphism or fluid loss. Slight correlation between N and Rb concentration indicates there is some mineralogic control on the amount of N, but this is not influencing the δ15N.
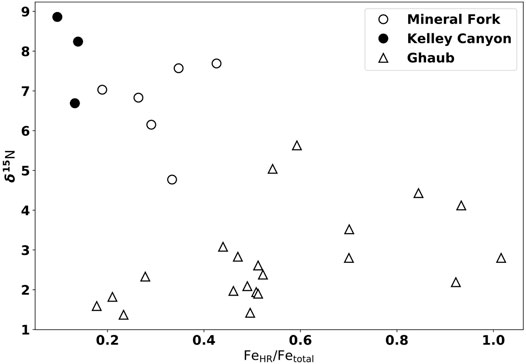
FIGURE 7. Iron speciation data from the Mineral Fork Formation (open circles), Kelley Canyon Formation (closed circles), and the Ghaub Formation triangles). Mineral Fork samples with the highest δ15N values have the lowest FeHR/Fetotal, consistent with oxygenated waters and partial denitrification. In contrast, samples from the Ghaub Formation show no clear correlation, consistent with an more anoxic water column.
To assess the potential influence of metamorphic alteration of N content and isotopic signals, we show δ15N plotted against N concentration, Rb concentration, and C concentration (Figure 6). We observe no correlation between δ15N and N concentration, suggesting that higher δ15N values are not caused by progressive N loss during metamorphism (Bebout and Fogel, 1992). There is a rough correlation between N and Rb concentration, suggesting some variation in N content could be related to detrital input. The lack of correlation, however, between δ15N and N concentration again indicates that while there might be some lithologic control on total N, this does not influence isotope values. There is not a clear correlation between C and N content, which is different than previous work on the non-glacial Neoproterozoic (e.g., Ader et al., 2014), but similar to previous analyses of syn-glacial units (Johnson et al., 2017b). This suggests that there may be either differential preservation of N and C in these units, or that the N and C cycles are differently coupled during Snowball glaciations than the non-glacial intervals of the Cryogenian.
Assuming atmospheric N2 was at 00/00 during the Cryogenian (Stüeken et al., 2016b), enriched δ15N values, given the evidence of persistent O2 availability provided by redox-sensitive element data, are consistent with the presence of partial, water-column denitrification during the Snowball glaciation. That is, there must have been sufficient O2 present to support nitrification, with denitrification occurring at boundaries between oxygenated and low-oxygen waters, with a likely chemocline location in bottom waters. The similarity of Mineral Fork δ15N values to average modern marine values (5 to 70/00) indicates that a similar relative amount of partial denitrification
After the glaciation, as preserved by the Kelley Canyon formation, samples have the highest δ15N values measured. These values are typically interpreted to indicate more extensive denitrification, and lower water-column O2, to drive residual N to higher δ15N values. Yet, Fe-speciation data indicates oxygenated bottom waters during the deposition of the Kelley Canyon Formation (Figures 2, 7). Kelley Canyon units also have the highest U concentrations of any samples presented (Figure 5), suggesting oxic weathering and delivery of U to the site of deposition. Thus, we require an interpretation that can explain both higher δ15N values and a pervasively oxygenated water column. We propose two potential explanations: oceanographic circulation shifts and biologic responses to deglaciation.
A similar pattern, positive but low and then increasing several permil, in δ15N values in sediments has been observed in a number of locations during the Pleistocene-Holocene deglaciation (Galbraith and Kienast, 2013). Several sites are near-shore environments, including one off the coast of northern Chile (De Pol-Holz et al., 2006). De Pol-Holz et al. (2006) observed an increase in sedimentary δ15N values from 8 to 120/00 across the deglaciation, and attributed this increase to melting of the Patagonian Ice Sheet. The influx of freshwater slowed formation of intermediate water, which in turn decreased deep water ventilation. This oceanographic reorganization could have resulted in upwelled N that was enriched in 15N, due to removal by denitrification, compared to the glacial maximum with a less well developed oxygen minimum zone. The Snowball deglaciation would have produced a large meltwater lid (Hoffman PF. et al., 2017), which could affect ocean circulation in a similar way: limited deep-water ventilation, increased denitrification at a chemocline underlying a well oxygenated upper water column.
In the wake of both the Sturtian and the Marinoan glaciations, the ocean appears to have become more oxygen rich and the surface temperature increased (Hoffman PF. et al., 2017; Lechte et al., 2019). There are many studies on contemporary denitrifying bacteria, both in the field and in culture, that demonstrate an increase in denitrification activity at higher temperatures (Nowicki, 1994; Veraart et al., 2011). Thus, we would expect to observe an increase in δ15N in post-Snowball warm oceans, observed in both the Ghaub and Mineral Fork-Kelley Canyon Formations. While an increase in water column oxygen may seem anathema to increased denitrification, modern denitrifiers do function in oxygenated water. Specifically, by using the Nap reductase enzyme, instead of the Nar enzyme (Berks et al., 2001), organisms can perform aerobic denitrification (Ji et al., 2015). Perhaps, then, the combined effect of high temperatures and aerobic denitrification caused an increase in δ15N values in the post-Snowball ocean, even in the presence of higher water column O2.
Alternately, it is possible that enriched δ15N values could reflect partial nitrification followed by complete denitrification. This scenario was proposed to explain very positive δ15N values from the 2.7 Ga Tumbiana Formation (Thomazo et al., 2011), though an alternate explanation has been proposed suggesting high values could be caused by alkaline conditions and degassing of NH3 (Stüeken et al., 2015). Nitrification to nitrite has a pronounced isotopic effect, with product
Additionally, we note that δ15N values are generally lower in samples with FeHR/Fetotal values that are ‘equivocal’ compared to those that clearly plot in the ferruginous field (Figure 2, 7). Since this potential trend is not strongly correlated (r2 = 0.13), any interpretations at this point are speculative. It is possible that samples with low Fetotal, and therefore higher FeHR/Fetotal, represent upwelling into oxygenated conditions, driving denitrification and increasing δ15N values. However, iron speciation data does not allow for quantitative interpretation of bottom water conditions within fields, but rather serves to distinguish between overarching redox conditions. Future work, either observational or geochemical modeling, could be valuable to investigate any controls on patterns within Fe-speciation fields.
There are two major implications from this work. First, we present further support for periods of oxygenated water during the Snowball Earth glaciations based on Fe-speciation, redox sensitive trace elements and enriched δ15N values. Second, we suggest corroborating evidence for a relatively rapid increase in oxygen content in the post-Snowball ocean set against a background of variable redox conditions (Kunzmann et al., 2017; Lau et al., 2017) while also providing hypotheses to explain positive δ15N during the Snowball ocean that increased after the glaciation.
Previous data from Namibia, combining N isotopes and redox proxies, had suggested pockets of oxygenated water with active photosynthesis and aerobic N cycling during the Marinoan (Johnson et al., 2017b). Our work herein records similar geochemical values, consistent with a similar water-column redox/nutrient state. Thus, in at least two locations - during a Snowball ocean - there is geochemical evidence for oxygenated water. What is unclear, though, is whether samples from Namibia and Utah represent contemporaneous time periods. Age control from Namibia is relatively tight (Hoffman et al., 2021), clearly indicating the Ghaub Formation is Marinoan in age.
As previously mentioned, the age of the Mineral Fork is crucial for any interpretation linking this site to broader global patterns of redox structure. If the Mineral Fork is Sturtian, it is likely that it was deposited in a rifting basin (e.g., Balgord et al., 2013). The similarity of N and redox geochemical values from Mineral Fork and the Ghaub suggest that they record broadly similar ocean conditions. We cannot say to what extent this might be a global signal during each glaciation, since at present these are the only sites with N and redox data synchronous with the Snowball ocean. Perhaps, then, marginal marine settings during the Marinoan and Sturtian glaciations were geochemically similar. While it is beyond the scope of this paper to determine global ocean redox, our work does demonstrate that combining proxies from geographically distributed samples can help fill in this picture. We suggest long-lived open water and/or ample photosynthesis to keep the atmosphere and at least parts of the upper ocean oxygenated. There may even have been periodic bottom water oxygenation during the deposition of the Mineral Fork Formation.
Comparison to other geochemical and observational work also indicates the presence of persistent oxygenated environments throughout the Snowball ocean. For example, geochemical analyses of iron formations (IFs) indicate that subglacial meltwater would have provided O2 to marginal marine settings (Lechte et al., 2019). Measurements of cyclicity in banded IFs are consistent with ice sheets responding dynamically to orbital forcing (Mitchell et al., 2021). A potential consequence of such orbital forcing is that dynamic ice could have facilitated oxygenation of the surface ocean via air-sea gas exchange upon either ice retreat or advancement (Mitchell et al., 2021).
Our work demonstrates the utility of the combined redox proxy-N isotope analytical strategy for characterizing Precambrian units. This is especially useful during times of dynamic fluctuations in oxygen, both in the atmosphere and ocean (Sperling et al., 2015; Wei et al., 2021). For example, previous work has demonstrated that different oceanic redox structures can result in similar ranges of δ15N values recorded in sediment (Ader et al., 2014). Values above approximately 00/00 could be generated in the water column, and therefore recorded in sediments, either from modern-like conditions or strongly redox stratified conditions. For the former, this is the result of complete nitrification followed by partial denitrification. For the latter, higher than zero δ15N values can be caused by a combination of ammonification and partial assimilation (Ader et al., 2014). Such a redox-cline can either be shallow or deep, and still produce similar δ15N values.
Thus, water column redox reconstructions are crucial for interpretation of N isotopes. Specifically, using Fe-speciation for bottom water redox and redox-sensitive trace elements for surface water/atmospheric redox conditions can contextualize N isotopes values. As more work utilizes N isotope measurements as a tool to investigate both biologic and redox activity (e.g., Peng et al., 2020), placing such biologically controlled signals into a redox context will be crucial.
The evolution of ocean redox and water column nutrient cycling are closely intertwined over Earth history. There are a number of redox proxies, including redox sensitive trace metal abundance and iron speciation, that can be used to investigate oxygenation of the ancient atmosphere and oceans. Stable isotope ratios of major nutrients, such as carbon and nitrogen, are often used to reconstruct ancient microbial ecosystems and metabolisms. Nitrogen isotopes are commonly measured in ancient sediments, but produce non-diagnostic signals. Indeed, there is more than one pathway or combination of fluxes in the nitrogen cycle that could produce the same bulk δ15N signal. Due to the tight relationship between the nitrogen cycle and oxygen availability, combining redox proxies with isotopic measurements provides insight and context into the redox environment crucial for interpreting isotopic signals.
We utilized a combined redox and N-isotope approach to specifically highlight the nitrogen cycle during the Neoproterozoic Snowball Earth glaciations. We analyzed deposits from Utah, USA likely preserving the Sturtian (Mineral Fork Formation) and post-Sturtian (Kelley Canyon Formation) time periods, and show previous work from the Ghaub Formation in Namibia for comparison (Johnson et al., 2017b). We find that redox proxies (U, V and Mo concentrations, and Fe speciation) are consistent with the presence of oxygenated water near the surface and potentially near the sediment water interface as well. Nitrogen isotope ratios are all above 00/00, and given redox constraints, are indicative of nitrification followed by partial denitrification in the water column. The geochemical proxies are quite similar between the two field sites, suggesting similar water conditions at different paleogeographic locations and times. That is, we present evidence for oxygenated water during Cryogenian glaciations. More broadly, our work shows that combining these two approaches yields a deeper insight into ancient ecosystems and water conditions over Earth history. We also highlight the importance of considering oceanographic and biologic interpretations of redox data, as these are important factors controlling N isotope signals in biomass and sediments through time.
The original contributions presented in the study are included in the article/Supplementary Materials, further inquiries can be directed to the corresponding author.
BJ designed the study, collected the samples, conducted N isotopic measurements, interpreted results, and prepared the manuscript. SP conducted Fe-speciation work, interpreted results, and prepared the manuscrpit. CM conducted Fe-speciation work, interpreted results, and prepared the manuscript.
BJ was supported by an NSF EAR postdoctoral fellowship (EAR-PF 1725784), as well as startup funding from Iowa State University.
The authors declare that the research was conducted in the absence of any commercial or financial relationships that could be construed as a potential conflict of interest.
All claims expressed in this article are solely those of the authors and do not necessarily represent those of their affiliated organizations, or those of the publisher, the editors and the reviewers. Any product that may be evaluated in this article, or claim that may be made by its manufacturer, is not guaranteed or endorsed by the publisher.The standard for N isotopes is atmospheric N2, which is set to 00/00 by definition.
The Supplementary Material for this article can be found online at: https://www.frontiersin.org/articles/10.3389/feart.2022.745830/full#supplementary-material
1Nitrogen isotopes are presented in delta notation (per mil, 0/00), where
The standard for N isotopes is atmospheric N2, which is set to 00/00 definition.
Ader, M., Sansjofre, P., Halverson, G. P., Busigny, V., Trindade, R. I. F., Kunzmann, M., et al. (2014). Ocean Redox Structure across the Late Neoproterozoic Oxygenation Event: a Nitrogen Isotope Perspective. Earth Planet. Sci. Lett. 396, 1–13. doi:10.1016/j.epsl.2014.03.042
Ader, M., Thomazo, C., Sansjofre, P., Busigny, V., Papineau, D., Laffont, R., et al. (2016). Interpretation of the Nitrogen Isotopic Composition of Precambrian Sedimentary Rocks: Assumptions and Perspectives. Chem. Geol. 429, 93–110. doi:10.1016/j.chemgeo.2016.02.010
Alcott, L. J., Krause, A. J., Hammarlund, E. U., Bjerrum, C. J., Scholz, F., Xiong, Y., et al. (2020). Development of Iron Speciation Reference Materials for Palaeoredox Analysis. Geostand. Geoanal Res. 44, 581–591. doi:10.1111/ggr.12342
Algeo, T. J., and Liu, J. (2020). A Re-assessment of Elemental Proxies for Paleoredox Analysis. Chem. Geol. 540, 119549. doi:10.1016/j.chemgeo.2020.119549
Algeo, T. J., and Tribovillard, N. (2009). Environmental Analysis of Paleoceanographic Systems Based on Molybdenum-Uranium Covariation. Chem. Geol. 268, 211–225. doi:10.1016/j.chemgeo.2009.09.001
Balgord, E. A., Yonkee, W. A., Link, P. K., and Fanning, C. M. (2013). Stratigraphic, Geochronologic, and Geochemical Record of the Cryogenian Perry Canyon Formation, Northern Utah: Implications for Rodinia Rifting and Snowball Earth Glaciation. Geol. Soc. Am. Bull. 125, 1442–1467. doi:10.1130/b30860.1
Bebout, G. E., and Fogel, M. L. (1992). Nitrogen-isotope Compositions of Metasedimentary Rocks in the Catalina Schist, California: Implications for Metamorphic Devolatilization History. Geochimica Cosmochimica Acta 56, 2839–2849. doi:10.1016/0016-7037(92)90363-N
Benkovitz, A., Matthews, A., Teutsch, N., Poulton, S. W., Bar-Matthews, M., and Almogi-Labin, A. (2020). Tracing Water Column Euxinia in Eastern Mediterranean Sapropels S5 and S7. Chem. Geol. 545, 119627. doi:10.1016/j.chemgeo.2020.119627
Boocock, T. J., Mikhail, S., Prytulak, J., Di Rocco, T., and Stüeken, E. E. (2020). Nitrogen Mass Fraction and Stable Isotope Ratios for Fourteen Geological Reference Materials: Evaluating the Applicability of Elemental Analyser versus Sealed Tube Combustion Methods. Geostand. Geoanal Res. 44, 537–551. doi:10.1111/ggr.12345
Bräuer, K., and Hahne, K. (2005). Methodical Aspects of the 15N-Analysis of Precambrian and Palaeozoic Sediments Rich in Organic Matter. Chem. Geol. 218, 361–368. doi:10.1016/j.chemgeo.2005.01.004
Brunner, B., Contreras, S., Lehmann, M. F., Matantseva, O., Rollog, M., Kalvelage, T., et al. (2013). Nitrogen Isotope Effects Induced by Anammox Bacteria. Proc. Natl. Acad. Sci. U.S.A. 110, 18994–18999. doi:10.1073/pnas.1310488110
Busigny, V., Lebeau, O., Ader, M., Krapež, B., and Bekker, A. (2013). Nitrogen Cycle in the Late Archean Ferruginous Ocean. Chem. Geol. 362, 115–130. doi:10.1016/j.chemgeo.2013.06.023
Canfield, D. E., Lyons, T. W., and Raiswell, R. (1996). A Model for Iron Deposition to Euxinic Black Sea Sediments. Am. J. Sci. 296, 818–834. doi:10.2475/ajs.296.7.818
Casciotti, K. L., Buchwald, C., Santoro, A. E., and Frame, C. (2011). Assessment of Nitrogen and Oxygen Isotopic Fractionation during Nitrification and its Expression in the Marine Environment. Methods Enzym. (Elsevier) 486, 253–280. doi:10.1016/b978-0-12-381294-0.00011-0
Casciotti, K. L., Sigman, D. M., and Ward, B. B. (2003). Linking Diversity and Stable Isotope Fractionation in Ammonia-Oxidizing Bacteria. Geomicrobiol. J. 20, 335–353. doi:10.1080/01490450303895
Christie-Blick, N. (1982). Upper Proterozoic and Lower Cambrian Rocks of the Sheeprock Mountains, Utah: Regional Correlation and Significance. Geol. Soc. Am. Bull. 93, 735–750. doi:10.1130/0016-7606(1982)93<735:upalcr>2.0.co;2
Clarkson, M. O., Poulton, S. W., Guilbaud, R., and Wood, R. A. (2014). Assessing the Utility of Fe/Al and Fe-Speciation to Record Water Column Redox Conditions in Carbonate-Rich Sediments. Chem. Geol. 382, 111–122. doi:10.1016/j.chemgeo.2014.05.031
Crittenden, M. D., Christie-buck, N., and Karl Link, P. (1983). Evidence for Two Pulses of Glaciation during the Late Proterozoic in Northern Utah and Southeastern Idaho. Geol. Soc. Am. Bull. 94, 437–450. doi:10.1130/0016-7606(1983)94<437:eftpog>2.0.co;2
De Pol-Holz, R., Ulloa, O., Dezileau, L., Kaiser, J., Lamy, F., and Hebbeln, D. (2006). Melting of the Patagonian Ice Sheet and Deglacial Perturbations of the Nitrogen Cycle in the Eastern South Pacific. Geophys. Res. Lett. 33, 24477. doi:10.1029/2005gl024477
Galbraith, E. D., Kienast, M., and Kienast, M. (2013). The Acceleration of Oceanic Denitrification during Deglacial Warming. Nat. Geosci. 6, 579–584. doi:10.1038/ngeo1832
Garvin, J., Buick, R., Anbar, A. D., Arnold, G. L., and Kaufman, A. J. (2009). Isotopic Evidence for an Aerobic Nitrogen Cycle in the Latest Archean. Science 323, 1045–1048. doi:10.1126/science.1165675
Gaschnig, R. M., Rudnick, R. L., McDonough, W. F., Kaufman, A. J., Valley, J. W., Hu, Z., et al. (2016). Compositional Evolution of the Upper Continental Crust through Time, as Constrained by Ancient Glacial Diamictites. Geochimica Cosmochimica Acta 186, 316–343. doi:10.1016/j.gca.2016.03.020
Han, T., Fan, H., and Wen, H. (2018). Dwindling Vanadium in Seawater during the Early Cambrian, South China. Chem. Geol. 492, 20–29. doi:10.1016/j.chemgeo.2018.05.022
Hoffman, P. F., Abbot, D. S., Ashkenazy, Y., Benn, D. I., Brocks, J. J., Cohen, P. A., et al. (2017a). Snowball Earth Climate Dynamics and Cryogenian Geology-Geobiology. Sci. Adv. 3, e1600983. doi:10.1126/sciadv.1600983
Hoffman, P. F. (2016). Cryoconite Pans on Snowball Earth: Supraglacial Oases for Cryogenian Eukaryotes? Geobiology 14, 531–542. doi:10.1111/gbi.12191
Hoffman, P. F., Halverson, G. P., Schrag, D. P., Higgins, J. A., Domack, E. W., Macdonald, F. A., et al. (2021). Snowballs in Africa: Sectioning a Long-Lived Neoproterozoic Carbonate Platform and its Bathyal Foreslope (NW Namibia). Earth Sci. Rev. 2021, 103616. doi:10.1016/j.earscirev.2021.103616
Hoffman, P. F., Lamothe, K. G., LoBianco, S. J. C., Hodgskiss, M. S. W., Bellefroid, E. J., Johnson, B. W., et al. (2017b). Sedimentary Depocenters on Snowball Earth: Case Studies from the Sturtian Chuos Formation in Northern Namibia. Geosphere 13, 811–837. doi:10.1130/ges01457.1
Hoffman, P. F. (2011). Strange Bedfellows: Glacial Diamictite and Cap Carbonate from the Marinoan (635 Ma) Glaciation in Namibia. Sedimentology 58, 57–119. doi:10.1111/j.1365-3091.2010.01206.x
Ji, B., Yang, K., Zhu, L., Jiang, Y., Wang, H., Zhou, J., et al. (2015). Aerobic Denitrification: a Review of Important Advances of the Last 30 Years. Biotechnol. Bioproc E 20, 643–651. doi:10.1007/s12257-015-0009-0
Johnson, B. W., Drage, N., Spence, J., Hanson, N., El-Sabaawi, R., and Goldblatt, C. (2017a). Measurement of Geologic Nitrogen Using Mass Spectrometry, Colorimetry, and a Newly Adapted Fluorometry Technique. Solid earth. 8, 307–318. doi:10.5194/se-8-307-2017
Johnson, B. W., Poulton, S. W., and Goldblatt, C. (2017b). Marine Oxygen Production and Open Water Supported an Active Nitrogen Cycle during the Marinoan Snowball Earth. Nat. Commun. 8, 1316. doi:10.1038/s41467-017-01453-z
Kennedy, K., and Eyles, N. (2021). Syn‐rift Mass Flow Generated 'tectonofacies' and 'tectonosequences' of the Kingston Peak Formation, Death Valley, California, and Their Bearing on Supposed Neoproterozoic Panglacial Climates. Sedimentology 68, 352–381. doi:10.1111/sed.12781
Kopf, S., Davidheiser-Kroll, B., and Kocken, I. (2021). Isoreader: An R Package to Read Stable Isotope Data Files for Reproducible Research. Joss 6, 2878. doi:10.21105/joss.02878
Kunzmann, M., Gibson, T. M., Halverson, G. P., Hodgskiss, M. S. W., Bui, T. H., Carozza, D. A., et al. (2017). Iron Isotope Biogeochemistry of Neoproterozoic Marine Shales. Geochimica Cosmochimica Acta 209, 85–105. doi:10.1016/j.gca.2017.04.003
Kunzmann, M., Halverson, G. P., Scott, C., Minarik, W. G., and Wing, B. A. (2015). Geochemistry of Neoproterozoic Black Shales from Svalbard: Implications for Oceanic Redox Conditions Spanning Cryogenian Glaciations. Chem. Geol. 417, 383–393. doi:10.1016/j.chemgeo.2015.10.022
Lau, K. V., Macdonald, F. A., Maher, K., and Payne, J. L. (2017). Uranium Isotope Evidence for Temporary Ocean Oxygenation in the Aftermath of the Sturtian Snowball Earth. Earth Planet. Sci. Lett. 458, 282–292. doi:10.1016/j.epsl.2016.10.043
Lechte, M. A., Wallace, M. W., Hood, A. v. S., Li, W., Jiang, G., Halverson, G. P., et al. (2019). Subglacial Meltwater Supported Aerobic Marine Habitats during Snowball Earth. Proc. Natl. Acad. Sci. U.S.A. 116, 25478–25483. doi:10.1073/pnas.1909165116
Li, Y., Wiedenbeck, M., Shcheka, S., and Keppler, H. (2013). Nitrogen Solubility in Upper Mantle Minerals. Earth Planet. Sci. Lett. 377-378, 311–323. doi:10.1016/j.epsl.2013.07.013
Link, P. K., and Christie-Blick, N. (2011). Chapter 38 Neoproterozoic Strata of Southeastern Idaho and Utah: Record of Cryogenian Rifting and Glaciation. Geol. Soc. Lond. Memoirs 36, 425–436. doi:10.1144/m36.38
Merdith, A. S., Collins, A. S., Williams, S. E., Pisarevsky, S., Foden, J. D., Archibald, D. B., et al. (2017). A Full-Plate Global Reconstruction of the Neoproterozoic. Gondwana Res. 50, 84–134. doi:10.1016/j.gr.2017.04.001
Mettam, C., Zerkle, A. L., Claire, M. W., Izon, G., Junium, C. J., and Twitchett, R. J. (2017). High-frequency Fluctuations in Redox Conditions during the Latest Permian Mass Extinction. Palaeogeogr. Palaeoclimatol. Palaeoecol. 485, 210–223. doi:10.1016/j.palaeo.2017.06.014
Mitchell, R. N., Gernon, T. M., Cox, G. M., Nordsvan, A. R., Kirscher, U., Xuan, C., et al. (2021). Orbital Forcing of Ice Sheets during Snowball Earth. Nat. Commun. 12, 4187–4189. doi:10.1038/s41467-021-24439-4
Morales, L. V., Granger, J., Chang, B. X., Prokopenko, M. G., Plessen, B., Gradinger, R., et al. (2014). Elevated 15N/14N in Particulate Organic Matter, Zooplankton, and Diatom Frustule-Bound Nitrogen in the Ice-Covered Water Column of the Bering Sea Eastern Shelf. Deep Sea Res. Part II Top. Stud. Oceanogr. 109, 100–111. doi:10.1016/j.dsr2.2014.05.008
Nowicki, B. L. (1994). The Effect of Temperature, Oxygen, Salinity, and Nutrient Enrichment on Estuarine Denitrification Rates Measured with a Modified Nitrogen Gas Flux Technique. Estuar. Coast. Shelf Sci. 38, 137–156. doi:10.1006/ecss.1994.1009
Ojakangas, R. W., and Matsch, C. L. (1980). Upper Precambrian (Eocambrian) Mineral Fork Tillite of Utah: a Continental Glacial and Glaciomarine Sequence. Geol. Soc. Am. Bull. 91, 495–501. doi:10.1130/0016-7606(1980)91<495:upemft>2.0.co;2
Peng, Y., Dong, L., Ma, H., Wang, R., Lang, X., Peng, Y., et al. (2020). Surface Ocean Nitrate-Limitation in the Aftermath of Marinoan Snowball Earth: Evidence from the Ediacaran Doushantuo Formation in the Western Margin of the Yangtze Block, South China. Precambrian Res. 347, 105846. doi:10.1016/j.precamres.2020.105846
Poulton, S. W., and Canfield, D. E. (2005). Development of a Sequential Extraction Procedure for Iron: Implications for Iron Partitioning in Continentally Derived Particulates. Chem. Geol. 214, 209–221. doi:10.1016/j.chemgeo.2004.09.003
Poulton, S. W., and Canfield, D. E. (2011). Ferruginous Conditions: A Dominant Feature of the Ocean through Earth's History. Elements 7, 107–112. doi:10.2113/gselements.7.2.107
Poulton, S. W., Fralick, P. W., and Canfield, D. E. (2010). Spatial Variability in Oceanic Redox Structure 1.8 Billion Years Ago. Nat. Geosci. 3, 486–490. doi:10.1038/ngeo889
Poulton, S. W., Fralick, P. W., and Canfield, D. E. (2004). The Transition to a Sulphidic Ocean ∼ 1.84 Billion Years Ago. Nature 431, 173–177. doi:10.1038/nature02912
Quan, T. M., van de Schootbrugge, B., Field, M. P., Rosenthal, Y., and Falkowski, P. G. (2008). Nitrogen Isotope and Trace Metal Analyses from the Mingolsheim Core (Germany): Evidence for Redox Variations across the Triassic-Jurassic Boundary. Glob. Biogeochem. Cycles 22, a–n. doi:10.1029/2007GB002981
Quan, T. M., Wright, J. D., and Falkowski, P. G. (2013). Co-variation of Nitrogen Isotopes and Redox States through Glacial-Interglacial Cycles in the Black Sea. Geochimica Cosmochimica Acta 112, 305–320. doi:10.1016/j.gca.2013.02.029
Raiswell, R., and Canfield, D. E. (1998). Sources of Iron for Pyrite Formation in Marine Sediments. Am. J. Sci. 298, 219–245. doi:10.2475/ajs.298.3.219
Richardson, D. J., Berks, B. C., Russell, D. A., Spiro, S., and Taylor, C. J. (2001). Functional, Biochemical and Genetic Diversity of Prokaryotic Nitrate Reductases. Cell. Mol. Life Sci. 58, 165–178. doi:10.1007/PL00000845
Sahoo, S. K., Planavsky, N. J., Kendall, B., Wang, X., Shi, X., Scott, C., et al. (2012). Ocean Oxygenation in the Wake of the Marinoan Glaciation. Nature 489, 546–549. doi:10.1038/nature11445
Sigman, D. M., DiFiore, P. J., Hain, M. P., Deutsch, C., Wang, Y., Karl, D. M., et al. (2009). The Dual Isotopes of Deep Nitrate as a Constraint on the Cycle and Budget of Oceanic Fixed Nitrogen. Deep Sea Res. Part I Oceanogr. Res. Pap. 56, 1419–1439. doi:10.1016/j.dsr.2009.04.007
Sperling, E. A., Wolock, C. J., Morgan, A. S., Gill, B. C., Kunzmann, M., Halverson, G. P., et al. (2015). Statistical Analysis of Iron Geochemical Data Suggests Limited Late Proterozoic Oxygenation. Nature 523, 451–454. doi:10.1038/nature14589
Stüeken, E. E., Buick, R., Guy, B. M., and Koehler, M. C. (2015). Isotopic Evidence for Biological Nitrogen Fixation by Molybdenum-Nitrogenase from 3.2 Gyr. Nature 520, 666–669. doi:10.1038/nature14180
Stüeken, E. E., Buick, R., and Lyons, T. W. (2019a). Revisiting the Depositional Environment of the Neoproterozoic Callanna Group, South Australia. Precambrian Res. 334, 105474. doi:10.1016/j.precamres.2019.105474
Stüeken, E. E., Kipp, M. A., Koehler, M. C., and Buick, R. (2016b). The Evolution of Earth's Biogeochemical Nitrogen Cycle. Earth-Science Rev. 160, 220–239. doi:10.1016/j.earscirev.2016.07.007
Stüeken, E. E., Kipp, M. A., Koehler, M. C., Schwieterman, E. W., Johnson, B., and Buick, R. (2016a). Modeling pN2 through Geological Time: Implications for Planetary Climates and Atmospheric Biosignatures. Astrobiology 16, 949–963. doi:10.1089/ast.2016.1537
Stüeken, E. E., Martinez, A., Love, G., Olsen, P. E., Bates, S., and Lyons, T. W. (2019b). Effects of pH on Redox Proxies in a Jurassic Rift Lake: Implications for Interpreting Environmental Records in Deep Time. Geochimica Cosmochimica Acta 252, 240–267. doi:10.1016/j.gca.2019.03.014
Tesdal, J.-E., Galbraith, E. D., and Kienast, M. (2013). Nitrogen Isotopes in Bulk Marine Sediment: Linking Seafloor Observations with Subseafloor Records. Biogeosciences 10, 101–118. doi:10.5194/bg-10-101-2013
Thomazo, C., Ader, M., and Philippot, P. (2011). Extreme 15N-Enrichments in 2.72-Gyr-Old Sediments: Evidence for a Turning Point in the Nitrogen Cycle. Geobiology 9, 107–120. doi:10.1111/j.1472-4669.2011.00271.x
Tribovillard, N., Algeo, T. J., Lyons, T., and Riboulleau, A. (2006). Trace Metals as Paleoredox and Paleoproductivity Proxies: an Update. Chem. Geol. 232, 12–32. doi:10.1016/j.chemgeo.2006.02.012
Veraart, A. J., De Klein, J. J. M., and Scheffer, M. (2011). Warming Can Boost Denitrification Disproportionately Due to Altered Oxygen Dynamics. PLoS One 6, e18508. doi:10.1371/journal.pone.0018508
Wang, W., Guan, C., Zhou, C., Peng, Y., Pratt, L. M., Chen, X., et al. (2017). Integrated Carbon, Sulfur, and Nitrogen Isotope Chemostratigraphy of the Ediacaran Lantian Formation in South China: Spatial Gradient, Ocean Redox Oscillation, and Fossil Distribution. Geobiology 15, 552–571. doi:10.1111/gbi.12226
Wei, G.-Y., Planavsky, N. J., He, T., Zhang, F., Stockey, R. G., Cole, D. B., et al. (2021). Global Marine Redox Evolution from the Late Neoproterozoic to the Early Paleozoic Constrained by the Integration of Mo and U Isotope Records. Earth-Science Rev. 214, 103506. doi:10.1016/j.earscirev.2021.103506
Yonkee, W. A., Dehler, C. D., Link, P. K., Balgord, E. A., Keeley, J. A., Hayes, D. S., et al. (2014). Tectono-stratigraphic Framework of Neoproterozoic to Cambrian Strata, West-Central U.S.: Protracted Rifting, Glaciation, and Evolution of the North American Cordilleran Margin. Earth-Science Rev. 136, 59–95. doi:10.1016/j.earscirev.2014.05.004
Young, G. M. (2002). Geochemical Investigation of a Neoproterozoic Glacial Unit: the Mineral Fork Formation in the Wasatch Range, Utah. Geol. Soc. Am. Bull. 114, 387–399. doi:10.1130/0016-7606(2002)114<0387:gioang>2.0.co;2
Zerkle, A. L., and Mikhail, S. (2017). The Geobiological Nitrogen Cycle: From Microbes to the Mantle. Geobiology 15, 343–352. doi:10.1111/gbi.12228
Zerkle, A. L., Poulton, S. W., Newton, R. J., Mettam, C., Claire, M. W., Bekker, A., et al. (2017). Onset of the Aerobic Nitrogen Cycle during the Great Oxidation Event. Nature 542, 465–467. doi:10.1038/nature20826
Keywords: nitrogen, isotope, Neoproterozoic, redox, Snowball Earth
Citation: Johnson BW, Mettam C and Poulton SW (2022) Combining Nitrogen Isotopes and Redox Proxies Strengthens Paleoenvironmental Interpretations: Examples From Neoproterozoic Snowball Earth Sediments. Front. Earth Sci. 10:745830. doi: 10.3389/feart.2022.745830
Received: 22 July 2021; Accepted: 29 April 2022;
Published: 13 June 2022.
Edited by:
Pierre Sansjofre, Muséum National d'Histoire Naturelle, FranceReviewed by:
Julien Danzelle, Sorbonne Universités, FranceCopyright © 2022 Johnson, Mettam and Poulton. This is an open-access article distributed under the terms of the Creative Commons Attribution License (CC BY). The use, distribution or reproduction in other forums is permitted, provided the original author(s) and the copyright owner(s) are credited and that the original publication in this journal is cited, in accordance with accepted academic practice. No use, distribution or reproduction is permitted which does not comply with these terms.
*Correspondence: Benjamin W. Johnson, YndqQGlhc3RhdGUuZWR1
Disclaimer: All claims expressed in this article are solely those of the authors and do not necessarily represent those of their affiliated organizations, or those of the publisher, the editors and the reviewers. Any product that may be evaluated in this article or claim that may be made by its manufacturer is not guaranteed or endorsed by the publisher.
Research integrity at Frontiers
Learn more about the work of our research integrity team to safeguard the quality of each article we publish.