 Clément Bertin
 Atsushi Matsuoka
 Antoine Mangin
 Marcel Babin
 Vincent Le Fouest
- 1LIttoral ENvironnement et Sociétés (LIENSs)—UMR 7266, La Rochelle, France
- 2Takuvik Joint International Laboratory, CNRS, Québec, QC, Canada
- 3Institute for the Study of Earth, Oceans, and Space, University of New Hampshire, Durham, NH, United States
- 4ACRI-ST, Sophia Antipolis, France
In response to global warming, the Arctic is undergoing rapid and unprecedented changes that alter the land-to-sea forcing in large Arctic rivers. Improving our knowledge of terrestrial dissolved organic carbon (tDOC) flux to the coastal Arctic Ocean (AO) is thus critical and timely as these changes strongly alter the biogeochemical cycles on AO shelves. In this study, we merged riverine in situ tDOC concentrations with satellite ocean-color estimates retrieved at the land-marine interface of the Mackenzie Delta to make a first assessment of the tDOC export from its main outlets to the shelf. We combined tDOC and river discharge data to develop a regression model that simulated tDOC concentrations and fluxes from daily to interannual (2003–2017) time scales. We then compared the simulated satellite-derived estimates to those simulated by the model constrained by in situ tDOC data only. As the satellite tDOC estimates reflect the delta effect in terms of tDOC enrichment and removal, our results inform us of how much tDOC can potentially leave the delta to reach the ocean (1.44 ± 0.14 TgC.yr−1). The chemodynamic relationships and the model suggest contrasting patterns between Shallow Bay and the two easternmost delta outlets, which can be explained by the variability in their geomorphological settings. At the seasonal scale and for all outlets, the satellite-derived tDOC export departs from the estimate based on in situ tDOC data only. During the river freshet in May, the satellite-derived tDOC export is, on average, ∼15% (Shallow Bay) to ∼20% (Beluga Bay) lower than the in situ-derived estimate. This difference was the highest (−60%) in 2005 and exceeds 30% over most of the last decade, and can be explained by qualitative and quantitative differences between the tDOCin situ and tDOCsat datasets in a period when the freshet is highly variable. In contrast, in summer and fall, the satellite-derived tDOC export is higher than the in situ-derived estimate. The temporal difference between the satellite and in situ-derived export estimates suggests that predicting seasonal tDOC concentrations and fluxes from remote Arctic deltas to the coastal AO remains a challenge for assessing their impact on already changing carbon fluxes.
1 Introduction
In response to climate change, the Arctic is undergoing unprecedented changes in both its watersheds and coastal ocean. Since the 1970s in the Arctic, the surface air temperature has increased by 2.7°C (Box et al., 2019) resulting into an increase of the sea surface temperature in summer (Timmermans and Labe, 2021). These changes alter the land-to-sea forcing with important regional and basin-wide implications for sea ice formation, ocean stratification and heat flux, underwater light regime, nutrients delivery, and marine ecosystems (Searcy et al., 1996; Mulligan et al., 2010; Brown et al., 2020; Juhls et al., 2020). Arctic rivers’ discharge and permafrost are key components of this coupling. Northern permafrost contains 1,460–1,600 Gt of organic carbon in the form of frozen organic matter, nearly twice as much as carbon than is currently in the atmosphere (Tarnocai et al., 2009; Schuur et al., 2015). Most of this carbon is stored in the Arctic, where permafrost covers 65% of Russian (Tumel, 2002) and 50% of Canadian lands (Vincent et al., 2017). This carbon pool represents about half the world’s soil carbon (Hugelius et al., 2014).
Riverine freshwater inputs to the Arctic Ocean (AO) are the largest of any ocean per basin volume (Opsahl et al., 1999). The Arctic hydrological cycle has intensified resulting in a steady increase in the liquid flow of pan-Arctic rivers over the past 30 years (Box et al., 2019). Because of rapid permafrost thaw, the export flux of terrigenous dissolved organic carbon (tDOC) to the coastal AO tends to increase (Fritz et al., 2017) and reaches rates of change as high as 39% in the Mackenzie River system during the 1978–2012 period (Tank et al., 2016). In addition, the land-to-sea flux of terrestrial organic carbon mobilized through coastline erosion has nearly doubled between 1955 and 2018 (Bristol et al., 2021). Once in the coastal AO, a fraction of this riverine and eroded tDOC pool can be degraded and further mineralized into inorganic carbon (Lønborg, 2020, and reference therein) that in turn likely unbalances the delicate air-sea gas exchanges on shelves (Manizza et al., 2013; Spencer et al., 2016; Tanski et al., 2016; Tanski et al., 2021).
In this context, there is a growing need to quantify land-to-sea fluxes of tDOC and to investigate the coastal ecosystem response at the seasonal scale, where the physical-biogeochemical interactions play a role on AO shelves. Such an effort has been considerably reinforced since the 2000s with the PARTNERS/ArcticGRO (AGRO) pan-Arctic monitoring program (Holmes et al., 2020; Shiklomanov et al., 2020), which provides high-quality in situ measurements of tDOC concentrations. Watershed models also improved considerably to become high-value predictive tools (McGuire et al., 2016) but still require improvements in their ability to resolve the complex mechanistic processes behind tDOC mobilization and transformation within Arctic watersheds (Kicklighter et al., 2013; Liao et al., 2019). Field observations thus remain essential to further understand the coastal ecosystem responses.
The remoteness of Arctic rivers imposes that in situ-based tDOC fluxes are estimated up to hundreds of kilometers upstream from their main outlets and based on only a few measurements per year (∼4 on average; Holmes et al., 2020). This strongly hampers a robust assessment of the estimated tDOC export from the land-marine transition to the coastal AO waters and, most importantly, precludes any effect of the delta on concentrations (enrichment/removal) (see Kipp et al., 2020). Using radiometric satellite data, Griffin et al. (2018) more than doubled the number of available data during the open water season and highlighted the strong variability of tDOC estimates that can be observed within Arctic rivers systems. Juhls et al. (2020) highlighted the synoptic (
In the present study, we investigate the value of merging in situ tDOC concentrations with radiometric satellite tDOC estimates retrieved within nearshore waters at the three main outlets of the Mackenzie Delta in the assessment of the seasonal to interannual flux of tDOC to the shelf. The paper is organized as follows. First, we provide an overview of the Mackenzie watershed and delta. Second, we describe the approach used to simulate tDOC concentrations and fluxes within the Mackenzie Shelf. Then, we compare the simulated tDOC concentrations and fluxes with and without the inclusion of satellite tDOC concentration estimates. Finally, we discuss the potential of coastal satellite tDOC data in assessing the seasonal to interannual flux of tDOC to the AO with perspectives for future developments.
2 Materials and Methods
We estimated daily tDOC concentrations (tDOCest) and fluxes from the Mackenzie River to the shelf (Figure 1) using the USGS load estimator (LOADEST) model (Runkel et al., 2004). This modeling approach was successfully applied in Arctic rivers to simulate tDOC fluxes from sparse in situ data (Holmes et al., 2012; Tank et al., 2016; Shrestha et al., 2019). The tDOC data nomenclature further used in the paper and the data treatment and procedure to simulate the daily tDOC fluxes and concentrations are given in Figure 2.
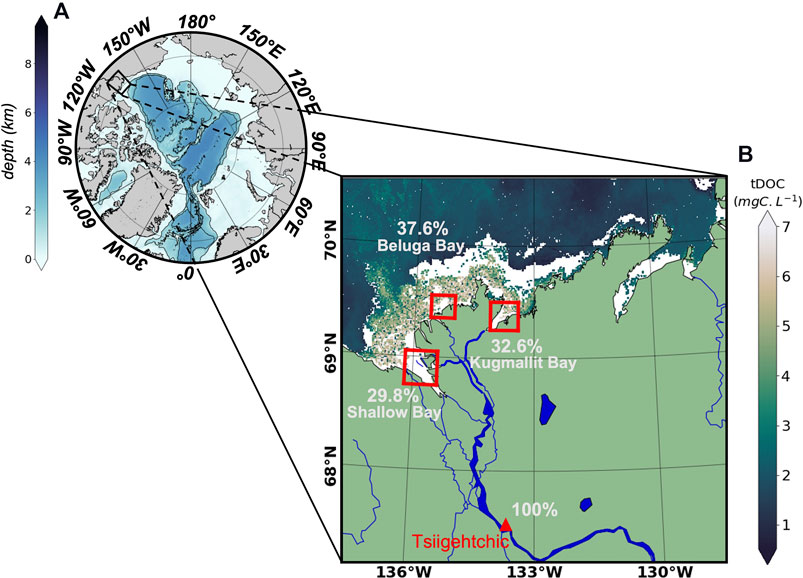
FIGURE 1. Polar stereographic map of (A) the Arctic Ocean bathymetry with the northeastern Beaufort Sea delimited in black and (B) the Mackenzie Delta area with the in situ (ArcticGRO/PARTNERS, red triangle) and satellite (red squares) sampling locations overlaid. For each outlet of the Mackenzie Delta, the weights applied to the total river discharge measured at the Tsiigehtchic station are given. An AMODIS satellite scene of tDOC concentration (28 August 2007) is overlaid.
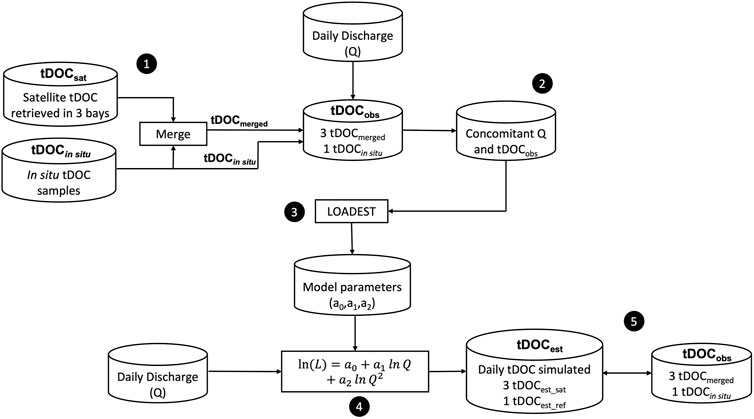
FIGURE 2. Schematic representation of the procedure used to generate the simulated tDOC flux and concentrations with the LOADEST model. Numbers 1–5 refer to the main steps fully detailed in the Materials and Methods section.
2.1 Study Area
The Mackenzie Delta is located in the westernmost Canadian Arctic in the southeastern Beaufort Sea (Figure 1). It is the second largest delta in the AO (Burn and Kokelj, 2009), whose waters spread into the most riverine of all pan-Arctic shelves with respect to its size and residence time (Macdonald et al., 1988). The Mackenzie River drains a 1.68 million km2 wide area and brings, on average, 306 km3 of fresh water into the AO each year (Mulligan and Perrie, 2019). Permafrost underlies 82% of this massive watershed (Holmes et al., 2013) and the soil organic carbon content of Mackenzie deltaic alluvium is estimated to 34–41 PgC (Tarnocai et al., 2009; Hugelius et al., 2014). Riverine freshwater reaches the coastal ocean through a complex river network made of channels of different sizes of which the main ones end up into three major outlets: Shallow Bay, Beluga Bay and Kugmallit Bay (Morley, 2012). The three coastal bays are shallow but differ by their geology upstream and their ocean geomorphological settings downstream on the shelf. On the West, a flat topography and numerous lakes and channels surround Shallow Bay (Nill et al., 2019). The bay is supplied by three main river channels and its plateau rapidly ends up as a deep canyon. By contrast, Beluga Bay extends far into the coastal ocean. The low-lying grounds of this northernmost part of the delta are mainly inundated tundra composed of sedge and lakes grading into marshes (Harper, 1990; Burn and Kokelj, 2009). The easternmost part of the delta, Kugmallit Bay, which is characterized by rolling hills and termorkarst lakes is highly subject to environmental changes (Nill et al., 2019). The Mackenzie River outflow into the ocean is modulated by the presence of a persistent ice barrier (stamukha; Carmack et al., 2004) close to the shelf, whose break-up results into pulses of freshwater discharge (Doxaran et al., 2015; Matsuoka et al., 2016).
2.2 The in situ and Satellite-Derived Data: tDOC Concentration and River Discharge
We used in situ tDOC (tDOCin situ) concentrations and freshwater discharge data (2003–2017) from the water quality dataset provided by the Arctic Great River Observatory (ArcticGRO; Holmes et al., 2020; Shiklomanov et al., 2020). Data encompassed the PARTNERS (2003–2007), ArcticGRO I (2009–2012), II (2012–2016) and III (2017–2020) campaigns. Data were sampled at the Tsiigehtchic station (67.45°N, 133.74°W) about 200 km upstream of the Mackenzie Delta (Figure 1). River discharge was measured daily over the whole period (2003–2017), whereas the sampling frequency of tDOC concentrations was year-dependent (0–7 measurements per year).
Satellite-derived tDOC (tDOCsat) concentration estimates were determined for the same time period as in situ data (2003–2017) from radiometric spectral reflectance data retrieved with a 1 km horizontal resolution at nadir by the Moderate-Resolution Imaging Spectro-radiometer (MODIS) aboard the Aqua satellite (AMODIS). 1,051 scenes constituted the satellite dataset for the entire period (2003–2017). Colored dissolved organic matter (CDOM) absorbance at 443 nm
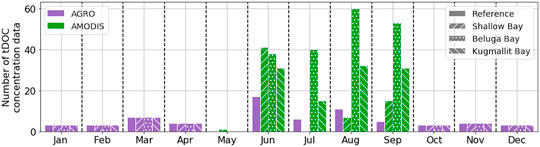
FIGURE 3. Monthly distribution of available in situ (AGRO) and satellite (AMODIS) tDOC concentrations over the 2003–2017 period. The solid patterns refer to the “Reference” dataset, whereas the dotted and hatched patterns refer to the “Satellite” datasets.
2.3 Merging the in situ/Satellite tDOC Data
We generated one in situ/satellite merged dataset for Shallow Bay, Beluga Bay and Kugmallit Bay. Between May and September (open water season), we substituted the tDOCin situ concentrations by the tDOCsat concentrations available. We then merged the satellite data with the tDOCin situ concentrations available between October and april to generate a merged tDOC (tDOCmerged) dataset for each outlet (step 1, Figure 2). For each satellite scene, we subsampled tDOCsat concentrations within a 600 km2, 306 and 441 km2 surface area for Shallow Bay, Beluga Bay and Kugmallit Bay, respectively (Figure 1). We calculated the median of all valid pixels only when 50% had non-missing tDOCsat values to limit biases due to sea ice or cloud cover. To compute the tDOCsat flux, we weighted the freshwater discharge at the three delta outlets based on the channels contributions reported by Morley (2012). We estimated the percentage of the total river discharge measured at the Tsiigehtchic station that was delivered to Shallow Bay, Beluga Bay and Kugmallit Bay to 29.8, 37.6 and 32.6%, respectively (Morley, 2012; Blackburn et al., 2015) (Figure 1). To account for the water transport between the Tsiigehtchic station located 250 km upstream on the river path and the delta outlets, we applied a +1 day offset on the river discharge data. We estimated this value by multiplying the daily river discharge with the mean distance between the Tsiigehtchic station and the delta outlets (250 km), the mean width of the Mackenzie River at Tsiigehtchic (1 km) and the water level measured by the Water Survey of Canada at Tsiigehtchic station. We obtained four tDOCobs datasets: three based on tDOCmerged data for each delta outlet (hereafter “Satellite”) and 1 based on tDOCin situ data only (hereafter “Reference”).
2.4 The LOADEST Modeling Approach
2.4.1 The Model Selection
We constrained the LOADEST model with time coincident observations of tDOC concentration (tDOCobs) and freshwater discharge (Q) data to build up a logarithmic relationship between the tDOC load (equivalent to daily flux) and river discharge based on the following general Equation 1:
where L is tDOC load (kg.day−1), Q the river discharge (m3.s−1), dtime the decimal time (YYYYMMDD) and
where X was either
Based on the Akaike Information Criterion (AIC) (Akaike, 1974), the LOADEST approach allowed to select the best fitting model through nine different combination of the terms included in Equation (1) (Supplementary Table S1).
We chose the model by calculating a first estimate of both ln(L) and tDOCest concentrations based on time coincident ArcticGRO tDOCin situ and discharge data through the automated regression model selection set in LOADEST (model 0). According to the AIC, LOADEST selected two different models as best fitting models (models 2 and 7, Supplementary Table S1). By referring to the Schwarz Posterior Probability Criterion (SPPC) also computed as an AIC comparative parameter, model 2 (Eq. (3)) was identified as the most accurate:
Furthermore, model 2 precluded any spurious numerical trend induced by the dtime explanatory variable present in model 7. We thus assumed model 2 (Eq. (3)) as the best regression model to assess daily tDOC fluxes and concentrations entering the Mackenzie shelf.
2.4.2 Simulated Daily tDOC Concentration and Flux
We applied model 2 to all tDOCobs datasets to highlight the effect of satellite data on the tDOC flux assessment. For each tDOCobs dataset, we first extracted river discharge data concomitant with available tDOCobs data from the entire daily river discharge dataset (step 2, Figure 2). In LOADEST, these data were then used to constrain model 2 to retrieve the regression coefficients (a0, a1 and a2) of the model (step 3, Figure 2). Finally, we ran model 2 using the regression coefficients thus obtained and forced it with the entire daily river discharge data to simulate the tDOC flux at the daily scale (step 4, Figure 2). From the simulated flux, we calculated back the tDOCest concentrations at daily scale by dividing the daily flux by the river discharge. We thus obtained a “Reference” estimate of tDOC concentration (tDOCest_ref) from model 2 ran with the regression coefficients derived from the tDOCin situ/Q relationship (see step 3, Figure 2). Similarly, we obtained three “Satellite” estimates of tDOC concentration (tDOCest_sat) derived from each outlet-specific tDOCmerged/Q relationship (step 3, Figure 2) for Shallow Bay, Beluga Bay and Kugmallit Bay. We give the constants obtained for each regression model in Supplementary Table S2.
2.5 Comparison of Simulated Versus Observed tDOC Concentrations
We used four comparison metrics to compare the tDOC concentrations simulated by model 2 (tDOCest) based on the in situ data (hereafter tDOCest_ref) and merged in situ/satellite data (hereafter tDOCest_sat) with the time coincident observed (tDOCobs) (step 5, Figure 2). We calculated the correlation coefficient (r), the Nash-Sutcliffe model efficiency index (NSE), the unbiased Root Mean Square Error (URMSE), and the Median Percent Error (MPE) as follows:
The NSE (unitless) relates the residual variance (i.e. the “noise”) between the tDOCest and tDOCobs values to the variance within the tDOCobs values (i.e. the “information”) (see Nash and Sutcliffe, 1970). A NSE value of 1 indicates that the noise is null. A NSE value near 0 means the noise is comparable to the observed variance suggesting that the simulated values are as accurate as the observed mean. A negative NSE value suggests that the mean value of observations is a better predictor than the model. The URMSE measures the size of the discrepancies between the simulated and observed values. The MPE is the median of the absolute percentage error and provides insights on the regression model accuracy.
We also calculated the relative error between the “Reference” and “Satellite” daily tDOC flux estimates as follows:
where
3 Results
3.1 Chemodynamic Q-tDOCobs Relationships
The relationships between the tDOCobs concentrations and associated freshwater river discharge suggested the presence of two distinct clusters, which distinguished by the river discharge intensity and the source of available tDOC data (Figure 4). A first cluster corresponded to the sea-ice covered season (October to april) characterized by a low river discharge and tDOCin situ concentrations only. A second cluster reflected open water (May to September) conditions with a higher river discharge and mostly tDOCsat concentrations. We used the Spearman correlation coefficient (r) to assess the strength of the relationships between the coincident river discharge Q and the tDOCobs concentrations (i.e. tDOCin situ or tDOCmerged) in the full dataset (January to December) and the same dataset but restricted to the open water season (May to September) (Table 1). The tDOCobs concentrations did not follow a Normal distribution (Shapiro test, p < 0.05), except for tDOCin situ during the open water season (Shapiro test, p > 0.05) for which a Pearson correlation coefficient was used. In all datasets, r was positive when accounting for the full (0.48 < r < 0.79) and open water (0.39 < r < 0.79) data. Compared to Q-tDOCin situ relationships, the strength of the correlation in the merged datasets varied amongst the delta outlets. The merging of satellite-derived and in situ tDOC concentrations increased the Q-tDOCobs correlation in Shallow Bay in both datasets (r = 0.79) compared to Q-tDOCin situ (0.59 < r < 0.68). In Kugmallit Bay, r was similar in the full dataset (r = 0.58 versus r = 0.59) but decreased in the open water season (r = 0.43 versus r = 0.68). In Beluga Bay, r decreased in both the full (r = 0.48 versus r = 0.59) and open water (r = 0.43 versus r = 0.68) datasets. This suggests that the strength of the Q-tDOCmerged relationship was sensitive to the tDOCsat concentration retrieved nearby each outlet of the delta, with Beluga Bay differing markedly from the other two bays.
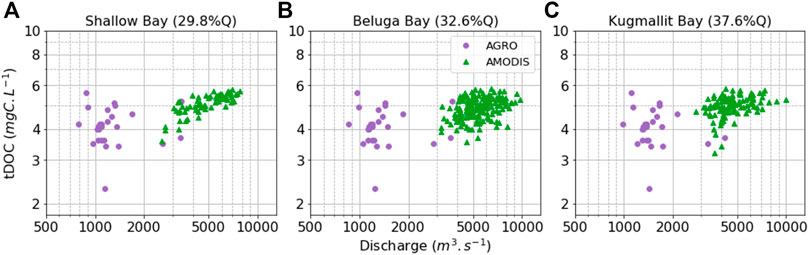
FIGURE 4. Q-tDOC relationships for the merged in situ-satellite dataset (tDOCmerged) on (A) Shallow Bay, (B) Beluga Bay and (C) Kugmallit Bay. Green triangles indicate the satellite tDOC concentration estimates (AMODIS). Purple dots indicate the in situ tDOC measurements (AGRO). Note the logarithmic scales on both axes.
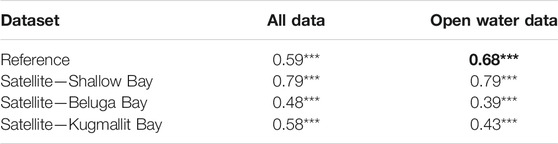
TABLE 1. Correlation coefficients between the river discharge and the tDOCin situ (“Reference” dataset) or tDOCmerged (“Satellite” datasets) concentrations for all data and the open water season data (May-September). Bold values indicate a Person correlation coefficient; the Spearman correlation coefficient is used otherwise (*** p-value < 0.001).
3.2 Simulated tDOC Concentrations: Merged vs. in situ Datasets
We used quantitative metrics to compare the simulated tDOCest_ref and tDOCest_sat concentrations with the observed tDOCin situ and tDOCmerged concentrations, respectively (Table 2). The number of tDOCobs data increased with the inclusion of the remotely sensed tDOCsat estimates. In Shallow Bay, the increase reached 38% while it was 2-fold and 3-fold in Kugmallit and Beluga Bay, respectively. The data dispersion (URMSE) between tDOCin situ and tDOCest_ref concentrations was 0.82 mgC L−1. When using tDOCest_sat estimates, URMSE decreased by 39–45%. The median percent error (MPE) between the tDOCin situ and the tDOCest_ref concentrations was 12.7%. The MPE decreased by 2-fold (Kugmallit and Beluga bays) to 3-fold (Shallow Bay) with the tDOCest_sat estimates. The correlation coefficient (r) varied little among the Reference and Satellite datasets and was relatively high (0.52–0.76), which suggested a high goodness-of-fit. With respect to the “Reference” estimates (r = 0.66), r increased in Shallow Bay but decreased in Beluga Bay. The Nash-Sutcliffe model efficiency index (NSE) showed a pattern similar to that depicted by r. The NSE between the tDOCin situ and tDOCest_ref concentrations was 0.44 suggesting that the regression model was a fairly good predictor of the observed concentrations. Using tDOCest_sat, the NSE remained positive increasing in Shallow Bay (NSE = 0.58) but decreasing in Beluga Bay (NSE = 0.27). Overall, tDOCest_sat estimates simulated in Beluga Bay departed the most from the observed tDOCmerged concentrations (Table 2). These results mirrored with the lowest Q-tDOCmerged correlation coefficients estimated in Beluga Bay (Table 1).
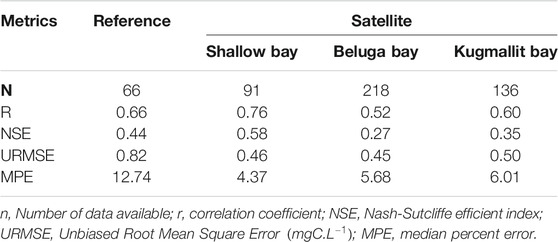
TABLE 2. Comparison metrics between the simulated tDOCest_ref and tDOCin situ concentrations (“Reference”) and between the simulated tDOCest_sat and the tDOCmerged concentrations (“Satellite”).
3.3 Sensitivity Analysis on the Remotely-Sensed Data Subsampling
We tested the hypothesis that the predictive ability of the regression model applied to Beluga Bay was sensitive to the AMODIS data subsampling conditions. We then calculated the median of tDOCsat concentration estimates for each of the three new conditions: 40% of valid pixels (C40), 60% of valid pixels (C60), and a 2-fold subsampling surface area along with 50% of valid pixels (2C50). From these conditions, we simulated three new tDOCest_sat concentration estimates based on the three new tDOCmerged datasets obtained according to the same method described in Section 2. For each subsampling condition, we used the metrics to compare with the subsampling condition of 50% of valid pixel (C50) we previously applied (Table 3). Between the C50 and C60 conditions, the data quantity dropped by 45%. The correlation coefficient, the NSE and the URMSE were similar, whereas the MPE was slightly improved. Between the C50 and C40 conditions, the data quantity increased by 39% and all metrics showed limited variations. Overall, the amplitude of change of the comparison metrics between C40, C50 and C60 (Table 3) was much lower than between the “Reference” and “Satellite” estimates (Table 2, 3). By contrast, a doubling of the sampled surface area (2C50, +18% of tDOCsat data) led to a decrease of r and the NSE compared to C40, C50, C60 and “Reference” estimate. However, no marked changes in the URMSE and MPE were observed. Increasing the number of tDOCsat data by widening the subsampled area decreased the strength of the correlation and increased the noise between the simulated tDOCest_sat and the observed tDOCmerged concentrations. Overall, the simulated tDOCest_sat concentrations obtained in 2C50 departed the most from the simulated tDOCest_ref estimates (Table 2, 3).
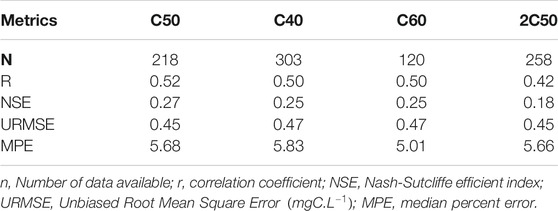
TABLE 3. Comparison metrics between the simulated tDOCest_sat and the tDOCmerged concentrations (“Satellite”). in Beluga Bay according to the C50 (50% valid pixels), C40 (40% valid pixels), C60 (60% valid pixels) and 2C50 (2-fold larger surface area +50% valid pixels) subsampling conditions.
3.4 Annual and Seasonal Patterns of the Simulated tDOC Flux
Over 2003–2017, we simulated the yearly flux of tDOC based on the simulated tDOCest_ref and the tDOCest_sat concentrations obtained for the three delta outlets. We estimated the total “Satellite” flux by summing the flux simulated at each outlet. The total yearly flux was
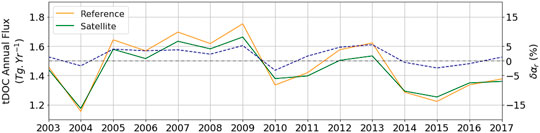
FIGURE 5. Simulated annual tDOC flux (TgC.yr−1) estimated from the “Reference” dataset (orange line) and the “Satellite” dataset (green line). The dashed blue line represents the error of the “Satellite” estimate relative to the “Reference” estimate (
Although we reported no substantial differences between the simulated “Reference” and “Satellite” tDOCest flux estimates at the annual scale, both departed at the seasonal scale (Figure 6). During the seasonal peak of river discharge in May, the “Satellite” flux estimate was lower than the “Reference” flux estimate by 15% (Shallow Bay) to 20% (Beluga Bay) on average. Such a difference in the tDOC flux estimates coincides with unevenly distributed tDOC concentrations amongst the datasets in June (Figure 7). By contrast, between mid-July and November the “Satellite” flux estimate was on average higher than the “Reference” flux estimate. In November, the mean difference reached 12 and 17% in Shallow Bay and Kugmallit Bay, respectively. At the interannual scale, the relative error on the total simulated tDOC flux reported at the spring river freshet exhibited a high variability (Figure 8). From 2011 to 2017, the “Satellite” flux estimate was generally more than 30% lower than the “Reference” flux estimate. The highest interannual difference was reached in 2005, when the “Satellite” flux estimate was ∼60% lower than the “Reference” flux estimate.
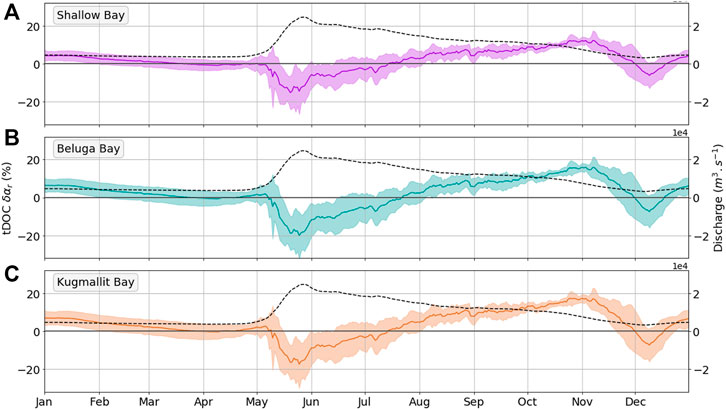
FIGURE 6. Error of the simulated daily tDOC flux estimated from the “Satellite” dataset relative to the “Reference” estimate (
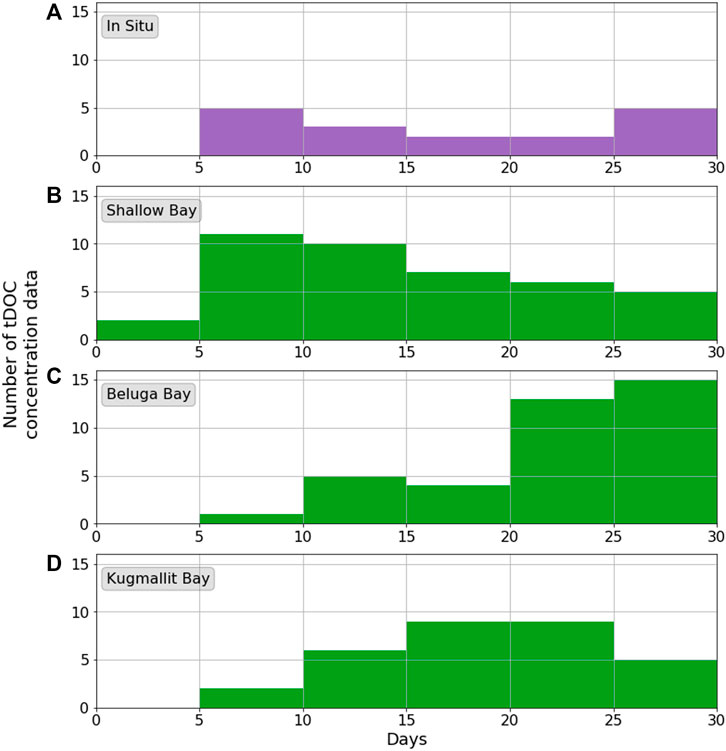
FIGURE 7. Temporal distribution in June (2003–2017) of the (A) tDOCin situ concentrations, and (B) tDOCsat concentrations for Shallow Bay, (C) Beluga Bay and (D) Kugmallit Bay.
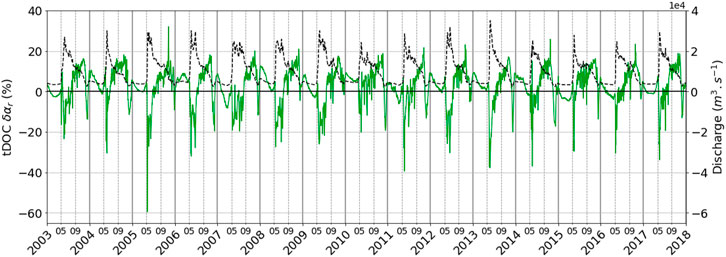
FIGURE 8. Error of the simulated daily tDOC flux estimated from the “Satellite” dataset relative to the “Reference” estimate (
4 Discussion
4.1 A Complex Land-To-Sea Interface
The presence of a chemodynamic Q-tDOC relationship, i.e. the higher the river discharge the higher the tDOC concentration, reported upstream in the Mackenzie River path is widely accepted (Raymond et al., 2007; Holmes et al., 2012; Shrestha et al., 2019). In the Peel River catchment, Shrestha et al. (2019) suggested a significant Q-tDOC correlation (r = 0.52), which is in the range of the values we report in this study (0.48 < r < 0.79). This result suggests that the positive Q-tDOC chemodynamic relationship estimated more than 200 km upstream from the delta also applies to the fluvial-marine interface farther downstream. Our results show that the chemodynamic Q-tDOCmerged relationship varies amongst the three delta outlets and is the weakest in Beluga Bay (r = 0.48). Such a decrease in the Q-tDOCmerged relationship for Beluga Bay suggests a less conservative behavior of the tDOC concentrations. After the spring freshet, the river water is stored in deltaic lakes and floods the vegetated floodplain (Normandin et al., 2018), which can modify its chemistry before draining to the delta channels and ultimately to the Mackenzie Shelf (Emmerton et al., 2008a). Processes like autotrophic production and leaching can enhance tDOC levels in river water over a wide range of variability (15–350%) as tDOC is transported through the delta (Emmerton et al., 2008a; Kipp et al., 2020). In the upper part of the delta, tDOC removal through the flocculation process (up to 45%; Kipp et al., 2020) can occur at low salinities in the more estuarine waters and can outbalance the delta enrichment effect. All these processes likely play a role in explaining the distinct Q-tDOCmerged relationship we observe for Beluga Bay. In this part of the delta, the alluvial plain is low-lying (<2 m) and intersected by an important network of lakes and channels. In spring, the delta is flooded with freshwater during the freshet (Mackay, 1974). In summer and fall, it is very exposed to the ocean influence and occasionally flooded when strong North-Northwestern winds trigger storm surges and marine intrusions into the delta (Mackay, 1974; Marsh and Schmidt, 1993; Manson and Solomon, 2007). Storm surges can be severe and flood the delta with saline waters over tens of kilometers inland from the coast leading to substantial changes in vegetation (Pisaric et al., 2011; Kokelj et al., 2012; Lantz et al., 2015). High surface area flooding in Beluga Bay compared to the east and west of the upper delta area (Kuenzer et al., 2015) may lead to differences in the mobilization and biogeochemistry of tDOC at the fluvial-marine transition. As satellite tDOC estimates retrieved at the fluvial-marine transition reflect the delta effect in terms of tDOC enrichment and removal, our results inform on how much tDOC can potentially leave the delta to reach the coastal ocean.
The weaker Q-tDOCmerged relationship reported in Beluga Bay (r = 0.48), and to a lesser extent in Kugmallit Bay (r = 0.58), likely explains the difference in the model performance between the three delta outlets. Overall, the use of tDOCsat data in the model improves the match between the simulated (tDOCest_sat) and observed (tDOCobs) concentrations. This is particularly true for Shallow Bay for which the Q-tDOCmerged relationship is the strongest (r = 0.79) even compared to the Q-tDOCin situ relationship (r = 0.59). There is growing evidence that tDOC concentrations and quality vary in the course of the main channels of the Mackenzie Delta (Emmerton et al., 2008b; Griffin et al., 2018; Kipp et al., 2020; Schwab et al., 2020). The use of satellite tDOC retrieved in nearshore waters in the very close vicinity of the delta outlets allows for the effect of regional biogeochemical signatures to be considered in the estimated land-to-sea fluxes of tDOC. The satellite tDOC concentrations are most likely due to bio- and photo-degradation processes (Gonçalves-Araujo et al., 2015; Matsuoka et al., 2015) that occur upstream along the river path and that watersheds model are not yet able to represent (Rawlins et al., 2021). Our approach implicitly accounts for these processes without explicitly describing them as their weight on the downstream fate of tDOC is not yet well understood. Nevertheless, caution should be addressed to local non-deltaic sources of tDOC to the ocean. Offshore the delta, strong winds erode the shoreline permafrost of the Beluga Bay Islands, which may deliver extra carbon to the coastal waters (Lim et al., 2020). These inputs, however, may be limited compared to those originating from the delta (Tanski et al., 2016). Assuming a shoreline of 2,077 km for our study area (Harper, 1990) and a tDOC flux of 1.37 kgC.m−1.yr−1 (Bristol et al., 2021), coastal erosion would translate into a tDOC flux of ∼3.10–6 TgC.yr−1 into the shelf. This flux is several order of magnitude lower than the riverine flux estimated between 1.04–1.76 TgC.yr−1 (Macdonald et al., 1988; Dittmar and Kattner, 2003; Raymond et al., 2007; Holmes et al., 2012; Le Fouest et al., 2013).
4.2 The Seasonal Shift of tDOC Flux
The mean annual flux of tDOC we estimated using satellite-derived tDOC data (
The temporal shift in the seasonal distribution of the land-to-sea flux of tDOC induced by the use of satellite tDOC data, i.e. a decrease in May-June and an increase in July-November, may have implications on both the physical and biogeochemical settings of the coastal Beaufort Sea. In the Mackenzie Delta, tDOC has a high potential for biological degradation at the spring freshet (Gareis and Lesack, 2020; Behnke et al., 2021). A decrease of the riverine flux in May-June would imply that a lesser fraction of bioavailable tDOC would be delivered and potentially processed by heterotrophic bacteria within the marine ecosystem (Colatriano et al., 2018; Vaqué et al., 2019). In turn, as most of the tDOC is colored (∼94%; Matsuoka et al., 2017) and then absorbs light, phytoplankton might leverage more favorable light conditions in this period because less tDOC would be delivered by the Mackenzie Delta to the coastal waters. Whether such a decrease of the tDOC flux at the spring freshet will have a substantial impact on the heterotrophic-autotrophic balance remains to be determined. In contrast, tDOC is rather refractory in summer, because the biological removal is enhanced and the enrichment limited along the river path (Holmes et al., 2008). A steady increase of the tDOC flux between July and November as we report in our study could then translate into a greater proportion of tDOC that escapes remineralization and accumulates in the oceanic waters. Because the interannual variability of this seasonal shift is high, such biogeochemical responses might be exacerbated in the future. This is particularly true in a context of Arctic warming, which is expected to alter both the river discharge seasonality and the quality of the tDOC exported (see Behnke et al., 2021).
4.3 Future Developments
Using satellite tDOC data, we increased the size of the dataset available during the ice-free period by more than 39%, which is comparable to the study of Griffin et al. (2018) focused on inland waters within the Mackenzie River. The chemodynamic relationships and metrics we estimated for Beluga Bay suggest that the median of the satellite-derived tDOC concentration was sensitive to the subsampling procedure of the remote sensing scenes. The sensitivity analysis suggests that the model is not highly sensitive to the number of valid pixels in satellite scenes but rather to the size of the subsampled surface area. As a larger subsampled area may reflect more contrasted environmental conditions, it may alter the value of the tDOC concentration median. Compared to the other two delta outlets, the differences between the simulated and observed tDOC concentrations reported for Beluga Bay could then indicate a different tDOC dynamics within the land-to-sea interface. For all bays, the robustness of the model to the number of data within a subsampled area allows for some flexibility in the methodology, because it may offset potential issues related to cloud and/or sea ice cover. In addition, we will leverage newer space sensors such as Sentinel-2/MSI or Landsat-8/OLI to improve the spatial and temporal resolution (i.e. high-resolution ocean color data are available every 3–5 days when all available sensors are used) of radiometric records in nearshore Arctic environments. If the pixel contamination due to sea ice could be overcome, such remotely sensed data would provide tDOC concentrations estimates at the immediate vicinity of the streams’ mouth, hence limiting the effect of tDOC degradation/enrichment occurring upstream on the delta estimate. With respect to river discharge, we used daily time-series measured ∼100 km upstream the delta to constrain the regression model within the upper part of the delta at the land-ocean transition. The forthcoming Surface Water and Ocean Topography (SWOT) space mission that aims to measure river water surface elevation, top width, and free-surface slope might allow periodic estimation of freshwater discharge for Arctic rivers wider than 50 m (Biancamaria et al., 2016; Durand et al., 2016). As tDOC concentrations are also related to the watershed slope (Connolly et al., 2020), these new promising data combined with satellite tDOC retrievals in nearshore waters might help refine the land-to-sea flux of tDOC in the upper Mackenzie Delta.
Since the past 17 years, the ArcticGRO/PARTNERS program led to a large and very highly valuable dataset of water quality for the Mackenzie River. The sampling frequency is on a monthly basis spanning from January to December with a mean sampling frequency of about 4 days each year. In the Arctic, the retrieval of tDOC from space is limited to the open water season (mostly from June to September). In situ measurements of freshwater discharge and tDOC concentrations at the sea ice break-up and spring freshet are hence essential to constrain a regression model as we used in our study and to generate a realistic seasonal cycle of tDOC concentration and flux. In a context of Arctic warming, it is important to maintain and eventually extend such a water quality monitoring to gain robustness in model predictions. Besides, new datasets such as for the Mackenzie river temperature (Tokuda et al., 2019) could further be used to improve the regression models and then to better predict the seasonal to interannual tDOC dynamics (see Shrestha et al., 2019) in response to climate change.
5 Conclusion
This study investigated the value of merging riverine in situ tDOC concentrations with satellite ocean-color estimates retrieved at the three main outlets of the second largest Arctic Delta to assess the seasonal to interannual flux of tDOC to the coastal AO. By using satellite observations, we show that we can substantially increase the quantity of data available during the open water season to constrain predictive regression models. We also identified a spatial variability in the tDOC concentrations and flux amongst the three main delta outlets likely reflecting distinct biogeochemical patterns within the land-to-sea interface. The robustness of the approach suggests it could be applied to other Arctic deltas/estuaries to assess the pan-Arctic flux of tDOC if reliable remotely sensed tDOC data are available in such complex land-to-sea interfaces (see Juhls et al., 2019). However, our results also highlight that such predictive models would require more in situ and satellite-derived tDOC data especially in fall-winter and at the sea ice breakup to improve their ability to resolve the strong seasonal variability that prevails in such critical and remote environments. There is evidence now that the Arctic permafrost thaw alters both quantitatively and qualitatively the coastal waters biogeochemistry. It then motivates the need to quantify the land-to-sea fluxes of terrestrial organic matter at high spatial and temporal resolution to further investigate the coastal ecosystem response at the synoptic and seasonal time scales at which operates the physical-biogeochemical coupling in the ocean. In addition, the fraction of terrestrial organic matter outgassed into CO2 through marine physicochemical and microbial processes remains very uncertain although it might unbalance the delicate air-sea gas exchanges. Assessing in a robust way the terrestrial fluxes of organic matter to the coastal ocean is thus paramount to better understand and predict how changes in the land-sea linkages might alter the coastal carbon budget and air-sea CO2 fluxes at regional scale in the AO.
Data Availability Statement
The raw data supporting the conclusions of this article will be made available by the authors, without undue reservation.
Author Contributions
AtM and MB created and shared the original satellite dataset. CB organized the database and performed simulations and data processing. CB, AtM, AnM and VF analysed simulations and data processing results. CB wrote the first draft of the manuscript. All authors contributed to manuscript revision, read, and approved the submitted version.
Funding
CB was supported by a PhD fellowship from the French Ministry of Higher Education, Research and Innovation. This work is part of the Nunataryuk project. The project has received funding under the European Union’s Horizon 2020 Research and Innovation Programme under grant agreement no. 773421. This work was also funded by the Centre National de la Recherche Scientifique (CNRS, LEFE program). Part of this research was supported by Japan Aerospace Exploration Agency (JAXA) Global Change Observation Mission-Climate (GCOM-C) to AM (contract #19RT000542). This work was supported by the NASA Earth Science Division’s Interdisciplinary Science (IDS) program through an award to the Jet Propulsion Laboratory, California Institute of Technology, under contract with National Aeronautics and Space Administration (80NM0018D0004).
Conflict of Interest
The authors declare that the research was conducted in the absence of any commercial or financial relationships that could be construed as a potential conflict of interest.
Publisher’s Note
All claims expressed in this article are solely those of the authors and do not necessarily represent those of their affiliated organizations, or those of the publisher, the editors and the reviewers. Any product that may be evaluated in this article, or claim that may be made by its manufacturer, is not guaranteed or endorsed by the publisher.
Supplementary Material
The Supplementary Material for this article can be found online at: https://www.frontiersin.org/articles/10.3389/feart.2022.694062/full#supplementary-material
References
Akaike, H. (1974). A New Look at the Statistical Model Identification. IEEE Trans. Automat. Contr. 19, 716–723. doi:10.1109/TAC.1974.1100705
Behnke, M. I., McClelland, J. W., Tank, S. E., Kellerman, A. M., Holmes, R. M., Haghipour, N., et al. (2021). Pan‐Arctic Riverine Dissolved Organic Matter: Synchronous Molecular Stability, Shifting Sources and Subsidies. Glob. Biogeochem Cycles 35, e2020GB006871. doi:10.1029/2020GB006871
Biancamaria, S., Lettenmaier, D. P., and Pavelsky, T. M. (2016). The SWOT Mission and its Capabilities for Land Hydrology. Surv. Geophys. 37, 307–337. doi:10.1007/s10712-015-9346-y
Blackburn, J., She, Y., Hicks, F., and Nafziger, J. (2015). “Ice Effects on Flow Distributions in the Mackenzie Delta,” in 18 th Workshop on the Hydraulics of Ice Covered River, Québec City, Canada, 15.
Box, J. E., Colgan, W. T., Christensen, T. R., Schmidt, N. M., Lund, M., Parmentier, F.-J. W., et al. (2019). Key Indicators of Arctic Climate Change: 1971-2017. Environ. Res. Lett. 14, 045010. doi:10.1088/1748-9326/aafc1b
Bristol, E. M., Connolly, C. T., Lorenson, T. D., Richmond, B. M., Ilgen, A. G., Choens, R. C., et al. (2021). Geochemistry of Coastal Permafrost and Erosion-Driven Organic Matter Fluxes to the Beaufort Sea Near Drew Point, Alaska. Front. Earth Sci. 8, 598933. doi:10.3389/feart.2020.598933
Brown, K. A., Holding, J. M., and Carmack, E. C. (2020). Understanding Regional and Seasonal Variability Is Key to Gaining a Pan-Arctic Perspective on Arctic Ocean Freshening. Front. Mar. Sci. 7, 606. doi:10.3389/fmars.2020.00606
Burn, C. R., and Kokelj, S. V. (2009). The Environment and Permafrost of the Mackenzie Delta Area. Permafrost Periglac. Process. 20, 83–105. doi:10.1002/ppp.655
Carmack, E., Macdonald, R., and Jasper, S. (2004). Phytoplankton Productivity on the Canadian Shelf of the Beaufort Sea. Mar. Ecol. Prog. Ser. 277, 37–50. doi:10.3354/meps277037
Colatriano, D., Tran, P. Q., Guéguen, C., Williams, W. J., Lovejoy, C., and Walsh, D. A. (2018). Genomic Evidence for the Degradation of Terrestrial Organic Matter by Pelagic Arctic Ocean Chloroflexi Bacteria. Commun. Biol. 1, 90. doi:10.1038/s42003-018-0086-7
Connolly, C. T., Cardenas, M. B., Burkart, G. A., Spencer, R. G. M., and McClelland, J. W. (2020). Groundwater as a Major Source of Dissolved Organic Matter to Arctic Coastal Waters. Nat. Commun. 11, 1479. doi:10.1038/s41467-020-15250-8
Dittmar, T., and Kattner, G. (2003). The Biogeochemistry of the River and Shelf Ecosystem of the Arctic Ocean: a Review. Mar. Chem. 83, 103–120. doi:10.1016/S0304-4203(03)00105-1
Doxaran, D., Devred, E., and Babin, M. (2015). A 50 % Increase in the Mass of Terrestrial Particles Delivered by the Mackenzie River into the Beaufort Sea (Canadian Arctic Ocean) over the Last 10 Years. Biogeosciences 12, 3551–3565. doi:10.5194/bg-12-3551-2015
Durand, M., Gleason, C. J., Garambois, P. A., Bjerklie, D., Smith, L. C., Roux, H., et al. (2016). An Intercomparison of Remote Sensing River Discharge Estimation Algorithms from Measurements of River Height, Width, and Slope. Water Resour. Res. 52, 4527–4549. doi:10.1002/2015WR018434
Emmerton, C. A., Lesack, L. F. W., and Vincent, W. F. (2008a). Mackenzie River Nutrient Delivery to the Arctic Ocean and Effects of the Mackenzie Delta during Open Water Conditions. Glob. Biogeochem. Cycles 22. doi:10.1029/2006gb002856
Emmerton, C. A., Lesack, L. F. W., and Vincent, W. F. (2008b). Nutrient and Organic Matter Patterns across the Mackenzie River, Estuary and Shelf during the Seasonal Recession of Sea-Ice. J. Mar. Syst. 74, 741–755. doi:10.1016/j.jmarsys.2007.10.001
Fritz, M., Vonk, J. E., and Lantuit, H. (2017). Collapsing Arctic Coastlines. Nat. Clim Change 7, 6–7. doi:10.1038/nclimate3188
Gareis, J. A. L., and Lesack, L. F. W. (2020). Ice-out and Freshet Fluxes of CO2 and CH4 across the Air-Water Interface of the Channel Network of a Great Arctic delta, the Mackenzie. Polar Res. 39. doi:10.33265/polar.v39.3528
Gonçalves-Araujo, R., Stedmon, C. A., Heim, B., Dubinenkov, I., Kraberg, A., Moiseev, D., et al. (2015). From Fresh to Marine Waters: Characterization and Fate of Dissolved Organic Matter in the Lena River Delta Region, Siberia. Front. Mar. Sci. 2, 108. doi:10.3389/fmars.2015.00108
Griffin, C. G., McClelland, J. W., Frey, K. E., Fiske, G., and Holmes, R. M. (2018). Quantifying CDOM and DOC in Major Arctic Rivers during Ice-free Conditions Using Landsat TM and ETM+ Data. Remote Sensing Environ. 209, 395–409. doi:10.1016/j.rse.2018.02.060
Harper, J. R. (1990). Morphology of the Canadian Beaufort Sea Coast. Mar. Geology. 91, 75–91. doi:10.1016/0025-3227(90)90134-6
Holmes, R. M., Coe, M. T., Fiske, G. J., Gurtovaya, T. Y., McClelland, J. W., Shiklomanov, A. I., et al. (2013). Climate Change Impacts on the Hydrology and Biogeochemistry of Arctic Rivers. Glob. Impacts Clim. Change Inland Waters 51, 3–20.
Holmes, R. M., McClelland, J. W., Peterson, B. J., Tank, S. E., Bulygina, E., Eglinton, T. I., et al. (2012). Seasonal and Annual Fluxes of Nutrients and Organic Matter from Large Rivers to the Arctic Ocean and Surrounding Seas. Estuaries and Coasts 35, 369–382. doi:10.1007/s12237-011-9386-6
Holmes, R. M., McClelland, J. W., Raymond, P. A., Frazer, B. B., Peterson, B. J., and Stieglitz, M. (2008). Lability of DOC Transported by Alaskan Rivers to the Arctic Ocean. Geophys. Res. Lett. 35, L03402. doi:10.1029/2007GL032837
Holmes, R. M., McClelland, J. W., Tank, S. E., Spencer, R. G. M., and Shiklomanov, A. I. (2020). Water Quality Dataset, Version YYYYMMDD. Arctic Great Rivers Observatory. Available at: https://www.arcticgreatrivers.org/data.
Hugelius, G., Strauss, J., Zubrzycki, S., Harden, J. W., Schuur, E. a. G., Ping, C.-L., et al. (2014). Estimated Stocks of Circumpolar Permafrost Carbon with Quantified Uncertainty Ranges and Identified Data Gaps. Biogeosciences 11, 6573–6593. doi:10.5194/bg-11-6573-2014
Juhls, B., Overduin, P. P., Hölemann, J., Hieronymi, M., Matsuoka, A., Heim, B., et al. (2019). Dissolved Organic Matter at the Fluvial-marine Transition in the Laptev Sea Using In Situ Data and Ocean Colour Remote Sensing. Biogeosciences 16, 2693–2713. doi:10.5194/bg-16-2693-2019
Juhls, B., Stedmon, C. A., Morgenstern, A., Meyer, H., Hölemann, J., Heim, B., et al. (2020). Identifying Drivers of Seasonality in Lena River Biogeochemistry and Dissolved Organic Matter Fluxes. Front. Environ. Sci. 8, 53. doi:10.3389/fenvs.2020.00053
Kicklighter, D. W., Hayes, D. J., McClelland, J. W., Peterson, B. J., McGuire, A. D., and Melillo, J. M. (2013). Insights and Issues with Simulating Terrestrial DOC Loading of Arctic River Networks. Ecol. Appl. 23, 1817–1836. doi:10.1890/11-1050.1
Kipp, L. E., Henderson, P. B., Wang, Z. A., and Charette, M. A. (2020). Deltaic and Estuarine Controls on Mackenzie River Solute Fluxes to the Arctic Ocean. Estuaries and Coasts 43, 1992–2014. doi:10.1007/s12237-020-00739-8
Kokelj, S. V., Lantz, T. C., Solomon, S., Pisaric, M. F. J., Keith, D., Morse, P., et al. (2012). Using Multiple Sources of Knowledge to Investigate Northern Environmental Change: Regional Ecological Impacts of a Storm Surge in the Outer Mackenzie Delta, N.W.T. ARCTIC 65, 257–272. doi:10.14430/arctic4214
Kuenzer, C., Klein, I., Ullmann, T., Georgiou, E., Baumhauer, R., and Dech, S. (2015). Remote Sensing of River Delta Inundation: Exploiting the Potential of Coarse Spatial Resolution, Temporally-Dense MODIS Time Series. Remote Sensing 7, 8516–8542. doi:10.3390/rs70708516
Lantz, T. C., Kokelj, S. V., and Fraser, R. H. (2015). Ecological Recovery in an Arctic delta Following Widespread saline Incursion. Ecol. Appl. 25, 172–185. doi:10.1890/14-0239.1
Le Fouest, V., Babin, M., and Tremblay, J.-É. (2013). The Fate of Riverine Nutrients on Arctic Shelves. Biogeosciences 10, 3661–3677. doi:10.5194/bg-10-3661-2013
Liao, C., Zhuang, Q., Leung, L. R., and Guo, L. (2019). Quantifying Dissolved Organic Carbon Dynamics Using a Three‐Dimensional Terrestrial Ecosystem Model at High Spatial‐Temporal Resolutions. J. Adv. Model. Earth Syst. 11, 4489–4512. doi:10.1029/2019MS001792
Lim, M., Whalen, D., J. Mann, P. P., Fraser, P., Berry, H. B., Irish, C., et al. (2020). Effective Monitoring of Permafrost Coast Erosion: Wide-Scale Storm Impacts on Outer Islands in the Mackenzie Delta Area. Front. Earth Sci. 8, 454. doi:10.3389/feart.2020.561322
Lønborg, C., Carreira, C., Jickells, T., and Álvarez-Salgado, X. A. (2020). Impacts of Global Change on Ocean Dissolved Organic Carbon (DOC) Cycling. Front. Mar. Sci. 7, 24. doi:10.3389/fmars.2020.00466
Macdonald, R. W., Iseki, K., O’Brien, M. C., McLaughlin, F. A., McCullough, D., Macdonald, D. M., et al. (1988). NOGAP B-6. Volume 5, Chemical Data Collected in the Beaufort Sea and Mackenzie River Delta, March-July 1987. Canada: Fisheries and Oceans.
Mackay, J. R. (1974). The Mackenzie Delta Area, N.W.T (Miscellaneous Report/Geological Survey of Canada). Ottawa: Geological Survey of Canada.
Manizza, M., Follows, M. J., Dutkiewicz, S., Menemenlis, D., Hill, C. N., and Key, R. M. (2013). Changes in the Arctic Ocean CO2sink (1996-2007): A Regional Model Analysis. Glob. Biogeochem. Cycles 27, 1108–1118. doi:10.1002/2012GB004491
Manson, G. K., and Solomon, S. M. (2007). Past and Future Forcing of Beaufort Sea Coastal Change. Atmosphere-Ocean 45, 107–122. doi:10.3137/ao.450204
Marsh, P., and Schmidt, T. (1993). Influence of a Beaufort Sea Storm Surge on Channel Levels in the Mackenzie Delta. ARCTIC 46, 35–41. doi:10.14430/arctic1319
Matsuoka, A., Babin, M., and Devred, E. C. (2016). A New Algorithm for Discriminating Water Sources from Space: A Case Study for the Southern Beaufort Sea Using MODIS Ocean Color and SMOS Salinity Data. Remote Sensing Environ. 184, 124–138. doi:10.1016/j.rse.2016.05.006
Matsuoka, A., Boss, E., Babin, M., Karp-Boss, L., Hafez, M., Chekalyuk, A., et al. (2017). Pan-Arctic Optical Characteristics of Colored Dissolved Organic Matter: Tracing Dissolved Organic Carbon in Changing Arctic Waters Using Satellite Ocean Color Data. Remote Sensing Environ. 200, 89–101. doi:10.1016/j.rse.2017.08.009
Matsuoka, A., Hooker, S. B., Bricaud, A., Gentili, B., and Babin, M. (2013). Estimating Absorption Coefficients of Colored Dissolved Organic Matter (CDOM) Using a Semi-analytical Algorithm for Southern Beaufort Sea Waters: Application to Deriving Concentrations of Dissolved Organic Carbon from Space. Biogeosciences 10, 917–927. doi:10.5194/bg-10-917-2013
Matsuoka, A., Ortega-Retuerta, E., Bricaud, A., Arrigo, K. R., and Babin, M. (2015). Characteristics of Colored Dissolved Organic Matter (CDOM) in the Western Arctic Ocean: Relationships with Microbial Activities. Deep Sea Res. Part Topical Stud. Oceanography 118, 44–52. doi:10.1016/j.dsr2.2015.02.012
McGuire, A. D., Koven, C., Lawrence, D. M., Clein, J. S., Xia, J., Beer, C., et al. (2016). Variability in the Sensitivity Among Model Simulations of Permafrost and Carbon Dynamics in the Permafrost Region between 1960 and 2009. Glob. Biogeochem. Cycles 30, 1015–1037. doi:10.1002/2016GB005405
Morley, J. K. (2012). Observations of Flow Distributions and River Breakup in the Mackenzie Delta, NWT. Master’s thesis. Edmonton (Canada): University of Alberta.
Mulligan, R. P., and Perrie, W. (2019). Circulation and Structure of the Mackenzie River Plume in the Coastal Arctic Ocean. Continental Shelf Res. 177, 59–68. doi:10.1016/j.csr.2019.03.006
Mulligan, R. P., Perrie, W., and Solomon, S. (2010). Dynamics of the Mackenzie River Plume on the Inner Beaufort Shelf during an Open Water Period in Summer. Estuarine, Coastal Shelf Sci. 89, 214–220. doi:10.1016/j.ecss.2010.06.010
Nash, J. E., and Sutcliffe, J. V. (1970). River Flow Forecasting through Conceptual Models Part I - A Discussion of Principles. J. Hydrol. 10, 282–290. doi:10.1016/0022-1694(70)90255-6
Nill, L., Ullmann, T., Kneisel, C., Sobiech-Wolf, J., and Baumhauer, R. (2019). Assessing Spatiotemporal Variations of Landsat Land Surface Temperature and Multispectral Indices in the Arctic Mackenzie Delta Region between 1985 and 2018. Remote Sensing 11, 2329. doi:10.3390/rs11192329
Normandin, C., Frappart, F., Lubac, B., Bélanger, S., Marieu, V., Blarel, F., et al. (2018). Quantification of Surface Water Volume Changes in the Mackenzie Delta Using Satellite Multi-mission Data. Hydrol. Earth Syst. Sci. 22, 1543–1561. doi:10.5194/hess-22-1543-2018
Opsahl, S., Benner, R., and Amon, R. M. W. (1999). Major Flux of Terrigenous Dissolved Organic Matter through the Arctic Ocean. Limnol. Oceanogr. 44, 2017–2023. doi:10.4319/lo.1999.44.8.2017
Pisaric, M. F. J., Thienpont, J. R., Kokelj, S. V., Nesbitt, H., Lantz, T. C., Solomon, S., et al. (2011). Impacts of a Recent Storm Surge on an Arctic delta Ecosystem Examined in the Context of the Last Millennium. Proc. Natl. Acad. Sci. 108, 8960–8965. doi:10.1073/pnas.1018527108
Rawlins, M. A., Connolly, C. T., and McClelland, J. W. (2021). Modeling Terrestrial Dissolved Organic Carbon Loading to Western Arctic Rivers. J. Geophys. Res. Biogeosci 126, e2021JG006420. doi:10.1029/2021JG006420
Raymond, P. A., McClelland, J. W., Holmes, R. M., Zhulidov, A. V., Mull, K., Peterson, B. J., et al. (2007). Flux and Age of Dissolved Organic Carbon Exported to the Arctic Ocean: A Carbon Isotopic Study of the Five Largest Arctic Rivers. Glob. Biogeochem. Cycles 21. doi:10.1029/2007GB002934
Runkel, R. L., Crawford, C. G., and Cohn, T. A. (2004). Load Estimator (LOADEST): A FORTRAN Program for Estimating Constituent Loads in Streams and Rivers. Tech. Methods 4, A5. doi:10.3133/tm4a5
Schuur, E. A. G., McGuire, A. D., Schädel, C., Grosse, G., Harden, J. W., Hayes, D. J., et al. (2015). Climate Change and the Permafrost Carbon Feedback. Nature 520, 171–179. doi:10.1038/nature14338
Schwab, M. S., Hilton, R. G., Raymond, P. A., Haghipour, N., Amos, E., Tank, S. E., et al. (2020). An Abrupt Aging of Dissolved Organic Carbon in Large Arctic Rivers. Geophys. Res. Lett. 47, e2020GL088823. doi:10.1029/2020GL088823
Searcy, C., Dean, K., and Stringer, W. (1996). A River-Coastal Sea Ice Interaction Model: Mackenzie River Delta. J. Geophys. Res. 101, 8885–8894. doi:10.1029/96JC00120
Shiklomanov, A. I., Holmes, R. M., McClelland, J. W., Tank, S. E., and Spencer, R. G. M. (2020). Arctic Great Rivers Observatory. Discharge Dataset, Version 20201122. Available at: https://www.arcticrivers.org/data.
Shrestha, R. R., Prowse, T. D., and Tso, L. (2019). Modelling Historical Variability of Phosphorus and Organic Carbon Fluxes to the Mackenzie River, Canada. Hydrol. Res. 50, 1424–1439. doi:10.2166/nh.2019.161
Spencer, R. G. M., Mann, P. J., Dittmar, T., Eglinton, T. I., McIntyre, C., Holmes, R. M., et al. (2015). Detecting the Signature of Permafrost Thaw in Arctic Rivers. Geophys. Res. Lett. 42, 2830–2835. doi:10.1002/2015GL063498
Tank, S. E., Striegl, R. G., McClelland, J. W., and Kokelj, S. V. (2016). Multi-decadal Increases in Dissolved Organic Carbon and Alkalinity Flux from the Mackenzie Drainage basin to the Arctic Ocean. Environ. Res. Lett. 11, 054015. doi:10.1088/1748-9326/11/5/054015
Tanski, G., Bröder, L., Wagner, D., Knoblauch, C., Lantuit, H., Beer, C., et al. (2021). Permafrost Carbon and CO2 Pathways Differ at Contrasting Coastal Erosion Sites in the Canadian Arctic. Front. Earth Sci. 9, 630493. doi:10.3389/feart.2021.630493
Tanski, G., Couture, N., Lantuit, H., Eulenburg, A., and Fritz, M. (2016). Eroding Permafrost Coasts Release Low Amounts of Dissolved Organic Carbon (DOC) from Ground Ice into the Nearshore Zone of the Arctic Ocean: Permafrost Coasts Release Low Amounts of Doc. Glob. Biogeochem. Cycles 30, 1054–1068. doi:10.1002/2015GB005337
Tarnocai, C., Canadell, J. G., Schuur, E. A. G., Kuhry, P., Mazhitova, G., and Zimov, S. (2009). Soil Organic Carbon Pools in the Northern Circumpolar Permafrost Region. Glob. Biogeochem. Cycles 23. doi:10.1029/2008gb003327
Timmermans, M.-L., and Labe, Z. (2021). “Sea Surface Temperature,” in ArcticReport Card. Editors M. T. Druckenmille, and M. Thoman R L (Washington, D.C, USA: National Oceanic and Atmospheric Administration), 41–45. doi:10.25923/2y8r-0e49
Tokuda, D., Kim, H., Yamazaki, D., and Oki, T. (2019). Development of a Global River Water Temperature Model Considering Fluvial Dynamics and Seasonal Freeze‐Thaw Cycle. Water Resour. Res. 55, 1366–1383. doi:10.1029/2018WR023083
Tumel, N. (2002). in Permafrost. The Physical Geography of Northern Eurasia. Editor M. Shahgedanova (Oxford: Oxford Univ. Press).
Vaqué, D., Lara, E., Arrieta, J. M., Holding, J., Sà, E. L., Hendriks, I. E., et al. (2019). Warming and CO2 Enhance Arctic Heterotrophic Microbial Activity. Front. Microbiol. 10, 494. doi:10.3389/fmicb.2019.00494
Keywords: terrestrial DOC, land-to-sea interface, permafrost, Mackenzie delta, space remote sensing
Citation: Bertin C, Matsuoka A, Mangin A, Babin M and Le Fouest V (2022) Merging Satellite and in situ Data to Assess the Flux of Terrestrial Dissolved Organic Carbon From the Mackenzie River to the Coastal Beaufort Sea. Front. Earth Sci. 10:694062. doi: 10.3389/feart.2022.694062
Received: 12 April 2021; Accepted: 12 January 2022;
Published: 21 February 2022.
Edited by:
Louise Farquharson, University of Alaska Fairbanks, United StatesReviewed by:
Eurico D'Sa, Louisiana State University, United StatesBenjamin M. Jones, University of Alaska Fairbanks, United States
Copyright © 2022 Bertin, Matsuoka, Mangin, Babin and Le Fouest. This is an open-access article distributed under the terms of the Creative Commons Attribution License (CC BY). The use, distribution or reproduction in other forums is permitted, provided the original author(s) and the copyright owner(s) are credited and that the original publication in this journal is cited, in accordance with accepted academic practice. No use, distribution or reproduction is permitted which does not comply with these terms.
*Correspondence: Clément Bertin, Y2xlbWVudC5iZXJ0aW4xQHVuaXYtbHIuZnI=