- 1School of Mining and Mechanical Engineering, Liupanshui Normal University, Liupanshui, China
- 2School of Mining, China University of Mining and Technology, Xuzhou, China
Stress in rock masses is an important parameter in the design and construction of underground engineering, such as the design and maintenance of mine roadways and the design of mining working faces. It is also a fundamental force causing the deformation and failure of geotechnical engineering excavation. At present, the abutment-pressure monitoring technology of the surrounding rocks of the coal mine roadway in China is not intelligent and systematic and lacks some high-precision sensing instruments and multi-functional monitoring systems. The mechanical model of the rocks surrounding the borehole was constructed by theoretical analysis of problems in the stress monitoring technology for underground rock masses in coal mines. Additionally, the interaction between the surrounding rocks and the borehole stress meter was analyzed. The borehole stress meters for tubular-structure fiber Bragg grating (TS-FBG) and cystic-structure fiber Bragg grating (CS-FBG) were designed by combining the sensing principle and sensing characteristics of fiber Bragg grating, and the performance of the two kinds of fiber Bragg grating borehole stress meters was compared by laboratory test. The track roadway of the 14,301 tested working faces in the Shaqu Coal Mine was taken as an example, and the stress of the rocks surrounding the 14,301-track roadway was monitored in real time by CS-FBG borehole stress meter during the mining of the working face. The following conclusions are drawn from the field application. The rig-site utilization results revealed obvious stress growth and stress peak zones in the mining-stress change curves of each measuring point on the two sides of the 14,301-track roadway in the process of mining the tested working face. Additionally, there were four stages: rapid rise, uniform growth, rapid rise to the peak, and rapid decline. Maximum stress monitored by the second station was 18.5 MPa, and the influence range of stress was over 140 m. Maximum stress monitored by the first measuring station was 19 MPa, the influence range of stress was about 80 m, and the peak stress position was about 20 m in front of the coal wall. Rig-site utilization proved the design of the CS-FBG borehole stress meter to be reasonable. Performance was stable and reliable, and the successful operation of field monitoring achieved the expected effect.
Introduction
The stress state of rock masses is an important issue in engineering rock mechanics. Stress in rock masses is an important parameter for the design and construction of underground engineering, such as in mine roadway design and maintenance and the design of mining working faces (Hao, 2022; Liu et al., 2022; Yang et al., 2022a; Yang et al., 2022b). It is also a fundamental force causing excavation deformation and damage in geotechnical engineering, such as in mining (Wang et al., 2020; Liu and Li, 2022; Liu et al., 2022; Wang et al., 2022; Zhou et al., 2022). Therefore, the stress states and stress field characteristics of rocks after being disturbed, and the real-time monitoring technology of mining-induced stress, are studied. This research has great significance for the prevention and control of dynamic coal and rock disasters (e.g., control of rock burst, coal-gas outburst, coal wall spalling, and roadway roof collapse) and for mine safety production (e.g., the risk assessment of the working face area, roof control, and roadway support) (Ma et al., 2016; Sun et al., 2022; Yang et al., 2022a).
Researchers have studied monitoring technology for mining stress in rocks surrounding mine roadways (Torres et al., 2011; Ray et al., 2018; Wang et al., 2020). At present, abutment-pressure monitoring technology for the rocks surrounding coal mine roadways in China is not intelligent or systematic, and it lacks high-precision sensing instruments and multi-functional monitoring systems. There are mature theories and field applications for commonly used electromagnetic radiation monitoring technology, microseismic testing technology, and borehole stress meter testing methods in the stress monitoring of rock surrounding roadways (Tao et al., 2019; Wang et al., 2020; Chai et al., 2021). However, electromagnetic radiation monitoring technology and microseismic testing technology are easily affected by external electrical equipment, and their cost is high. The signal conversion of the borehole stress meter test is limited to the electric type. Monitoring accuracy is not high because the electric sensor is vulnerable to electromagnetic interference. Additionally, test system matching is lacking, and the degree of intelligence and integration is low. Therefore, research on improving the signal conversion mode and the monitoring accuracy of borehole stress meters is insufficient, and further research is needed to improve its intelligence and systematization.
Fiber sensors based on fiber Bragg grating are a new type of all-fiber functional passive sensor (Zhou et al., 2012; Sonnenfeld et al., 2015; Liang et al., 2019), with the advantages of being intrinsically safe, small in size, lightweight, corrosion resistant, electromagnetic-interference resistant, and safe and reliable to use. Meanwhile, transmission and perception are integrated to form a distributed sensor network. It is a promising new sensor technology for coal mines, which can realize the sensor monitoring of temperature, strain, pressure, torque, and other physical quantities. Liang et al. (2022) proposed a three-dimensional stress monitoring method for surrounding rocks based on fiber Bragg grating sensing technology. A cube-shaped three-dimensional stress fiber grating sensor was developed based on the principle of the monitoring method. Wan et al. (2021) developed a fiber Bragg grating stress sensor to measure stress variation between the lower-excavation damaged zone and the upper undistributed rock. Li (2015) proposed a stress monitoring system for surrounding rocks based on optical fiber sensing technology. Wei et al. (2015) used fiber Bragg grating sensing to monitor the three-dimensional stress state of surrounding rocks and its change law with mining. Additionally, a correlative simulation experiment was carried out. Zhang et al. (2020) developed a stress-displacement monitoring system with a multi-point of one hole and tested its measuring function.
However, most of these studies contain theoretical analysis, laboratory research, or geotechnical engineering applications; the research results are rarely generalized and applied in underground coal mines. Moreover, there are few studies on fiber Bragg grating borehole stress meters in coal mines (Xu et al., 2017; Liang et al., 2018; Liang and Fang, 2018). Therefore, it is necessary to develop a fiber Bragg grating borehole stress meter suitable for the stress monitoring of the rocks surrounding coal mine roadways.
Based on existing research on borehole stress meters, interactions between rocks surrounding mines and borehole stress meters were analyzed theoretically by constructing a mechanical model of the surrounding rock of the borehole. The structure of the fiber-grating borehole stress meter was optimized, and its performance was tested by fiber sensing technology. Combined with the geological conditions of the coal mine, the abutment pressure of the rock surrounding the roadway was measured onsite using the optimized design of the CS-FBG borehole stress meter. The research results can improve the intelligent mining-stress monitoring of mine roadways and reveal the distribution characteristics and evolution law of the surrounding-rock stress field of roadways, and they can be used to study coal and rock dynamic disasters and roadway-support design.
Basic theory and characteristics of fiber Bragg grating sensing
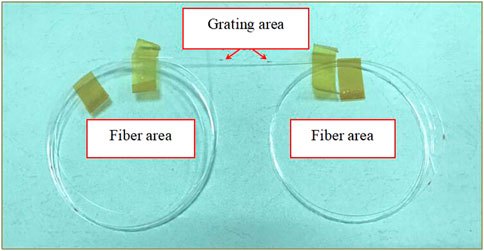
Fiber (Daichi et al., 2018; Guo et al., 2022; Liang et al., 2022) is primarily composed of a core, cladding, coating (protective layer), reinforced fiber, and protective sheath. Core and cladding are the main parts of the fiber, with a diameter of about 125 μm, and play decisive roles in transmitting light waves. The coating layer, reinforced fiber, and protective sleeve are mainly used to isolate stray light, improve fiber strength, and protect. The basic working principle of optical fibers (Daichi et al., 2018; Guo et al., 2022; Liang et al., 2022) is based on total light reflection. Light propagates in the core. Since the refractive index of the core is greater than that of the cladding, when the numerical aperture meets the total reflection condition, the incident light is not refracted and propagates through core reflection. Therefore, optical fibers can confine electromagnetic wave energy in the form of light in their core by total reflection and guide the light wave along the direction of the fiber axis. Figure 1 shows optical fiber (the part between the small black dots in the figure is the grating region, and the rest is the optical fiber region).
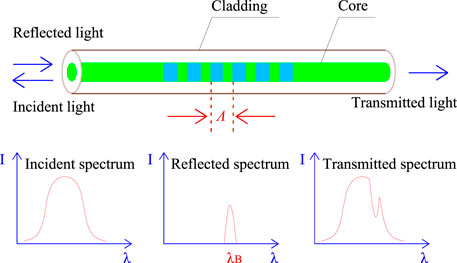
Fiber Bragg grating uses ultraviolet light to change the structure of the fiber core so that the refractive index of the core changes periodically under optical waveguides. A mirror-like device built into the core transmits light waves with a grating effect. Light that meets the grating wavelength condition is reflected, and the rest of the light is transmitted. The basic principle of fiber Bragg grating sensing (Chan et al., 2006; Ho et al., 2013; Yang et al., 2015) is that the change of external parameters shifts the reflected light wavelength, and changing external parameters can be obtained by detecting the shift of the wavelength. Figure 2 shows the structure and sensing characteristics of fiber Bragg grating.
When a light beam is injected into fiber Bragg grating, effective reflection is generated if the Bragg condition is met. The peak wavelength of reflected light is called the Bragg wavelength, which is as follows in single-mode fibers (Chan et al., 2006; Ho et al., 2013; Yang et al., 2015):
where λB is the reflected central wavelength of the Bragg grating, neff is the effective refractive index of the fiber core during fiber propagation, and Λ is the period of the grating.
The reflected central wavelength of the Bragg grating (λB) changes with changed neff and Λ. Both parameters, sensitive to changed external stress and temperatures, change the grid distance of the Bragg grating. The central wavelength reflected after entering the grating changes accordingly.
When the fiber Bragg grating is influenced by the external environment (stress, temperature, etc.), Λ and neff change. Wavelength variation ΔλB reflected from the grating can be expressed as (Chan et al., 2006; Ho et al., 2013; Yang et al., 2015)
where ΔλB is the wavelength variation reflected from the grating, Δneff is the refractive index variation of an optical fiber, and ΔΛ is the grating period variation.
The wavelength of λB changes correspondingly with changed neff and Λ. Λ and the effective refractive index of the reverse coupled mode are the main factors affecting the reflection and transmission spectra of the fiber Bragg grating, and any change in the two values changes the wavelength of the Bragg grating.
When fiber Bragg grating is used to monitor stress and strain, stress acting on it changes the grating spacing and the central wavelength (λB) of light it reflects. Meanwhile, neff is affected by strain and temperature because of the elastic-optical and thermo-optical effects. The fiber length changes, and thermal expansion affects Λ, under the two effects. Changes in both cause λB drift in the Bragg grating.
Analysis of interaction between the surrounding rocks of the roadway and borehole stress meter
Establishment of the mechanical model
At present, the borehole stress meter (Kang et al., 2010; Waclawik et al., 2016; Waclawik et al., 2017; Yun et al., 2017) is the most common and mature monitoring instrument for the coal mine roadway. Firstly, a borehole is constructed in the rocks surrounding the roadway. Some rocks surrounding the hole shrink into the hole with unloading. The borehole stress meter, filled with hydraulic oil, is buried in the borehole. Since the stress meter has a certain initial pressure, it can support the surrounding rocks. When surrounding rocks are disturbed, they squeeze into the borehole. The stress meter in the borehole compresses and interacts with the borehole wall. The surrounding rocks squeeze the stress meter inwards, and the stress meter supports the surrounding rocks outwards. Mining stress can be accurately monitored by converting this interaction into signal output. Therefore, the key to the method is to ensure that the borehole stress meter can fully function with the borehole wall of the surrounding rocks.
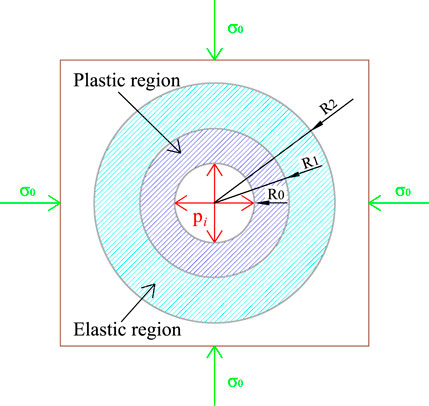
The surrounding rocks of the roadway are in the original equilibrium state before drilling; the original state is broken after drilling. The borehole wall falls off and deforms, and borehole stress is released and transferred. Surrounding rock stress is redistributed after some time, forming a plastic region in the rocks surrounding the borehole. Radial stress gradually increases with the distance from the borehole center. The surrounding rocks transition from the plastic state to the elastic state in a bidirectional stress state, with improved strength. Figure 3 shows the mechanical model of drilling in surrounding rocks. R0 is the radius of the drilling hole; R1 and R2 are the radiuses of the plastic and elastic regions, respectively; σ0 is the original stress of the surrounding rocks; and pi is the force exerted by the stress meter on the hole wall.
Analysis of relationships
1) Borehole stress meter taken as the research object
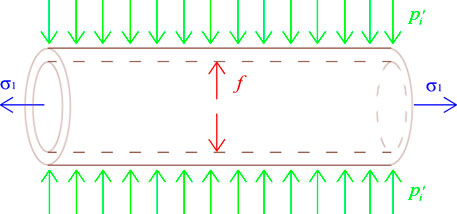
The borehole stress meter is approximated as a thin-walled cylinder, and the mechanical analysis model is established (Figure 4). pi′ is the force exerted by the borehole wall on the stress meter, f is the force exerted by the hydraulic oil on the inner wall of stress meter, and σ1 is the stress on the transverse section of the stress meter.
If the influence of the supporting capacity and stress transfer efficiency (ζ) of the stress meter material cannot be ignored (Kang et al., 2010; Waclawik et al., 2016; Waclawik et al., 2017; Yun et al., 2017), then the supporting force p1 of the stress meter material can be defined as
where ΔλB is the force exerted by the stress meter on the hole wall, ζ is the stress transfer efficiency, and f is the force exerted by the hydraulic oil on the inner wall of the stress meter.
The force balance analysis of the radial direction of the stress meter is used to obtain
where pi′ is the force exerted by the borehole wall on the stress meter.
The axial direction of the stress meter is analyzed according to knowledge of material mechanics:
where σ1 is the stress on the transverse section of stress meter, R0 is the radius of the drilling hole, and t is the wall thickness of the stress meter.
Assuming that t is the wall thickness of the stress meter, first strength theory and cylinder-wall-thickness limit theory (Kang et al., 2010; Waclawik et al., 2016; Waclawik et al., 2017; Yun et al., 2017) are used to obtain
where [σ] is the ultimate strength in unidirectional stretching.
According to Eq. 4 and Eq. 6, the limit value of force exerted by the hole wall on the stress meter can be denoted as
2) Surrounding rocks taken as research objects
Surrounding rocks are taken as the objects, and only radial stress is studied. A borehole built into the surrounding rocks forms plastic and elastic regions in turn. According to the principle of calculus (Kang et al., 2010; Waclawik et al., 2016; Waclawik et al., 2017; Yun et al., 2017), the tiny units in each stress zone are taken for force analysis. pi is the stress of the meter on the hole wall, Cm is the cohesion of the coal mass, and ϕm is the angle of internal friction.
① When the tiny element is located in the plastic region
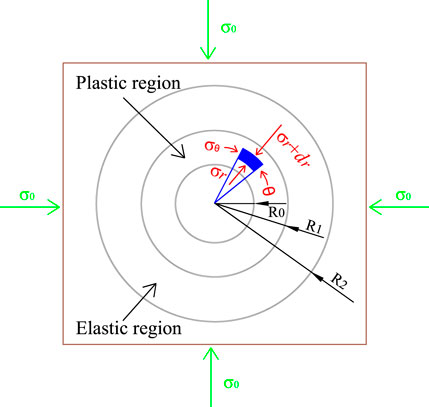
The mechanical model is established (Figure 5). The force balance analysis of the element is carried out in the radial direction (Kang et al., 2010; Waclawik et al., 2016; Waclawik et al., 2017; Yun et al., 2017) to obtain
where σr is the stress on the element in the radial direction; σθ is the stress on the element in the circumferential direction, and r is the tiny unit radius.
Since dθ is small and the plastic region meets the strength condition of Mohr’s straight line (Kang et al., 2010; Waclawik et al., 2016; Waclawik et al., 2017; Yun et al., 2017),
Based on the boundary conditions of the contact surface between the surrounding rocks and the stress meter, it is simplified and deduced that element stress (Kang et al., 2010; Waclawik et al., 2016; Waclawik et al., 2017; Yun et al., 2017) is
② When the tiny element is located in the elastic region
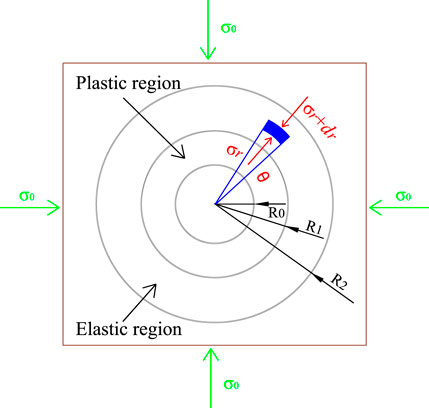
The mechanical model is established (Figure 6). Surrounding rocks can be approximated as a thick-walled cylinder, and σR1 is the stress at the outer boundary of the plastic region. According to the Lame formula (Kang et al., 2010; Waclawik et al., 2016; Waclawik et al., 2017; Yun et al., 2017), stress in this region can be expressed as
where σR1 is the stress at the outer boundary of the plastic region, and σ0 is the original stress of surrounding rocks.
Interaction analysis
Surrounding rocks are in their original stress state before the borehole is constructed. Surrounding rocks in the stress-relief area shrink inward after the borehole is constructed with a certain diameter at a certain point. The borehole stress meter with certain initial stress is placed in the borehole. Surrounding rocks shrink inward and gradually interact with the stress meter with the influence of external excavation–engineering disturbance. It is assumed that the disturbance influence does not produce a collapsing hole, large crack, or large-scale fracture zone. The initial stress of the borehole stress meter is assumed to be equal to the force exerted by the stress meter on the hole wall. Figure 7 shows the interaction between the surrounding rocks of the roadway and the borehole stress meter. The interaction is analyzed as follows:
① Figure 7A shows the diagram when initial stress pi of the borehole stress meter is less than σ0. Since the stress on the hole wall is less than the stress before release, the stress meter cannot support the surrounding rocks. Surrounding rocks continue to shrink inward, and stress gradually increases until it is equal to the stress of the surrounding rocks at inner point A. The stress meter starts to work properly. Therefore, increasing the initial stress of the borehole stress meter is a prerequisite for the normal use of the stress meter.
② Figure 7B shows the interaction when the initial stress pi of the borehole stress meter is equal to σ0. Since the stress meter exerts the same force on the hole wall before stress release, the surrounding rocks return to their original position B under the support of the stress meter. The stress meter can make the surrounding rocks no longer shrink, and it starts to work normally. The initial stress value is the optimal value for the normal operation of the stress meter in this case.
③ Figure 7C shows the interaction when the initial stress pi of the borehole stress meter is greater than σ0. Surrounding rocks are supported and extended outward due to large initial stress. Stress on the surrounding rocks decreases with the gradual expansion of the stress meter. The stress of the surrounding rocks gradually increases until the stress meter stress is equal to the stress of the surrounding rocks at the external point C due to mining influence. At this time, the stress meter starts to work normally.

FIGURE 7. Analysis of the interaction between surrounding rocks and borehole stress meter. (A) pi<σ0. (B) pi=σ0. (C) pi>σ0.
The initial stress of the borehole stress meter and the original stress of the surrounding rocks significantly affect the working state of the stress meter. Only when the initial stress of the borehole stress meter is as large as possible and the elasticity of borehole stress meter is good enough can the borehole stress meter work well. Therefore, the monitoring accuracy of the borehole stress meter is improved by increasing the initial stress value and improving the scalability of the borehole stress meter.
Design of fiber-grating borehole stress meter
Design principle
The vibrating-string stress meter (Tang et al., 2016; Wang et al., 2019; Yu et al., 2021) is mainly composed of a hollow steel cylinder, steel string, and embedded electromagnetic coil. It is necessary to pre-load the steel string, put the cylinder into the borehole, and make the cylinder and the surrounding rocks of the borehole fit tightly together. When the cylinder is stressed, the steel strings are extruded and vibrated. According to the vibration frequency, cylinder stress can be measured to obtain borehole stress.
The KSE hydraulic borehole stress meter (Hei et al., 2020; Wang et al., 2020) is mainly used to connect the inclusion, guide tubing, pressure-frequency converter, and other parts into a closed oil-circuit system. When the surrounding rocks of the borehole pressure the inclusions, the pressure-frequency converter converts the liquid pressure inside the inclusions into the corresponding electrical frequency signal, and the corresponding borehole stress variation can be obtained according to frequency variation.
Referring to the design principles of the above two kinds of stress meter, the fiber Bragg grating borehole stress meter designed in this study was mainly composed of a pressure cushion and fiber Bragg grating piezometer. When this kind of stress meter was used, fiber Bragg grating borehole stress was placed in the borehole and certain initial stress was applied. When the surrounding rocks were disturbed, the pressure cushion was squeezed. It sensed the pressure and sent it to the fiber Bragg grating piezometer through hydraulic oil in the pressure cushion. The fiber Bragg grating piezometer converted the pressure change into the wavelength drift.
Borehole stress meter design and performance test
1) Design of the TS-FBG borehole stress meter
The TS-FBG borehole stress meter and the pressure cushion are designed in a thin-wall stainless-steel cylindrical tubular structure. It is made by connecting an external fiber-grating pressure meter and encapsulating it in the outer end. The tubular structure is used as the pressure sensing area and the grating area as the sensing area. Finally, optical fibers are extracted and connected with a fiber Bragg grating demodulator to realize the communication of monitoring signals. Figure 8 shows the designed TS-FBG borehole stress meter.
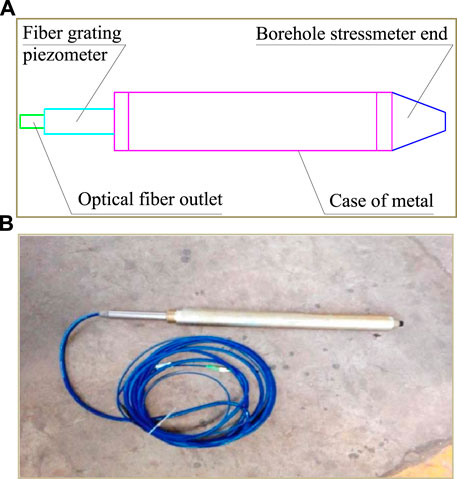
FIGURE 8. TS-FBG borehole stress meter. (A) Schematic diagram of stress meter. (B) Physical drawing of stress meter.
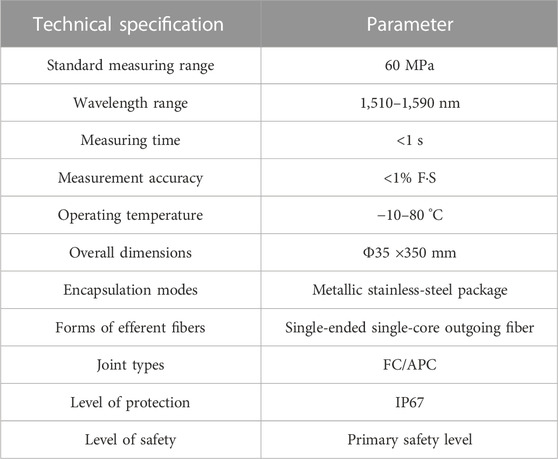
The TS-FBG borehole stress meter has a standard measuring range of up to 60 MPa, which can work for a long time under the mine without being affected by the electromagnetic signals of the surrounding environment. Table 1 shows the main technical parameters.
A hydraulic servo loading testing machine was used to test the performance of the designed TS-FBG borehole stress meter. The TS-FBG borehole stress meter should be sorted according to wavelength classification, and the circuit should be checked before the experimental test. The TS-FBG borehole stress meter was first placed on the fixture of two semi-arc bearing structures at the beginning of the experimental test, and the whole structure was placed under the pressure valve of the testing machine. Additionally, the bearing structure and TS-FBG borehole stress meter were checked for uniform force. The TS-FBG borehole stress meter was connected to the fiber Bragg grating demodulation system, and we checked whether the instrument works properly. The initial pressure was applied to the TS-FBG borehole stress meter, and relevant data were recorded. The pressure was continued for the performance test after data and equipment were stabilized. Figure 9 shows photos before and after the performance test of the TS-FBG borehole stress meter.
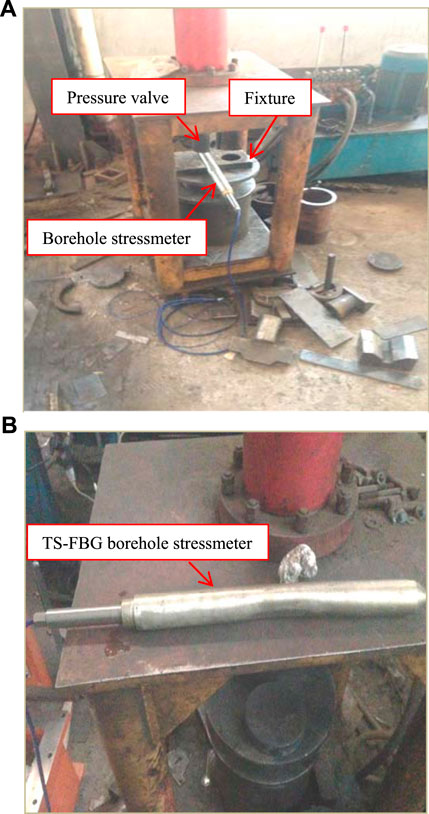
FIGURE 9. Before and after the performance test of the TS-FBG borehole stress meter. (A) Before the test. (B) After the test.
The performance test of the TS-FBG borehole stress meter shows that when the metal tube is filled with hydraulic oil, the pressure induction zone is easily deformed beyond the elastic limit of the thin-walled tube when a certain pressure is applied. Meanwhile, the metal tube is only a thin-walled tube with poor expansion and scalability, which can easily cause oil leakage and result in inaccurate tests or even failure. Furthermore, this design is time-consuming and laborious in oil injection and does not have the function of pressure regulation, which greatly affects the test results and makes the test fail to collect effective experimental data.
2) Design of the CS-FBG borehole stress meter
The second type was further optimized in view of the problems with the first type of TS-FBG borehole stress meter. Its structure is mainly composed of a quadrangular cone end, pressure cushion, sensitization pad, check valve, fiber grating piezometer, and protective sleeve. A pressure cushion was designed into a cystic structure, and four sensitizing pads were installed on its outer surface. The one-way valve was connected to a pressure cushion and fiber Bragg grating piezometer. The fiber Bragg grating piezometer and signal transmission cables were protected by protective sleeves. When used, the capsular pressure cushion and sensitizing pad were used as the pressure sensing area, and the grating area was used as the sensing area. The signal transmission cable is connected to the fiber Bragg grating demodulation instrument to realize the communication of monitoring signals. Figure 10 shows the designed CS-FBG borehole stress meter.
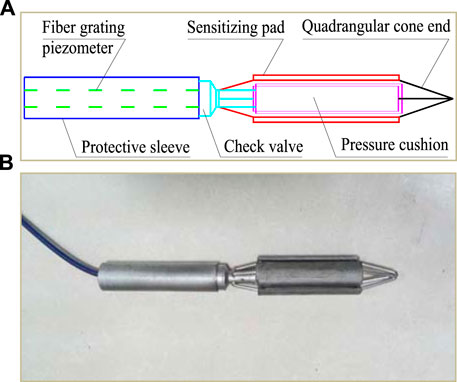
FIGURE 10. CS-FBG borehole stress meter. (A) Schematic diagram of stress meter. (B) Physical drawing of stress meter.
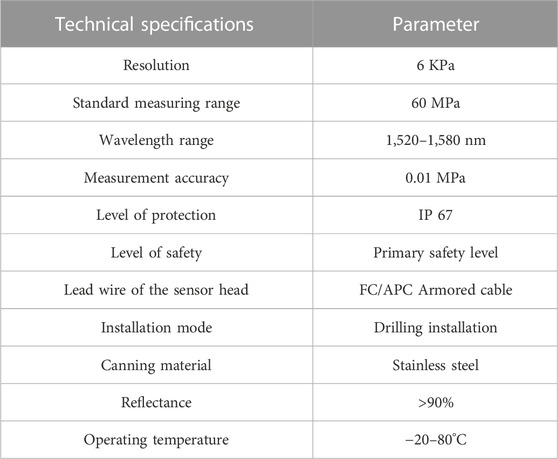
The design of the CS-FBG borehole stress meter has a standard measuring range of up to 60 MPa, which can work for a long time under the mine without being affected by the electromagnetic signals of the surrounding environment. Table 2 shows the main technical parameters.
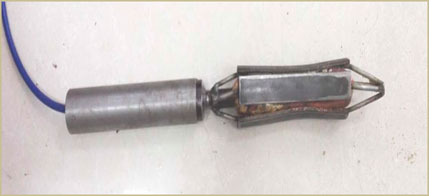
The original metal tubular pressure cushion was changed into a cystic structure to improve the compression resistance and force sensitivity of the pressure cushion, and four cuboid sensitizing pads were fixed on the outer surface of the pressure cushion. The sensitizing pad has a length of 130 mm, a width of 20 mm, and a thickness of 4 mm. There is a small gap between the sensitizing pad and the pressure cushion. The front and rear ends of the sensitizing pad were designed with a similar quadrangular cone structure, which formed four branches. Four branches met at one point and were fixed to each other.
This design increased the stability of the stress meter and the pressure sensitivity and flexibility of the pressure cushion. The design has the following advantages: it changes the contact mode of the whole plane between the tubular structure and surrounding rocks into a local contact mode, improves the bearing capacity of the pressure cushion under the same pressure, and prolongs the service time of the stress meter. Figure 11 shows the design of the pressure cushion quadrangle end and sensitizing pad.
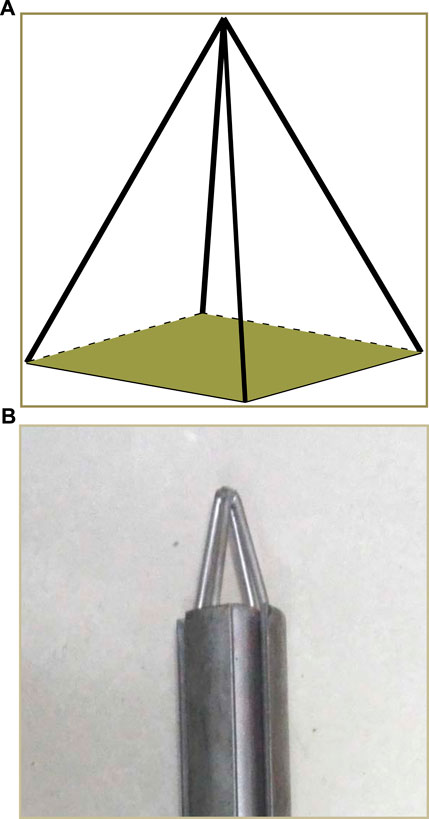
FIGURE 11. Designed pressure-cushion end and sensitizing pad. (A) Quadrangular cone end. (B) End and sensitizing pad.
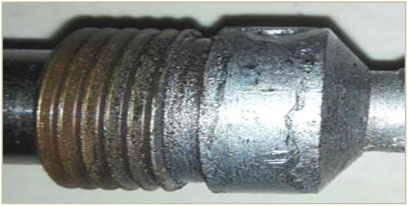
A hollow check valve was installed between the pressure cushion and fiber grating piezometer to keep the oil pressure in the pressure cushion stable and make the oil injection convenient. The check valve has a thread design to facilitate the assembly and connection of the fiber grating piezometer and protective sleeves. Its outer diameter is 28 mm, with an inner diameter of 18 mm, and a wall thickness of 5 mm; an oil hole with a diameter of 6 mm exists at its bottom. Figure 12 shows the check valve.
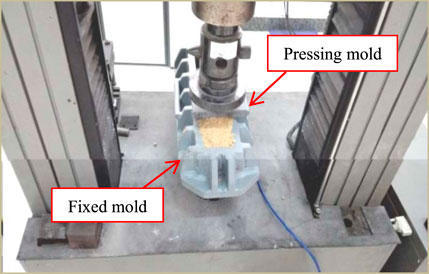
The performance of the CS-FBG borehole stress meter was tested by an MTS automatic servo-pressure testing machine. The testing machine can realize automatic data storage and recording and has a multifunctional display function. An experimental test mold of the confining pressure was designed to keep the pressure cushion under uniform force and to restore the surrounding rock stress environment when the borehole stress meter was used in the field (Figure 13). The mold was divided into fixed and pressing molds. The fixed mold was a rectangular container with a U-shaped groove inside, and the pressing mold was a semi-cylindrical pressing plate. The cuboid of the fixed mold part was 800 mm long, 200 mm wide, and 100 mm high. The radius of the U-shaped groove was 70 mm and that of the pressing mold was 25 mm.
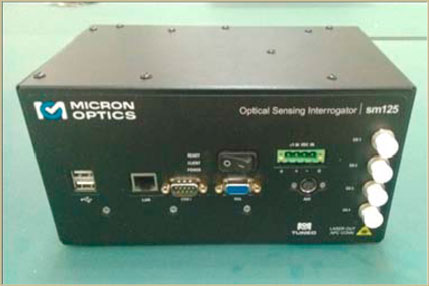
Micron Optic Company’s classic Sm125 Fiber Bragg grating static demodulation instrument was used for the stress meter performance experiment (Sun et al., 2019; Tian et al., 2019; Wu et al., 2019). It has a wavelength resolution of 1 p.m. and a wavelength scanning range of 1,510–1,590 nm. The software system is integrated with MOI-ENLIGHT, and the client program interacts with the Windows system. Figure 14 shows a fiber Bragg grating static demodulator.
The experimental methods and operating procedures of the stress meter performance test are as follows:
① The fiber Bragg grating borehole stress meter was connected to the demodulator before the experiment. The initial stress meter pressure was small in order to test the tightness of stress meter and check for oil leakage.
② Sand, crushed coal, and rock blocks were laid in turn in the cuboid fixed mold and mixed with water in a certain proportion. The borehole stress meter was buried in it and placed for 24 h after compacting and filling.
③ The prepared model was put on the pressure plate of the pressure test machine. The pigtail of the borehole stress meter was drawn out of the model, and the semi-cylindrical pressure plate on the model of borehole stress meter was put right above the model. We ensured that the stress of the stress meter was uniform and that it played a certain protective role during the pressure.
④ The pressure test machine was debugged and checked for normal functioning, and users became familiar with the use of the test machine and related settings.
⑤ A cotton sheet glued with alcohol was used to wipe the pigtail joint of the borehole stress meter and the optical jack of the demodulator. The tail fiber of the borehole stress meter was connected to one of the channels of the demodulator after drying, and the network interface of the computer was connected to the network interface of the demodulator through the network cable. The demodulation device was started and parameters such as IP communication protocol and collection frequency were set. Then data collection was performed.
⑥ The height of the pressing plate was lowered to contact the mold at the beginning of the experiment, then changed to a small range pressure mode to reduce the falling speed of the pressing plate. When the pressure data of the servo system fluctuated significantly, the equal gradient pressure mode was used to increase the load by 20 KN each time until the load reached 300 KN. Demodulator software automatically recorded the monitoring data of the whole loading process.
⑦ Unloading was done with the same gradient until the pressure exerted by the experimental machine on the mold was zero after loading. The large-range pressure mode was used to rapidly raise the pressing plate. The remaining model was replaced and the same loading and unloading test carried out.
⑧ The monitoring data were sorted, and the borehole stress meter and experimental machine were checked. The site was cleaned up and the experimental test completed.
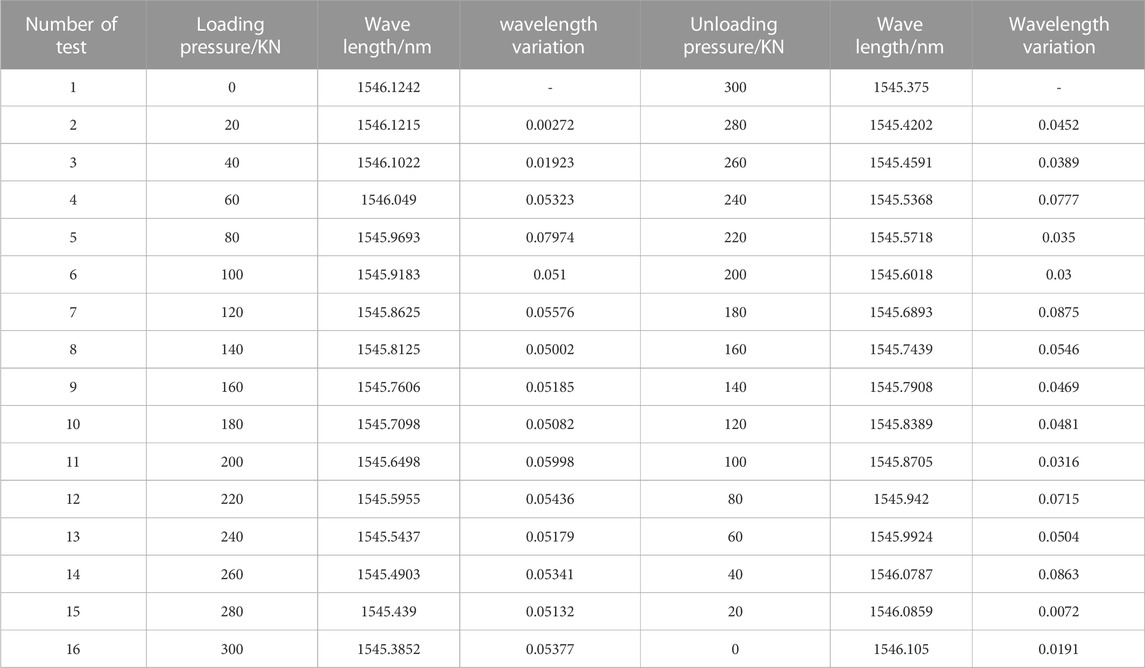
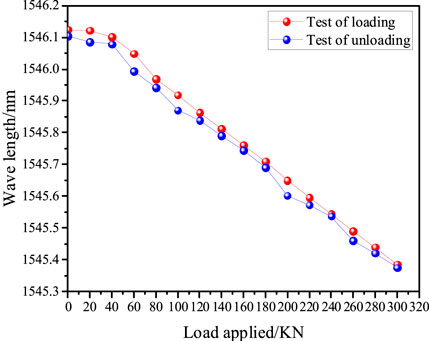
Three groups of loading and unloading experiments were carried out, and one group of experimental test data was selected for analysis (Table 3). Figure 15 shows the pressure- and wavelength-changing curve applied by the experimental machine.
The surrounding rock pressure subjected to the fiber grating borehole stress meter increases simultaneously with increasing pressure exerted by the experimental machine in the test (Figure 15). Also, the grating wavelength changes constantly. The wavelength decreases continuously during the loading process and increases continuously during the unloading process.
The changing curve of the pressure and wavelength applied by the experimental machine can be divided into two stages. 1) In the pressure-boost stage, the borehole stress meter is gradually compacted and fitted closely with sand in the mold, with a small slope of the curve and the slow change. The pressure on the mold is small at the early stage of pressurization. The initial stress of the borehole stress meter is not enough and the expansion is insufficient, failing to interact with the sands and stones in the mold. 2) The borehole stress meter and sand in the mold are compacted and fitted closely at the pressure-stabilizing stage. The borehole stress meter bears the pressure, and the slope of the curve is large. Then, the grating wavelength and the applied pressure present a linear change. The borehole stress meter interacts with the sand in the mold, and the test is reliable.
In summary, the second kind of CS-FBG borehole stress meter can meet the requirements of field use. A good linear relationship exists between the grating wavelength and applied pressure during the loading and unloading test. The wavelength varies with the pressure applied, and the value of the wavelength at unloading is slightly smaller than at loading. The wavelength changes unevenly during the loading and unloading process of each stage, and the change value is about .05 nm, indicating the high sensitivity of the CS-FBG borehole stress meter. However, the pressure cushion of the borehole stress meter is seriously deformed after the test (Figure 16), and it is difficult to reuse. Structural scalability must still be optimized and improved. When the borehole stress meter is optimized, its scalability and initial pressure should be studied in the next step.
Rig-site utilization and effect analysis
Mine overview
The Shaqu Coal Mine of Huajin Coking Coal Co., Ltd. is located in Liulin County, Luliang City, Shanxi Province, China. The mine strike length is 22 km, the inclined direction is 4.5–8 km wide, and the area is 138.35 km2. The whole minefield is a gently inclined monoclinic structure with small local folds and faults. The structure of the minefield belongs to a simple type. The mining area is rich in high-quality coking coal, and the dip angle is gentle, generally 3°–7°. It is identified as a high gas mine with an absolute gas emission rate of 422.28 m3/min and a relative gas emission rate of 81.84 m3/t. Shaqu Mine is the second-highest gas mine in China.
The traditional electromagnetic sensor has certain dangers in the underground arrangement. Observation data have large errors and serious lag when manually observing and recording the stress variation of the surrounding rocks of the roadway. A real-time monitoring system of roadway-surrounding rock stress based on fiber Bragg grating sensor technology was installed in the 14,301-track roadway to promote the new technology and the timeliness of monitoring.
The 14,301 working face was the first mining face in the South mining area 3#, inclined to a longwall mining layout. The south was the unexcavated 14,302 working face; north and east were the village-protection coal pillars; west to the south was the main entry of mining area 3#. The average thickness of coal seam 4# was 2.45 m, with an average dip angle of 6° and an average burial depth of 400 m. The inclined length of the 14,301 working face was 220 m, and the strike mining length was 1,145 m. The 14,301 working face adopted a Y-shaped ventilation mode. The length of the track roadway is 1,260 m, and the length of the belt roadway is 1,300 m. The two layers of coal were mined together due to the small spacing between coal seams 3 and 4# in the front part of the working face. However, the spacing between the coal seams 3 and 4# is larger in the back part of the working face, so the two coal layers must be mined separately. A second setup entry was dug at 805 m of the belt roadway and 769 m of the track roadway, and the track roadway was retained by gob entry technology as the roadway of the next working face. Figure 17 shows the layout of the 14,301 working face.
Layout design of borehole stress meter
Two monitoring stations were arranged in the 14,301-track roadway, combined with the requirements of the mining stress monitoring of surrounding rocks of the roadway to test the rig-site utilization of the CS-FBG borehole stress meter. Stations 1 and 2# were arranged about 910 m and 660 m away from the open cut of the 14,301 working face respectively (Figure 17). Six measuring points were arranged in each monitoring station, and three measuring points were arranged on the upper side of the roadway and the lower side of the coal pillar (Figure 18A). A drilling rig was used to cut holes at a height of 1.5 m from the roadway floor to simultaneously monitor the distribution and change of mining stress at different depths of surrounding rocks on two sides of the track roadway (Figure 18B). Additionally, drill holes with depths of 1, 3, and 5 m were constructed, and the spacing between adjacent holes was 2 m. The CS-FBG borehole stress meter was installed in each borehole (Figures 18C, D), and 12 were installed in two measuring stations.
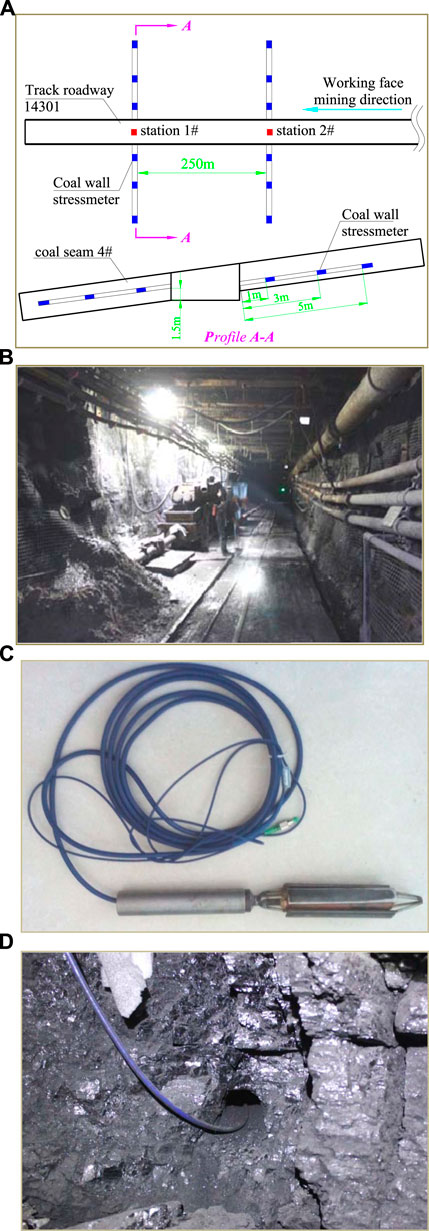
FIGURE 18. Field installation and layout of the CS-FBG borehole stress meter. (A) Layout design of borehole stress meter. (B) Site construction drawing of borehole. (C) CS-FBG borehole stress meter. (D) Field installation of roadway sides.
The field installation process and steps of the CS-FBG borehole stress meter are as follows:
① Holes were drilled with depths of 1, 3, and 5 m along the floor at a height of 1.5 m in the two measuring stations of the track roadway, according to the requirements of the measuring point layout. The spacing between adjacent holes is 2 m.
② The borehole diameter should be about 10 mm larger than the borehole stress meter to prevent the borehole stress meter from becoming stuck in the borehole during installation and make it quickly contact with surrounding rocks.
③ The drilling hole should be cleaned after drilling. First, the hole bottom was cleared and then the surrounding rocks of the drilling hole were cleaned. A wooden pole was used to wrap a towel layer. Desiccants were applied to dry the drill holes, and a clean towel was replaced each time.
④ An anchorage agent was placed in the borehole after the borehole was cleaned to make full contact between the borehole stress meter and the surrounding rocks. Then the CS-FBG borehole stress meter was slowly pushed into the borehole with a push rod. The push rod should not be rotated during pushing into the borehole stress meter to prevent the optical fiber pigtail at the tail of borehole stress meter from being torn off during rotation.
⑤ Cement mortars were pushed into borehole, and grouting was stopped when mortars were filled and flowed out of the orifice. The borehole stress meter was cemented into surrounding rocks by mortars.
⑥ The CS-FBG borehole stress meter was drawn out to the drilling hole, and the splitter and adapter were connected in order. Then the main optical cable was connected to the base station by the flange. Figure 18 shows the field installation of the borehole stress meter.
Rig-site utilization effect analysis
The mining-stress monitoring system of the surrounding rocks of the fiber Bragg grating roadway can monitor the abutment pressure at different depths in real time after the installation and debugging of the 14,301-track roadway. The mining-stress variation curves of the surrounding rocks of the 14,301-track roadway at different depths are obtained through the collection and analysis of the monitoring data of the two stations (Figures 19A,B).
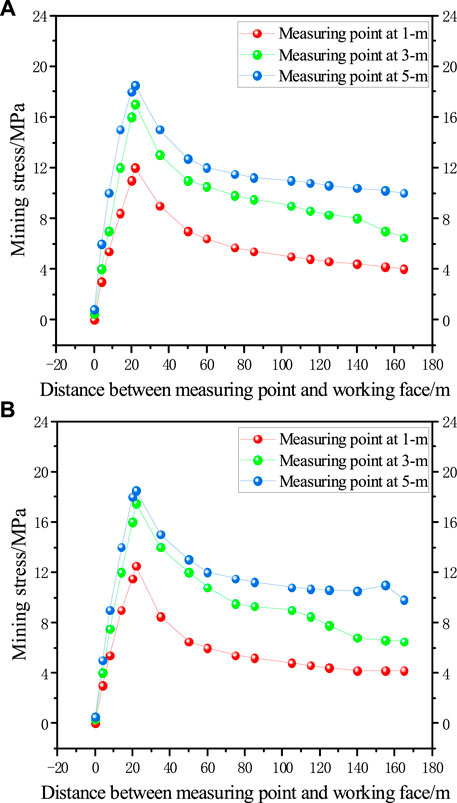
FIGURE 19. Vertical mining stress curves of each measuring point in the track roadway of the second measuring station. (A) Upper side of the track roadway. (B) Lower side of the track roadway.
The mining-stress distribution curves of the two sides of the 14,301-track roadway have the same change law during mining of the 14,301 working face (Figure 19). It shows four stages: rapid rise, uniform growth, rapid rise to the peak, and rapid decline. When the measuring point is 50 m away from the working face, the increase in stress is small. When the distance from the working face is within 50 m, stress starts to increase rapidly. When the distance from the working face is about 20 m, stress reaches its peak. As the distance from the working face decreases further, stress drops sharply until the measuring point fails. Stress increases overall with the increased depth of the measurement point, but the increased amplitude is not uniform.
Figure 19A shows obvious stress growth areas and stress concentration areas in the stopping process. When the measuring point enters the range of 140 m, the stress of the measuring point with 3-m depth jumps up first, indicating that the surrounding rock enters the zone affected by mining stress. Subsequently, stress increases uniformly at different depth-measurement points. When the measuring point enters the working face within 40 m, the stress of the measuring point with 1-m depth rises rapidly, indicating that surrounding rocks enter the advanced stress concentration area of the working face. When the measuring point is at about 20 m, the stress reaches a peak of 18.5 MPa and then drops rapidly until the working face advances past the measuring point, which fails the measuring point. The stress of measuring points at different depth is compared. Vertical stress increases with the increased depth of surrounding rocks, and peak stress at the measuring point at 5 m is the largest because surrounding rocks at different depths are disturbed by mining to different degrees.
The stress growth and stress concentration zones are also obvious in the process of mining the working face (Figure 19B). When measuring points are within 145 m of the working face, measuring points at 3 and 5 m first enter the mining-stress-affected zone. When the measuring point enters the working face within 50 m, the stress of each measuring point increases rapidly and enters the rapid growth area. When the measuring point enters the working face within 18 m, the stress of each measuring point reaches a peak. The disturbance influence of the measuring point with 1-m depth is not significant when comparing the stress of each measuring point without planting depth, and the increased amplitude is relatively gentle in the process of mining the working face.
The measuring points of the first measuring station are similar to those of the second measuring station during the mining of the 14,301 working face (Figure 20). The mining stress curves of the measuring points at different depths also show the stages of rapid rise, uniform growth, rapid rise to peak, and rapid decline. Additionally, the stress of each measuring point presents increases with the increased depth of the measuring point, but the increasing amplitude is not uniform.
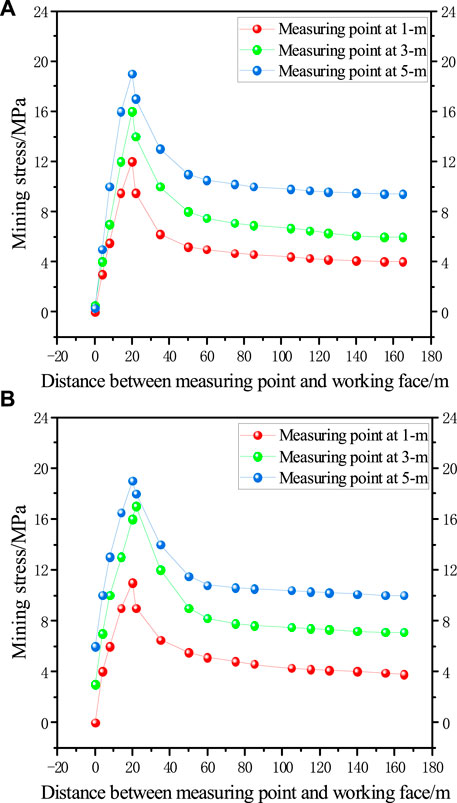
FIGURE 20. Vertical mining-stress curves of each measuring point in the track roadway of the first measuring station. (A) Upper side of the track roadway. (B) Lower side of the track roadway.
Obvious stress growth and stress peak zones exist during the stopping of the 14,301 working face (Figure 20A). When the measuring point is 100 m away from the working face, the stress of different depth measuring points does not change. When the measuring point enters the working face within 90 m, the stress of each measuring point grows slowly, and surrounding rocks enter the stress-affected zone. When the measuring point is within 50 m of the working face, the stress of the measuring points at 3 and 5 m shows a leaping rise, while that at 1 m rises rapidly when it is 35 m away from the working face. When the measuring point is within 20 m from the working face, peak stress reaches 19 MPa. The stress value of the measuring point with 5-m depth is always greater than that with 1- and 3-m depth in the mining process.
The stress growth and stress peak zones are still obvious during the mining of the 14,301 working face, and the stress distribution pattern is similar to that of the upper coal body (Figure 20B). The stress influence range is about 80 m in front of the working face, the stress rapid growth area is about 50 m in front of the working face, and the stress peak is at about 18 m in front of the working face.
Conclusion
1) The mechanical model of the rocks surrounding the borehole was built through theoretical analysis, and the interaction between surrounding rocks and the borehole stress meter was analyzed. The results showed that increasing the initial stress and elasticity of the borehole stress meter improved its monitoring accuracy.
2) Two kinds of fiber Bragg grating borehole stress meters, with tubular structure and cystic structure, were designed by combining the sensing principle and sensing characteristics of fiber Bragg grating, and their performance was tested by experiments. The precision of stress monitoring is affected by insufficient initial stress and scalability of the borehole stress meter. The CS-FBG borehole stress meter was more suitable for the stress monitoring requirements of the surrounding rocks of the coal mine roadway, compared with the TS-FBG borehole stress meter.
3) The rig-site utilization results showed that the mining stress variation curves of each measuring point on the two sides of the track roadway have obvious stress growth zones and stress peak zones in the process of mining the test working face. There were four stages: rapid rise, uniform growth, rapid rise to peak, and rapid decline. Maximum stress monitored by the second station was 18.5 MPa, and the influence range of stress was over 140 m. Maximum stress monitored by the first measuring station was 19 MPa, the influence range of stress was about 80 m, and the peak stress position was about 20 m in front of the coal wall. Field application proved the design of the CS-FBG borehole stress meter to be reasonable: the performance is stable and reliable, and the successful operation of field monitoring has achieved the expected effect of field monitoring.
Data availability statement
The original contributions presented in the study are included in the article/Supplementary Material, further inquiries can be directed to the corresponding author.
Author contributions
XXe wrote the original draft of the manuscript. XF and HL contributed to the conception and design of the study. XXn and ML organized the database. GW and NC performed the statistical analysis. All authors contributed to manuscript revision and read and approved the submitted version.
Funding
This work was supported by the Liupanshui Normal University fund (LPSSYYBZK202202, LPSSYjg-2021-34), the Science and Technology Department of Guizhou Province Fund (Qiankehe Platform Talent-YSZ [2021] 001), the Education Department of Guizhou Province Fund (Qianjiaohe KY Zi [2020] 050, Qianjiaohe [2020] 122, Qianjiao XKTJ [2020] 23, Qianjiaohexietongchuangxinzi[2016] 02), and the Liupanshui Science and Technology Bureau Fund (52020-2022-PT-15).
Conflict of interest
The authors declare that the research was conducted in the absence of any commercial or financial relationships that could be construed as a potential conflict of interest.
Publisher’s note
All claims expressed in this article are solely those of the authors and do not necessarily represent those of their affiliated organizations, or those of the publisher, the editors and the reviewers. Any product that may be evaluated in this article, or claim that may be made by its manufacturer, is not guaranteed or endorsed by the publisher.
References
Chai, J., Ouyang, Y., Liu, J., Zhang, D., Du, W., and Lei, W. (2021). Experimental study on a new method to forecasting goaf pressure based key strata deformation detected using optic fiber sensors. Opt. Fiber Technol. 67, 102706. doi:10.1016/j.yofte.2021.102706
Chan, T. H. T., Yu, L., Tam, H. Y., Ni, Y. Q., Liu, S. Y., Chung, W. H., et al. (2006). Fiber Bragg grating sensors for structural health monitoring of Tsing Ma bridge: Background and experimental observation. Eng. Struct. 28 (5), 648–659. doi:10.1016/j.engstruct.2005.09.018
Daichi, W., Hirotaka, I., Masato, T., Kasai, T., Arizono, H., Murayama, H., et al. (2018). Flight demonstration of aircraft fuselage and bulkhead monitoring using optical fiber distributed sensing system. Smart Mat. Struct. 27 (2), 025014. doi:10.1088/1361-665X/aaa588
Guo, G. H., Zhang, D. D., Duan, Y. Y., Zhang, G. H., and Chai, J. (2022). Strain-sensing mechanism and axial stress response characterization of bolt based on fiber Bragg grating sensing. Energies 17 (15), 15176384. doi:10.3390/en15176384
Hao, Z., Sun, G., Zhang, G., Sun, G. Z., and Zhang, G. H. (2022). Mechanism and inducing factors of rockburst events of roadways under ultrathick strata. Front. Earth Sci. 10, 860929. doi:10.3389/feart.2022.860929
Hei, C., Luo, M. Z., Gong, P. P., and Song, G. B. (2020). Quantitative evaluation of bolt connection using a single piezoceramic transducer and ultrasonic coda wave energy with the consideration of the piezoceramic aging effect. Smart Mat. Struct. 29 (2), 027001. doi:10.1088/1361-665X/ab6076
Ho, M. P., Lau, K. T., Au, H. Y., Dong, Y., and Tam, H. Y. (2013). Structural health monitoring of an asymmetrical SMA reinforced composite using embedded FBG sensors. Smart Mat. Struct. 22 (12), 125015. doi:10.1088/0964-1726/22/12/125015
Kang, H., Zhang, X., Si, L., Wu, Y., and Gao, F. (2010). In-situ stress measurements and stress distribution characteristics in underground coal mines in China. Eng. Geol. 116 (3-4), 333–345. doi:10.1016/j.enggeo.2010.09.015
Li, H. W., Fang, X. Q., Liang, M. F., and Xue, G. Z. (2015). Research on monitoring technology of surrounding rock stress based on fiber grating. Ind. Min. Auto. 41 (11), 17–20. doi:10.13272/j.issn.1671-251x.2015.11.005
Liang, M., and Fang, X. (2018). Application of fiber Bragg grating sensing technology for bolt force status monitoring in roadways. Appl. Sci. 8 (1), 8010107. doi:10.3390/app8010107
Liang, M., Fang, X., Li, S., Wu, G., Ma, M., and Zhang, Y. (2019). A fiber Bragg grating tilt sensor for posture monitoring of hydraulic supports in coal mine working face. Measurement 138, 305–313. doi:10.1016/j.measurement.2019.02.060
Liang, M., Fang, X., and Ning, Y. (2018). Temperature compensation fiber Bragg grating pressure sensor based on plane diaphragm. Photonic Sens. 8 (2), 157–167. doi:10.1007/s13320-018-0417-9
Liang, M., Fang, X., Song, Y., Li, S., Chen, N., and Zhang, F. (2022). Research on three-dimensional stress monitoring method of surrounding rock based on FBG sensing technology. Sensors 22 (7), 22072624. doi:10.3390/s22072624
Liang, M. F., Song, Y., Fang, X. Q., Jiang, Y. Y., Zhang, F., Li, S., et al. (2022). Structural design and application of desensitized FBG force-measuring bolt. Sensors 22 (10), 3930. doi:10.3390/s22103930
Liu, S. M., and Li, X. L. (2022). Experimental study on the effect of cold soaking with liquid nitrogen on the coal chemical and microstructural characteristics. Environ. Sci. Pollut. Res 2022 (12), 1–18. doi:10.1007/s11356-022-24821-9
Liu, X. W., Chen, J. X., Liu, B., Luo, Y., Zhu, Y. G., and Huang, X. (2022). Large deformation disaster mechanism and control technique for deep roadway in faulted zone. Front. Earth Sci. 10, 826661. doi:10.3389/feart.2022.826661
Ma, G., Mao, N., Li, Y., Jiang, J., Zhou, H., and Li, C. (2016). The reusable load cell with protection applied for online monitoring of overhead transmission lines based on fiber Bragg grating. Sensors 16 (6), 16060922. doi:10.3390/s16060922
Ray, P., Srinivasan, B., Balasubramaniam, K., and Rajagopal, P. (2018). Monitoring pipe wall integrity using fiber Bragg grating-based sensing of low-frequency guided ultrasonic waves. Ultrasonics 90, 120–124. doi:10.1016/j.ultras.2018.06.009
Sonnenfeld, C., Luyckx, G., Sulejmani, S., Geernaert, T., Eve, S., Gomina, M., et al. (2015). Microstructured optical fiber Bragg grating as an internal three-dimensional strain sensor for composite laminates. Smart Mat. Struct. 24 (5), 055003. doi:10.1088/0964-1726/24/5/055003
Sun, X., Guo, C., Yuan, L., Kong, Q., and Ni, Y. (2022). Diffuse ultrasonic wave-based damage detection of railway tracks using PZT/FBG hybrid sensing system. Sensors 22 (7), 22072504. doi:10.3390/s22072504
Sun, X. T., Li, D., He, W. Y., Wang, Z. C., and Ren, W. X. (2019). Grouting quality evaluation in post-tensioning tendon ducts using wavelet packet transform and bayes classifier. Sensors 19 (24), 19245372. doi:10.3390/s19245372
Tang, J., Jiang, C., Chen, Y., Li, X., Wang, G., and Yang, D. (2016). Line prediction technology for forecasting coal and gas outbursts during coal roadway tunneling. J. Nat. Gas. Sci. Eng. 34, 412–418. doi:10.1016/j.jngse.2016.07.010
Tao, Z., Zheng, X., Zhu, C., Zhang, H., and Zhang, X. (2019). Framework and application of a big data monitoring system for mining with a pillar-free self-forming roadway. Appl. Sci. 9 (10), 9102111. doi:10.3390/app9102111
Tian, Z. H., Yu, L. Y., Sun, X. Y., and Lin, B. (2019). Damage localization with fiber Bragg grating lamb wave sensing through adaptive phased array imaging. Struct. Health Monit. 18 (1), 334–344. doi:10.1177/1475921718755572
Torres, B., Payá-Zaforteza, I., Calderón, P. A., and Adam, J. M. (2011). Analysis of the strain transfer in a new FBG sensor for structural health monitoring. Eng. Struct. 33 (2), 539–548. doi:10.1016/j.engstruct.2010.11.012
Waclawik, P., Kukutsch, R., Konicek, P., Ptacek, J., Kajzar, V., Nemcik, J., et al. (2017). Stress state monitoring in the surroundings of the roadway ahead of longwall mining. Procedia Eng. 191, 560–567. doi:10.1016/j.proeng.2017.05.218
Waclawik, P., Ptacek, J., Konicek, P., Kukutsch, R., and Nemcik, J. (2016). Stress-State monitoring of coal pillars during room and pillar extraction. J. Sustain. Min. 15, 49–56. doi:10.46873/2300-3960.1207
Wan, X., Li, C., Zhao, Z., Zhang, D., Li, Y., and Zhang, J. (2021). Measurements of excavation damaged zone by using fiber Bragg grating stress sensors. Sensors 21 (15), 21155008. doi:10.3390/s21155008
Wang, K., Cao, W., Su, Z., Wang, P., Zhang, X., Chen, L., et al. (2020). Structural health monitoring of high-speed railway tracks using diffuse ultrasonic wave-based condition contrast: Theory and validation. Smart Struct. Syst. 26 (2), 227–239. doi:10.12989/sss.2020.26.2.227
Wang, P., Zhang, N., Kan, J., Xie, Z., Wei, Q., and Yao, W. (2020). Fiber Bragg grating monitoring of full-bolt axial force of the bolt in the deep strong mining roadway. Sensors 20 (15), 20154242. doi:10.3390/s20154242
Wang, R., Wu, Q., Xiong, K., Ji, J. Y., Zhang, H. Q., and Zhai, H. Z. (2019). Phase-shifted fiber Bragg grating sensing network and its ultrasonic sensing application. IEEE Sens. J. 19 (21), 9790–9797. doi:10.1109/JSEN.2019.2927381
Wang, S., Li, X. L., and Qin, Q. Z. (2022). Study on surrounding rock control and support stability of Ultra-large height mining face. Energies 15 (18), 15186811. doi:10.3390/en15186811
Wang, T., Chang, J. C., Gong, P., Shi, W. B., Li, N., and Cheng, S. X. (2020). The experimental instrumented bolt with fibre Bragg grating force sensors. Arch. Min. Sci. 65 (1), 179–194. doi:10.24425/ams.2020.132714
Wei, S. M., Ma, Z. Y., Li, B. F., and Chai, J. (2015). Study on the monitoring method of three-dimensional stress with FBG in surrounding rock and the simulation experiment. J. Min. Saf. Eng. 32 (1), 138–143. doi:10.13545/j.cnki.jmse.2015.01.022
Wu, Q., Wang, R., Yu, F. M., and Okabe, Y. (2019). Application of an optical fiber sensor for nonlinear ultrasonic evaluation of fatigue crack. IEEE Sens. J. 19 (13), 4992–4999. doi:10.1109/JSEN.2019.2903323
Xu, H.-C., Wang, S., and Miao, X.-G. (2017). Research of three-dimensional force sensor based on multiplexed fiber Bragg grating strain sensors. Opt. Eng. 56 (4), 047103. doi:10.1117/1.OE.56.4.047103
Yang, C., Tan, Y., Liu, Y., Xia, P., Cui, Y., and Zheng, B. (2022a). Modeling and optimization of laser cladding fixation process for optical fiber sensors in harsh environments. Sensors 22 (7), 22072569. doi:10.3390/s22072569
Yang, M., Liu, N. F., Li, N., Xu, C. B., Li, G. F., and Cao, M. M. (2022b). Failure characteristics and treatment measures of tunnels in expansive rock stratum. Front. Earth Sci. 10, 805378. doi:10.3389/feart.2021.805378
Yang, X., Pang, J., Lou, H., and Fan, L. (2015). Characteristics of in situ stress field at Qingshui coal mine. Int. J. Min. Sci. Technol. 25 (3), 497–501. doi:10.1016/j.ijmst.2015.03.026
Yu, F. M., Saito, O., and Okabe, Y. (2021). An ultrasonic visualization system using a fiber-optic Bragg grating sensor and its application to damage detection at a temperature of 1000 ◦C. Mech. Syst. Signal Process. 147, 107140. doi:10.1016/j.ymssp.2020.107140
Yun, D., Liu, Z., Cheng, W., Fan, Z., Wang, D., and Zhang, Y. (2017). Monitoring strata behavior due to multi-slicing top coal caving longwall mining in steeply dipping extra thick coal seam. Int. J. Min. Sci. Technol. 27 (1), 179–184. doi:10.1016/j.ijmst.2016.11.002
Zhang, N. B., Wang, J. D., Qin, K., Zhao, S. K., Yang, S. H., Deng, Z. G., et al. (2020). Evaluation of coal bump risk in excavation roadway based on multi-point stress and displacement monitoring system. J. Chin. Coal Soc. 32 (1), 140–149. doi:10.13225/j.cnki.jccs.2019.0952
Zhou, X. M., Wang, S., Li, X. L., Meng, J., Li, Z., Zhang, L., et al. (2022). Research on theory and technology of floor heave control in semicoal rock roadway: Taking longhu coal mine in Qitaihe mining area as an Example. Lithosphere 2022 (11), 3810988. doi:10.2113/2022/3810988
Keywords: coal mine roadway, surrounding-rock stress, fiber grating, cystic structure, borehole stress meter
Citation: Xie X, Fang X, Liu H, Xing X, Liang M, Wu G and Chen N (2023) Development and application of a borehole stress meter in rocks surrounding the roadway, based on optical-fiber sensing technology. Front. Earth Sci. 10:1122579. doi: 10.3389/feart.2022.1122579
Received: 13 December 2022; Accepted: 28 December 2022;
Published: 18 January 2023.
Edited by:
Xuelong Li, Shandong University of Science and Technology, ChinaReviewed by:
Dengfeng Su, Southwest University of Science and Technology, ChinaWang Ping, Hunan University of Science and Technology, China
Copyright © 2023 Xie, Fang, Liu, Xing, Liang, Wu and Chen. This is an open-access article distributed under the terms of the Creative Commons Attribution License (CC BY). The use, distribution or reproduction in other forums is permitted, provided the original author(s) and the copyright owner(s) are credited and that the original publication in this journal is cited, in accordance with accepted academic practice. No use, distribution or reproduction is permitted which does not comply with these terms.
*Correspondence: Hongyang Liu, sdustliuwork@sdust.edu.cn
 Xiaoping Xie1,2
 Hongyang Liu