 Zhiping Li1,2
 Yong Liu
95% of researchers rate our articles as excellent or good
Learn more about the work of our research integrity team to safeguard the quality of each article we publish.
Find out more
ORIGINAL RESEARCH article
Front. Earth Sci. , 10 January 2023
Sec. Environmental Informatics and Remote Sensing
Volume 10 - 2022 | https://doi.org/10.3389/feart.2022.1114421
This article is part of the Research Topic Advances and Applications of Non-Explosive Rock Fracturing in Exploitation of Geological Resources View all 5 articles
Ice abrasive jet technology is a green and environmentally friendly process with wide application prospects in the field of surface treatment. Ice abrasive jets constitute an essential technical parameter of the process, and temperature affects the hardness of ice. Therefore, in this paper, we investigated the hardness of ice at different temperatures. The dynamic characteristics of ice at different temperatures were simulated using molecular dynamics methods, and the laws of the dynamic characteristics of ice with temperature were analysed. Hardness testing experiments were carried out to grade the hardness of ice and then linearly fitted the hardness versus temperature. The results show that as the temperature increased, the dynamic characteristics of ice changed correspondingly, and the intermolecular hydrogen bonds and van der Waals interactions of ice weakened. From a chemical perspective, with the increase in temperature the intermolecular force weakens, the lattice energy of the crystal decreases, the resistance required to destroy the crystal decreases, and the crystal exhibits low hardness. Temperature affects the hardness of ice by changing the strength of the intermolecular force. The experimentally measured ice hardness was classified into five classes, and the fit revealed a strong linear correlation between ice hardness and temperature. In this study, numerical simulations were performed and experimental results were analyzed to identify the effect of temperature on the hardness of ice by changing the force between ice molecules, which is crucial for improving the erosion efficiency of ice abrasive jets.
a. The hardness of ice is influenced by intermolecular forces.
b. Temperature affects the kinetic characteristics of ice.
c. Temperature affects the intermolecular forces and hydrogen bonding in ice.
d. The hardness of ice decreases with increasing temperature.
Abrasive jets are widely used in industries related to coal, petroleum, machining, and surface cleaning. With the development and increasing needs of these industries, the abrasive jet technology presents certain drawbacks. Abrasive jet operation requires a large amount of abrasive raw materials and, simultaneously, has high requirements for the treatment and recovery of abrasives. Therefore, experts worldwide actively searched for more economical and practical abrasives and positively developed environmentally friendly abrasive jets (Jerman et al., 2015). It was found that ice has a certain hardness under low-temperature conditions. Hence, ice abrasives are used instead of traditional abrasives; the ice abrasives melt into water and are discharged immediately after the operation, preventing the need for recycling of abrasives for disposal (Huang et al., 2021). Furthermore, ice abrasives can be continuously supplied.
Ice abrasive jet technology has wide development prospects in the fields of surface cleaning, descaling, and surface paint removal as a new green and environmentally friendly process. The first proposed ice abrasive jet technology is a patent on the use of ice abrasives for forming surfaces, which belongs to a type of sandblasting and paint-stripping method (Courts, 1955). It is based on the principle of abrasive jets, replacing traditional abrasives with ice particles, using the strength and hardness of ice abrasives to form a high-speed stream of ice abrasives driven by a high-speed fluid to erode and grind the surface of objects for cleaning, paint stripping, and rust removal. The properties of the abrasive determine the cutting quality and surface removal rate of the work piece material (Aydin et al., 2017; Sabarinathan et al., 2020; Zhao et al., 2021). Hardness, an inherent characteristic of abrasives, has a strong influence on the surface removal rate and erosion effect. Ice abrasives are the key to ice abrasive jet technology, and the temperature has a significant impact on the ice abrasives. The ice particles have different hardness at different temperatures and can achieve different erosion effects.
To investigate the influence of abrasive hardness on erosion effect, Liu Yong selected four types of abrasives with different hardness for erosion tests to study the effect of hardness on abrasive air jet erosion (Ranjith et al., 2019). The experimental results showed that the erosion depth and volume increased with the increase in abrasive hardness, indicating that the higher the abrasive hardness, the better the erosion effect. Fowler et al. (2009) selected different abrasive water jets to mill titanium alloys and found that the material surface removal rate increased with increasing abrasive hardness. Park et al. (2008) studied the effects of different abrasives on the polishing rate of nitrogen-doped Ge2Sb2Te5 (NGST) and found that abrasive hardness and crystal structure affect the magnitude of the polishing rate. Singh et al. (2020) removed material from the WC cladding by microdissection, and the cladding with the greatest wear resistance was found to have lower microhardness. Wang et al. (2020) selected two abrasives with different hardness, SiC and SiO2, to test the coating in wear tests and found a high wear resistance of the coating under the action of SiC with high hardness. Khan and Haque (2007) conducted a comparative analysis on the performance of garnet, alumina, and silicon carbide in the abrasive water jet processing of glass and found that the hard silicon carbide abrasive produced the maximum width of cut, followed by alumina and garnet. It is evident that hardness affects the erosion effect; ice is key to the ice particle jet, and its hardness is a key factor in the erosion effect.
Li and Duan (2009) proposed that the Mohs hardness of ice particles is between 2 and 4; it first increases and subsequently decreases with a decrease in the temperature, and again increases above −90°C. The Mohs hardness of ice particles attains a value of 4 at approximately −100°C and finally, remains unchanged. However, other researchers proposed that the Mohs hardness of ice particles decreases significantly on increasing the temperature from −90 to 0°C, and attains a value greater than 4 below −40°C (Mitsutaka et al., 2016). Although some researchers have proposed an intrinsic link between the hardness of ice and temperature, there are errors in the perception of hardness of ice particles: unclear reasons regarding how temperature affects the hardness of ice particles, the unclear relationship between them, and simplistic methods for dividing the hardness of ice particles, which impose certain limitations on improving the erosion efficiency of ice particle jets.
Hardness, as a fundamental property of solids, is a complex macroscopic physical quantity related to the internal structure of a substance. Hardness refers to the strength of the bond between the molecules of a crystal; the more stable the intermolecular structure, the stronger the bond, the greater the resistance required to destroy the crystal, the greater the lattice energy exhibited, and the greater the hardness exhibited by the crystal; if the bond between the molecules is weaker, the lower the hardness exhibited by the crystal. Ice is a colorless, transparent solid whose intermolecular interactions include van der Waals forces and hydrogen bonds. The stronger the two interactions, the stronger the intermolecular bonds. The hardness of crystals can be defined from the analysis of the internal structure of molecules, and some researchers have reported that the hardness of crystals is determined by the strength of all chemical bonds per unit area from the perspective of chemical bonding, thus defining the hardness of substances based on the chemical bonding theory (Gao et al., 2003; Xu et al., 2015; Yang et al., 2017). Ice molecules interact with each other via hydrogen bonds and van der Waals forces, where hydrogen bonds are formed by stronger intramolecular polarization rather than van der Waals forces, and the strength of the action of both is affected by temperature.
In this study, an experimental research was undertaken to clarify the law and effect of temperature variation on the hardness of ice abrasives and to classify the hardness of ice abrasives in more detail, and the GROMACS molecular dynamics simulation was used to numerically analyze the distribution of the regular pattern of van der Waals forces and hydrogen bonds in ice under different temperature conditions and to evaluate the effect of van der Waals forces and hydrogen bonds on the intermolecular interactions in ice.
In this study, the molecular dynamics (MD) simulation method was adopted to simulate the kinetic characteristics of ice under different temperature conditions, analyze the variation law of the intermolecular structure of ice with temperature, and evaluate the variation law of hardness of ice with temperature from the perspective of chemical hardness. The TIP4P/Ice model was selected for the numerical simulations, which is a typical four-water point water model. The TIP4P model is compared with the conventional three-point water model, which adds a virtual atomic point M near the angle bisector O of the original three-point H-O-H model. Espinosa et al. (2016) used the TIP4P/Ice model to simulate homogeneous water nucleation and found that the model exhibited the best simulated water nucleation rate. The TIP4P/Ice model can emulate the overall phase diagram of ice with different densities, which can reconstruct the solid phase of ice. It is a water model that is specially designed to describe a range of properties of ice (Abascal et al., 2005).
Under different conditions, liquid water and water vapor form ice crystals with various structures. In nature, there are two forms of ice polycrystals: ordinary hexagonal ice (ice Ih) and cubic ice (ice Ic), both of which are molecular crystals with intermolecular forces including hydrogen bonds and van der Waals forces; and the transition from ice Ic to ice Ih occurs at approximately 185–190 K (Celli et al., 2020). As a result, the ice structure selected for the numerical simulation in this study was limited to 188 K. The ice Ih-type was used for the numerical simulation at temperatures greater than 188 K, while the ice Ic-type was used for the simulation at temperatures below 188 K. The ice model used for the simulation is illustrated in Figure 1.
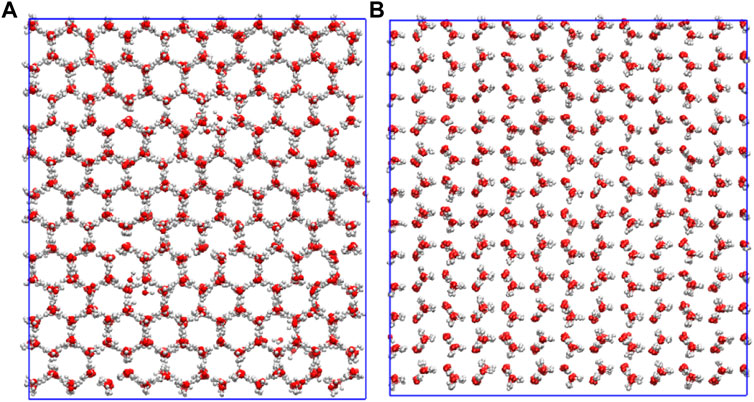
FIGURE 1. Ice model used for MD simulation [(A): ice Ih-type; (B): ice Ic-type].
The MD simulations were performed using the GROMACS 2020.4 software package (Hess et al., 2008; Habasaki et al., 2017), and a 4 nm × 4 nm × 4 nm cubic simulation box was first established. The TIP4P-ICE model was selected to fill the entire simulation box, and the total number of water molecules in the simulation process was 2,250. The control equations used in the simulations are as follows:
where N denotes the number of atoms in the system,
The OPLS-AA force field designed by Doherty et al. (2017) was used to deal with intermolecular interaction forces, and the system used the NVT system synthesis, i.e., the number of particles N, the volume V and the temperature T of the system are kept constant (Fraternali, 1990). Furthermore, the system temperature is controlled by the nose-hoover method, which is based on statistical mechanics and is able to simulate real physical effects, the system pressure is controlled by the Parrinello-Rahman homogeneous pressure control method, which simulates the variable size and shape of a single cell (Saito et al., 2003; Podio-Guidugli, 2010), PME algorithm for electrostatic interaction force calculation, Coulomb cut-off radius of 1 nm (Kholmurodov et al., 2000), and van der Waals cut-off radius of 1.2 nm. The total calculation time was 20 ns, and the time step of the simulation was 2 fs. The coordinate data were saved every 5 ps, and the data from the last 10 ns were used for the analysis to ensure the equilibrium of the system.
In this study, kinetic simulations of ice were performed at nine temperature conditions (153, 163, 173, 183, 193, 203, 213, 233, and 253 K). The hardness reflects the strength of the interparticle bonds of a crystal and it depends on the internal structure of the substance. The strength of the chemical bonding of a substance affects the hardness of the material with the same structure. Consequently, this study analyzed the law of the temperature dependence of ice hardness by analyzing the law of the temperature dependence of hydrogen bonding and van der Waals interactions between the ice molecules.
MD simulations can provide output parameters such as the hydrogen bond angle, van der Waals force, electrostatic force, and O-H radial distribution. The O-H radial and hydrogen bond angle distributions reflect the strength of hydrogen bonding. The data of the O-H radial distribution function, hydrogen bond angle, van der Waals force, and electrostatic force after 10 ns were used to analyze the variation law of intermolecular hydrogen bonding and van der Waals force with temperature, in turn evaluating the law of ice hardness variation with temperature.
The Mohs and Richter Hardness Scales were used to measure the hardness of ice at different temperatures. The Mohs hardness scale measurement principle uses the hardness plan engraving and scratch hardness test from low to high to observe if the measured sample plane has a scratch. If there is no scratch, the sample hardness is greater than that of the hardness tester, thereafter, the higher level of the hardness tester is tested, until the tester can scratch the plane of the sample and there is no difference between the hardness levels of the sample and the tester. Then the hardness of the sample is comparable to the value of the hardness tester.
The measurement range of the Mohs hardness is wide and the measured value is non-absolute. In this study, the Richter hardness scale was selected for the secondary measurement of hardness of ice based on the Mohs hardness classification. The Richter hardness measurement principle involves the use of an impact body with a certain mass to impact the surface of the ice specimen under the action of fixed impact/test force. The impact and rebound velocities at 1 mm from the impact body to the surface of the specimen were measured. Using electromagnetic principles, induction, and speed proportional to the voltage, the hardness value is calculated according to Eq. 4.
where HL is the hardness value on the Richter hardness scale, VB is the rebounding velocity of the impactor, and VA is the impact velocity of the impactor body. In this study, the Richter hardness measurement experiment was performed using a D-type universal impact device.
Hardness is one of the critical mechanical properties of solids, and it uses certain substances as standards; specifying their hardness from 1 to 10 constitutes the Mohs hardness. Using these standard substances to scratch the surface of the material, the degree to which the object resists external mechanical action to produce scratching is called scratching hardness. When a solid is scratched, the lattice is broken, and the greater the lattice energy, the greater the resistance required to scratch and the harder the crystal. In this study, a Mohs hardness scale was used to measure the hardness of ice by scratching ice specimens. The other equipment required for the experiment included a Richter hardness scale, a temperature sensor, and a mold for preparing ice cubes (Figure 2). Temperature sensors were used with 1.6 and .254 mm diameter thermocouple beads head respectively, and all thermocouples were sampled at 10 Hz using a data logger, with an error range of ±.5°C, all of which can meet the requirements for water freezing time and maintain the temperature inside the ice-forming cavity surface to determine the surface temperature of the ice. The temperature of the ice particles is monitored by a thermocouple, and the mold temperature is controlled by the liquid nitrogen flow rate. Liquid nitrogen flow rate controlled by solenoid flow meter and temperature sensor linkage, the error range of the solenoid flow meter is ±.5%, measurement range is 1.19–119.4 m3/h.
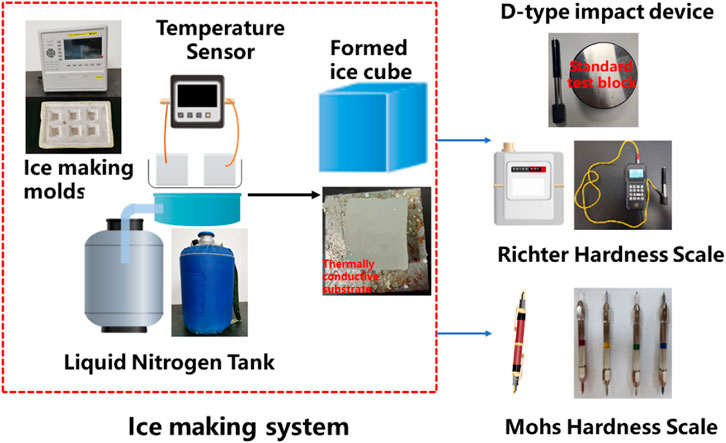
FIGURE 2. Experimental system diagram.
Based on the experimental requirements, the ice-making mold was placed in a liquid nitrogen environment, the temperature sensor was placed in the mold, and distilled water (prepared in advance and cooled to 20°C) was injected into the mold. The amount of liquid nitrogen was adjusted according to the temperature of the prepared ice. The size of the ice prepared by the mold was 4 cm × 4 cm × 2 cm (L × W × H), and the as-prepared ice cube is shown in Figure 3. The experimental scheme for hardness testing of the as-prepared ice cubes at different temperatures shown in Table 1.
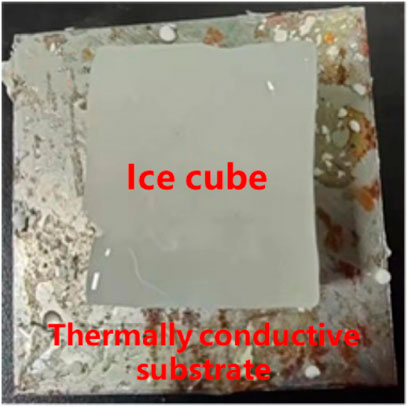
FIGURE 3. As-prepared complete ice cube sample.

TABLE 1. Experimental scheme.
Measuring the hardness of ice at different temperatures requires the preparation of ice at different temperatures. There are four existing methods of ice preparation: 1) the broken ice preparation, 2) the vacuum rapid cooling method, 3) direct contact refrigeration, and 4) subcooling dynamic icing methods. Ice prepared by the ice-breaking method is irregular in shape and the ice temperature is not easy to control, while that prepared by the vacuum rapid cooling method has serious bonding issues and poor practicality; ice prepared by direct contact refrigeration is prone to cracking and affects the hardness test results and that by the subcooling method has a low generation rate and high equipment requirements.
Thus, in this study, based on these methods, liquid nitrogen was used as the refrigerant, the method of indirect contact with the refrigerant was selected, and a square ice making mold with an expansion effect was used to prepare the ice (Figure 4). The liquid nitrogen flow rate controls the temperature of the formed ice, while the temperature sensor displays the temperature of the ice. The size of the square mold was 4 cm × 4 cm and the bottom was made of a steel plate with a size of 7 cm × 7 cm as the ice-forming substrate, having good thermal conductivity and a significant ice-forming effect. The physical parameters of the substrate used in this experiment are listed in Table 2. The ρ, λ and
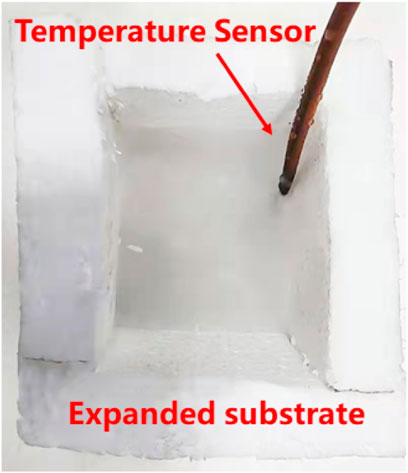
FIGURE 4. Expanding materials of water on conversion to ice.
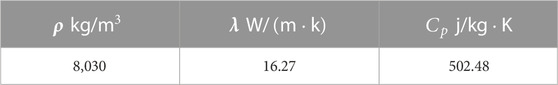
TABLE 2. Physical parameters of the substrate.
The hydrogen bond angle of a water molecule refers to the angle between the OH and the H linkages in one water molecule and the O linkage of neighboring water molecule. The structural diagram corresponding to the geometric criterion for hydrogen bond determination is shown in Figure 5, where β is the hydrogen bond angle, which can be calculated using Eq. 5.
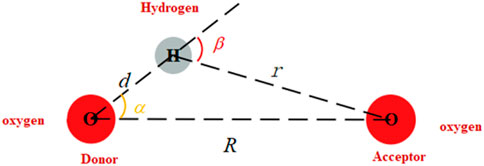
FIGURE 5. Structural diagram of the hydrogen bond judgment criteria.
The hydrogen bonding angle reflects the strength of the hydrogen bond (Hakala et al., 2006). The smaller the β value, the stronger the hydrogen bond. The probability distribution of the bond angles is approximately a normal distribution, and the sharpness of the distribution peak shape indicates the degree of concentration of the bond angle distribution. The probability distributions of the hydrogen bond angles at different temperatures are shown in Figure 6. It can be observed from the figure that the largest and sharpest peak occurred at a bond angle of 4.5°at T = 153 K with a probability of .128637, indicating that the hydrogen bond angle is mostly concentrated at approximately 4.5°. As the temperature increased, the peaks of the bond angle distribution decreased, peak position shifted to the right, probability distribution curve widened, and peak state tended to flatten, indicating that the angle of the bond angle concentration distribution increases with increasing temperature, and the angle of intermolecular hydrogen bonding becomes greater. The hydrogen bonding was weakened when β increased, which is consistent with previous literature (Yang et al., 2019).
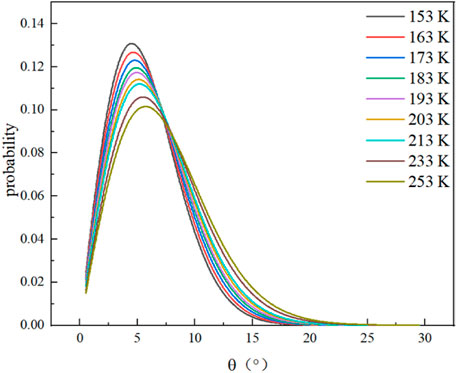
FIGURE 6. Probability distribution of hydrogen bond angles at different temperatures.
The radial distribution function (RDF) is a physical quantity that reflects the microstructural characteristics of the fluid. Each peak of the RDF represents a coordination shell of the reference particle, and the r value corresponding to the peak indicates the range of the coordination particles at the nearest distance from the target particle. The RDF is a description of the spherically localized distribution of other atoms around an atom and is expressed as shown in Eq. 6:
where N is the number of water molecules in the system,
Figure 7 shows the RDF of O-H at different temperatures. According to the definition of RDF, the r values corresponding to the first, second, and third peaks of gO-H(r) in Figure 7 characterize the distance of hydrogen and oxygen atoms between water molecules and the water molecules of their first, second, and third coordination circles. It can be observed from Figure 7 that there are differences in the peak and trough values of gO-H(r) under different temperature conditions. The gO-H(r) peak size represents the strength of hydrogen bonding; the larger the peak, the stronger the hydrogen bonding (Chialvo and Cummings, 1994).
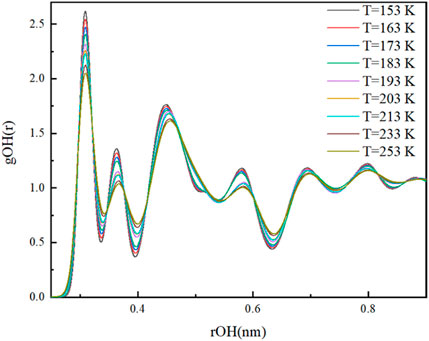
FIGURE 7. RDF of O-H at different temperatures.
At 153 K, the OH radial distribution function exhibited the first, second, and third peaks at r values of .308, .363, and .45 nm, indicating that the distances of O-H between the central and the nearest neighboring water molecule, and water molecules of second and third coordination circles at 153 K were .308, .363, and .45 nm, respectively. The first peak of the RDF of O-H appeared at r = .308 nm with peak values of 2.538, 2.465, 2.399, 2.321, 2.263, 2.228 at T = 163, 173, 183, 193, 203, and 213 K, respectively; when the temperature was increased to 233 and 253 K, the first peaks of the RDF of O-H were observed at r = .31 nm with peak values of 2.119 and 2.044 at 233 and 253 K, respectively. Experimental evidence of neutron diffraction showed that as the temperature increases, the first peak of the RDF of O-H decreases, the peak position shifted to the right, and the hydrogen bonding between the water molecules weakens (Bruni et al., 1996). From Figures 8A, B, it can be observed that the first and second peaks of the RDF of O-H gradually decreased and the peak position shifted to the right as the temperature increased, which is consistent with the previously reported neutron diffraction experimental results, indicating that the hydrogen bonding weakens when the temperature increases. Similarly, as shown in Figure 8C, the third peak changes in the same pattern as the first and second peaks.
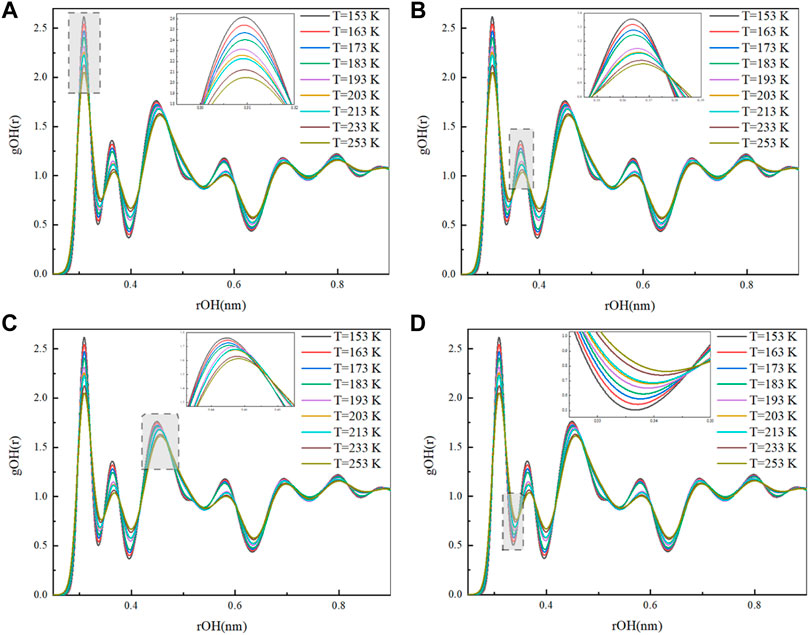
FIGURE 8. Peaks and valleys of the O-H radial distribution [(A): first peak; (B) second peak; (C) third peak; (D) first valley].
At 153 K, the RDF of O-H showed trough values at r = .337 and .396 nm, is .505 and .366, where the first trough value corresponds to the r value indicating the maximum distance of intermolecular oxygen-hydrogen formation of hydrogen bonds, and this distance is an important criterion to define and calculate the number of hydrogen bonds by geometric methods (Kalinichev and Bass, 1994). Figure 8D shows that the first valleys of the RDF of O-H at 163,173, 183,193, 203, 213, 233, and 253 K were .539, .574, .607, .65, .677, .684, .736, and .76, respectively. As the temperature increased, the value of O-H radial distribution valley increased and the maximum distance of intermolecular hydrogen-oxygen formation of hydrogen bonds also increased; the increase in O-H distance leads to the weakening of intermolecular hydrogen bonding and the decrease in the number of hydrogen bonds formed. Comprehensive analysis of the O-H radial and bond angle distributions under different temperature conditions showed that as the temperature increased, the movement between the water molecules intensified, the hydrogen-oxygen distance between the water molecules and the water molecules of their coordination circles increased, the network structure of hydrogen bonds was destroyed, and the hydrogen bonding between the water molecules weakened.
The intermolecular interactions of ice include hydrogen bonding and van der Waals forces, where the latter are the effects that exist between water molecules, and are different levels of electron correlation. The existence of van der Waals forces can lead to the coalescence of molecules under certain conditions, which is also the reason for water to exists in a multimeric state. The van der Waals forces arise from electrostatic interactions between molecules or atoms. To clarify the variation of intermolecular van der Waals interactions with temperature, this study analyzed the van der Waals forces and electrostatic forces under different temperature conditions. Figure 9 shows the variation of van der Waals and electrostatic forces at different temperatures.
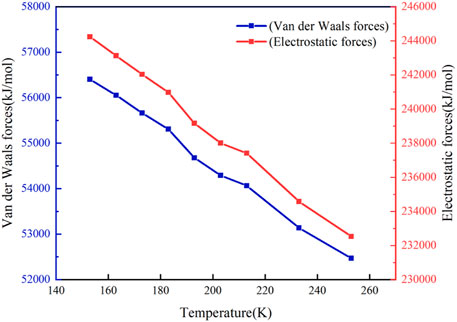
FIGURE 9. Van der Waals and electrostatic forces at different temperatures.
As shown in Figure 9, the van der Waals and electrostatic forces decreased with increasing temperature; at 153 K, the maximum of van der Waals and electrostatic forces were 56,402.34032 and 244,229.2604 kJ/mol, respectively. The consistent pattern of van der Waals and hydrogen-bonding interactions between ice molecules with temperature variation indicates that the intermolecular forces between ice molecules weaken as the temperature increases. The intermolecular forces affect the lattice energy of the molecules; the smaller the forces, the smaller the lattice energy, lesser the energy required to destroy the crystal, and lower the hardness of the crystal.
Ice specimens were prepared, at 163, 173, 183, 193, 203, 213, 223, 233, 243, 253, and 263 K and the hardness of ice at different temperatures was measured using a Mohs hardness scale, and the results are shown in Figure 10.
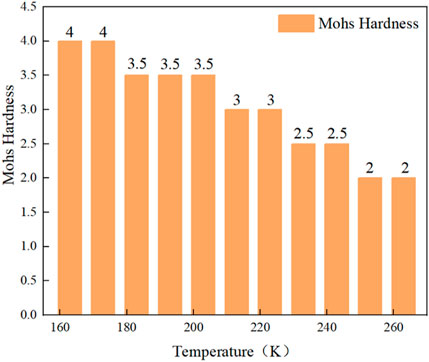
FIGURE 10. Mohs hardness of ice at different temperatures.
As presented in Figure 10, the ice hardness was 4 at 163 and 173 K, 3.5 at 183, 193, and 203 K, 3 at 213 and 223, 2.5 at 233 and 243 K, and 2 at 253 and 263 K. According to the measurement results, the ice hardness was subdivided into five levels based on the temperature interval, and the graph shows that the hardness of ice decreases with increasing temperature. Owing to the wide measurement range of Mohs hardness, the measurement results appeared similar to that of hardness of ice at different temperatures. To clearly evaluate the influence of temperature on ice hardness, this study measured the Richter hardness of ice at different temperatures on the basis of Mohs hardness classification. As shown in Table 3.
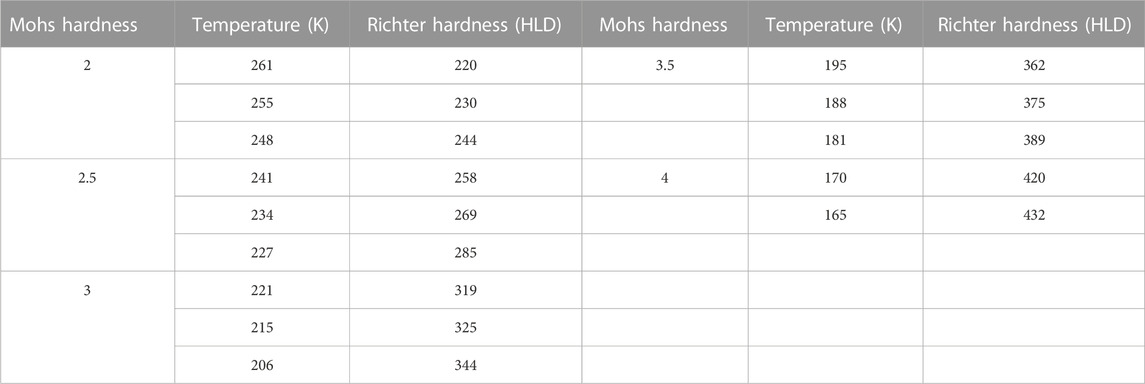
TABLE 3. Richter hardness of ice at different temperatures.
The linear fit of the temperature and Richter hardness is shown in Figure 11, which shows that the hardness of ice decreased with increasing temperature, and the hardness of ice was the maximum at 165 K. The linear fit of the temperature and hardness R2 was .99275, indicating a strong linear correlation between them.
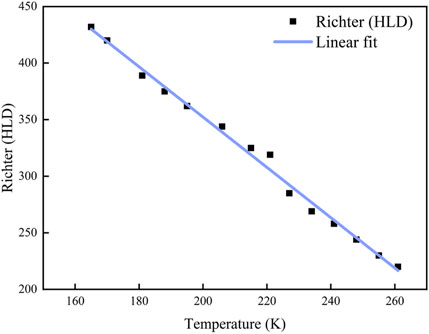
FIGURE 11. Linear fitting graph of Richter hardness as a function of temperature.
The results of the numerical analysis showed that the increase in temperature weakens the hydrogen bonding and van der Waals forces between the ice molecules, and the hardness test experimentally demonstrates that the hardness of ice decreases with increasing temperature and that there is a strong linear correlation between them. The combined numerical simulations and experimental results show that an increase in temperature weakens the forces between the ice molecules, which in turn affects the magnitude of ice hardness.
In this study, molecular dynamics (MD) simulations were used to numerically analyze the kinetic characteristics of water molecules at different temperatures and combined with experiments to clarify the effect of temperature on the hardness of ice, leading to the following conclusions.
(1) The intermolecular interactions of ice include hydrogen bonding and van der Waals forces, and whose interactions with ice were analyzed numerically. The results showed that the bond angle distribution curve between ice molecules widened, the distribution peak decreased, and the peak position shifted to the right with increase in temperature. The first peak of the O-H radial distribution appeared at r = .308 and .31 nm. With an increase in temperature, the peak values decreased, valley values increased, peak position shifted to the right, and distance between O-H increased. The intermolecular hydrogen bonding and van der Waals interaction between ice molecules weakened with increasing temperature. Numerical analysis showed that temperature affects the hardness of ice by influencing the structure of hydrogen bonds between ice molecules and the strength of van der Waals interactions, which in turn affects the magnitude of ice hardness.
(2) The Mohs hardness of ice was measured to be 4 at 163 and 173 K, 3.5 at 183, 193 and 203 K, 3 at 213 and 223 K, 2.5 at 233 and 243 K, and 2 at 253 and 263 K; the Richter hardness of ice at different temperatures was measured on the basis of Mohs hardness classification, and the linear fitting of hardness as a function of temperature was performed, and the linear fit R2 was found to be .99275; indicating a strong linear correlation between temperature and ice hardness.
This innovative study illustrates how temperature affects the hardness of ice abrasives and fits the relationship between temperature and ice abrasive hardness, demonstrating that temperature affects the interaction between ice molecules, which in turn affects its hardness system, providing a new idea for future efficient ice abrasive preparation and utilisation.
The original contributions presented in the study are included in the article/Supplementary Material, further inquiries can be directed to the corresponding author.
YL guided the article writing and reviewed and edited the article, ZPL completed the whole article, JPW made guidance on the experiments, and JJW instructed the numerical simulation part.
This study was jointly funded by the National Natural Science Foundation of China (52174170, 52174173, and 51974109), visiting scholar funded project of State Key Laboratory of Coal Mine Disaster Dynamics and Control (2011DA105287-FW202104), and Plan of Key Scientific Research Projects of Colleges and Universities in Henan Province (21A440002).
The authors declare that the research was conducted in the absence of any commercial or financial relationships that could be construed as a potential conflict of interest.
All claims expressed in this article are solely those of the authors and do not necessarily represent those of their affiliated organizations, or those of the publisher, the editors and the reviewers. Any product that may be evaluated in this article, or claim that may be made by its manufacturer, is not guaranteed or endorsed by the publisher.
The Supplementary Material for this article can be found online at: https://www.frontiersin.org/articles/10.3389/feart.2022.1114421/full#supplementary-material
Abascal, J. L., Sanz, E., Garcia, F. R., and Vega, C. (2005). A potential model for the study of ices and amorphous water: TIP4P/Ice. J. Chem. Phys. 122, 234511. doi:10.1063/1.1931662
Aydin, G., Kaya, S., and Karkurt, I. (2017). Utilization of solid-cutting waste of granite as an alternative abrasive in abrasive waterjet cutting of marble. J. Clean. Prod. 159, 241–247. doi:10.1016/j.jclepro.2017.04.173
Bruni, F., Ricci, M. A., and Soper, A. K. (1996). Unpredicted density dependence of hydrogen bonding in water found by neutron diffraction. Phys. Rev. B Condens. Matter 54, 11876–11879. doi:10.1103/PhysRevB.54.11876
Celli, M., Ulivi, L., and Del, R. L. (2020). Raman investigation of the ice-ic ice-ih transformation. J. Phys. Chem. C 124, 17135–17140. doi:10.1021/acs.jpcc.0c05136
Chialvo, A. A., and Cummings, P. T. (1994). Hydrogen bonding in supercritical water. J. Chem. Phys. 101, 4466–4469. doi:10.1063/1.467432
Courts, E. J. (1955). Means and methods for cleaning and polishing automobiles. US Patent no US2699403A.
Doherty, B., Zhong, X., and Acevedo, O. (2017). OPLS-AA force field parameters for ionic liquid molecular dynamic simulations. Abstr. Pap. Am. Chem. Soc. 254, 1. doi:10.1021/acs.jctc.7b00520
Espinosa, J. R., Navarro, C., Sanz, E., Valeriani, C., and Vega, C. (2016). On the time required to freeze water. J. Chem. Phys. 145, 211922. doi:10.1063/1.4965427
Fowler, G., Rashby, I. P., and Shipway, P. H. (2009). The effect of particle hardness and shape when abrasive water jet milling titanium alloy Ti6Al4V. Wear 266, 613–620. doi:10.1016/j.wear.2008.06.013
Fraternali, F. (1990). Restrained and unrestrained molecular dynamics simulations in the NVT ensemble of alamethicin. Biopolymers 30, 1083–1099. doi:10.1002/bip.360301109
Gao, F., He, J., Wu, E., Liu, S., Yu, D., and Li, D., (2003). Hardness of covalent crystals. Phys. Rev. Lett. 91, 015502. doi:10.1103/PhysRevLett.91.015502
Habasaki, J., Leon, C., and Ngai, K. L. (2017). Molecular dynamics simulations. Dynamics of glassy, crystalline and liquid ionic conductors: Experiments, theories, simulations. Berlin, Germany: Springer-Verlag, 355–414. doi:10.1007/978-3-319-42391-3-8
Hakala, M., Nygard, K., Manninen, S., Huotari, S., Buslaps, T., and Nilsson, A., (2006). Correlation of hydrogen bond lengths and angles in liquid water based on Compton scattering. J. Chem. Phys. 125, 084504. doi:10.1063/1.2273627
Hess, B., Kutzner, C., Van, D. S. D., and Lindahl, E. (2008). Gromacs 4: Algorithms for highly efficient, load-balanced, and scalable molecular simulation. J. Chem. Theory Comput. 4, 435–447. doi:10.1021/ct700301q
Huang, F., Mi, J. Y., Li, D., Wang, R., and Zhao, Z. (2021). Comparative investigation of the damage of coal subjected to pure water jets, ice abrasive water jets and conventional abrasive water jets. Powder Technol. 394, 909–925. doi:10.1016/j.powtec.2021.08.079
Jerman, M., Orbanic, H., Junkar, M., and Lebar, A. (2015). Thermal aspects of ice abrasive water jet technology. Adv. Mech. Eng. 7, 168781401559761. doi:10.1177/1687814015597619
Kalinichev, A. G., and Bass, J. D. (1994). Hydrogen bonding in supercritical water: A Monte Carlo simulation. Chem. Phys. Lett. 231, 301–307. doi:10.1016/0009-2614(94)01245-8
Khan, A. A., and Haque, M. M. (2007). Performance of different abrasive materials during abrasive water jet machining of glass. J. Mater. Process. Technol. 191, 404–407. doi:10.1016/j.jmatprotec.2007.03.071
Kholmurodov, K., Smith, W., Yasuoka, K., Darden, T., and Ebisuzaki, T. (2000). A smooth-particle mesh Ewald method for DL_POLY molecular dynamics simulation package on the Fujitsu VPP700. J. Comput. Chem. 21, 11872–11917. doi:10.1002/1096-987X(200010)21:13<1187:AID-JCC7>3.0
Li, D. Y., and Duan, X. (2009). Ice particle preparation technology in ice jets. J. Coal Sci. Eng. 34, 129–132.
Matsumoto, M., Yang, S., Martinsen, K., and Kainuma, Y. (2016). Trends and research challenges in remanufacturing. Int. J. Precis. Eng. Manufacturing-Green Technol. 3, 129–142. doi:10.1007/s40684-016-0016-4
Park, J. H., Clu, H., Yi, S. H., and Paik, U. (2008). Effect of abrasive material properties on polishing rate selectivity of nitrogen-doped Ge2Sb2Te5 to SiO2 film in chemical mechanical polishing. J. Mater. Res. 23, 3323–3329. doi:10.1557/JMR.2008.0397
Podio-Guidugli, P. (2010). On (Andersen-)Parrinello-Rahman molecular dynamics, the related metadynamics, and the use of the cauchy-born rule. J. Elast. 100, 145–153. doi:10.1007/s10659-010-9250-0
Ranjith, P. G., Liu, Y., Wei, J. P., and Liu, X. (2019). Effect of abrasive mass flow on the abrasive acceleration and erosion rates of abrasive gas jets. Rock Mech. Rock Eng. 52, 3085–3102. doi:10.1007/s00603-019-01746-3
Sabarinathan, P., Annamalai, V. E., and Rajkumar, K. (2020). Sustainable application of grinding wheel waste as abrasive for abrasive water jet machining process. J. Clean. Prod. 261, 121225. doi:10.1016/j.jclepro.2020.121225
Saito, H., Nagao, H., Nishikawa, K., and Kinugawa, K. (2003). Molecular collective dynamics in solid para-hydrogen and ortho-deuterium: The Parrinello-Rahman-type path integral centroid molecular dynamics approach. J. Chem. Phys. 119, 953–963. doi:10.1063/1.1578474
Singh, J., Thakur, L., and Angra, S. (2020). An investigation on the parameter optimization and abrasive wear behaviour of nanostructured WC-10Co-4Cr TIG weld cladding. Surf. Coatings Technol. 386, 125474. doi:10.1016/j.surfcoat.2020.125474
Wang, Q., Zhang, Y., Ding, X., Wang, S., and Ramachandran, C. S. (2020). Effect of WC grain size and abrasive type on the wear performance of HVOF-sprayed WC-20Cr3C2-7Ni coatings. Coatings 10, 660. doi:10.3390/coatings10070660
Xu, Y. H., Li, H., Hao, X. F., Chen, R. N., and Gao, F. M. (2015). First principles study on mechanical properties of superhard α-Ga boron. Chin. Phys. Lett. 32, 026101–026102. doi:10.1088/0256-307X/32/2/026101
Yang, J., Gao, F., and Liu, Y. S. (2017). Theoretical calculations of hardness and metallicity for multibond hexagonal 5d transition metal diborides with ReB2 structure. Chin. Phys. B 26, 106202–106357. doi:10.1088/1674-1056/26/10/106202
Yang, X., Cheng, K., and Jia, G. Z. (2019). The molecular dynamics simulation of hydrogen bonding in supercritical water. Phys. a-Statistical Mech. Its Appl. 516, 365–375. doi:10.1016/j.physa.2018.10.022
Keywords: ice abrasive, ice abrasive jet, ice hardness, molecular dynamics, surface cleaning
Citation: Li Z, Liu Y, Wei J and Wu J (2023) Molecular dynamics simulation and experimental study into effect of temperature on hardness of ice abrasives. Front. Earth Sci. 10:1114421. doi: 10.3389/feart.2022.1114421
Received: 02 December 2022; Accepted: 28 December 2022;
Published: 10 January 2023.
Edited by:
Fei Huang, Hunan University of Science and Technology, ChinaCopyright © 2023 Li, Liu, Wei and Wu. This is an open-access article distributed under the terms of the Creative Commons Attribution License (CC BY). The use, distribution or reproduction in other forums is permitted, provided the original author(s) and the copyright owner(s) are credited and that the original publication in this journal is cited, in accordance with accepted academic practice. No use, distribution or reproduction is permitted which does not comply with these terms.
*Correspondence: Yong Liu, eW9vbmxpdUBocHUuZWR1LmNu
Disclaimer: All claims expressed in this article are solely those of the authors and do not necessarily represent those of their affiliated organizations, or those of the publisher, the editors and the reviewers. Any product that may be evaluated in this article or claim that may be made by its manufacturer is not guaranteed or endorsed by the publisher.
Research integrity at Frontiers
Learn more about the work of our research integrity team to safeguard the quality of each article we publish.