 Taixun Liu
 Nadir Fawad
 Chao Li3
 Qazi Adnan Ahmad
95% of researchers rate our articles as excellent or good
Learn more about the work of our research integrity team to safeguard the quality of each article we publish.
Find out more
ORIGINAL RESEARCH article
Front. Earth Sci. , 05 January 2023
Sec. Solid Earth Geophysics
Volume 10 - 2022 | https://doi.org/10.3389/feart.2022.1108525
This article is part of the Research Topic Unconventional Hydrocarbon Resources Evaluation Through Geological, Geophysical and AI View all 9 articles
Introduction: Oilfield development’s primary objective has changed in recent years as a result of a deeper focus on oilfield exploration and possible reservoir oil extraction. These days, the distribution and characteristics of residual oil are hot topics.
Methodology: This research study provides a physical simulation of the remaining oil distribution in the third-order architectural unit in the beach reservoir. Based on the reservoir geometry and compositional sequence, the third-order architecture unit in a beach sand reservoir can be divided into three types: layered, plate-like, and trough-like architecture units.
Results and Discussion: A water-flooding simulation experiment is performed to find the distribution pattern of remaining oil (shortened as RO and used hereafter) and the controlling effect of the mudstone interlayer. The simulation results revealed that in the layered architecture unit with reverse-graded bedding, RO is mainly distributed between interlayers and accumulates at the bottom in fine-grain sands. The horizontal distribution of the mudstone interlayer has a profound effect on blocking the longitudinal migration of fluid. Second, in the plate-like architecture unit with uniform grain size, RO is mainly found in the middle portion of the model, separated by clay interlayers, with irregular presence of RO in the upper and lower part of the model. The oblique distribution of the clay interlayer has a significant effect on blocking the lateral migration of the fluid. Thirdly, in the trough-like architectural unit with normal-graded bedding, the RO is mainly distributed on top of the model in fine-grain sands and on the ridge-like parts formed by the interlayer’s intersection.
Conclusion: A trough-like clay interlayer can promote fluid movement. RO distribution patterns from the current experiment can be used to explore the remaining oil in beach sand reservoirs of similar oilfields.
In recent years, with the deepening of oil field development, potential tapping of RO in reservoirs has become the main goal of oilfield development (Feng et al., 2015; Yin et al., 2015; Zhao et al., 2016; Han et al., 2017). The characteristics of RO and its distribution are becoming a very hot issue these days. In later stages of field development, the water cut goes up to 90% in most of the regions. Revealing the RO formation mechanism and its distribution is of great significance (Xia et al., 2001; Ghazi and Mountney, 2009; Yue et al., 2013; Yan et al., 2014). RO distribution is dispersed due to long-term water injection, which has caused complications in tapping the potential of RO production. The pattern designed for the injection-production process and the difference in production pressure have great influence on RO. Microscopic pore-throat and wettability are not the only factors controlling the formation of remaining oil; other factors such as water drive rate and water flooding have great influence on it. Therefore, the study of reservoir architectures provides an effective means for understanding reservoir heterogeneity and RO distribution (Li et al., 2006; Yan et al., 2008; Jia, 2009; Munawar et al., 201810; Yue et al., 2012; Feng et al., 2014). Many scholars have studied the terrestrial reservoirs, especially the fluvial and deltaic facies (Su et al., 2009; Li et al., 2010; Xue and Cheng, 2010; Meng et al., 2012; Ming et al., 2012), and have broadened our understanding of terrestrial reservoirs. Reservoirs of beach facies are one of the main and important types of sandstone reservoirs in China, but there are relatively few physical simulation studies to probe the RO distribution and its control on architectural units in these reservoirs (Qi et al., 2013). Beach reservoirs are categorized into seven orders of reservoir architectural units. Based on the characteristics of different hierarchical architecture units and their controlling effect on reservoir development, secondary and tertiary architecture units are studied in reservoir development. Physical simulation methods have been used by many researchers for analyzing the sedimentary characteristics and scrutinizing the RO distribution (Rhome and Ryan, 2009; Qi et al., 2013; Andredaki et al., 2014; Li et al., 2017; Sun et al., 2017; Yue et al., 2018). In this study, physical simulation experiments of water flooding are carried out in the third-order architecture units of beach facies. After the experiment is designed, the water-flooding reservoirs can be simulated in a physical model of sand bodies through the development process. Previously proposed ideas of simulation experiments were carried out for the first time in the layered reservoir architecture, plate-like reservoir architecture, and trough like reservoir architecture, and trough-like reservoir architecture were carried out for the first time. Based on the resistivity data and images collected during the experiment, the controlling factors of the third-order architecture units on RO distribution are discussed. The remaining oil distribution patterns obtained in this experiment can guide potential tapping of remaining oil in the similar beach reservoirs.
On the basis of the similarity principle, the size and experimental conditions of the sand filling model of the beach facies reservoir are determined (Rhome and Ryan, 2009; Qi et al., 2013; Qi et al., 2013; Andredaki et al., 2014; Li et al., 2017; Sun et al., 2017; Yue et al., 2018). A simulation program is designed for a water-flooding experiment, and the movement of injections is observed (Brunel et al., 2014; Congjun et al., 2014; Yin et al., 2016; Gallicchio et al., 2017). Changes in resistivity values are measured during the water-flooding process by employing the electrode in the physical simulation model (Feng et al., 2015; Yin et al., 2015; Zhao et al., 2016; Han et al., 2017). First, the low-frequency rectangular wave alternating current is supplied through the power supply electrode. After establishing an electric field in the stratum, a pair of measuring electrodes is employed to measure a potential difference and calculate the resistivity (R = K·ΔU/I: K is the coefficient of the electrode system and I is the power supply current). The resistivity data in the experiment are recorded in real time to restore the oil saturation, and further RO is evaluated by oil recovery and oil saturation at different locations.
The experimental program includes three steps: Initially, a sand-body model with defined reservoir architecture and heterogeneity is prepared. The oil is then injected into the model to simulate the petroleum accumulation and the initial saturation of the oil state, and finally, the water-flooding experiment is pursued. The experimental oil is mixed with Andinlai lubricating oil, diesel oil, and red dye. The density and viscosity of the experimental oil are similar to those in the actual formation, which are about .84 g/cm3 and 2.93 mPa.s, respectively. The injected water is made up of distilled water and sodium chloride, whose salinity is about 9,000 mg/L and whose viscosity is .26 mPa.s. For considering the safety and accuracy of experiment, the speed of water injection is kept at 2 ml/min in the simulation process. The experiment is carried out by unilateral water injection (water injection on the left and oil recovery on the right). When the water content reaches 98%, the experiment is stopped. During the experiment, the drainage volume, the oil discharge volume, and the resistivity of each measuring point are recorded after every 1 h, and the experiment phenomena are photographed. Finally, the influence of reservoir architecture on the formation and distribution of remaining oil is analyzed through the change in oil saturation at different probe locations.
Investigation of the beach sand facies reservoir in the outcrops area of the Xiaohaizi at Bachu, Xinjiang, and analysis of the seven cored wells in Donghe Sandstone Reservoir of HD4 Oilfield in Tarim Basin revealed that there is reverse rhythmic feature in the layered reservoir architecture unit. Its grain size gradually varies from the siltstone to medium-grained sandstone. The internal lithology of the plate-like reservoir architecture unit is fine sandstone with uniform grain size. The internal lithology of the trough-like reservoir architecture unit varies from siltstone to medium- and fine-grained sandstone, and it has a positive rhythm (see Table 1). The study focuses on the physical simulation of RO distribution in plate-like, trough-like, and layered reservoir architecture units, aiming to scrutinize the controlling effect of the third-level architecture unit on RO distribution. The laboratory work was accomplished in the School of Geosciences and Petroleum Engineering lab at the China University of Petroleum, Qingdao.
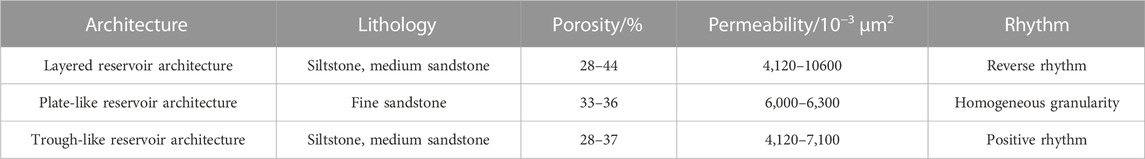
TABLE 1. Heterogeneity contrast in architecture pattern of beach sand reservoirs.
Further analysis and characteristics of the outcrop in the Donghe sandstone of the HD4 oilfield show that the lithology of layer interface is mainly mudstone or silty mudstone (Figure 1), which show notable differences in the weathering of the outcrop and possess a clear reservoir’s structural characteristics in beach sand facies (Figure 1). The architecture of layered reservoirs is more common in backshore dams, beach sand shoals, channels, tidal flats, and other depositional facies (Fan et al., 2014; Pan et al., 2015; Zahid et al., 2021; Fawad et al., 2022; Peter et al., 2017). Due to the difference in origin, the thickness of a single layer and the number of interlayers is different. The architecture of a plate-like reservoir is mostly developed in shoreface bottom sand, shoreface top sand, and other lithofacies (Figure 1). The thickness of the single layer is generally less, and the interlayer is relatively developed. The outcrop’s observation shows that the configuration of the groove-shaped reservoir is weathered with a series of upward curved openings, and these groove-shaped configuration features are quite clear (Figure 1). Furthermore, the configuration is mostly developed in dune grooves, backshore shallow grooves, and other lithofacies.
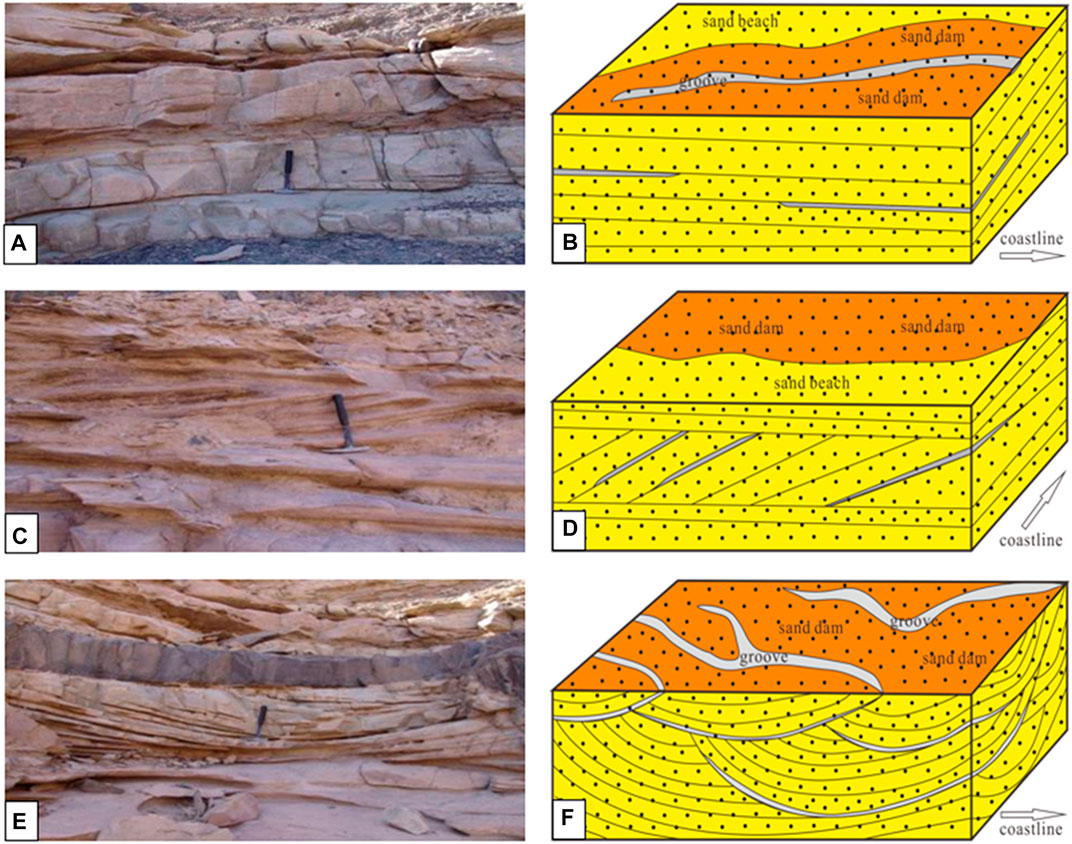
FIGURE 1. Outcrop and conceptual model of three types of reservoir architecture units in beach sand facies, (A) layered outcrop, (B) layered conceptual model, (C) plate-like outcrop, (D) plate-like conceptual model, (E) trough-like outcrop, and (F) trough-like conceptual model.
In this study, three sandbox models for water-flooding simulation experiments are designed (Figure 2). When the sand is filled, the mold lays flat, preventing sand from falling off. The size of the three-dimensional mold is 72 cm × 30 cm × 5 cm. When the sand filling is complete, sealing glass is placed on the mold. The mold is turned upright and fixed. In the simulation experiment, we use 35 mesh, 55 mesh, 65 mesh, 100 mesh, and 180 mesh quartz sand, which simulate the internal rhythm of the architecture layers, and quartz powder (mud), which simulates the seepage barrier in the architectural layers. Considering the operability of the experiment, the grain size of the experimental model is divided into four levels (Table 2). Although the grain size is not gradual, to some extent, it causes an effect similar to that of gradual sand due to water flooding.
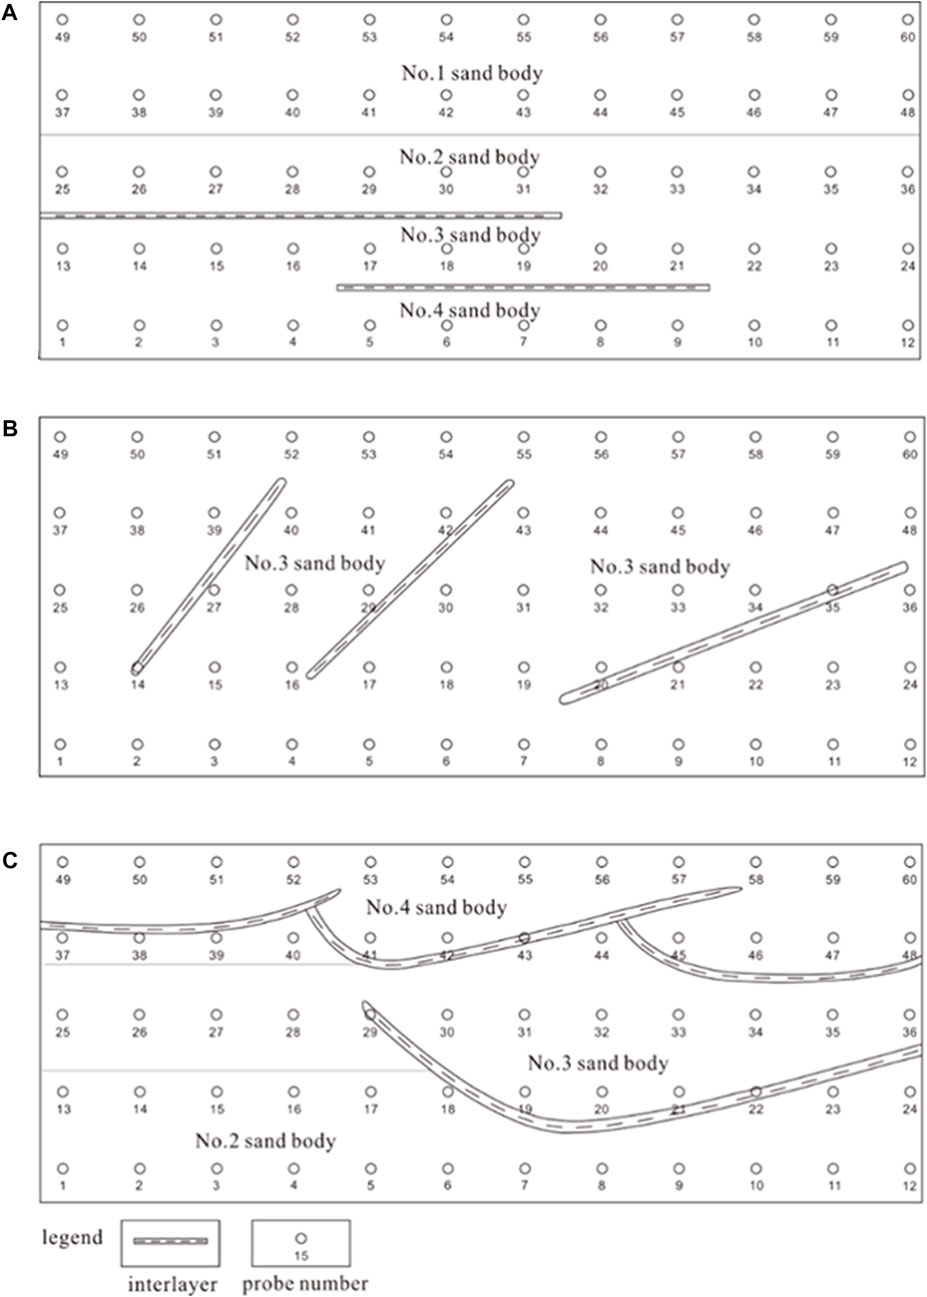
FIGURE 2. Experimental model of three types of reservoir architecture units: (A) layered architecture in parallel-bedded sandstone, (B) plate-like architecture in cross-bedded sandstone, and (C) trough-like architecture in trough cross-bedded sandstone.
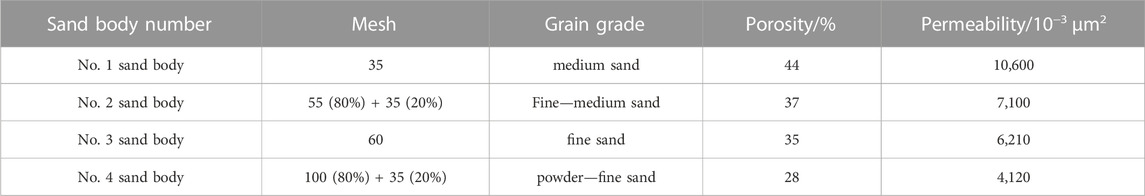
TABLE 2. Grain sizes use in experimental model.
The experiment mainly includes the following two stages: 1) oil is saturated at a flow rate of 2 ml/min; 2) water flooding is managed at a flow rate of 1 ml/min. The detailed experimental steps include designing of the proposed experimental model and loading different sizes of quartz sand into a pre-designed model. In the second step, the sealing glass is left on the model frame after filling out the experimental model. All bolts and nuts are installed on the glass, after checking the instrument parts and processing the piping correctly. In the third step, we opened 10 injection-production mouths (the left side comprises injection, whereas production lies at the right side). The fourth step, injection into oil, takes place at a flow rate of 2 ml/min until the resistance and oil production rate are stable; then, the amount of oil injection is recorded. In last step, brine was injected at a flow rate of 1 ml/min until no more oil was coming out; then. we recorded the amount of oil production and stopped the experiment. At the same time, we recorded the data at each measurement point, observed the changes during the experiment, took all photos at the right time, and then processed the experimental data.
Based on the analysis of the experimental phenomena and the variation of oil saturation (shortened as OS and used hereafter), RO distribution patterns in the layered, plate-like, and trough-like reservoir architecture units are summarized. The controlling effects of the reservoir architecture units on RO distribution are analyzed.
The duration of the three experiments was slightly different, ranging from 44 to 46 h. The changing curves of water content in each experimental stage are shown in Figure 3A. Overall, the water content increased rapidly in the early stages. For up to 12 h, the rising speed of stage water content was at the peak and then declined at an increasing rate. Until 28 h, the stage water content was up to 90%. The stage moisture content was maintained at a high level until the end of the experiment. The degree of recovery at each stage can be calculated on the basis of recorded experimental data. The recovery curve is drawn, and the final recovery of the three experiments is 68.24%, 55.45%, and 48.65%, respectively (Figure 3B).
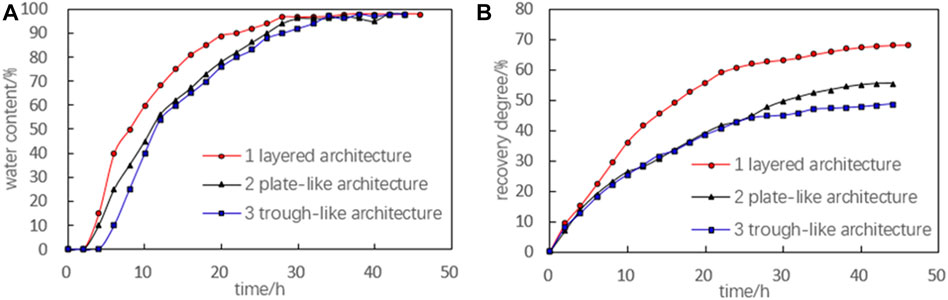
FIGURE 3. Fluid characteristic curves of water-flooding experiment in three architecture units: (A) shows the distribution of water contents, and (B) shows the recovery degree with the passage of time.
The first experiment simulates the controlling effect of the layered reservoir architecture unit on RO, and the sand-body model has reverse-graded bedding. In the initial stage of the water drive process, the sand body is full of oil, and the OS is between 93% and 100% (Figure 4). During 0–10 h of water injection, the displacement at the top of the model is significant; displacement is also seen in other parts. By 10 h, the OS at the top of the model is between 24% and 36%, and at other locations, it drops below 80%. During 10–20 h of water injection, the injected water moves downward from top to bottom under the action of gravity, and the OS further decreases in this stage. After 20 h of water injection, the OS in a model is reduced to less than 75%. In the period of 20–30 h of water injection, the injected water continues to move downward under the action of gravity. Later on, when 30 h of water injection have passed, the OS of the upper part of the model is reduced to less than 55%, while it is still higher at the bottom. During the interval of 30–40 h of water injection, the oil in the upper part of the model was further replaced. On the other hand, the OS is decreased to less than 30% after the passage of 40 h of water injection. On the oil saturation distribution map, the upper part of the model is represented by blue, showing lower OS values. Finally, at the end of 40–46 h of water injection, the oil in the model is further displaced, and the experiment is finished after 46 h. At this time, the OS of the upper part of the model is about 5%, while at the bottom, it is around 58%. To sum up, under the joint action of sand body characteristics with reverse grain sequence and horizontal distribution of the interlayer, the oil is displaced at any part in any time by using one side of water injection. However, the degree of displacement of each side is different because at the top, grain size varies and contains coarse-grained sand, and due to good sorting, it shows good petrophysical properties. As a result, the oil is displaced efficiently at the top. Secondly, due to the influence of gravity, the upper part of the water gradually moves downward, increasing the OS efficiency and degree of displacement simultaneously at the lower part. But the horizontal interlayer hinders the downward displacement of water injection, and the sand body in the lower part of the model contains fine-grained size and shows poor petrophysical properties. As a consequence, the oil displacement efficiency and the final recovery are low in the lower part of the model. Finally, the RO is distributed between the interlayers in the lower part of the model, specifically in fine-grained sand.
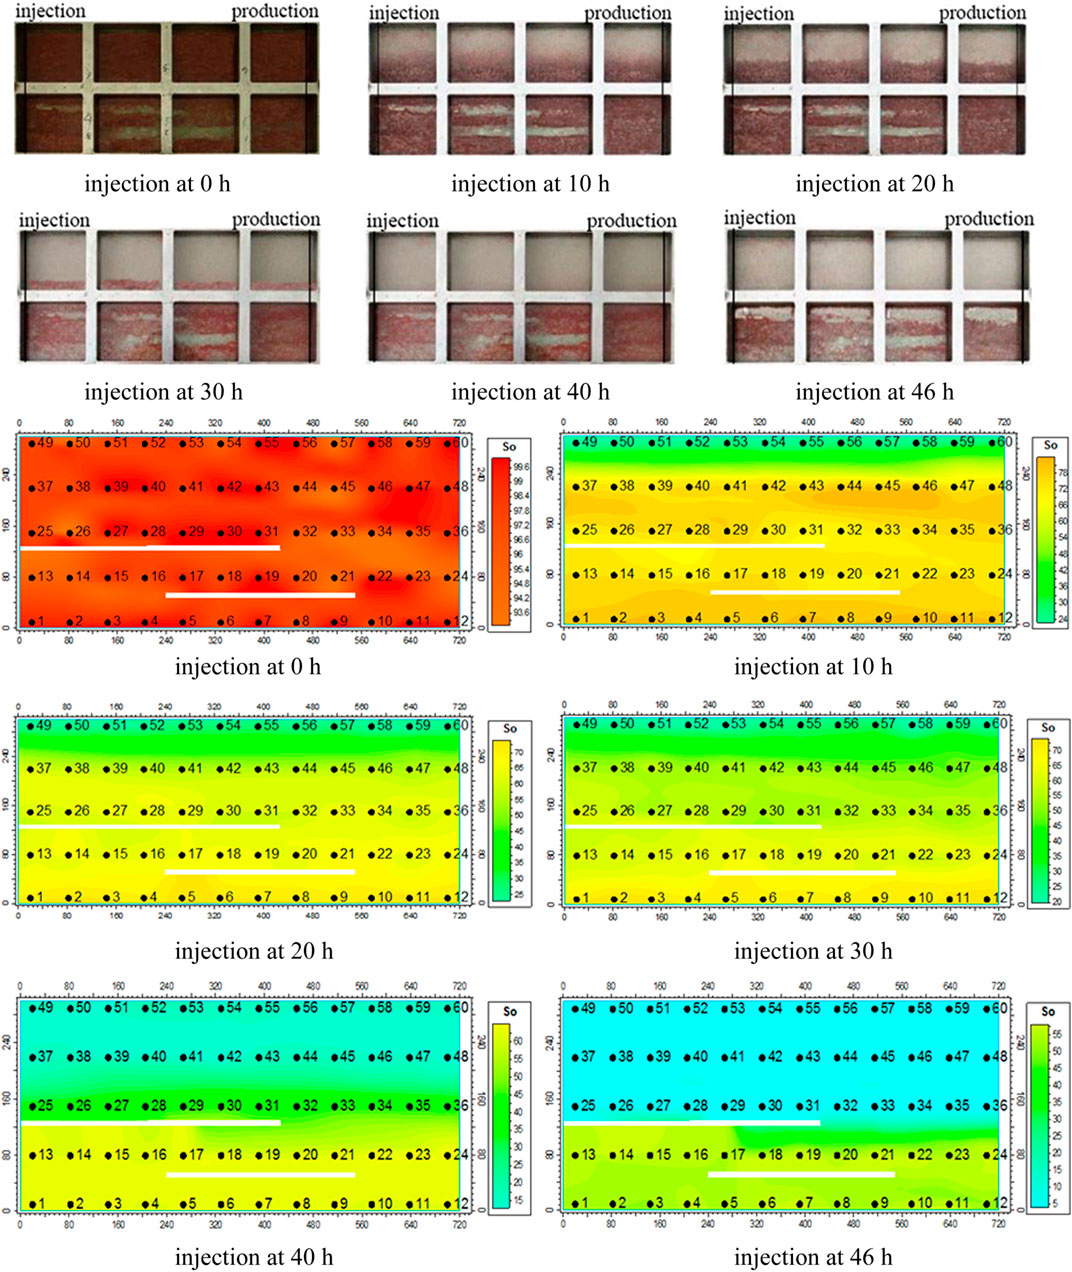
FIGURE 4. Experimental phenomenon and oil saturation distribution in layered reservoir architecture units.
The second experiment simulates the controlling effect of the plate-like reservoir architecture unit on the RO. The experimental mold is filled with fine quartz sand. In the initial state of the water-flooding experiment, the inside of the sand body is saturated with oil, and the OS is between 94% and 100% (Figure 5). During 0–10 h of water injection, the displacement at the top and bottom of the model was quite clear, and the water-flooding efficiency in the middle of the model was very low. By 10 h, the OS at the top of the model was between 62% and 80%, while at the center of the model, OS was above 90%, and at the bottom of the model, OS was recorded between 62% and 70%. At the end of 10–20 h of water injection, displacement occurs in all parts of the model, but significant displacement is seen at the bottom and top of the model. After 20 h of flooding, the OS at the top of the model was between 33% and 70%, whereas in the middle of the model, OS was monitored between 85% and 92%. But at the bottom of the model, OS was noticed in the range of 33%–45%. During the interval of 20–30 h of water injection, the OS in the middle is slightly declining. After 30 h of water injection, the OS at the top of the model was recorded between 27% and 68%, but in the middle of the model, the OS was observed at 85% and 90%, respectively. At the bottom of the model, OS was lower and noted between 27% and 40%. During the 30–40 h of water injection, the OS in the middle is also slightly reduced. At the end of 40 h of water injection, the OS at the top of the model was lying between 21% and 66%, but on the contrary, it was between 82% and 87% at the middle portion of the model. As for the bottom of the model, OS values were approximately between 21% and 35%. During 40–44 h of the experiment, almost no displacement occurred in the middle portion.

FIGURE 5. Experimental phenomenon and oil saturation distribution in plate-like reservoir architecture units.
Displacement was still visualized at the bottom and top of the model. After the completion of 44 h of water injection, the OS at the top of the model ranged between 18% and 63%. On the other hand, fluctuations in the OS values were found in the range of 82%–87% in the middle portion. However, these values ranged from 18% to 35% at the lowest portion of the model. Oil is displaced at any part in any time using one side of water injection. However, the effectiveness of displacement is different at each site due to sand body characteristics, uniform grain size, and the distribution of the incline interlayer. The oil on the top and bottom of the model is favorably displaced, and the efficiency of displacement at the bottom is higher than at that at the top. Due to the obstruction of the inclined interlayer, the movement of the injected water is impeded, and as a result, the oil displacement efficiency in the center of the model is very low. Finally, the RO mainly resides in the middle part of the model, separated by the clay interlayers, with sporadic remaining oil at the bottom and top of the model.
The third experiment simulates the controlling effect of the trough-like reservoir architecture unit on the RO. The sand body model has a positive grain sequence. In the initial state of the water-flooding process, the interior of the sand body is basically saturated with oil, and the OS is between 95% and 100% (Figure 6). During 0–10 h of water injection, water flooding mainly occurs at the bottom of the trough-shaped model, and there is almost no displacement in other parts. Until 10 h, the OS at the bottom of the model is between 15% and 70%, and it is above 90% in other portions. During 10–20 h of water injection, displacement was found in all parts. After 20 h of water injection, the OS at the bottom of the model was between 10% and 65%. At the location of the groove in the trough-like interlayer, the OS was as high as 95%, and in other parts, it was between 85% and 95%. During 20–30 h of water injection, the displacement in all parts was further encountered because of the shading of the upper interlayer at the measuring points, the location numbers of which are about 45, 46, and 47. In these locations, oil still cannot be displaced, and the OS is as high as 95%. At the end of 30 h of water injection, the OS at the bottom of the model is between 5% and 40%, and in other parts, it is varied between 45% and 95%. During the period of 30–40 h of water injection, the oil at measuring point locations No. 13–No. 18 and No. 25–No. 29 starts to be displaced. When the time interval for water injection reaches 40 h, the OS in these locations is between 5% and 45%. Because the injected water reflows in the semi-closed area, where the interlayer intersects, and as a consequence, OS at No. 13–No. 18 measuring point locations had dropped. Whereas, the OS in the middle and upper part of the model is fluctuated between 35% and 95%. During 40–44 h of water injection, the oil at No. 37–No. 40, No. 30–No. 36, and No. 19–No. 21 measuring point locations is effectively displaced. After 44 h of water injection, the OS in these locations is about 35%. The displacement in the upper part of the model is still experienced, and OS is further decreased. The OS in the upper part of the model is about 75%. In conclusion, sand body characteristics of positive grain sequence and trough-like distribution of the interlayer, the oil is effectively displaced at the bottom of the model with good petrophysical properties and no interlayer shelter by using one side of water injection. Secondly, the oil at No. 13–18 and No. 25–29 measuring points has been largely replaced. Finally, the oil at No. 37–40, No. 30–36 and No. 19–21 measuring point’s position is extensively replaced. During the entire experiment, the upper sand body of the model has the finest grain size and is subject to the gravity sinking effect of the injected water, and as a result, upper flooding efficiency is poor. Finally, the RO is mainly distributed in the location of the smallest grain size at the upper part of the model, in the ridge-like parts formed by the trough-like interlayer intersection (No. 40 and No. 44 measuring points positions), and in the groove part of the trough-like interlayer. There is sporadic remaining oil in other parts of the model.

FIGURE 6. Experimental phenomenon and oil saturation distribution in trough-like reservoir architecture units.
In the reservoir architecture model of the beach sand facies, three experimental models of sand filling with three main third-level architecture units are established. The difference in RO distribution in three architecture units is revealed through the water-flooding simulation experiment.
1) In the first case of a layered architecture unit, the sand body on top of the model is coarser and has good petrophysical properties; as a result, the oil in that part is displaced. Fine-grained sand at the lower part of the model has poor petrophysical properties. Second, the horizontally distributed interlayers impede the downward movement of injected water; the water-flooding efficiency of the sand body in the lower part of the model is low. As a result, RO is mainly distributed between interlayers in the lower part of the model and accumulated in fine-grained sand.
2) In the plate-like architectural unit with roughly uniform grain size, the difference in degree of displacement between different parts is drastically changed. The oil at the top and bottom of the model is displaced, and at the bottom, displacement efficiency is higher than that at the top. In the middle part of the model, the oil displacement efficiency is very low due to the obstruction effect of the interlayer’s inclined distribution on the injection flow. Finally, the remaining oil mostly resides in the middle position, separated by the clay interlayers, with sporadic distribution of remaining oil at the bottom and top of the model.
3) In the trough-like architecture unit with normal-graded bedding, the sand body at the bottom of the model is coarse-grained, which shows the good physical property that with no interlayer blocking, the oil in these parts is displaced preferentially. The sand body at the upper part of the model is fine-grained, showing poor physical properties with gravity sinking effect of injected water. The oil in these parts is displaced poorly. RO is enriched in the ridge-like parts formed by the trough-like interlayers’ intersection. The location at the groove part of trough-like interlayer has low displacement efficiency, which is also good for remaining oil enrichment. Hence, we can conclude that petrophysical properties, specifically permeability and gravity flow along with reverse and normal grading, have a direct influence on RO distribution. Medium- and coarse-grained sandstone possess good sorting, and therefore, it displays a good permeability value, which ultimately has an impact on the transformation of RO.
The original contributions presented in the study are included in the article/Supplementary Material; further inquiries can be directed to the corresponding authors.
TL supervised this project, reviewed the manuscript, and provided the necessary suggestions. NF wrote the manuscript and did formal analysis, editing, and reviewing; QA helped with formal analysis and manuscript editing; CL and HL helped with processing the data and formatting. RH and JX undertook the responsibility of arranging the data for this project and software. All authors contributed to the article and approved the submitted version.
This research was funded by the National Natural Science Foundation of China (grant no. 41772138) and (grant no. 41202090).
Authors RH and JX were employed by Linpan Oil Production Plant, Shengli Oil Field, Sinopec Branch.
Author CL was employed by Shaanxi Yanchang Petroleum (Group) Co., Ltd.
The remaining authors declare that the research was conducted in the absence of any commercial or financial relationships that could be construed as a potential conflict of interest.
All claims expressed in this article are solely those of the authors and do not necessarily represent those of their affiliated organizations, or those of the publisher, the editors, and the reviewers. Any product that may be evaluated in this article, or claim that may be made by its manufacturer, is not guaranteed or endorsed by the publisher.
Andredaki, M., Georgoulas, A., Hrissanthou, V., and Kotsovinos, N. (2014). Assessment of reservoir sedimentation effect on coastal erosion in the case of Nestos River, Greece. Int. J. Sediment Res. 29 (1), 34–48. doi:10.1016/s1001-6279(14)60020-2
Brunel, C., Certain, R., Sabatier, F., Robin, N., Barusseau, J., Aleman, N., et al. (2014). 20th century sediment budget trends on the Western Gulf of Lions shoreface (France): An application of an integrated method for the study of sediment coastal reservoirs. Geomorphology 204, 625–637. doi:10.1016/j.geomorph.2013.09.009
Congjun, F., Zhidong, B., Ling, Y., Xiong, S. I., Xu, G., and Han, X. (2014). Reservoir architecture and remaining oil distribution of deltaic front underwater distributary channel. Petroleum Explor. Dev. 41 (3), 358–364. doi:10.1016/s1876-3804(14)60040-9
Fan, D., Tu, J., Shang, S., and Cai, G. (2014). Characteristics of tidal-bore deposits and facies associations in the Qiantang Estuary, China. Mar. Geol. 348, 1–4.
Fawad, N., Liu, T., Fan, D., and Ahmad, Q. A. (2022). Sedimentary facies analysis of the third EoceneMember of shahejie formation in the bonan sag of bohai bay basin (China): Implications for facies Heterogeneities in sandstone reservoirs. Energies 15, 6168. doi:10.3390/en15176168
Feng, C., Bao, Z., Dai, C., et al. (2015). Superimposition patterns of underwater distributary channel sands in deltaic front and its control on remaining oil distribution:a case study from K1q4 in J19 block, Fuyu oilfield. Oil Gas Geol. 36 (01), 128–135.
Feng, C., Bao, Z., Yang, L., Si, X., Xu, G., and Han, X. (2014). Reservoir architecture and remaining oil distribution of deltaic front underwater distributary channel. Petroleum Explor. Dev. Online 41 (3), 358–364. doi:10.1016/s1876-3804(14)60040-9
Gallicchio, C., Micheli, A., and Pedrelli, L. (2017). Deep reservoir computing: A critical experimental analysis. Neurocomputing 268, 87–99. doi:10.1016/j.neucom.2016.12.089
Ghazi, S., and Mountney, N. P. (2009). Facies and architectural element analysis of a meandering fluvial succession: The Permian Warchha Sandstone, Salt Range, Pakistan. Sediment. Geol. 221 (1), 99–126. doi:10.1016/j.sedgeo.2009.08.002
Han, X., Yan, G., and Liu, Z. (2017). Movement law of oil and water on the delta front based on single genetic sand body—taking the lower subsection of the second section of the dongying formation in the Z oilfield of the bohai bay basin as an example. Oil Gas Geol. 38 (02), 241–247.
Jia, Q. (2009). Micro-physical simulation experiment of remaining oil constrained by flow unit [J]. Petroleum Geol. Recovery Effic. 16 (03), 90–117.
Li, H., Liu, Q., and He, J. (2006). Physical simulation study on remaining oil microscopic distribution. Xinjiang Pet. Geol. (03), 351–353.
Li, J., Jiang, H., Wang, C., Zhao, Y., Gao, Y., Pei, Y., et al. (2017). Pore-scale investigation of microscopic remaining oil variation characteristics in water-wet sandstone using CT scanning. J. Nat. Gas Sci. Eng. 48, 36–45. doi:10.1016/j.jngse.2017.04.003
Li, Q., Yu, X., and Wang, Q. (2010). Study on flow unit of littoral facies reservoir in Lufeng 13-2 Oilfield. J. Oil Gas Technology (1), 170–173.
Meng, Q., Jiang, H., and Sun, Z. (2012). Architecture analysis of wave-controlled coastal reservoir. Science Technology Rev (26), 21–25.
Ming, L., Xu, H., and Jiang, T. (2012). Performance evaluation for littoral-facies clastic reservoir architecture. Petroleum Explor. Dev. Online 39 (6), 802–812.
Munawar, M., Lin, C., Chunmei, D., Zhang, X., Zhao, H., Xiao, S., et al. (2018). Architecture and reservoir quality of low-permeable Eocene lacustrine turbidite sandstone from the Dongying Depression, East China. Open Geosci. 10 (1), 87–112. doi:10.1515/geo-2018-0008
Pan, T. Y., Lin, A. T. S., and Chip, W. R. (2015). Paleoenvironments of the evolving Pliocene to early Pleistocene foreland basin in northwestern Taiwan: An example from the Dahan River section. Isl. Arc 24, 317–341. doi:10.1111/iar.12113
Peter, C., Sacchi, Q., Serazio, C., and Verga, F. (2017). Capturing channelized reservoir connectivity uncertainty with amalgamation curves. Mar. Petroleum Geol. 88, 329–342. doi:10.1016/j.marpetgeo.2017.07.017
Qi, T., Yang, Z., and Liu, X. (2013). Study on similarity theory of physical simulation of water flooding in flat model. Sci. Technol. Eng. 13 (9), 2478–2482.
Su, L., Ning, Z., and Cheng, L. (2009). Remaining oil distribution patterns of littoral facies sandstone reservoir with bottom water during mid-later stage. Complex Hydrocarb. Reserv. (1), 35–37.
Sun, H., Zhao, Y., and Yao, J. (2017). Micro-distribution and mechanical characteristics analysis of remaining oil. Petroleum 3 (4), 483–488. doi:10.1016/j.petlm.2017.03.005
Xia, B., Zhou, Z., and Sun, X. (2001). Influencing factors and types of remaining oil in S2x reservoir in Pucheng Oilfield. Oil Gas Geol. (04), 385–387.
Xue, Y., and Cheng, L. (2010). Study on main factors controlling remaining oil distribution in shore sandstone-bottom water reservoirs of mature stage-case study of NH25 reservoir. Petroleum Geol. Recovery Effic. 17 (6), 78–81.
Yan, B., Ma, S., and Wang, L. (2008). The formation and distribution of residual oil in meander point bar by physical modeling. Earth Sci. Front. 15 (1), 65–70.
Yan, B., Zhang, J., et al. (2014). Point bar configuration and residual oil analysis based on core and dense well pattern. Petroleum Explor. Dev. 41 (5), 597–604.
Yang, Z., Liu, X., et al. (2013). Research on similarity theory of plate model water flooding physical simulation. Sci. Technol. Eng. 13 (9), 2478–2482.
Yin, S., Chen, G., Dai, C., et al. (2015). Reservoir architecture and remaining oil distribution in mouth bar—a case study on the braided delta of long·axis gentle slope in zaonan fault block of dagang oilfield. Oil Gas Geol. 36 (04), 630–639.
Yin, S., Hu, Z., Ren, X., Wu, X., Chen, Y., Zheng, L., et al. (2016). Reservoir architecture patterns of sandy gravel braided distributary channel: A case study of triassic upper karamay formation, Xinjiang oilfield. Petroleum 2 (2), 117–129. doi:10.1016/j.petlm.2016.02.003
Yue, D., Wu, S., and Wen, L. (2013). Physical simulation of remaining oil distribution controlled by reservoir architecture within point-bar of meandering river. China Sci. Pap. 8 (5), 473–476.
Yue, D., Zhao, J., and Wen, L. (2012). Physical simulation experiment of remaining oil distribution controlled by interlayer within braided bar of braided river reservoir. Earth Sci. Front. 19 (2), 157–161.
Yue, M., Zhu, W., Han, H., Song, H., Long, Y., and Lou, Y. (2018). Experimental research on remaining oil distribution and recovery performances after nano-micron polymer particles injection by direct visualization. Fuel 212, 506–514. doi:10.1016/j.fuel.2017.10.055
Zahid, M. L., Dong, C., Lin, C., Gluyas, J., Jones, T., Zhang, X., et al. (2021). Sequence stratigraphy, sedimentary facies and reservoir quality of Es4s, southern slope of Dongying Depression, Bohai Bay Basin, East China. Mar. Petroleum Geol. 77, 448–470. doi:10.1016/j.marpetgeo.2016.06.026
Keywords: beach sand reservoir, reservoir architecture, remaining oil distribution, physical simulation, geological exploration, petroleum geology, unconventional petroleum geology
Citation: Liu T, Fawad N, Li C, Li H, He R, Xu J and Ahmad QA (2023) Physical simulation of remaining oil distribution in the 3rd-order architecture unit in beach sand reservoir. Front. Earth Sci. 10:1108525. doi: 10.3389/feart.2022.1108525
Received: 26 November 2022; Accepted: 13 December 2022;
Published: 05 January 2023.
Edited by:
Muhsan Ehsan, Bahria University, PakistanReviewed by:
Muhammad Jawad Munawar, University of the Punjab, PakistanCopyright © 2023 Liu, Fawad, Li, Li, He, Xu and Ahmad. This is an open-access article distributed under the terms of the Creative Commons Attribution License (CC BY). The use, distribution or reproduction in other forums is permitted, provided the original author(s) and the copyright owner(s) are credited and that the original publication in this journal is cited, in accordance with accepted academic practice. No use, distribution or reproduction is permitted which does not comply with these terms.
*Correspondence: Nadir Fawad, bmFkaXIuZmF3YWRAZ21haWwuY29t, MjE5MDA2MEB0b25namkuZWR1LmNu
Disclaimer: All claims expressed in this article are solely those of the authors and do not necessarily represent those of their affiliated organizations, or those of the publisher, the editors and the reviewers. Any product that may be evaluated in this article or claim that may be made by its manufacturer is not guaranteed or endorsed by the publisher.
Research integrity at Frontiers
Learn more about the work of our research integrity team to safeguard the quality of each article we publish.