 Xinxin Yao
 Peng Zhang
 Yu Zhao
 Hongwei Wang
 Daren Wang1,2
94% of researchers rate our articles as excellent or good
Learn more about the work of our research integrity team to safeguard the quality of each article we publish.
Find out more
ORIGINAL RESEARCH article
Front. Earth Sci., 09 January 2023
Sec. Structural Geology and Tectonics
Volume 10 - 2022 | https://doi.org/10.3389/feart.2022.1107921
This article is part of the Research TopicMeasuring, Modeling and Predicting the Seismic Site EffectView all 20 articles
Consideration of site effects is vital in modeling and predicting earthquake ground motions. However, site conditions can vary markedly between different localities. The regional dependency of site conditions in China has not yet been investigated systematically. In this study, profiles of 6,179 boreholes were collected from four regions in China, i.e., the Capital Metropolitan (CM), Xinjiang (XJ), Guangdong—Guangxi (GG), and Sichuan–Yunnan (SY) areas. Quantitative characteristic parameters including site category, equivalent shear wave velocity (Vse), and the thickness of the overlying soil layer (H) defined by the Chinese seismic code, and VS30 and the median shear wave profile were all analyzed to confirm the dependency on site conditions among the four regions. Investigation revealed that the majority of sites in most regions are classified as Class-II sites with no Class-IV sites, except in CM. In comparison with the other three regions, a larger number of GG sites are classified as Class-I. Sites in XJ are generally characterized by small H values (<20 m) and large Vse values (250 –450 m/s), while those in CM are characterized by large H values (average: ∼50 m) and small Vse values (150 –300 m/s). Generally, the Vse and H values are similar in GG and SY, i.e., the sites are covered by an overlying soil layer that is ∼20 m thick with an average Vse value of ∼250 m/s. A very thin (<5 m) overlying soil layer is observed at many more sites in GG than at sites in the other three regions. The VS30 values in CM, SY, and GG all approximately follow a lognormal distribution with various logarithmic means, i.e., 257.2, 299.6, and 360.9 m/s, respectively. However, the VS30 values of most sites in XJ broadly follow a uniform distribution with a range of 200 –550 m/s. We summarized the characteristics of the median VS profiles of each VS30-based category (C1, C2, and C3) for each region. The median VS profiles between any two regions are mainly manifested as parallel trends for sites in category C1, whereas they present trends of intersection for sites in categories C2 and C3. The findings of this study could serve as a basis for the establishment of a regional empirical model for site-dependent seismic response in China.
The spatial distribution of ground motion is highly influenced by local site conditions, which can be determined on the basis of borehole profile characteristics that include the thickness of the overlying soil, shear wave velocity (VS), and the geotechnical category and properties of each soil layer. Site effects are vital factors that must be considered in seismic design (e.g., GB 50011, 2010), seismic zonation (e.g., Mucciarelli, 2011), and ground motion predictions (e.g., Wen et al., 2018). Previous studies found that seismic response can vary markedly among sites with similar values of the time-weighted average shear wave velocity of the upper 30 m (VS30) owing to substantial differences between borehole profiles (e.g., Ren et al., 2013; Rong et al., 2017). Qi et al. (2013) investigated the seismic response at sites with similar equivalent shear wave velocity and thickness of the overlying soil layer, and found notable dependency on the vertical arrangement of various soil layers. Kamai et al. (2016) observed obvious regional dependency of median VS profiles in the same VS30 bin in three disparate regions (i.e., California, Taiwan, and Japan), and suggested the development of individual site-response prediction models for California and Japan.
Most previous related studies focused on verification of the regional dependency of soil dynamic parameters through dynamic testing of soil, which can provide important information for calculating site seismic response using the one-dimensional equivalent linear method (e.g., Yuan et al., 2000; Lv et al., 2003; Chen et al., 2005). On this basis, soil dynamic parameters have been recommended for use in various regions. However, few studies have addressed the regional dependency of site conditions. In regions with the same sedimentary environment and geological background, borehole profiles of the near-surface material should be broadly similar (Zhang et al., 2022). Theoretically, the borehole profiles vary from one region to another. Boore et al. (2011) found that the VS30 empirical estimation model developed for California (USA) is inapplicable to Japan because of substantial differences in borehole profiles. Wang et al. (2022) confirmed that commonly used VS30 extrapolation models are inapplicable to Xinjiang (China) owing to the special borehole profiles. Overall, no systematic studies have been performed previously to investigate the regional dependency of site conditions in China.
This study collected site borehole profiles in four regions of China, i.e., the Capital Metropolitan (CM), Xinjiang (XJ), Guangdong–Guangxi (GG), and Sichuan–Yunnan (SY) areas. We compared the site classes in each of the four regions, as defined on the basis of the Code for Seismic Design of Buildings of China (GB50011-2010) and three characteristic site parameters, i.e., the equivalent shear wave velocity (Vse), thickness of the overlying soil layer (H), and VS30. We also compared the median VS profiles for Class-II sites and sites categorized with the same VS30–based category to investigate the potential dependency on site conditions among the four regions. The findings of this study could serve as the basis for establishment of a regional empirical model for site seismic response in China.
In total, 6,179 borehole profiles from sites in CM, XJ, GG, and SY were collected. The borehole profiles were mainly derived from the engineering site exploration, seismic safety evaluation, etc. The boreholes in CM, SY show a uniform spatial distribution. However, most boreholes in GG cluster in the Pearl River Delta Region, and boreholes in XJ are mainly spread along the north and south foot of Tianshan Mountain.
These profiles were then reorganized uniformly in terms of their geographic coordinates, VS values, thickness, and the geotechnical category and properties of each soil layer. Figure 1 shows the geographical distribution of the borehole sites in China.
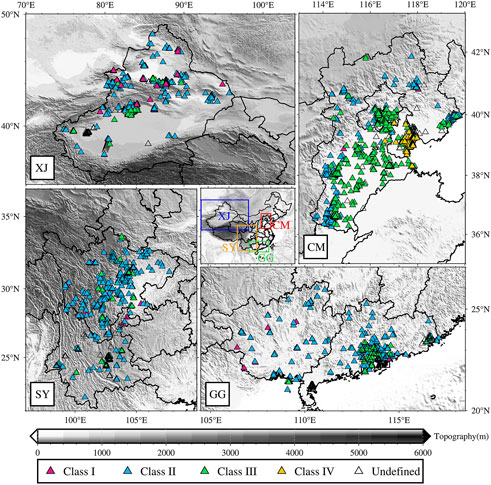
FIGURE 1. Locations of borehole sites in the four regions considered in this study, i.e., the Capital Metropolitan (CM), Xinjiang (XJ), Guangdong–Guangxi (GG), and Sichuan–Yunnan (SY) areas. Different colors are used to represent the various site classes defined by China’s seismic code.
Figure 2 shows distribution histograms of the borehole depths at the sites in the four regions. The borehole depths at most sites are <30 m in XJ, GG, and SY, but a very small number of sites have borehole depths of >100 m. The sites in CM located on the North China Plain with a thick sedimentary layer have much deeper borehole depths, i.e., more than half the sites have borehole depths of >60 m, while a certain quantity have depths of >100 m.
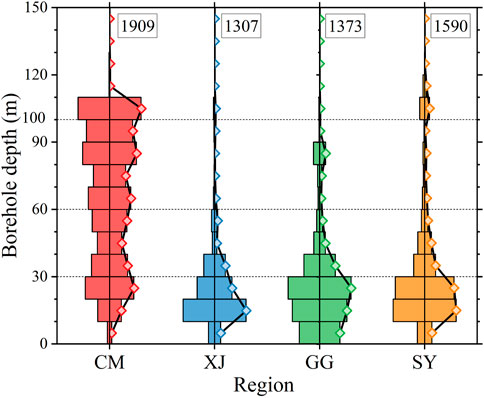
FIGURE 2. Histograms of the distribution of borehole depth at sites in CM, XJ, GG, and SY. The numbers within the box represent the total number of the sites in different regions, the rectangles with different colors stand for the number of sites in each bin, and the polylines with squares represent the proportion of the number of sites in each bin to the total.
In the Code for Seismic Design of Buildings of China (GB 50011, 2010), engineering sites are classified into four categories (Class-I, II, III, and IV) according to Vse and H, as listed in Table 1. Class-I sites include two subcategories (I0 and I1). In the code, Vse is defined as the time-weighted average VS over the upper soil layer with minimum depth of 20 m and H. The code also definitely stipulates how to determine values of H according to various cases. Generally, H is defined as the depth to the upper surface of a soil layer for which VS is not <500 m/s, and where the VS value of the underlying soil layer is always not <500 m/s.
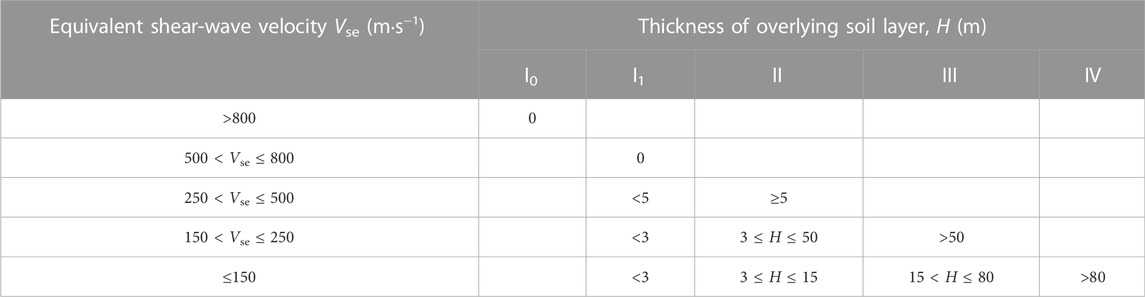
TABLE 1. Site categories defined by the Code for Seismic Design of Buildings of China (GB 50011, 2010).
The Vse and H values were calculated according to the site borehole profiles and used to categorize the site classes. Note that some boreholes were not included in the following analysis because the H values were unascertainable owing to the limited number of borehole depths. Figure 3 shows the proportion of sites divided into the various site classes for the four regions. The overwhelming majority of sites in XJ, GG, and SY are classified as Class-II sites, while only a few are classified as Class-I and Class-III sites. No site in XJ, GG, or SY is assigned to the Class-IV group. We also note that the proportion of Class-I sites in GG is substantially higher than that in either XJ or SY. In contrast, in CM, the number of Class-III sites is slightly lower than that of Class-II sites, and Class-II and Class-III sites account for the majority. In CM, some sites are classified as Class-IV sites, and their proportion is far greater than that of the Class-I sites. As shown in Figure 1, the Class-III and Class-IV sites in CM are generally distributed around the coastal area with very soft and deep soils. The common characteristic that Class-II sites account for the majority is also the result determined using the Chinese seismic code with a wide interval of Class-II sites.
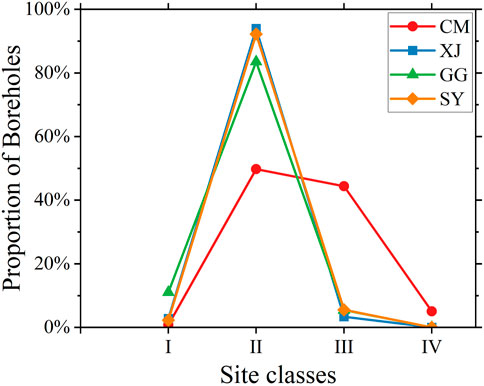
FIGURE 3. Proportions of borehole sites associated with different site classes in SY, XJ, GG, and CM.
Figure 4 presents Vse–H scatter plots for the four studied regions, together with histograms of the H and Vse values. The H values of XJ sites are generally <20 m, while the Vse values are at a comparatively high level (250 –450 m/s), indicating that most sites in XJ are covered by thin and hard soil (e.g., sand and silty clay). In contrast, CM sites generally show an approximately uniform distribution of H values in the range of 0 –100 m (average: ∼50 m) and lower Vse values in the range of 150 –300 m/s, indicating deep and soft surficial soil. The Vse–H scatter plots present similar distributions for GG and SY. Generally, the ground surface in both regions is covered by an overlying soil layer that is ∼20 m thick with an average Vse value of ∼250 m/s. However, in comparison with the other three regions, the overlying soil layer is very thin (<5 m) at many more sites in GG. In comparison with those sites with a very deep overlying soil layer (i.e., >80 m) in XJ, CM, and SY, some of the sites in CM are characterized by very low Vse (i.e., <150 m/s), and sites with higher Vse values account for a larger proportion of such sites in SY. The above results fully reflect the major differences in H and Vse at the various sites in the four studied regions.

FIGURE 4. Scatter plots of Vse versus H for sites in CM, XJ, GG, and SY, together with histograms of Vse and H values. The polygonal lines distinguish the ranges of Vse and H for different site classes as defined by the Chinese seismic code.
The potential regional dependency in the VS profiles was investigated based on the boreholes of the Class-II sites in the four regions. Figure 5 shows the variation of VS with depth for each Class-II site, as well as the VS median and the one standard deviation range for each region. Very obvious differences are evident in the VS profiles of the Class-II sites in the four regions. The median VS profiles for the four regions are also plotted in Figure 5 for comparison purposes. The sites in the four regions show some similarities in terms of the characteristics of the variation in median VS with depth, i.e., a sharp increase in VS in shallow soil layers from the ground surface to a critical depth, and notably slower increase in deeper soil layers beneath the critical depth. The differences in the median VS profiles for the four regions were investigated. The median VS profile in XJ shows a much shallower critical depth (∼13 km) than that in the other three regions (∼20 km). The median VS values (increasing from ∼220; to ∼480 m/s) in the shallow soil layers in XJ are much larger than those (increasing from ∼200; to ∼400 m/s) in the other regions. The median VS value in XJ appears to exhibit faster increase in shallow soil depths than that in the other regions. The median VS values of the deeper soil layers in XJ generally show no obvious increase with depth. Such a phenomenon is also observed in many of the deeper soil layers (>60 m) in CM. In GG and SY, the median VS values of the deeper soil layers maintain continuous increase with depth, i.e., from 400; to 580 m/s and to 700 m/s, respectively. Our results indicate that it is necessary to consider regionally dependent site amplification effects in seismic design.
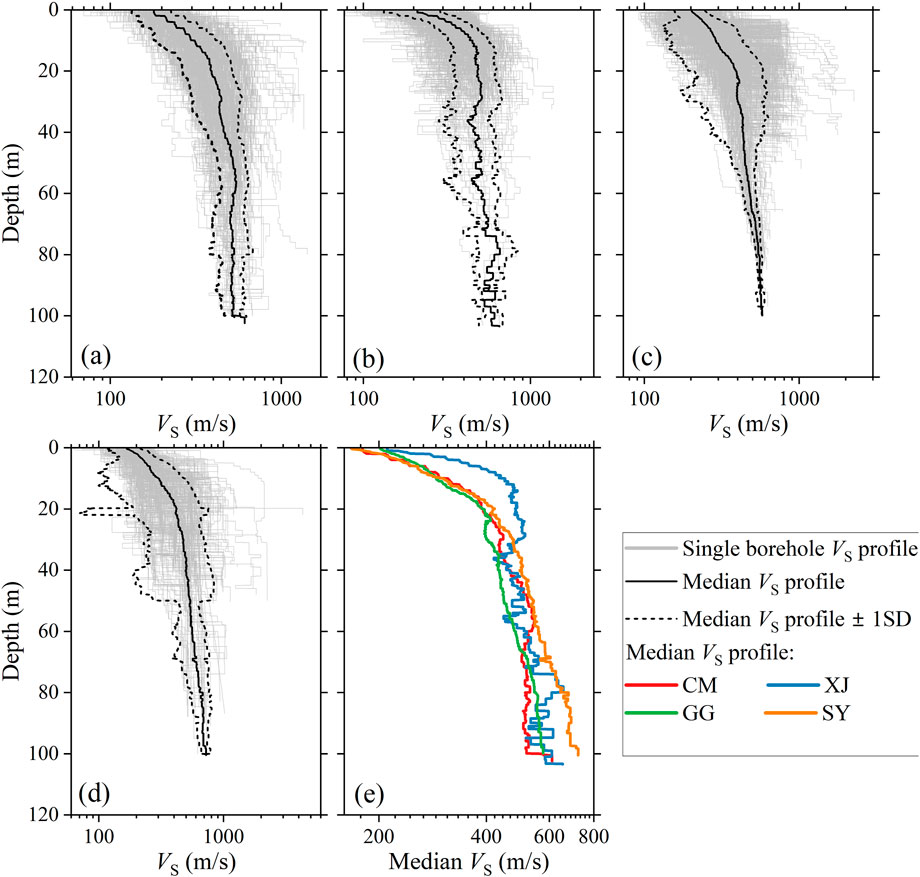
FIGURE 5. The VS profiles of Class-II sites in (A) SY, (B) GG, (C) CM, and (D) XJ areas. Solid and dotted lines indicate the median VS profile and the one standard deviation range, respectively, for each region. (E) The median VS profiles of the Class-II sites in the four regions are compared in panel.
Although the Chinese seismic code uses site categories to characterize the effects of local site conditions on ground motions, VS30 is also an important parameter commonly used to characterize local site amplification. The potential regional dependency of VS30 was further investigated on the basis of the borehole data from the four studied regions. The VS30 values were estimated for sites with borehole depths of <30 m using the constant extrapolation model (Wang et al., 2022) if a rock layer was situated at the bottom of the borehole, and using the linear extrapolation model if a soil layer was situated at the bottom of the borehole.
Frequency distributions of the VS30 values in the four studied regions are plotted in Figure 6. The VS30 distributions in CM, SY, and GG all approximately follow a lognormal distribution with logarithmic means of 257.2, 299.6, and 360.9 m/s, respectively. The range of one standard deviation in CM, SY, and GG is 186.5–354.7, 215.1–417.3, and 243.4–535.0 m/s, respectively, indicating that the near-surface soil layer in the upper 30 m is on average hardest in GG and softest in CM. The VS30 values at a certain proportion of sites in GG are measured or estimated to be >800 m/s, corresponding to hard soil or rock sites, while barely any such sites are found in CM. However, the near-surface site conditions in CM could be confirmed to be most similar owing to the narrowest dispersion of VS30 values, while the widest dispersion in GG indicates greatest discrepancy. Different from the other three regions, the VS30 values of XJ sites do not follow a lognormal distribution. Instead, the VS30 values for most sites fall within a wide range of 200 –550 m/s, approximately following a uniform distribution with an average of ∼400 m/s.
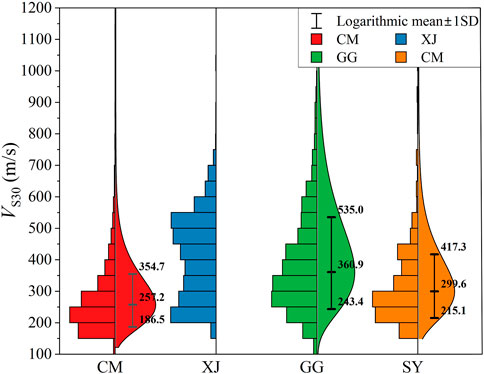
FIGURE 6. Frequency distributions of VS30 values in the four studied regions.
The VS30-related empirical relations are often used to characterize site amplification effects, e.g., in predicting ground motions. Moreover, the empirical relations associated with site categories are also used (e.g., Bindi et al., 2011). However, in such cases, the same amplification effects appear associated with sites belonging to the same site category but with different measured VS30 values. Therefore, we explored the potential regional dependency of VS30 values measured or estimated at sites belonging to the same site category. Referring to the seismic code of China and other countries and regions, most sites considered in this study were divided into three categories on the basis of the VS30 values, i.e., C1 for VS30 = 180 –360 m/s, C2 for VS30 = 360 –500 m/s, and C3 for VS30 = 500 –750 m/s.
The median VS profiles for sites belonging to each category were computed for each of the four regions and illustrated in Figure 7. Note that the median VS profiles for sites within category C3 in SY and CM are not presented owing to the limited number of samples which is less than 10% of the total number of sites. Substantial regional dependency is also observed in the median VS profiles of sites within the same category. To clearly express the regional dependency of median VS profiles of each category, we defined three trends to describe the regional dependency between any two regions considered in this study, i.e., 1) parallel median VS profiles between two regions that indicate similar VS variation with depth and greater VS values in one region in comparison with those in another; 2) intersecting median VS profiles of two regions that indicate dissimilar VS variation with depth and greater (lower) VS in the upper (lower) soil layers in one region in comparison with those in another; and 3) overlapping median VS profiles at certain depths for both regions indicating consistent VS values. The three trends between any two regions for each VS30-based site category are listed in Table 2. For sites belonging to category C1, the median VS profiles between two regions are mainly manifested as a parallel trend, while a trend of intersection appears for XJ–GG and XJ–SY pairings. However, for sites belonging to categories C2 and C3, the median VS profiles between two regions are predominantly shown as intersection trends, while only the XJ–CM pairing in category C2 shows as an overlapping trend. It is worth noting that the median VS profiles for categories C2 show an intersection trend with the other three regions and categories C3 intersect with XJ in GG. The median VS values of the upper soil layers in GG are relatively small but relatively large in the lower soil layers, reflecting the higher impedance ratio and the corresponding stronger site seismic responses in GG. The trends of the median VS profiles for the same VS30-based category between any two regions fully demonstrate the regional dependency of the VS30 values measured or estimated at sites belonging to the same site category. Even if the VS30 values among the four regions are similar, the VS profiles can differ substantially, which could cause huge differences in site seismic responses.

FIGURE 7. Median VS profiles for sites belonging to each VS30-based category in the four regions considered in this study: (A) category C1 for VS30 = 180–360 m/s, (B) category C2 for VS30 = 360–500 m/s, and (C) category C3 for VS30 = 500–750 m/s.
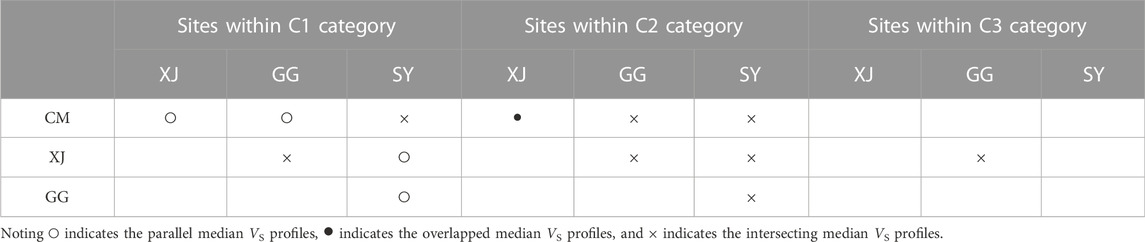
TABLE 2. Trends describing the regional dependency between any two regions for each VS30-based site category.
This study collected over 6,000 borehole profiles from sites in four regions (i.e., XJ, CM, GG, and SY) in China to investigate the potential regional dependency of site conditions. These sites were first classified into corresponding site categories as defined by the Chinese seismic code. The regional dependencies in Vse, H, and VS30, and also in the VS profiles, were clearly observed at the various sites among the four regions. The following conclusions were drawn.
1) The proportion of Class-II sites is the highest among all four regions. Sites in XJ are generally characterized by small H values (<20 m) and large Vse values (250 –500 m/s); conversely, the H values are large and the Vse values are small in CM. Except for XJ sites, the Vse values all follow a Gaussian distribution with an average of ∼250 m/s. The H values in CM exhibit an approximately uniform distribution in the range of 0 –100 m, while those in other regions are concentrated mainly in a range of 0 –30 m.
2) The VS30 values for the majority of sites in CM and SY are not >500 m/s, while some sites in XJ and GG show high VS30 values in the range of 500 –750 m/s. Except for XJ sites, the VS30 values in CM, SY, and GG all approximately follow a lognormal distribution with a logarithmic means of 257.2, 299.6, and 360.9 m/s, respectively. However, the VS30 values of XJ sites fall mainly within a wide range of 200 –550 m/s.
3) We defined three trends to describe the regional dependency of the median VS profiles of each VS30-based category (i.e., C1, C2, and C3) between any two regions. For sites belonging to category C1, C2 and C3, the median VS profiles between two regions are manifested as a trend of parallel and intersection, respectively. The median VS values of the upper soil layers in GG are relatively small but relatively large in lower soil layers, reflecting the higher impedance ratio and the corresponding stronger site seismic responses in GG.
The above conclusions were obtained statistically using available borehole data that represent the average characteristics of site conditions in the studied regions. These results might be subject to change when additional borehole data are incorporated in the future. However, the regional dependency of site conditions is evident, and it is recommended that it should be considered in seismic zonation mapping and seismic design codes.
The original contributions presented in the study are included in the article/supplementary material, further inquiries can be directed to the corresponding author.
XY analyzed the data, interpreted the results, and drafted the manuscript. PZ encoded the borehole data, interpreted the results, and corrected the manuscript. YZ processed the borehole data and corrected the manuscript. HW collected the borehole data and reviewed the manuscript. DW processed the borehole data. All authors read and approved the final manuscript.
This work is supported by National Key R&D Program of China under grant number 2019YFE0115700; Chinese National Natural Science Fund under grant number 51878632; Natural Science Foundation of Heilongjiang Province under grant number YQ2019E036; Heilongjiang Touyan Innovation Team Program.
The authors declare that the research was conducted in the absence of any commercial or financial relationships that could be construed as a potential conflict of interest.
All claims expressed in this article are solely those of the authors and do not necessarily represent those of their affiliated organizations, or those of the publisher, the editors and the reviewers. Any product that may be evaluated in this article, or claim that may be made by its manufacturer, is not guaranteed or endorsed by the publisher.
Bindi, D., Pacor, F., Luzi, L., Puglia, R., Massa, M., Ameri, G., et al. (2011). Ground motion prediction equations derived from the Italian strong motion database. Bull. Earthq. Eng. 9, 1899–1920. doi:10.1007/s10518-011-9313-z
Boore, D. M., Thompson, E. M., and Cadet, H. (2011). Regional correlations of VS30 and velocities averaged over depths less than and greater than 30 meters. Bull. Seismol. Soc. Am. 101 (6), 3046–3059. doi:10.1785/0120110071
Chen, G. X., Liu, X. Z., Zhu, D. H., and Hu, Q. X. (2005). Study on dynamic characteristics of recently deposited soils in southern area of jiangsu Province. Chin. J. Undergr. Space. Eng. 1 (7), 1139–1142. (in Chinese with English abstract). doi:10.3969/j.issn.1673-0836.2005.z1.042
GB 50011 (2010). Code for seismic design of buildings. Beijing: China Architecture Industry Press. (in Chinese).
Kamai, R., Abrahamson, N. A., and Silva, W. J. (2016). VS30 in the NGA GMPEs: Regional differences and suggested practice. Earthq. Spectra. 32 (4), 2083–2108. doi:10.1193/072615EQS121M
Lv, Y. J., Tang, R. Y., and Sha, H. J. (2003). Experimental study on dynamic shear modulus ratio and damping ratio of the soils of bohai seafloor. J. Disaster. Prev. Mitig. Eng. 23 (2), 368–374. (in Chinese with English abstract). doi:10.13409/j/cnki.jdpme.2003.02.006
Mucciarelli, M. (2011). Ambient noise measurements following the 2011 christchurch earthquake: Relationships with previous microzonation studies, liquefaction, and nonlinearity. Seismol. Res. Lett. 82 (6), 919–926. doi:10.1785/gssrl.82.6.919
Qi, W. H., Liu, H. S., and Bo, J. S. (2013). A new site classification index: Equivalent period of soil layer. Earthq. Eng. Eng. Dyn. 33 (6), 228–235. (in Chinese with English abstract). doi:10.13197/j.eeev.2013.06.228.qiwh.032
Ren, Y. F., Wen, R. Z., Yamanaka, H., and Kashima, T. (2013). Site effects by generalized inversion technique using strong motion recordings of the 2008 Wenchuan earthquake. Earthq. Eng. Eng. Vib. 12 (02), 165–184. doi:10.1007/s11803-013-0160-6
Rong, M. S., Fu, L. Y., Wang, Z., Li, X. J., Carpenter, N. S., Woolery, E. W., et al. (2017). On the amplitude discrepancy of HVSR and site amplification from strong-motion observations. Bull. Seismol. Soc. Am. 107 (6), 2873–2884. doi:10.1785/0120170118
Wang, D. R., Ren, Y. F., Zhang, Y. T., Ji, K., Wang, H. W., and Wen, R. Z. (2022). Method for correcting extrapolation model of engineering site parameter VS30. J. Harbin. Inst. Technol. Online Publ. (in Chinese with English abstract). doi:10.11918/202110086
Wen, R. Z., Xu, P. B., Wang, H. W., and Ren, Y. F. (2018). Single-station standard deviation using strong-motion data from sichuan region, China. Bull. Seismol. Soc. Am. 108 (4), 2237–2247. doi:10.1785/0120170276
Yuan, X. M., Sun, R., Sun, J., Meng, S. J., and Shi, Z. J. (2000). Laboratory experimental study on dynamic shear modulus ratio and damping ratio of soils. Earthq. Eng. Eng. Dyn. 20 (4), 133–139. (in Chinese with English abstract). doi:10.13197/j.eeev.2000.04.020
Keywords: site condition, site borehole profiles, regional dependency, site category, VS30
Citation: Yao X, Zhang P, Zhao Y, Wang H and Wang D (2023) Region-dependent site conditions in China: Evidence from borehole data statistics. Front. Earth Sci. 10:1107921. doi: 10.3389/feart.2022.1107921
Received: 25 November 2022; Accepted: 08 December 2022;
Published: 09 January 2023.
Edited by:
Kun Ji, Hohai University, ChinaReviewed by:
Mianshui Rong, Beijing University of Technology, ChinaCopyright © 2023 Yao, Zhang, Zhao, Wang and Wang. This is an open-access article distributed under the terms of the Creative Commons Attribution License (CC BY). The use, distribution or reproduction in other forums is permitted, provided the original author(s) and the copyright owner(s) are credited and that the original publication in this journal is cited, in accordance with accepted academic practice. No use, distribution or reproduction is permitted which does not comply with these terms.
*Correspondence: Hongwei Wang, d2h3MTk5MDQxM0AxNjMuY29t
Disclaimer: All claims expressed in this article are solely those of the authors and do not necessarily represent those of their affiliated organizations, or those of the publisher, the editors and the reviewers. Any product that may be evaluated in this article or claim that may be made by its manufacturer is not guaranteed or endorsed by the publisher.
Research integrity at Frontiers
Learn more about the work of our research integrity team to safeguard the quality of each article we publish.