
94% of researchers rate our articles as excellent or good
Learn more about the work of our research integrity team to safeguard the quality of each article we publish.
Find out more
ORIGINAL RESEARCH article
Front. Earth Sci., 04 January 2023
Sec. Environmental Informatics and Remote Sensing
Volume 10 - 2022 | https://doi.org/10.3389/feart.2022.1101955
This article is part of the Research TopicAdvances in Development and Utilization of Underground SpaceView all 17 articles
 Yamei Zhang1,2Gan Sun1,2
 Xiaoyu Bai1,2*Songkui Sang1,2
 Jianyong Han3Nan Yan1,2
 Mingyi Zhang1,2Xiaodong Gao4Weiqi Li4
Whether the inhomogeneity of mudstone foundation leads to abnormal bearing capacity of the driven pile remains controversial. This study introduces the standard penetration test hammering number and needle penetration strength for quantitative analysis by macroscopic observation of the engineering field on the mudstone stratum self-structure and microscopic observation by simple and feasible electronic magnification. The analysis of typical engineering examples demonstrated that the abnormal bearing capacity of piles in the mudstone stratum was related to mudstone inhomogeneity. This study also proposes a method of evaluating mudstone uniformity using the heterogeneous index η, in which η > 2 suggests the need for engineering measures. These findings assist in determining a reasonable solution to the problem of abnormal bearing capacity at driven piles in mudstone foundations.
Mudstone is the product of weakly consolidated clay becoming strongly consolidated clay due to extrusion and dewatering. Mudstone has properties between those of hard rock and quaternary settlement, as well as its own characteristics. Macro and micro research on the mechanical properties of mudstone have revealed engineering properties of mudstone including poor diagenesis, weak cementation, easy weathering, weak interbedding, and easy expansion, disintegration, and softening when water is encountered (Zhao et al., 2018; Hashemnejad et al., 2021; Zeng et al., 2021; Liu et al., 2022a). Due to the special engineering nature of mudstone, insufficient bearing capacity of driven piles in mudstone foundations occurs frequently (Xu and Li, 2004; Terente et al., 2017). Therefore, the study of the basic engineering properties of mudstone and their influence on the bearing capacity of pile foundations is of theoretical and engineering significance.
Water–rock interactions greatly influence the mechanical properties of rock (Liu et al., 2022b). Many studies and engineering cases have assessed the softening of mudstone under water as an important influencing factor. Jiang et al. (2014) observed the dynamic softening process of the mesostructure of mudstone by scanning electron microscopy and X-ray diffraction. They observed meso-fractures in the mudstone in diagenetic conditions and that water molecules immersed in the mudstone led to the volume expansion of clay minerals and dissolution of soluble carbonate, resulting in negative mechanical effects. Yang et al. (2016) analyzed the softening characteristics and mechanism of siltstone in water through a series of mechanical and microstructure tests, in which changes in the microstructure of rock in water were the main factors affecting the strength of rock. Liu et al. (2020) verified that softening and swelling of rock due to water absorption can lead to structural failure. However, some studies reported that the mudstone at the pile end did not soften when exposed to water; rather, the abnormal bearing capacity of the pile foundation was caused by mudstone inhomogeneity (Zhang et al., 2016). Therefore, such inhomogeneity should also be considered an important research topic. Kiani et al. (2022) studied the intrinsic characteristics of tuff in the Meymand area and reported that these rocks have a heterogeneous texture comprising very coarse-grained clasts to fine-grained matrices. Manouchehrian and Cai (2016) used finite element software (Abaqus) to simulate the failure process of homogeneous and heterogeneous rocks and study the influence of material inhomogeneity on rock failure strength in compression tests.
The easy disintegration of mudstone makes it difficult to prepare specimens for laboratory tests of its mechanical properties. The standard penetration field test is an effective method used to determine the mechanical properties of rock and soil. Zhang and Chen (2012) predicted the bearing capacity of piles based on this test, while Nejad et al. (2009) and Erzin and Gul (2014) used this test to calculate foundation settlement. Moreover, Jha and Suzuki (2009) proposed a soil liquefaction assessment method based on the standard penetration test. Finally, Asem (2020) applied the standard penetration test to determine mudstone strength and deformation modulus. The needle penetration test is a convenient method used to test the mechanical properties of soft rock without requiring sample preparation (Ulusay et al., 2013). Kahraman et al. (2017) discussed the application of needle penetration instruments in coal rock, performed a regression analysis of the relationship between needle penetration degree and uniaxial compressive strength, and determined the conversion coefficient. Erguler and Ulusay (2009) explored the strength characteristics of clay-bearing rock through needle penetration tests, in which this test was particularly suitable for testing the uniaxial compressive strength of soft rock.
Thus, while research on mudstone softening in water has been relatively comprehensively studied, studies on mudstone inhomogeneity are generally on the level of the nature of the rock itself, without considering the influence of mudstone inhomogeneity on the pile foundation. Therefore, the present study evaluated mudstone inhomogeneity at the microscopic level by observing mudstone samples at the macroscopic level combined with electron microscopy and quantified the uniaxial compressive strength of mudstone by the needle penetration test. Combined with standard penetration number and needle penetration strength, the influence of mudstone inhomogeneity on pile bearing capacity was analyzed. Finally, this study summarized the method of judging mudstone inhomogeneity and proposed a method for judging mudstone uniformity based on the inhomogeneity index η.
In this study, mudstone refers broadly to mudstone; in addition to pure mudstone, this definition also includes sandy mudstone, argillaceous sandstone, and even some local inclusion sandstone, the properties of which are closely related to the sand content.
During rock formation, initial damage occurs due to environmental and geological forces (Wu et al., 2022). Mudstone shows primary and secondary micro-voids, micro-cracks, and other defects in the interior (Zhang et al., 2020; Lv et al., 2022) and is itself not uniform in certain dimensions; thus, it is easy to produce greater damage or even failure, which greatly influences the engineering characteristics of mudstone (Lv et al., 2022). Initial defects in mudstones can be observed at the mesoscopic level.
Compared to the usual initial defects, in a certain hardness of weathered mudstone, the joints and fissures cause a fragmentary structure. The uneven intercalation (inclusion) results in its inhomogeneity, which affects the engineering properties of mudstone and can be broadly considered as “damage”. To fully reveal the mudstone inhomogeneity, this study collected data in the author’s area, and the inhomogeneity of mudstone was revealed by excavation and drilling.
Figure 1 shows the mudstone interbedded structure revealed by the foundation pit and the natural slope of a site in the study region.
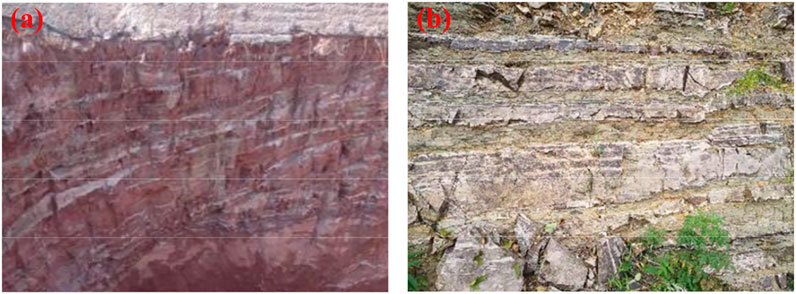
FIGURE 1. Mudstone interbedded structure of the foundation pit and slope. (A) Foundation pit. (B) Interbedded outcrops of sandstone and mudstone.
Figure 2 is a schematic diagram of mudstone joints, fissures, and massive structures in the test site.
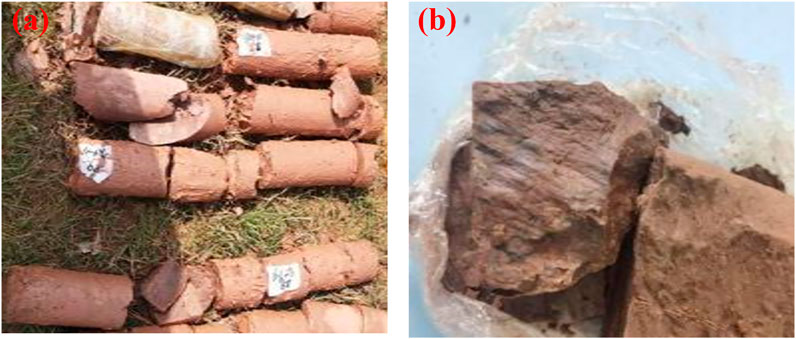
FIGURE 2. Schematic diagram of mudstone joints and fissures. (A) Mudstone core. (B) Massive mudstone.
Figure 3 is a schematic diagram of mudstone joints and uneven inclusions at the test site, in which some mudstones have both inclusions and fissures.
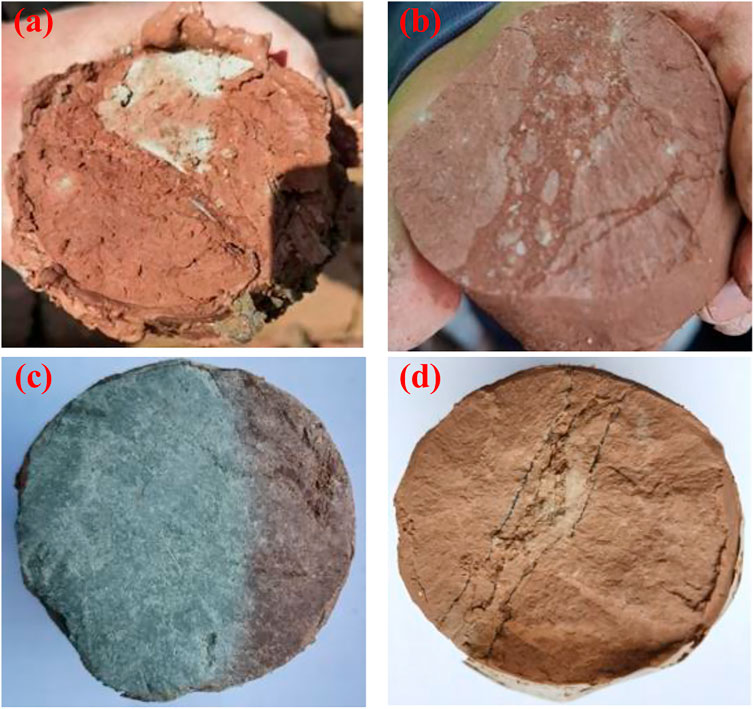
FIGURE 3. Diagram of mudstone joints and uneven inclusions. (A–D) Mudstone specimens 1–4, respectively.
This study performed both micro-observations and quantitative tests of drill core samples. The field test used an 8.3t hammer of the driven pile. The test pile was a PHC closed-mouth pipe pile with a diameter of 500 mm and a strength of C80. The pile ends were all located in mid-weathered mudstone. Mudstone samples were taken at .69 m around the pile before and after pile driving, and drilling fluid was used. During the test, the mudstone was below the groundwater level; therefore, the drilling fluid had little effect on the mudstone.
Scanning electron microscopy (SEM) image analysis is a common method used to study the microstructure of rock and soil and was also performed in the present study. The separation test showed that more than 60% of the sandy mudstone had a particle size >.005 mm (5 μm). SEM observation with 2000× magnification showed single particles measuring 10 mm, resulting in a large display ratio, which was not conducive to the observation of a wider range of cracks and pore structures. Pan (2014) conducted a SEM analysis of mudstone with different amplification ratios. The image comparison of the two proportions is shown in Figure 4. Figure 4A and Figure 4B show images at 500× and 2000× magnification, in which the latter does not reflect the overall structure as well as the former.
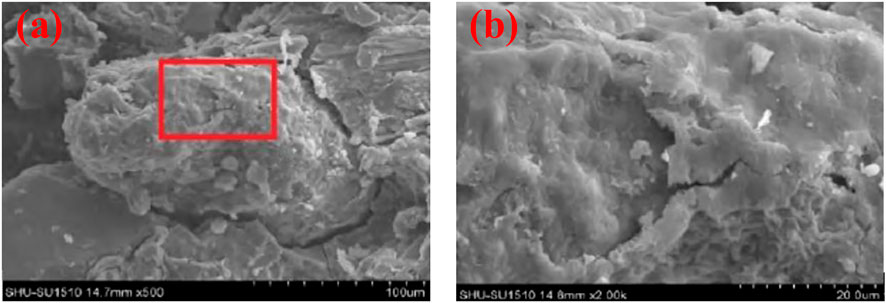
FIGURE 4. Effect comparison of mudstone SEM images at different magnifications. (A) ×500. (B) ×2000.
Therefore, the SEM magnification should not be too large during the microscopic analysis of mudstone samples. This study used a more flexible method of imaging based on an electronic magnifying glass. This method can also display color, which is more conducive to the observation of mineral structure.
Ordinary SEM samples are cut with a knife, leaving residual powder particles on the surface. The gold-spraying operation during sample preparation can also block the particles, affecting microstructure observation and analysis. Moreover, the absence of color is not conducive to the analysis of mineral composition. Using the electronic magnifying glass directly on the mudstone for fracture observation, the particles and color are clearly visible. In addition, ordinary SEM samples must be dried, a process that is not suitable for mudstone, as mudstone cracks and deforms after losing water, changing its original appearance. The electronic magnifying glass is directly connected to a computer to directly observe the section of the core sample with its natural water content, thus overcoming the disadvantages mentioned previously.
After piling and static load tests, the working situation of the sample section was observed with an electronic magnifying glass (Figure 5. Images magnified at 200× are shown in Figures 6, 7. Color images can be used to analyze mudstone fissures and damage in pile driving, identify rock mineral composition, and determine sand content.
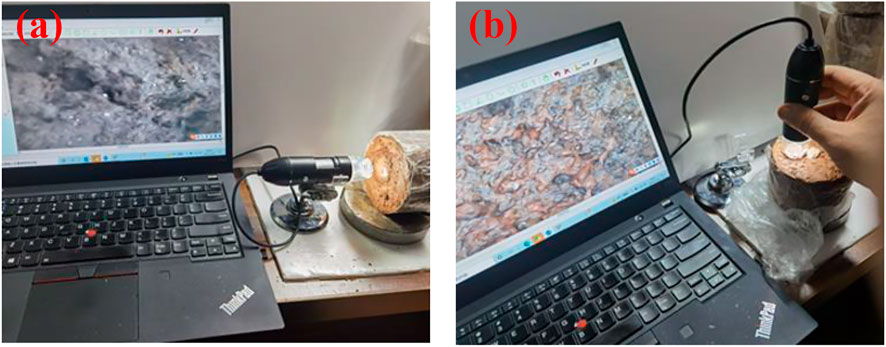
FIGURE 5. Sample observations of a mudstone section with an electronic magnifying glass. (A) Sample 1. (B) Sample 2.
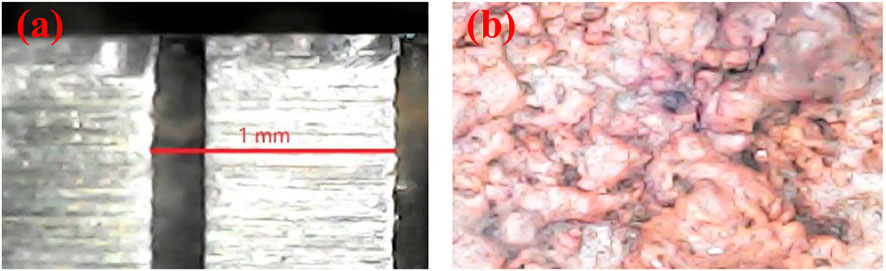
FIGURE 6. Two-hundred-fold enlargement using an electronic magnifier. (A) Graphic scale: steel plate ruler 1 mm. (B) Mudstone fractures.
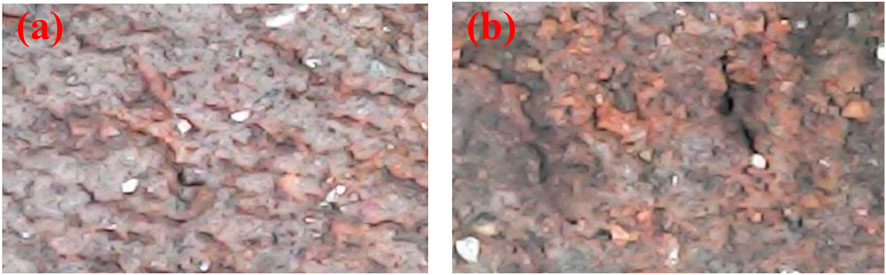
FIGURE 7. Pile tip mudstone images of normal and damaged piles in static load tests. (A) Normal pile. (B) Pile with static load failure. 1, collet; 2, press; 3, penetration scale; 4, penetration force scale; 5, indicator ring; 6, rear cover; 7, diagram of the needle penetration ratio and uniaxial compressive strength; 8, penetration needle.
In Figure 7, the soil at the pile end is compacted. However, the pile with static load failure has an obvious secondary fracture due to large settlement deformation.
The color image from the electronic magnifying glass showed that the sand-bearing mudstone was mainly volcanic clastic deposit, containing montmorillonite, hydromica, volcanic debris, calcite veins, quartz, feldspar, etc. Among them, feldspar, quartz, and other minerals were cemented by brick-red clay particles. The quartz grains were round or elliptic, while the feldspar was angular. The darker minerals appeared as small nodules containing iron and manganese, with a few mica fragments.
Uniaxial compressive strength is an important index reflecting the classification and characteristics of rock masses. The uniaxial compressive strength test (UCS test) has high requirements to produce rock samples, while the point load strength test (PLT) is a simple test method for strength indexes. The sample is not required to be cylindrical; thus, irregular block rock can be used. The measured point load strength index Is50 is multiplied by the relevant factor k to obtain the uniaxial compressive strength of the rock. However, k is related to the rock type and weathering degree, so is difficult to accurately obtain and accuracy is problematic. To solve these challenges, Japanese researchers invented an instrument, the needle penetrometer, to test the strength of soft rock. Calculating uniaxial compressive strength by testing the needle penetration index of soft rock does require sample preparation. In general, soft rock can also be assessed; thus, the test has good applicability (Yao et al., 2015; Li et al., 2016). The best test range is .5–20 MPa. This non-destructive testing can be applied both indoors and on the engineering site. Therefore, this test has become the recommended method for strength testing of soft rock mass strength by the International Society of Rock Mechanics (ISRM). This method is especially suitable for mudstone, which is difficult to assess using conventional samples.
The penetrometer consists of a press (to measure the penetration force and protect the penetration needle), collet (a fixed penetration pin), penetration scale, penetration force scale, indicator ring (showing the size of penetration force), and rear cover and other parts (Figure 8. The instrument parameters are as follows: penetration force test, 10–100 N; minimum scale, 10 N; end diameter of the penetration needle, .84 mm; penetration needle length, 39.5 mm; maximum penetration, 10 mm; minimum scale, 1 mm. In this test, a relatively flat rock surface without cracks is selected for testing. The press is pushed vertically against the test point. The pressure is stopped immediately, and the needle is slowly pulled out when the penetration depth reaches 10 mm. The penetration force and penetration volume are recorded.
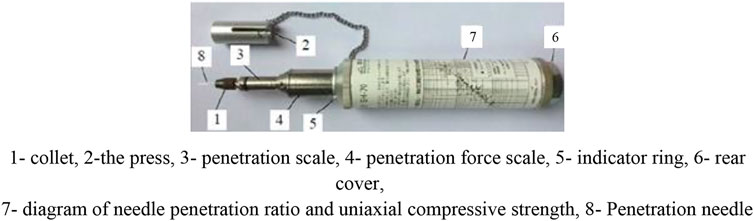
FIGURE 8. Needle penetrometer (Yao et al., 2015).
The statistical analysis of a large amount of test data during the instrument development resulted in an empirical formula for the conversion of the needle penetration ratio to uniaxial compressive strength. The expression for defining the pin penetration ratio Np is Np=F/D, where Np is the needle penetration ratio (N/mm2), F is the penetration force (N), and D is the penetration depth (mm). Taking the logarithms of uniaxial compressive strength Rc and the needle penetration ratio Np respectively is shown in Eq. 1:
After regression fitting, the formula is as follows:
According to Eq. 2, the uniaxial compressive strength Rc of mudstone around the pile can be obtained. While this relation can also be obtained from the relation diagram attached to the instrument, the calculation result obtained using Eq. 2 is more convenient and accurate.
Figure 9 shows a photograph of needle penetration of mudstone cores. The needle penetration test is simple and convenient and can be performed at multiple points, which can be used to eliminate measurement error.
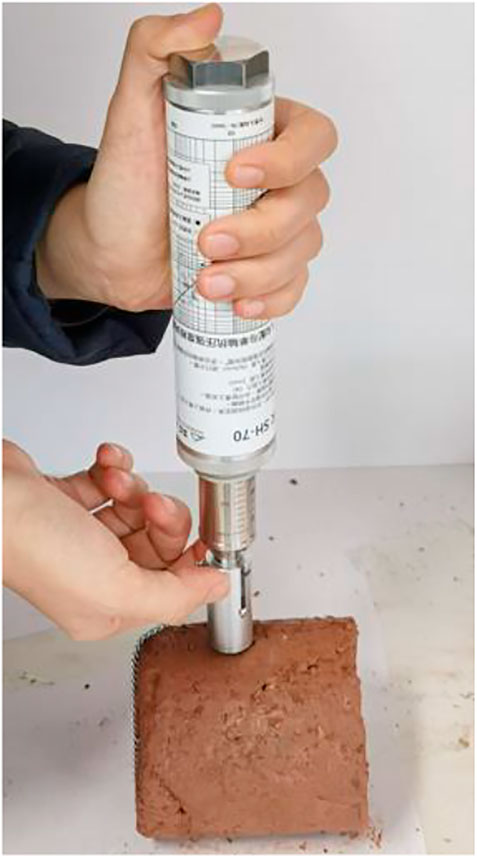
FIGURE 9. Needle penetration test on a mudstone core.
The mudstone in the study area belongs to the silty mudstone of Wang group of the Cretaceous red cliffs group (KwH), which is partially intercalated with argillaceous siltstone. In this region and other parts of China, the bearing capacity of driven piles with mudstone as the pile tip bearing layer differs from that of the common pile foundation and the problems with abnormal bearing capacity occur frequently. Concrete performance in the pile bearing capacity includes lower capacity than before loading or partly higher part and partly lower. While the static load test during the pile test stage shows normal results, the final bearing capacity of the pile can be problematic. Figure 10 shows two engineering examples with problems in static load test capacity.
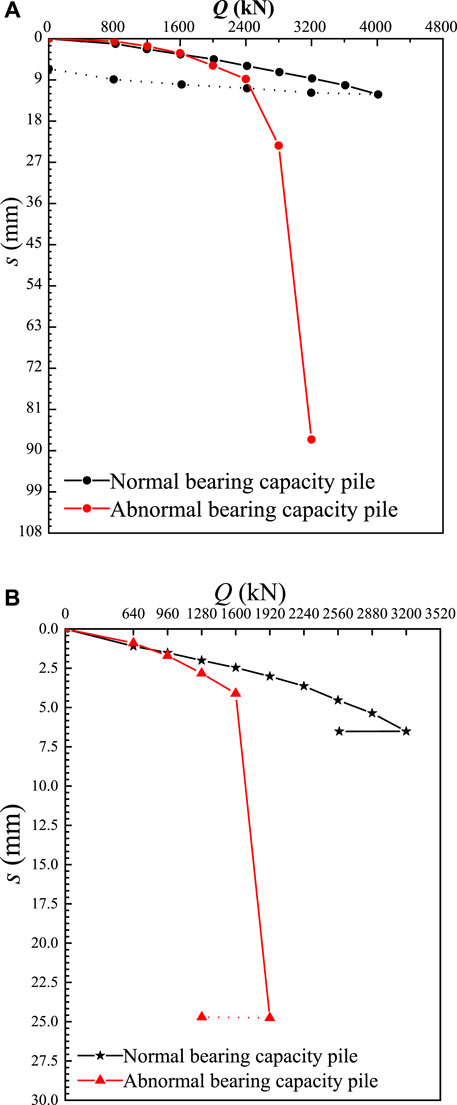
FIGURE 10. Case diagram of abnormal bearing capacity of driven piles in mudstone foundation. (A) Project Example 1. (B) Project Example 2.
The load-displacement curve of the test pile was obtained by in situ static load tests. As shown in Figure 10A, the bearing capacity of the normal pile was 4000 kN, while the settlement of the pile under the maximum load was only 12 mm, far from the 40 mm stipulated in the code, indicating that the bearing capacity of this pile still had a certain potential. However, a pile of the same size and the same construction method as the test pile was destroyed at a loading of 3200 kN. As shown in Figure 10B, the results of the static load test showed that the bearing capacity of the normal pile was 3200 kN, while that of the abnormal pile was <1920 kN.
Drilling holes added in the pile side to determine the causes of the bearing capacity problems showed that all of the problems were related to the inhomogeneity of the mudstone stratum. The pile-end soil drilling core of engineering example 1 was in a block with uneven fragmentation (Figure 11.
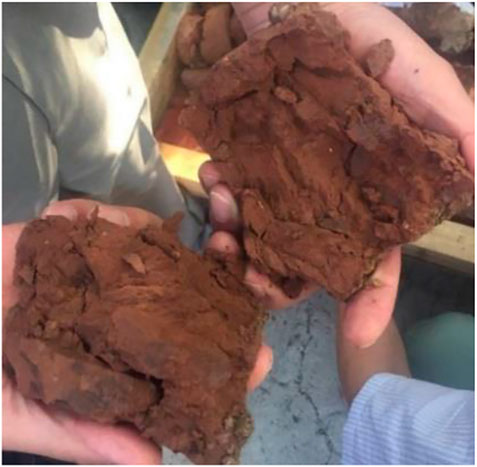
FIGURE 11. Mudstone at the pile tip in Project Example 1.
The results of the standard penetration test of the pile end-bearing layer are shown in Table 1, with one test pile for each project. The number of standard penetration strikes is denoted by N. The maximum and minimum standard penetration strike numbers of the two projects are very different, and there is obvious inhomogeneity. This engineering example illustrates the feasibility of using the standard penetration strike number index to judge mudstone inhomogeneity.
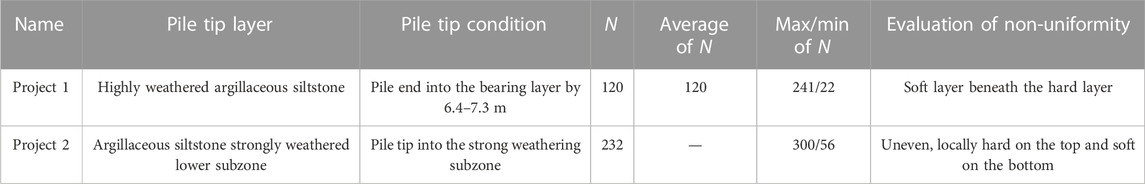
TABLE 1. Hammer strike numbers of pile end bearing layers with abnormal bearing capacities.
Drilling and exploration of the mudstone foundation of one of the projects showed that the foundation was argillaceous siltstone with a layer thickness of 16 m and a reddish-brown color. A sample of mudstone in the borehole was obtained, and a penetration strength test was performed. The observation of mudstone samples from the same borehole at different depths showed the mudstone of the borehole was interbedded with soft and hard layers, with greatly varying sand content. Core No. 4 belonged to the interlayer due to its high sand content. The sampling depth and penetration strength of mudstone samples are shown in Table 2. The relationships between needle penetration strength and foundation depth are shown in Figure 12.
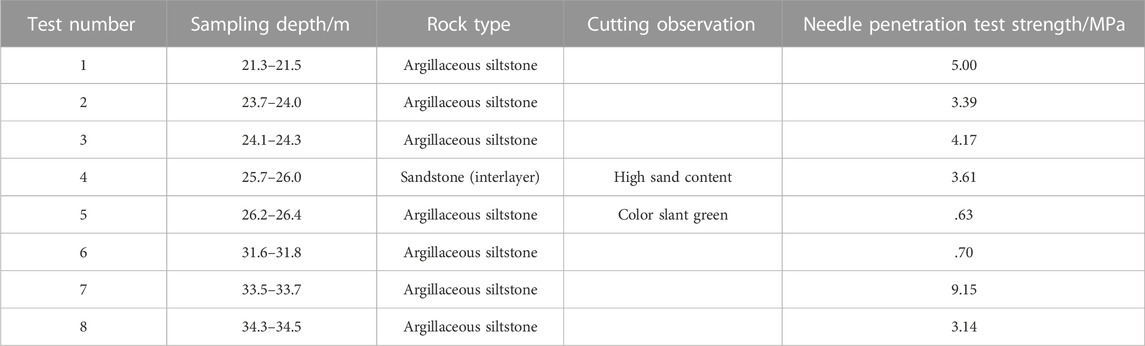
TABLE 2. Test number and needle penetration strength.

FIGURE 12. Needle penetration strength map of mudstone strata at different depths.
The needle penetration intensity in Table 2 and Figure 12 varied greatly. Due to the effects of sand content and soft and hard interbedding, the minimum and maximum compressive strengths were .63 MPa and 9.15 MPa, respectively. This typical severely heterogeneous mudstone stratum was divided into the same stratum with different test indexes.
The non-uniformity of mudstone cannot be judged by subjective feeling but rather should have objective indexes and standards. Therefore, the application of the test index to rocks at the same depth (depth range of 2 m) at the site is recommended to measure rock inhomogeneity. The following two methods can be used to quantitatively determine mudstone inhomogeneity.
The hammer number of the standard penetration test at the same depth in the mudstone layer is used as the criterion. The data obtained from the in situ standard penetration test are simple, objective, and true, which can ensure the accuracy of the results. The encryption test is carried out at the test pile position to reduce the influence of accidental factors on the results. This method has high adaptability and is suitable for most mudstone foundations. Analysis of the two engineering cases in this study illustrated the large difference between the maximum and minimum standard penetration numbers of the foundation-bearing layer, in addition to the non-uniformity of the mudstone. These findings demonstrated the feasibility of determining mudstone inhomogeneity using the standard penetration number.
In addition, the compressive strength obtained by needle penetration tests at the same depth of the mudstone formation can be used as the criterion. The field penetration test is performed directly on the mudstone drill core, which is easy to operate, and the corresponding depth is clear. The average value of the test data on more than three points was taken for each position to ensure the accuracy of the test results. The point load test of rock can also be avoided by obtaining the compressive strength of rock through the needle penetration test.
Mudstone inhomogeneity cannot be determined only by deriving a formula. Based on the aforementioned quantitative testing methods, this study proposes the following comprehensive determination methods.
First, the inhomogeneity index η is defined in the mudstone formation, as shown in Eq. 3:
where Rmax and Rmin represent the maximum and minimum hammer blows in the standard penetration test or the maximum and minimum strength in the needle penetration test.
The inhomogeneity index η of mudstone is similar to the sensitivity of clay. The recommended standards for judging the inhomogeneity of mudstone layers are shown in Table 3.
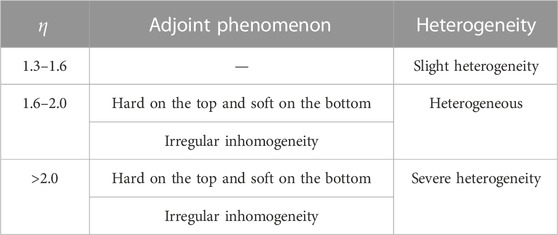
TABLE 3. Suggested criteria for determining mudstone inhomogeneity.
Sufficient attention should be paid to mudstone in the bearing layers of hammer-driven piles judged to be heterogeneous. In cases of severe inhomogeneity, design and construction measures are needed to avoid abnormal bearing capacity.
(1) Inhomogeneity and irregular interbedding between soft and hard mudstone greatly influence the bearing capacity of piles, leading to their abnormal bearing capacity. These factors are often ignored in geotechnical investigations of actual projects, with simple descriptions as homogeneous mudstone, which requires consideration.
(2) The heterogeneous structure of mudstone is easily observed with electronic magnifying glasses, which have the advantages of simple operation, color display, and adjustable magnification, making them superior to SEM.
(3) The method of measuring mudstone inhomogeneity by needle penetration strength is simple and accurate. This method can replace point load strength tests of mudstone and even partially replace the conventional compression test of cylindrical specimens.
(4) The inhomogeneity of mudstone formations can be judged according to the inhomogeneity index obtained from the hammer number in standard penetration tests and the strength in needle penetration tests. The identification of seriously heterogeneous mudstone suggests the need for corresponding engineering technical measures.
The original contributions presented in the study are included in the article/supplementary material. Further inquiries can be directed to the corresponding author.
Writing—original draft: YZ; writing—review and editing: GS and JH; formal analysis: XB; investigation: SS; methodology: NY; conceptualization: MZ; data curation: XG and WL.
This research was supported by the National Natural Science Foundation of China (grant no. 51708316), the Key Program of Natural Science Foundation of Shandong Province (grant no. ZR2020KE009), China Postdoctoral Science Foundation Funding (2018M632641), and the Shandong Provincial Post-doctoral Innovation Project (grant no. 201903043).
XG and WL were employed by Qingdao Zhongjian United Group Co., Ltd.
The remaining authors declare that the research was conducted in the absence of any commercial or financial relationships that could be construed as a potential conflict of interest.
All claims expressed in this article are solely those of the authors and do not necessarily represent those of their affiliated organizations, or those of the publisher, the editors, and the reviewers. Any product that may be evaluated in this article, or claim that may be made by its manufacturer, is not guaranteed or endorsed by the publisher.
Asem, P. (2020). Prediction of unconfined compressive strength and deformation modulus of weak argillaceous rocks based on the standard penetration test. Int. J. Rock Mech. Min. Sci. 133, 104397. doi:10.1016/j.ijrmms.2020.104397
Erguler, Z. A., and Ulusay, R. (2009). Water-induced variations in mechanical properties of clay-bearing rocks. Int. J. Rock Mech. Min. Sci. 46 (2), 355–370. doi:10.1016/j.ijrmms.2008.07.002
Erzin, Y., and Gul, T. O. (2014). The use of neural networks for the prediction of the settlement of one-way footings on cohesionless soils based on standard penetration test. Neural Comput. Appl. 24 (3), 891–900. doi:10.1007/s00521-012-1302-x
Hashemnejad, A., Aghda, S. M. F., and Talkhablou, M. (2021). Introducing a new classification of soft rocks based on the main geological and engineering aspects. Bull. Eng. Geol. Environ. 80 (6), 4235–4254. doi:10.1007/s10064-021-02192-8
Jha, S. K., and Suzuki, K. (2009). Reliability analysis of soil liquefaction based on standard penetration test. Comput. Geotechnics 36 (4), 589–596. doi:10.1016/j.compgeo.2008.10.004
Jiang, Q., Cui, J., Feng, X., and Jiang, Y. (2014). Application of computerized tomographic scanning to the study of water-induced weakening of mudstone. Bull. Eng. Geol. Environ. 73 (4), 1293–1301. doi:10.1007/s10064-014-0597-5
Kahraman, S., Aloglu, A. S., Aydin, B., and Saygin, E. (2017). The needle penetration test for predicting coal strength. J. South. Afr. Inst. Min. Metallurgy 117 (6), 587–591. doi:10.17159/2411-9717/2017/v117n6a9
Kiani, M., Hashemi, M., Ajalloeian, R., and Benavente, D. (2022). Investigating the geological and geomechanical characteristics governing the weathering behavior of Meymand tuff[J]. Environ. Earth Sci. 81 (2), 1–18. doi:10.1007/s12665-022-10169-3
Li, Z., Xu, G., Yuan, J., Huang, P., Zhao, X., Fu, Y., et al. (2016). Application of needle penetrometer to soft rock strength test[J]. Rock Soil Mech. 37, 651–658. (in chinese). doi:10.16285/j.rsm.2016.S1.086
Liu, N., Li, N., Li, G., Song, Z., and Wang, S. (2022a). Method for evaluating the equivalent thermal conductivity of a freezing rock mass containing systematic fractures[J]. Rock Mech. Rock Eng. 55, 7333–7355. doi:10.1016/j.coldregions.2022.103707
Liu, N., Li, N., Wang, S., Li, G., and Song, Z. (2022b). A fully coupled thermo-hydro-mechanical model for fractured rock masses in cold regions. Cold Regions Sci. Technol. 205, 103707. doi:10.1016/j.coldregions.2022.103707
Liu, N., Li, N., Xu, C., Song, Z., and Yang, M. (2020). Mechanism of secondary lining cracking and its simulation for the dugongling tunnel. Rock Mech. Rock Eng. 53 (10), 4539–4558. doi:10.1007/s00603-020-02183-3
Lv, H., Wang, D., Cheng, Z., Zhang, Y., and Zhou, T. (2022). Study on mechanical characteristics and failure modes of coal–mudstone combined body with prefabricated crack. Mathematics 10 (2), 177. doi:10.3390/math10020177
Manouchehrian, A., and Cai, M. (2016). Influence of material heterogeneity on failure intensity in unstable rock failure. Comput. Geotechnics 71, 237–246. doi:10.1016/j.compgeo.2015.10.004
Nejad, F. P., Jaksa, M. B., Kakhi, M., and McCabe, B. A. (2009). Prediction of pile settlement using artificial neural networks based on standard penetration test data. Comput. geotechnics 36 (7), 1125–1133. doi:10.1016/j.compgeo.2009.04.003
Pan, L. (2014). Microscopic features of mudstone images from scanning electron microscopy[J]. Subgr. Eng. 173 (2), 119–122. doi:10.13379/j.issn.1003-8825.2014.02.28
Terente, V., Torres, I., Irvine, J., and Jaeck, C. (2017). “Driven pile design method for weak rock[C],” in Offshore Site Investigation Geotechnics 8th International Conference, United Kingdom, London, 12-09-2017 - 14-09-2017, 652–657.
Ulusay, R., Aydan, Ö., Erguler, Z. A., Ngan-Tillard, D. J. M., Seiki, T., Verwaal, M., et al. (2013). “ISRM suggested method for the needle penetration test[M],” in The ISRM suggested methods for rock characterization, testing and monitoring: 2007-2014 (Cham: Springer), 143–155.
Wu, L., Wang, Z., Ma, D., Zhang, J. W., Wu, G., Wen, S., et al. (2022). A continuous damage statistical constitutive model for sandstone and mudstone based on triaxial compression tests[J]. Rock Mech. Rock Eng. 55, 4963–4978. doi:10.1007/s00603-022-02924-6
Xu, T., and Li, S. (2004). Testing study on bearing capacity of pipe piles with bearing stratum of mudstone[J]. Chin. J. Rock Mech. Eng. 23 (2), 329–333. (in chinese). doi:10.3321/j.issn:1000-6915.2004.02.031
Yang, Y., Zhou, J., Xu, F., and Xing, H. (2016). An experimental study on the water-induced strength reduction in zigong argillaceous siltstone with different degree of weathering. Adv. Mater. Sci. Eng. 2016, 1–12. doi:10.1155/2016/4956986
Yao, Z., Xu, G., Zhu, Z., Wang, K., and Hu, X. (2015). Application of pin-penetration test to mudstone in wuhan area[J]. Constr. Technol. 44 (S2), 66–68. (in chinese).
Zeng, L., Luo, J. T., Liu, J., Gao, Q. F., and Bian, H. B. (2021). Disintegration characteristics and mechanisms of carbonaceous mudstone subjected to load and cyclic drying–wetting. J. Mater. Civ. Eng. 33 (8), 04021195. doi:10.1061/(asce)mt.1943-5533.0003817
Zhang, L., and Chen, J. J. (2012). Effect of spatial correlation of standard penetration test (SPT) data on bearing capacity of driven piles in sand. Can. Geotechnical J. 49 (4), 394–402. doi:10.1139/t2012-005
Zhang, X., Li, R., Zheng, Y., Zeng, Z., and Li, G. (2016). Field experimental study on prestressed concrete tube-pile bearing stratum softening in strong weathered rock formation of Shunde area[J]. Sci. Sin. Technol. 46 (9), 975–986. (in chinese). doi:10.1360/N092015-00328
Zhang, X., Liu, X., Chen, C., Kong, L., and Wang, G. (2020). Engineering geology of residual soil derived from mudstone in Zimbabwe. Eng. Geol. 277, 105785. doi:10.1016/j.enggeo.2020.105785
Keywords: mudstone, inhomogeneity, penetration strength, pile-bearing capacity, driven pile
Citation: Zhang Y, Sun G, Bai X, Sang S, Han J, Yan N, Zhang M, Gao X and Li W (2023) Bearing capacity of driven pile and determination of inhomogeneous mudstone around the pile. Front. Earth Sci. 10:1101955. doi: 10.3389/feart.2022.1101955
Received: 18 November 2022; Accepted: 09 December 2022;
Published: 04 January 2023.
Edited by:
Naifei Liu, Xi’an University of Architecture and Technology, ChinaCopyright © 2023 Zhang, Sun, Bai, Sang, Han, Yan, Zhang, Gao and Li. This is an open-access article distributed under the terms of the Creative Commons Attribution License (CC BY). The use, distribution or reproduction in other forums is permitted, provided the original author(s) and the copyright owner(s) are credited and that the original publication in this journal is cited, in accordance with accepted academic practice. No use, distribution or reproduction is permitted which does not comply with these terms.
*Correspondence: Xiaoyu Bai, YmFpeGlhb3l1NTM4QDE2My5jb20=
Disclaimer: All claims expressed in this article are solely those of the authors and do not necessarily represent those of their affiliated organizations, or those of the publisher, the editors and the reviewers. Any product that may be evaluated in this article or claim that may be made by its manufacturer is not guaranteed or endorsed by the publisher.
Research integrity at Frontiers
Learn more about the work of our research integrity team to safeguard the quality of each article we publish.