 Hui Li
 Yuting Wang
 Chi Wang
95% of researchers rate our articles as excellent or good
Learn more about the work of our research integrity team to safeguard the quality of each article we publish.
Find out more
ORIGINAL RESEARCH article
Front. Earth Sci. , 04 January 2023
Sec. Atmospheric Science
Volume 10 - 2022 | https://doi.org/10.3389/feart.2022.1101252
This article is part of the Research Topic Asian Monsoon: Drivers and Forcings in a Changing Climate View all 5 articles
In the context of more frequent extreme precipitation worldwide, the Sun’s influence on global or regional rainfall patterns has attracted much attention. Due to its vital importance to Chinese industrial and agricultural production, the precipitation property in the mid-lower reaches of the Yangtze River (MLRYR) remains a hot issue. Although previous works have implied the plausible influence of solar activity on precipitation in the mid-lower reaches of the Yangtze River, the time-lagged effect is still an open question. In this paper, we adopt the China-Z index (CZI) to represent the original precipitation data, which is proposed to monitor moisture conditions over China and is more sensitive to solar activity. We explore the lagged correlations between summer precipitation in the mid-lower reaches of the Yangtze River and solar activity. The China-Z index in June-July is negatively correlated with the sunspot number in July of the preceding year, giving a time lag of 11 months. Based on the composite analysis, we suggest that solar activity possibly modulates the precipitation by influencing the local moisture and its vertical movement through the sea-land thermal contrast and the associated East Asian summer monsoon on a much larger scale.
Global warming is usually suggested to be responsible for the more frequent extreme precipitation worldwide. Considering a 4°C global warming, the occurrence rates of 10-year and 50-year events are likely 2–3 times than in the recent past (Seneviratne et al., 2021). As the major external energy source of the Earth, the Sun’s influences on the Earth’s precipitation have attracted many concerns in recent 10 years. On the one hand, the time series of precipitation contain the same period signals of solar activity of weak statistical significance (Zhai, 2017; Heredia et al., 2019; Nitka and Burnecki, 2019). On the other hand, solar activity can modulate precipitation through multiple physical processes, which can be shortly summarized as follows: 1) The total solar irradiance (TSI) influences the sea surface temperature (SST) and changes the atmospheric circulations through air-sea interactions (Reid, 1991; Soon et al., 1996); 2) Solar ultraviolet radiation absorbed by stratospheric ozone causes the temperature gradient, changes the Brewer-Dobson circulation, and further alters the lower atmosphere through the interaction between the troposphere and the stratosphere (Baldwin and Dunkerton, 2005; Butchart, 2014); 3) Galactic cosmic rays influence the formation of cloud condensation nuclei (Svensmark, 2007) and ultimately affect the precipitation.
The effects of solar activity on precipitation are very complicated, reflected in the varying correlations with time scales and regions. Some studies directly focus on solar activity indices to investigate the effects. For example, both the summer precipitation in the plum rain area and the late winter precipitation in southern China are negatively correlated with the solar activity represented by the sunspot number (SSN) (Zhao and Wang, 2014; Zhao et al., 2017; Ma et al., 2019). However, the precipitation in other regions, e.g., India, Northeast Asia, and the Southern Chinese Loess Plateau, may positively correlate with the solar indices, such as the solar 10.7 cm irradiation (F10.7) and the total solar irradiance (Claud et al., 2008; Song et al., 2019; Yu et al., 2019). Other studies focus on the space weather effects caused by solar activity. Suparta et al. (2008) finds the ionosphere total electron content (TEC) enhancement can increase the precipitable water vapor in Antarctica during geomagnetic storms. Prikryl et al. (2021) investigates the climate effect of co-rotating interaction region (CIR), which may lead to heavy rain in many regions.
The mid-lower reaches of the Yangtze River (MLRYR) are in the East Asia monsoon region. The drought and flood disasters in this region could cause severe damage to industrial and agricultural production (Zhang and Wang, 2022). Zhao and Wang (2014); Zhao et al. (2017) present evidence of a northward shift or expansion of the rain band in the MLRYR in the solar maximum. They explain the correlations with up-down and bottom-up mechanisms. However, to advance the development of more accurate forecasting, solar signals prior to precipitation should be captured. By studying the precipitation in Europe, Laurenz et al. (2019) suggests the existence of time-lagged effects between solar activity and precipitation but does not consider the physical mechanism. The time-lagged effect between solar activity and precipitation in the MLRYR is also an open question.
In this paper, we adopt the China-Z index (CZI) as the precipitation index and discuss its sensitivity to solar activity. We explore the relationship between solar activity and precipitation in the MLRYR, focusing on the time-lagged response. In addition, a preliminary physical interpretation of the lagged response is also discussed.
We use the monthly mean SSN, F10.7, and solar wind energy flux (Ein) to characterize the variation of solar activity. The data set of SSN, from 1749 to the present, is obtained from the sunspot Index and Long-term Solar Observations of the World Data Center, Royal Observatory of Belgium, Brussels (https://www.sidc.be/silso/datafiles). The data set of F10.7, from 1948 to 2020, is from the National Centers for Environmental Information of the National Oceanic and Atmospheric Administration (https://psl.noaa.gov/data/correlation/solar.data). The data set of solar wind energy flux Ein, from 1963 to 2020, is derived from the empirical formula proposed by Wang et al. (2014).
The precipitation observation over 160 Chinese stations, from 1951 to 2019, is from the National Climate Center of China. Among them, 15 stations are selected to represent the MLRYR, shown in Figure 1A. Figure 1B gives the corresponding climatology of monthly precipitation in the MLRYR. Abundant precipitation occurs during the warm season, which is the main characteristic of a monsoonal climate. In this study, we focus on the precipitation from May to July.
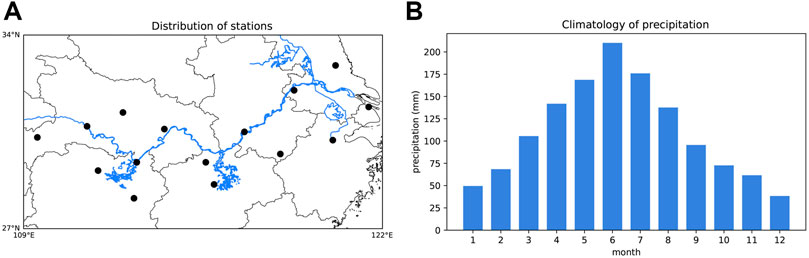
FIGURE 1. (A) Station distribution in the MLRYR. (B) Precipitation climatology during 1951–2019 in the MLRYR.
Many indices are proposed to characterize precipitation. Precipitation anomaly percentage eliminates the effect of regional difference and is commonly used by meteorological departments. It is calculated by precipitation anomaly of a certain year divided by local multi-year average precipitation. To better represent the degree of drought and flood throughout China, the China-Z index (CZI) has been proposed by the National Meteorological Centre of China (Ju et al., 1997; Wu et al., 2001). It could rapidly respond when precipitation changes significantly and has been widely used in many studies (Wu et al., 2001; Morid et al., 2006). Compared with the standardized precipitation index (SPI) (McKee et al., 1993), the calculation of CZI is much simpler and more flexible for regions with missing data (Wu et al., 2001). Since the monthly precipitation X generally follows the single-peaked, asymmetric Person Type III distribution, we first convert it to a normal distribution by eliminating the skewness and then obtain CZI as proposed by Ju et al. (1997):
φi is the normalized precipitation for the ith year:
where Xi represents the median precipitation in the MLRYR for the ith year. σ is the standard deviation of Xi. Cs is the coefficient of skewness:
Tropospheric meteorological data are obtained from the fifth generation atmospheric reanalysis (ERA5) dataset from European Centre for Medium-Range Weather Forecasts (https://cds.climate.copernicus.eu/cdsapp#!/search?type=dataset&text=ERA5), e.g., the monthly wind velocity (u, v, ω) and specific humidity q) on several pressure levels from 1,000 to 300 hPa, the SST, and the land temperature at the height of 2 m (T2m). All the data sets are from 1950 to 2020, with a horizontal resolution of 1°.
The El Niño-Southern Oscillation (ENSO) event is a typical climatic factor affecting the precipitation in the MLRYR (Yu et al., 2001). Here, we adopt the Niño 3.4 index (1950–2021) as a proxy of ENSO activity, reflecting the state of SST in the equatorial central and East Pacific (5°N–5°S, 170°–120°W). The data is obtained from the Climate Data Guide of the National Center for Atmospheric Research (Trenberth, 2020).
Moisture flux and flux divergence (D) are used to diagnose the conditions of precipitation. Moisture flux
where g is the acceleration of gravity, p0 is 1,000 hPa and p1 is 300 hPa.
The composite analysis is adopted to compare the meteorological phenomenon between solar maximum and solar minimum. The first step of composite analysis is to identify the years of solar maximum and solar minimum. The solar maximum is defined as the years with the standardized SSN ≥1.0, and the solar minimum is defined as the years with standardized SSN ≤ −1.0 in this study. The second step is to determine the anomaly of solar maximum and solar minimum, which is the arithmetic means in the solar maximum and minimum by subtracting the mean values of all years.
The bootstrap test is applied to quantitatively test the statistical significance of the composite analysis. It is a non-parametric method proposed by Efron (1979) that replaces the overall distribution with an empirical distribution. Firstly, we take random samples of the original data set (with replacement) of the same sizes as solar maximum and solar minimum. Secondly, we calculate the bootstrap distribution of the anomalies for each set of re-samples by repeating the first step 2000 times. Thirdly, we determine the confidence interval for the anomalies. The changes in climate parameters are qualified to be significant when the anomalies in solar maximum or solar minimum are beyond the confidence intervals.
The climate parameters, such as the SST, the wind velocity, and the atmospheric pressure, respond to solar activity with a time lag of 1–3 years, according to previous studies (Kodera and Shibata, 2006; He et al., 2018, 2019; Huo et al., 2021). Inspired by these findings, we calculate the Pearson correlation coefficients (CC) between the CZI and other parameters by considering a time lag ranging from 0 to 24 months, shown in Figures 2A–D. In general, the CZI in June-July presents a more clear correlation with solar activity than the ENSO event. The mean value of CC is 0.161, −0.240, −0.224, −0.029, for Niño 3.4, SSN, F10.7, and Ein, respectively. For Niño 3.4, the peak positive correlation appears when the time lag increases to 14 months. The peak value, 0.236, is still less than the threshold value of 99% confidence level, 0.306. For SSN, an overall negative correlation presents most of the time lags. The peak value, −0.308, with a time lag of 11 months, satisfies the significant test of 99% confidence level. That is, the SSN in July of the preceding year is negatively correlated with the precipitation in June-July of the current year. The results for F10.7, shown in Figure 2C, are analogous to the situation of SSN, with insignificant decreases in the correlation coefficients. The results for TSI are similar to that of SSN and are not shown here. In addition, the relationship between the CZI and the solar wind energy flux Ein is not clear. Sometimes, they are negatively correlated. And sometimes, they are positively correlated. But all the correlation coefficients do not pass the significant test of 99% confidence level. Figure 2E presents the normalized CZI in June-July and SSN in the preceding July (11 months ahead). The negative correlation is obvious, with a CC of −0.308.
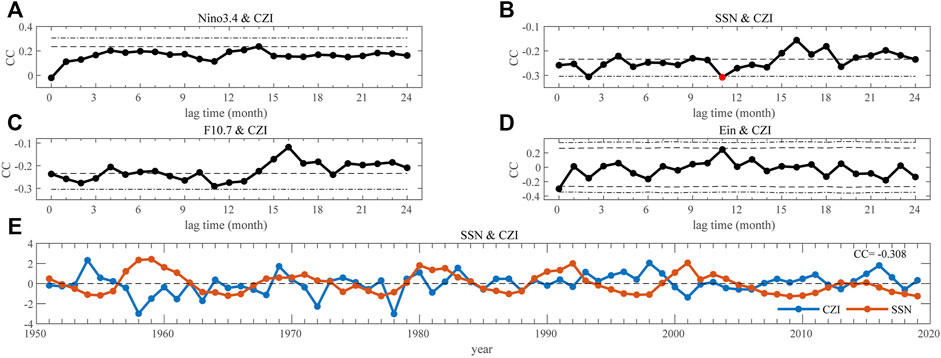
FIGURE 2. Pearson correlation coefficients (CC) between precipitation in June-July and other indices by considering the time-lagged effect. (A) Niño3.4 (B) SSN, (C) F10.7, and (D) Ein. The black dashed (dot-dashed) lines denote the 95% (99%) confidence level. The red dots denote the most statistically significant situation. (E) Normalized SSN (red, 11 months ahead) and the CZI (blue).
The composite analysis is performed to explore the effect of solar activity on the spatial distribution of precipitation in China. Figure 3A gives the normalized SSN in July of the preceding year, which is 11 months ahead of precipitation. The pink bars denote that the SSN is greater than the mean value, and the blue bars denote that the SSN is less than the mean value. The years with a normalized SSN greater than 1 are defined as the solar maximum, and the years with a normalized SSN less than −1 are defined as the solar minimum. In solar maximum, the precipitation in the MLRYR is much less (up to −30%) than the average of the entire data set, as shown in Figure 3C. In solar minimum, the Huaihe River divides the precipitation in eastern China into two parts, with the flood in the south, and the drought in the north. The precipitation in the mainstream of the Yangtze River is not prominent but is mainly concentrated in southeastern coastal areas, as shown in Figure 3D. Figure 3B gives the difference between solar maximum and solar minimum. Drought and flood are severer both in the MLRYR and Shandong province. Such a precipitation pattern is also in accord with the rain band movement features given by Zhao and Wang (2014) and Zhao et al. (2017).
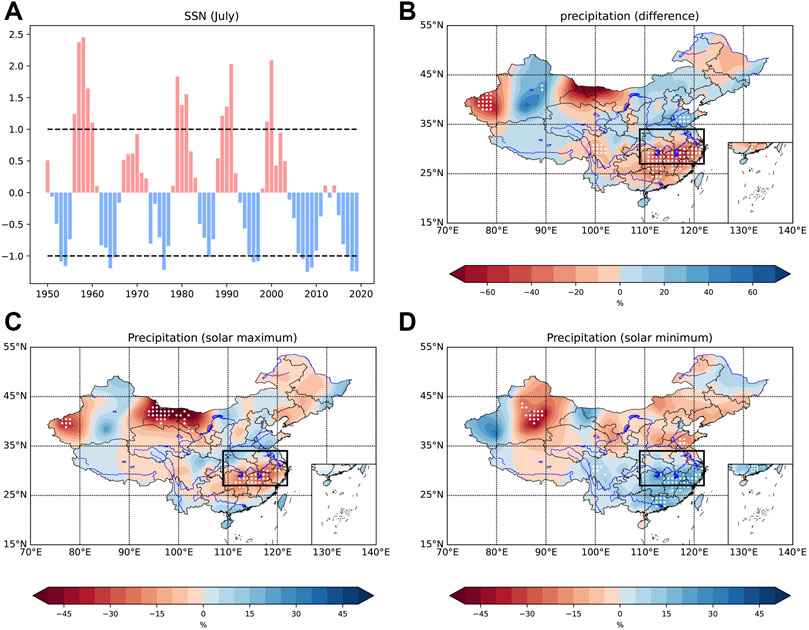
FIGURE 3. Normalized SSN (A) and composite map of precipitation anomaly percentage: (B) the difference between solar maximum and minimum, (C) in solar maximum, (D) in solar minimum. White dotted regions indicate significant correlations satisfying the 95% confidence level. The range of the MLRYR (rectangle) is consistent with Figure 1A.
Abundant moisture and ascending motion are two major macroscopic conditions for precipitation. To understand the spatial distribution of precipitation shown in Figure 3, similar composite analyses for these two parameters are performed and shown in Figure 4. Note that these two parameters are at the same time as precipitation, 11 months later than the solar activity. The moisture flux with its divergence and 500 hPa vertical motion (ω) is quite different from the solar maximum to the solar minimum. In solar maximum, as shown in Figure 4A, there is a moisture divergence in the MLRYR and a moisture convergence in the Huanghuai region. The moisture is transported from the Yangtze River to the Huanghuai region, making the MLRYR drier. Additionally, from the anomaly of the atmospheric motion shown in Figure 4C, it is clear that a descending motion anomaly dominates in the MLRYR and an ascending motion anomaly dominates in the Huanghuai region, which is not favorable for heavy rain in the MLRYR. In solar minimum, as shown in Figure 4B, there exist two channels of moisture flux that converge in the MLRYR. One is from the Bohai Sea, and the other one is from India and the South China Sea. In addition, the ascending motion in the MLRYR, represented by blue in Figure 4D, can lift water vapors to form clouds, which is more favorable for precipitation.
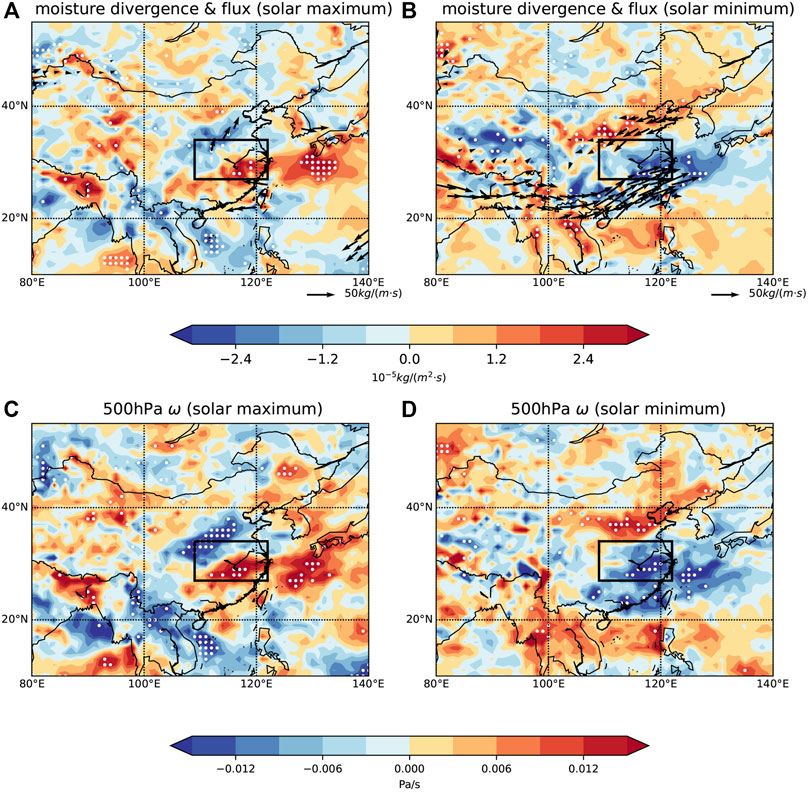
FIGURE 4. Composite map of vertically integrated (from 1,000 to 300 hPa) moisture flux (arrow) with its divergence (colored) in solar maximum (A) and in solar minimum (B). Composite map of 500 hPa atmospheric vertical velocity (ω) in solar maximum (C) and in solar minimum (D). The moisture flux divergence in red/blue represents divergence/convergence. The ω in red/blue represents descending/ascending motion. White dotted regions and the black arrows indicate significant correlations satisfying the 95% confidence level. The range of the MLRYR (rectangle) is consistent with Figure 1A.
To further investigate the driving factors of precipitation, we also perform the composite analysis for the sea-land thermal contrast and the associated wind field. Figure 5 shows the difference in the temperature both on the sea surface (SST) and the land at the height of 2 m (T2m) and the 500 hPa wind field between solar maximum and solar minimum. The trends of the land and the sea temperature around the MLRYR are opposite. In solar maximum, the SST in the West Pacific and the North Indian Ocean is colder, and the land temperature (T2m) in the MLRYR is warmer. These properties lead to an enhancement of the sea-land thermal contrast and a stronger monsoon. In solar maximum, the wind blows from the north Indian Ocean, across the South China sea, to north of the MLRYR. These results are consistent with the results shown in Figure 4.
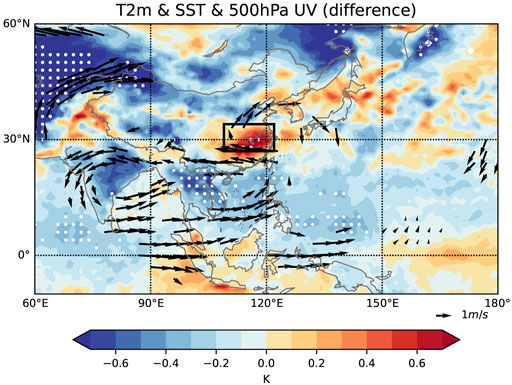
FIGURE 5. Composite map of T2m (land) and SST (sea) difference between solar maximum and solar minimum. The arrows indicate the direction and strength of the 500 hPa wind field. The arrows and dotted regions indicate significant correlations satisfying the 95% confidence level. The range of the MLRYR (rectangle) is consistent with Figure 1A.
Colder SST in solar maximum seems to be counter-intuitive because solar radiation is expected to increase when the Sun is more active. However, the variation amplitude of TSI within a solar cycle is not significant, only about 1 W m−2 or 0.1% (Fröhlich, 2011). Such an insignificant enhancement in TSI can affect the SST in a limited way. Cloud cover is more likely to be the influencing factor. Li et al. (2019) shows that the SST anomaly is well anti-correlated with the annual mean total cloud cover anomaly, which is reasonable due to the existence of cloud-radiation feedback. Besides, the dynamic processes in the ocean are complex and may change the SST distribution as well.
Previous sections present the time-lagged correlation between solar activity and precipitation in the MLRYR in June-July, with a leading period of 11 months. The equatorial ocean plays a vital role in MLRYR climate mode. It takes time to change the ocean states in response to solar forcing. Xiao et al. (2015) shows that the ENSO phenomenon is the leading driver of precipitation in MLRYR. The SST variation in solar maximum from nearly 1 year ahead of the precipitation is also investigated. From the preceding July, we obtain the composite map of the SST for every 3 months, as shown in Figure 6. In the autumn and winter of the preceding year, the equatorial East Pacific gets much colder than the equatorial West Pacific in solar maximum, giving a La Niña mode. In the spring and summer of the current year, the situations are opposite. The equatorial East Pacific gets much warmer than the equatorial West Pacific in solar maximum, giving an El Niño mode. Similar results are also obtained by (Meehl and Arblaster, 2009). They suggest that wind-forced ocean Rossby waves initiated by the dynamical coupled processes in solar maximum propagate to the West Pacific in about 1 year. Li et al. (2019) also found a 1-year time delay of the modulation of Ein on tropical cyclone activities and suggested that the lifetime of ring current ions could be responsible for this time lag.
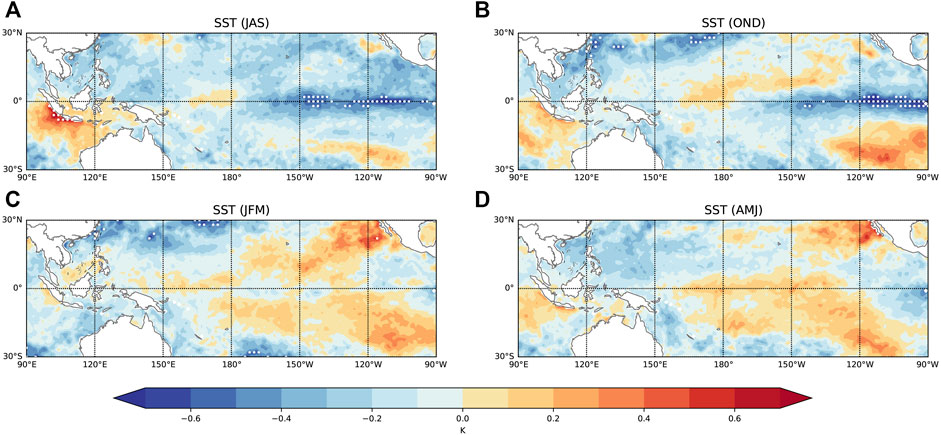
FIGURE 6. Composite map of SST difference between solar maximum and solar minimum in (A) the preceding July-August-September, (B) the preceding October-November-December, (C) the current January-February-March, and (D) the current April-May-June. Dotted regions indicate significant correlations satisfying the 95% confidence level.
As shown above, the SST can also be modulated by solar activity. Roy and Collins (2015) suggest that the ENSO signal is convolved with the solar forcing signal. Wang et al. (2021) found that the combined effects of ENSO and solar activity can enhance the winter precipitation in southern China. To accurately understand the impact of solar activity, it is better to remove the ENSO signal in precipitation. Lean and Rind (2008); Roy and Haigh (2010); Ma et al. (2019) propose an approach that uses the multiple linear regression analysis and only keeps the regression coefficient of solar activity. This should be applied in future work.
\In the previous section, we present the clear correlation between solar activity and the CZI in June-July. Here gives the results in May. Different from the CZI in June-July, the CZI in May presents a more significant correlation with ENSO events than the solar activity indices. This agrees with the finding that SST in the West Pacific could indeed modulate the following precipitation in China (Yu et al., 2001).
In Figure 7A, the CZI in May positively correlates with the Niño 3.4 index when the time lag is between 3 and 10 months, implying the persistence of the impact of ENSO activity on precipitation. The peak value of CC is 0.319, for a time lag of 10 months, which satisfies the significant test of 99% confidence level. As the time lag increases, the CC decreases gradually and turns negative, remaining at about -0.16. For SSN, F10.7 and Ein shown in Figures 7B–D, the CC all decreases with the time lag and does not satisfy the significant test of 99% confidence level. Figure 7E shows the positive correlation between CZI in May and Niño 3.4 in July of the preceding year (10 months ahead), with a CC of 0.319. The trends of these two curves are very synchronized, especially from 1960 to 1980.
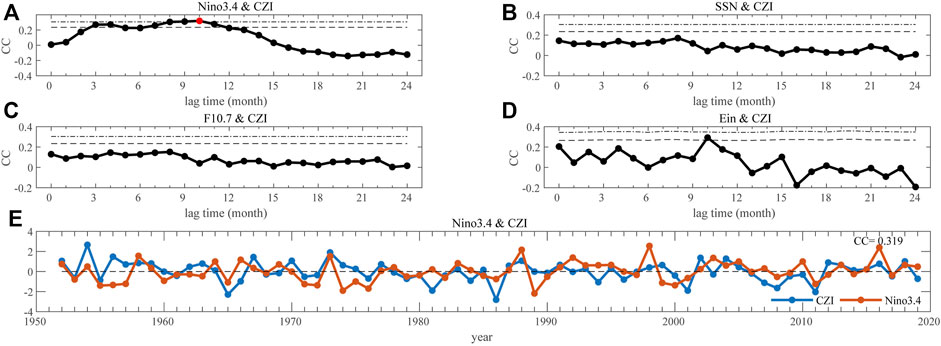
FIGURE 7. Pearson correlation coefficients (CC) between precipitation in June-July and other indices by considering the time-lagged effect. (A) Niño3.4 (B) SSN, (C) F10.7, and (D) Ein. The black dashed (dot-dashed) lines denote the 95% (99%) confidence level. The red dots denote the most statistically significant situation. (E) Normalized SSN (red, 10 months ahead) and the CZI (blue).
Precipitation in May responds differently to solar activity than in June-July, indicating a different physical mechanism but this is beyond the scope of this work.
The CZI is more suitable for studying the solar impact on rainfall patterns in the MLRYR compared with the original precipitation data. Figure 8 compares the results by using the CZI and the original precipitation data. For precipitation in June-July, the absolute correlation coefficient between the CZI and SSN is much higher than the corresponding values when the original precipitation data is used. The peak correlation coefficient can even satisfy the 99% confidence level with a time lag of 11 months. However, the peak value can not satisfy the 95% confidence level when the original precipitation data is used. For precipitation in May, the improvement of the correlation coefficient by using the CZI is similar but very limited.
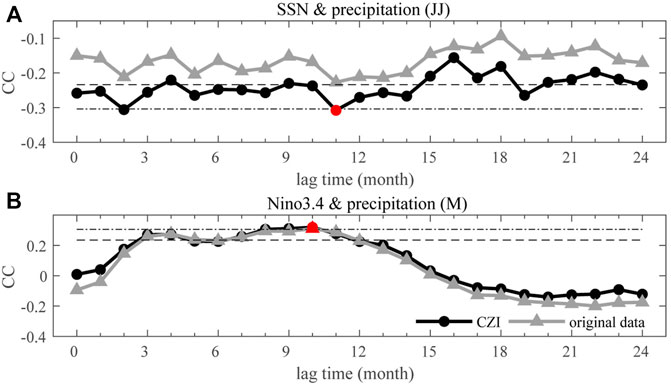
FIGURE 8. (A) Time-Lagged correlations between precipitation in June-July and SSN. (B) Precipitation in May and Niño 3.4. The gray curves with triangles denote correlations using the original precipitation data, and the black curves with circles denote correlations using the CZI. The black dashed (dot-dashed) lines denote the 95% (99%) confidence level. The red dots denote the most statistically significant situation.
In this paper, we investigate the time-lagged correlations between solar activity and summer precipitation in the MLRYR for the first time. We adopt a new precipitation index, CZI, which performs better than the original precipitation data in response to solar activity. Over the three solar activity indices, SSN, F10.7, and Ein, the SSN has the strongest correlation with precipitation. It is negatively correlated with SSN in June-July, with a time lag of 11 months. The composite analysis is performed to explore the effect of solar activity on the spatial distribution of precipitation in China. Moisture, ascending motion, and sea-land thermal contrast in solar maximum and minimum are also investigated to explain the precipitation distribution pattern. A possible influence path is that solar activity can change the SST distribution and adjust atmospheric circulation, affect the East Asia summer monsoon and finally modulate the precipitation. The lagged response of the ocean leads to a lagged response of precipitation, and this lagged effect may be caused by the propagation of the ocean Rossby wave. This lagged response may be instructive for precipitation forecasts, and more detailed work will be carried out in the future.
The original contributions presented in the study are included in the article/Supplementary Material, further inquiries can be directed to the corresponding author.
HL contributed to the study designing, data interpreting, and manuscript revising. YW contributed to the data processing and manuscript drafting. CW contributed to the data interpreting and manuscript revising.
This work is supported by NNSFC grants (42022032, 41874203, and 42188101), project of Civil Aerospace “13th Five Year Plan” Preliminary Research in Space Science (D020301, D030202), Strategic Priority Research Program of CAS (Grant No. XDA17010301), and Key Research Program of Frontier Sciences CAS (Grant No. QYZDJ-SSW-JSC028). HL is also supported by International Partnership Program of CAS (Grant No. 183311KYSB20200017) and in part by the Specialized Research Fund for State Key Laboratories of China.
We thank the NCC, NCAR, and ECMWF for providing the meteorological data. We also thank Tao Wang from the Institute of Atmospheric Physics, Chinese Academy of Sciences, for the helpful discussion.
The authors declare that the research was conducted in the absence of any commercial or financial relationships that could be construed as a potential conflict of interest.
All claims expressed in this article are solely those of the authors and do not necessarily represent those of their affiliated organizations, or those of the publisher, the editors and the reviewers. Any product that may be evaluated in this article, or claim that may be made by its manufacturer, is not guaranteed or endorsed by the publisher.
The Supplementary Material for this article can be found online at: https://www.frontiersin.org/articles/10.3389/feart.2022.1101252/full#supplementary-material
Baldwin, M. P., and Dunkerton, T. J. (2005). The solar cycle and stratosphere–troposphere dynamical coupling. J. Atmos. Solar-Terrestrial Phys. 67, 71–82. doi:10.1016/j.jastp.2004.07.018
Butchart, N. (2014). The brewer-dobson circulation. Rev. Geophys. 52, 157–184. doi:10.1002/2013RG000448
Claud, C., Duchiron, B., and Terray, P. (2008). On associations between the 11-year solar cycle and the indian summer monsoon system. J. Geophys. Res. 113, D09105. doi:10.1029/2007JD008996
Darand, M., and Pazhoh, F. (2019). Vertically integrated moisture flux convergence over Iran. Clim. Dyn. 53, 3561–3582. doi:10.1007/s00382-019-04726-z
Efron, B. (1979). Bootstrap methods: Another look at the jackknife. Ann. Statistics 7, 1–26. doi:10.1214/aos/1176344552
Fröhlich, C. (2011). Total solar irradiance: What have we learned from the last three cycles and the recent minimum? Space Sci. Rev. 176, 237–252. doi:10.1007/s11214-011-9780-1
He, S.-P., Wang, H.-J., Gao, Y.-Q., Li, F., Li, H., and Wang, C. (2018). Influence of solar wind energy flux on the interannual variability of enso in the subsequent year. Atmos. Ocean. Sci. Lett. 11, 165–172. doi:10.1080/16742834.2018.1436367
He, S., Wang, H., Li, F., Li, H., and Wang, C. (2019). Solar-wind–magnetosphere energy influences the interannual variability of the northern-hemispheric winter climate. Natl. Sci. Rev. 7, 141–148. doi:10.1093/nsr/nwz082
Heredia, T., Bazzano, F. M., Cionco, R. G., Soon, W., Medina, F. D., and Elias, A. G. (2019). Searching for solar-like interannual to bidecadal effects on temperature and precipitation over a southern hemisphere location. J. Atmos. Solar-Terrestrial Phys. 193, 105094. doi:10.1016/j.jastp.2019.105094
Huo, W., Xiao, Z., Wang, X., and Zhao, L. (2021). Lagged responses of the tropical Pacific to the 11-yr solar cycle forcing and possible mechanisms. J. Meteorological Res. 35, 444–459. doi:10.1007/s13351-021-0137-8
Ju, X., Yang, X., Chen, L., and Wang, Y. (1997). Research on determination of station indexes and division of regional flood/drought grades in China. Q. J. Appl. Meteorology 8, 8.
Kodera, K., and Shibata, K. (2006). Solar influence on the tropical stratosphere and troposphere in the northern summer. Geophys. Res. Lett. 33, L19704. doi:10.1029/2006GL026659
Laurenz, L., Lüdecke, H.-J., and Lüning, S. (2019). Influence of solar activity changes on European rainfall. J. Atmos. Solar-Terrestrial Phys. 185, 29–42. doi:10.1016/j.jastp.2019.01.012
Lean, J. L., and Rind, D. H. (2008). How natural and anthropogenic influences alter global and regional surface temperatures: 1889 to 2006. Geophys. Res. Lett. 35, L18701. doi:10.1029/2008GL034864
Li, H., Wang, C., He, S., Wang, H., Tu, C., Xu, J., et al. (2019). Plausible modulation of solar wind energy flux input on global tropical cyclone activity. J. Atmos. Solar-Terrestrial Phys. 192, 104775. doi:10.1016/j.jastp.2018.01.018
Ma, H., Chen, H., Lai, A., Li, X., Wang, R., and Gao, C. (2019). Robust solar signature in late winter precipitation over southern China. Geophys. Res. Lett. 46, 9940–9948. doi:10.1029/2019GL084083
McKee, T. B., Doesken, N. J., and Kleist, J. R. (1993). “The relationship of drought frequency and duration to time scales,” in 8th conference on applied climatology (Anaheim.
Meehl, G. A., and Arblaster, J. M. (2009). A lagged warm event–like response to peaks in solar forcing in the Pacific region. J. Clim. 22, 3647–3660. doi:10.1175/2009JCLI2619.1
Morid, S., Smakhtin, V., and Moghaddasi, M. (2006). Comparison of seven meteorological indices for drought monitoring in Iran. Int. J. Climatol. 26, 971–985. doi:10.1002/joc.1264
Nitka, W., and Burnecki, K. (2019). Impact of solar activity on precipitation in the United States. Phys. A Stat. Mech. its Appl. 527, 121387. doi:10.1016/j.physa.2019.121387
Prikryl, P., Rušin, V., Prikryl, E. A., Šťastný, P., Turňa, M., and Zeleňáková, M. (2021). Heavy rainfall, floods, and flash floods influenced by high-speed solar wind coupling to the magnetosphere–ionosphere–atmosphere system. Ann. Geophys. 39, 769–793. doi:10.5194/angeo-39-769-2021
Reid, G. C. (1991). Solar total irradiance variations and the global sea surface temperature record. J. Geophys. Res. 96, 2835. doi:10.1029/90JD02274
Roy, I., and Collins, M. (2015). On identifying the role of sun and the el niño southern oscillation on indian summer monsoon rainfall. Atmos. Sci. Lett. 16, 162–169. doi:10.1002/asl2.547
Roy, I., and Haigh, J. D. (2010). Solar cycle signals in sea level pressure and sea surface temperature. Atmos. Chem. Phys. 7, 3147–3153. doi:10.5194/acp-10-3147-2010
Seneviratne, S., Zhang, X., Adnan, M., Badi, W., Dereczynski, C., Di Luca, A., et al. (2021). “Weather and climate extreme events in a changing climate,” in Climate change 2021: The physical science basis. Contribution of working group I to the sixth assessment report of the intergovernmental panel on climate change. Editors V. Masson-Delmotte, P. Zhai, A. Pirani, S. Connors, C. Péan, S. Bergeret al. (Cambridge, United Kingdom and New York, NY, USA: Cambridge University Press), 1513–1766. doi:10.1017/9781009157896.013
Song, Y., Li, Z., Gu, Y., Liou, K.-N., Zhang, X., and Xiao, Z. (2019). The effect of solar cycle on climate of northeast Asia. J. Meteorological Res. 33, 885–894. doi:10.1007/s13351-019-8132-z
Soon, W. H., Posmentier, E. S., and Baliunas, S. L. (1996). Inference of solar irradiance variability from terrestrial temperature changes, 1880–1993: An astrophysical application of the sun-climate connection. Astrophysical J. 472, 891–902. doi:10.1086/178119
Suparta, W., Abdul Rashid, Z. A., MohdAli, M. A., Yatim, B., and Fraser, G. J. (2008). Observations of Antarctic precipitable water vapor and its response to the solar activity based on gps sensing. J. Atmos. Solar-Terrestrial Phys. 70, 1419–1447. doi:10.1016/j.jastp.2008.04.006
Svensmark, H. (2007). Cosmoclimatology: A new theory emerges. Astronomy Geophys. 48, 1.18–1.24. doi:10.1111/j.1468-4004.2007.48118.x
Wang, C., Han, J. P., Li, H., Peng, Z., and Richardson, J. D. (2014). Solar wind-magnetosphere energy coupling function fitting: Results from a global mhd simulation. J. Geophys. Res. Space Phys. 119, 6199–6212. doi:10.1002/2014JA019834
Wang, R., Ma, H., Xiao, Z., Li, X., Gao, C., Gao, Y., et al. (2021). The combined effects of enso and solar activity on mid-winter precipitation anomalies over southern China. Front. Earth Sci. 9, 771234. doi:10.3389/feart.2021.771234
Wu, H., Hayes, M. J., Weiss, A., and Hu, Q. (2001). An evaluation of the standardized precipitation index, the China-z index and the statistical z-score. Int. J. Climatol. 14, 745–758. doi:10.1002/joc.658
Xiao, M., Zhang, Q., and Singh, V. P. (2015). Influences of enso, nao, iod and pdo on seasonal precipitation regimes in the yangtze river basin, China: Influences of enso regimes on precipitation. Int. J. Climatol. 35, 3556–3567. doi:10.1002/joc.4228
Yu, R., Zhang, M., Yu, Y., and Liu, Y. (2001). Summer monsoon rainfalls over mid-eastern China lagged correlated with global ssts. Adv. Atmos. Sci. 18, 179–196. doi:10.1007/s00376-001-0012-6
Yu, X., Wang, Y., Yu, S., and Kang, Z. (2019). Synchronous droughts and floods in the southern Chinese loess plateau since 1646 ce in phase with decadal solar activities. Glob. Planet. Change 183, 103033. doi:10.1016/j.gloplacha.2019.103033
Zhai, Q. (2017). Influence of solar activity on the precipitation in the north-central China. New Astron. 51, 161–168. doi:10.1016/j.newast.2016.09.003
Zhang, J., Zheng, H., Xu, M., Yin, Q., Zhao, S., Tian, W., et al. (2022). Impacts of stratospheric polar vortex changes on wintertime precipitation over the northern hemisphere. Clim. Dyn. 58, 3155–3171. doi:10.1007/s00382-021-06088-x
Zhang, Q., and Wang, Y. (2022). Distribution of hazard and risk caused by agricultural drought and flood and their correlations in summer monsoon–affected areas of China. Theor. Appl. Climatol. 149, 965–981. doi:10.1007/s00704-022-04093-6
Zhao, L., and Wang, J.-S. (2014). Robust response of the east Asian monsoon rainband to solar variability. J. Clim. 27, 3043–3051. doi:10.1175/JCLI-D-13-00482.1
Keywords: precipitation, mid-lower reaches of Yangtze River, solar activity, lagged correlation, China-Z index
Citation: Li H, Wang Y and Wang C (2023) Lagged response of summer precipitation to solar activity in the mid-lower reaches of the Yangtze River. Front. Earth Sci. 10:1101252. doi: 10.3389/feart.2022.1101252
Received: 17 November 2022; Accepted: 12 December 2022;
Published: 04 January 2023.
Edited by:
Shengping He, University of Bergen, NorwayReviewed by:
Jiankai Zhang, Lanzhou University, ChinaCopyright © 2023 Li, Wang and Wang. This is an open-access article distributed under the terms of the Creative Commons Attribution License (CC BY). The use, distribution or reproduction in other forums is permitted, provided the original author(s) and the copyright owner(s) are credited and that the original publication in this journal is cited, in accordance with accepted academic practice. No use, distribution or reproduction is permitted which does not comply with these terms.
*Correspondence: Hui Li , aGxpQG5zc2MuYWMuY24=
Disclaimer: All claims expressed in this article are solely those of the authors and do not necessarily represent those of their affiliated organizations, or those of the publisher, the editors and the reviewers. Any product that may be evaluated in this article or claim that may be made by its manufacturer is not guaranteed or endorsed by the publisher.
Research integrity at Frontiers
Learn more about the work of our research integrity team to safeguard the quality of each article we publish.