 Yunbing Hu
 Yinghai Guo2*
- 1Jiangsu Vocational Institute of Architectural Technology, Xuzhou, China
- 2School of Resources and Earth Science, China University of Mining and Technology, Xuzhou, China
- 3School of Science, University of Regina, Regina, SK, Canada
- 4Changqing Oilfield Exploration and Development Research Institute, Xi’an, China
A series of studies were carried out on 11 tight sandstone samples of Upper Carboniferous in Ordos Basin. Firstly, the deposit composition and pore structure characteristics are investigated based on analysis and experiments including cast thin section scanning electron microscope high-pressure mercury intrusion and nuclear magnetic resonance Then, combined with DP-P test, the stress-dependent permeability change and pore compressibility characteristics of sandstone reservoirs were studied to reveal the influencing factors and mechanism of reservoir pore compressibility. The detrital particles of the sandstone reservoir in the study area are mainly quartz (75.8%–89%), followed by fragments (3%–16.1%), and almost no feldspar. The content of interstitial materials is 6.5%–11.2%. The type I reservoirs mainly consist of mesopores and macropores, accounting for 60.57% and 32.84% respectively. Mesopores are dominated in Type II reservoirs, accounting for 78.98% of the total pore volume. There are almost no macropores, while a similar proportion of mesopores, micro mesopores and micropores in the type Ⅲ reservoirs. The study of pore compressibility shows that the pore compressibility coefficient decreases with the increase of effective stress, and the reduction rate shows the two-stage characteristics of rapid in the early stage and slow in the later stage. The pressure turning point is between 3 and 10 MPa. The average pore compressibility coefficient increases from type I to type Ⅲ reservoirs. The compressibility coefficient is directly proportional to the changing rate of the pore volume. The higher the content of rigid detrital particles, quartz and carbonate cement in sandstone, the smaller the pore compressibility coefficient, while the higher the content of ductile components such as soft rock fragments and clay minerals, the greater the pore compression coefficient. The pore-throat structure is closely related to the pore compressibility, reservoirs with low displacement pressure, T2glm value, and large average pore-throat radius show lower compressibility coefficient. In addition, the compressibility coefficient of the reservoir is positively correlated with DL (dimension of large pores such as mesopores and macropores), and negatively correlated with DS (the fractal dimension of micropores and micro mesopores). It is considered the pore compression of sandstone including two stages, viscoplastic destructive deformation of ductile components for the first and then the small-scale non-ideal elastic deformation on rigid particles.
1 Introduction
Tight gas has become an important research field in worldwide exploration and development of oil and gas (Higgs et al., 2007; Guo et al., 2015; Wang et al., 2018; Hu et al., 2020a). The pore-throat structure characters, reflecting the pore-throat geometry, pore size distribution (PSD), and connectivity of tight sandstone reservoir, can affect the migration and accumulation of hydrocarbon, which thereby determines its subsequent efficient development (Lai et al., 2018; Jiang et al., 2020; Zong et al., 2020; You et al., 2021). The pore-throat structure of tight sandstone reservoir is mainly characterized by complexity and diversity appears as strong heterogeneity and disconnectivity, various types of pores in micron scaled and irregular forms of nano to submicron scaled throats, which all greatly destroy the seepage performance of the reservoir (Desbois et al., 2011; Zou et al., 2012a; Rezaee et al., 2012; Li et al., 2017; Wang et al., 2018). In addition, certain compressibility for pores of sandstone reservoir exists, and which can be characterized by compressibility coefficient. On the one hand, reservoir compression can provide a driving force for oil production, but at the same time, the reduction of pore pressure caused by reservoir exploitation will also increase the effective stress of the pores in the reservoir, which would get the complexity of pore throat structure increased, change the porosity and permeability, and thereby affect the natural gas productivity of the reservoir significantly (Vairogs et al., 1971; Jones and Owens, 1980; Lorenz, 1999; Dou et al., 2015; Zhang et al., 2015; Huang et al., 2021; Zhang et al., 2021). Therefore, the compression of reservoir pores needs to be carefully evaluated and utilized.
Reservoir pore compressibility coefficient, described as the changing rate of reservoir pore volume caused by the unit pressure added or unload, is a significant parameter in the calculation of dynamic geological reserves, the simulation of reservoir fluid flow, the prediction of petroleum productivity, and the evaluation of reservoir stress sensitivity (Zimmerman et al., 1986; Li et al., 2004; He et al., 2016; Yuan et al., 2018). The most intuitive calculation method for measuring the rock compressibility coefficient is to quantify the loss of pore volume caused by unit differential pressure (Seidle et al., 1992; Liu and Harpalani, 2014). However, due to the extremely low porosity of pores and fractures of samples in tight gas sandstone reservoirs, it is complicated to accurately measure the change of pore and fracture volume, and the measurement results are often of low confidence levels (Seidle et al., 1992; Liu and Harpalani, 2014). Under the action of effective stress, the compression of pore and fracture volume is bound to cause the change of reservoir permeability (Mckee et al., 1988; Seidle et al., 1992; Ross and Bustin, 2008; Dong et al., 2010; Ouyang et al., 2016; Yang et al., 2019). A large number of mathematical formulas and models have been established revealing the internal relationship between effective stress and reservoir permeability, among which the exponential relationship between the reservoir permeability and effective stress based on the pore-fracture compression coefficient is finally widely used (Seidle et al., 1992; Shi and Durucan, 2010; Chen et al., 2015; Yang et al., 2019). Therefore, the calculation method of deducing the pore compressibility coefficient by using the reservoir permeability changes obtained through laboratory experiment tests or logging numerical simulation is widely adopted (Li et al., 2013; Yao et al., 2021).
The compression of reservoir pores will cause a change in reservoir permeability to a certain extent. A large amount of research work has been brought into force on the stress sensitivity of reservoir permeability and its controlling factors. It is considered that the sensitivity of reservoir permeability is jointly controlled by the deposit composition and micro-pore structure (Kang et al., 2006; Sheng et al., 2016; Meng et al., 2019; Liu et al., 2020). However, there are limited studies on the characteristics, influencing factors, and mechanisms of the pore compressibility coefficient of tight sandstone reservoirs. Ordos Basin is an important petroliferous basin in China, which is rich in tight sandstone gas resources. In present study, sandstone samples from Benxi Formation, Upper Carboniferous of Ordos Basin, with different microstructures were selected for the measurement of porosity and permeability under different confining pressures. In addition tests and analyses such as CTS analysis, SEM observation, HPMI and NMR are carried out as well. On the basis of the study on reservoir material composition, micropore structure, and reservoir heterogeneity of samples, the discussion on the mechanism and influencing factors of reservoir pore compressibility were discussed subsequently, which will provide a theoretical basis for the evaluation of reservoir stress sensitivity in the process of drilling and production.
2 Experimental test and sample preparation
2.1 Sample collection
Ordos Basin with rich resources is one of the main natural gas-producing areas in China (Zou et al., 2012b). Benxi Formation in the basin is mainly filled with Lagoon-tidal flat, with lagoon iron aluminum mudstone at the bottom and tidal flat sandstone, mudstone, coal seam, thin limestone lens, barrier sand bar, and shallow water delta sediments upward. Its strata are widely distributed and the hydrocarbon source rocks with stable thickness generating here, which is an important gas source stratum in the Ordos basin. Meanwhile, two sets of large-scale sand bodies in the Pangou member and Jinci member also developed here (Figure 1C). The study area is located in the northeast of the Yishaan slope in Ordos Basin, as shown in Figure 1A, B
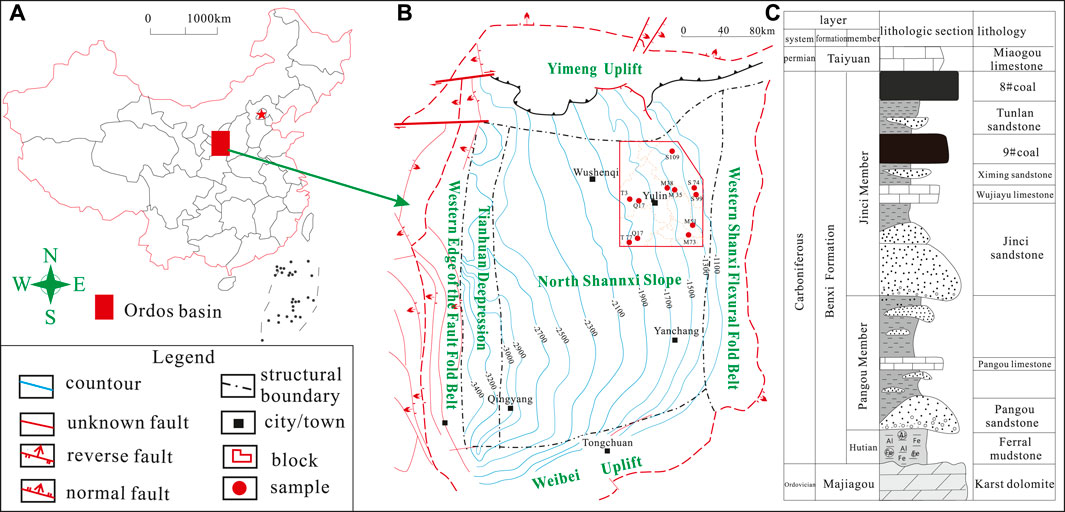
FIGURE 1. Sample information in the study area. (A) Location of Ordos Basin. (B) Location of the study area. (C) Stratigraphic characteristics of Benxi Formation in study area.
In the present study, a total of 11 tight sandstone reservoir column samples were drilled from different exploration wells for various tests and comprehensive analysis. The location distribution of sampling wells and their basic parameters are shown in Figure 1B and Table 1 respectively.
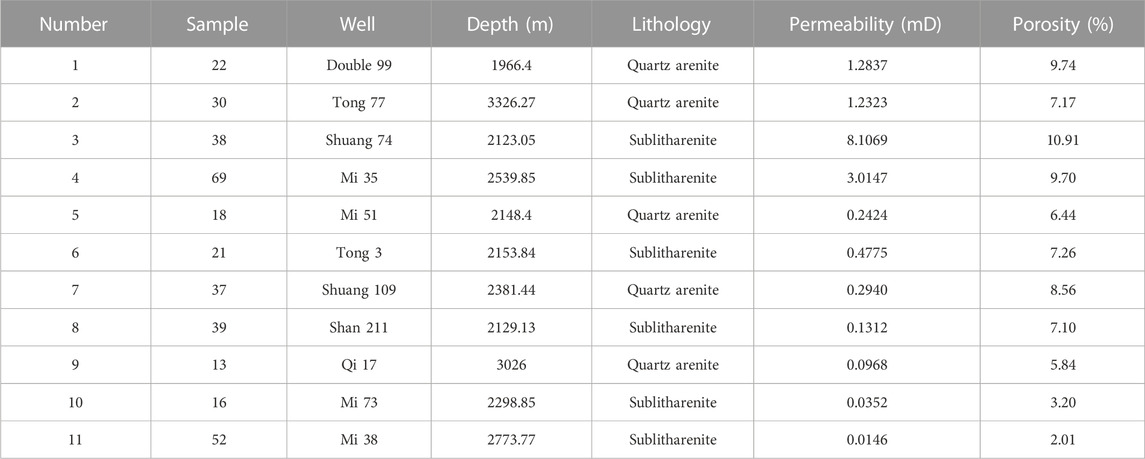
TABLE 1. The basic information and related parameters of selected experimental samples.
2.2 Experimental tests
11 column samples with a required size of 25 mm×50 mm were drilled from 11 sandstone samples, which were prepared for NMR and overburden permeability experiments. The remaining samples were broken into blocks of different sizes and prepared for CTS, SEM and, HPMI experiments.
The cast thin section (CTS) samples were prepared in the Langfang Branch of China Petrol. Explor. Dev+ Research Institute and then identified and analyzed via polarizing microscope technology in China University of Mining and Technology (CUMT), Xuzhou to investigate the petrological characteristics including reservoir deposit composition, characters of detrital particles, and pore-throat characters. The SEM observation was completed in the Advanced Analysis and Calculation Center of CUMT. In this study, all 11 samples about 0.5 cm long for each were gold-coated and dried and then the subsequent analysis was conducted with FEI quantatm 250 equipment to investigate the characteristics of mineral, pores, and reservoir morphology.
Sandstone samples with a size of about 4 mm were selected for high-pressure mercury intrusion experiments by using Micro metrics Auto pore Ⅳ9520 (0.1–60000 psi) according to the Chinese Standard SY/T5346-2005 to investigate the pore-throat structure characters. Firstly, the sample is dried in an oven at 70°C for 12 h, and then the test is carried out. A total of 108 pressure points were collected under the control of the computer during the whole experiment process. The upper-pressure limit was 200 MPa, as a result, the pore throat radium of 3 nm–1000 μm can be measured.
11 plunger samples were selected to conduct T2 spectrum signal measurement under saturated centrifugal state by MacroMR12-150H-1 tester produced by Newmark testing company, Suzhou, China. The specific operation flow and parameter setting during the experiment are shown in Hu et al. (2020) (Lai et al., 2018).
Then, the AP-608 overlying pressure porosimeter produced by American core Temco Products Co., Ltd. was used to conduct pressure-sensitive experiments on column samples (Figure 2), aiming to measure the permeability of samples. The experimental method is called the unsteady-state pressure drop method, of which the experimental gas is high-purity nitrogen. The displacement pressure was provided by plunger pumps and the confining pressure was provided by separate confining pressure pumps. Under the condition of keeping the displacement pressure unchanged, the change of effective stress was simulated by changing the confining pressure. In this way, the effective stress was increased to 3, 10, 15, 20, 25, 30, 40, and 50 MPa. At the same time, to avoid the influence of pressurization time and the change of total volume, it took 30 min to measure each pressure point, and the time interval of 30 s between the two pressure points was maintained.
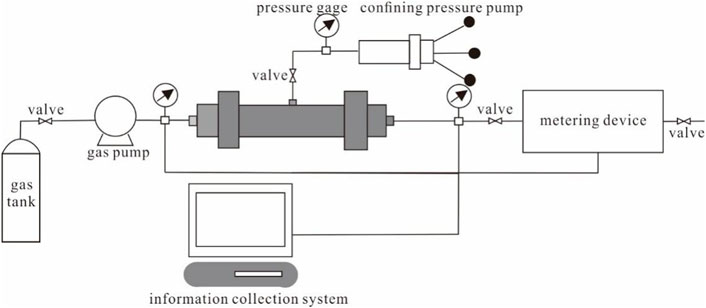
FIGURE 2. Schematic diagram of stress sensitivity experiment.
2.3 Data processing method
2.3.1 Pore compressibility
Based on the data result of DP-P, Seidle et al. (1992) derived the typical formula on permeability and stress by using the matchstick model:
Where Cf is the volume compressibility coefficient of pores and fractures under the effective horizontal stress in a changing state, Mpa−1; K is the permeability measured under the changed stress, mD; K0 is the initial permeability, mD.
Logarithmic operation on both sides of eq 1 can be further performed to obtain the calculation formula of compression coefficient Cf based on DC-P measurement:
Equation 2 has become the most common method to solve Cf (Shi et al., 2014; Zhang et al., 2019). Therefore, the average compressibility coefficient Cfi under different effective stresses can be solved according to Eq 2.
Where Cfi is the average compression coefficient after the ith pressurization, MPa-1.
2.3.2 Fractal dimension
NMR fractal theories has showed its unique advantages in quantitatively characterizing the morphological and structural characteristics of pores and fractures in reservoirs (Harmer et al., 2001). When the fluid was placed in the environment where intergrated action of static magnetic field and radio frequency field exists, the spin hydrogen nuclei would performed NMR relaxation. Which could be expressed by transverse relaxation time T2 (Cai et al., 2013). The formula is as follows.
Where the T2B and T2D is the relaxation time caused by the fluid and pore surface interaction and diffusion, respectively, while the T2S is surface relaxation time.
Taking the single fluid and well-distributed magnetic field into consideration, the T2b and T2D can be ignored (Cai et al., 2013). Then the T2 formula can be rewritten as follows.
Where FS is the morphological factor. If the pore shape in the reservoir is regarded as spherical, the value of FS would be 3. Then, the capillary pressure Pc can be calculated through the following formula 6.
Where Pc represents capillary pressure, (MPa); and C is refer to the conversion factor and can be expressed as
From Eq 6, we can conclude that there is an inverse relationship between capillary pressure Pc and transverse relaxation time T2. Therefore,
Taking Washburn formula into consideration and then combining the derivation results of Ouyang et al. (2016), the formula describing the relationship between cumulative pore volume VP and capillary pressure Pc can be concluded as follows
Combine Eq 6 and Eq 7, the formula of VP can be rewritten as
Take logarithm on both sides of Eq 8, and then equation (8) is transformed into
Where Vp is the percentage of cumulative pore volume under saturated water state; Dw is the fractal dimension value based on NMR data under water-saturated state. T2max is the maximum transverse relaxation time.
3 Results
3.1 Lithology characteristics
Through CTS and SEM analysis, it is found that the reservoir rocks are mainly quartz arenite and sublitharenite. quartz is mainly single crystal quartz (75.8%–89%, with an average of 81.79%). Almost free of feldspar. The content of rock fragments is low (3%–16.1%, with an average of 9.14%), and it mainly consists of rigid rock fragments such as magmatic rock and quartzite (Figure 3A) (with an average of 5.65%) and a small amount of ductile rock fragments such as slate, phyllite, and mica (Figure 3B,C) (with an average of 3.48%). The content of interstitial material ranges from 6.5% to 11.2%, with an average of 9.07%. It mainly consists of clay minerals (4.65%), quartz cement following (2.91%), and a small amount of carbonate and iron (average 1.13% and 0.47% respectively) (Figures 3D–F). The particles with good sorting are in subround-subangular shape and their size distribution of main particles range are different. The cement types are mainly poreed and enlarged pore type.
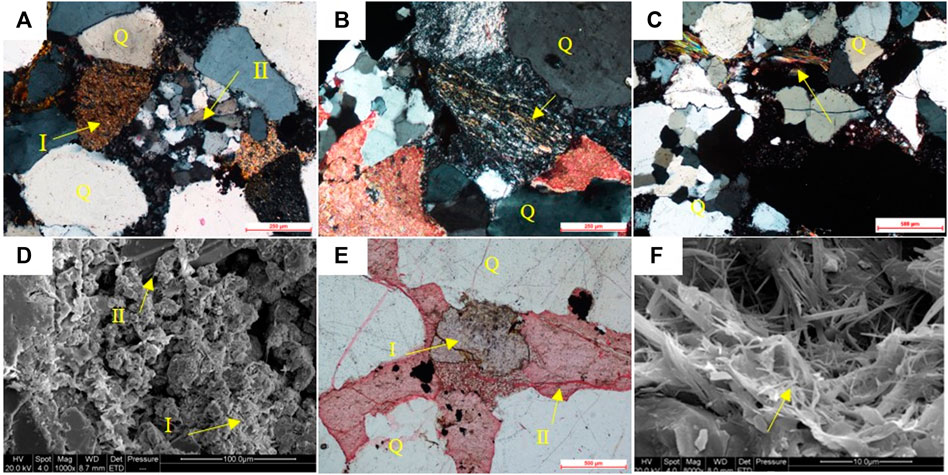
FIGURE 3. Material composition characteristics of tight sandstone reservoirs. (A). Lgneous rock fragments (arrow II) slate fragments (arrow I), well Shuang74, 2123.05m, orthogonal polarization; (B). Phyllite fragments, well Qi 17, 3026m, orthogonal polarization; (C). Strongly deformed mica, well Mi 73, 2421.1m, orthogonally polarized; (D). Kaolinite (arrow I), quartz (arrow II), well Tong 77, 3326.27m; (E). Calcite (arrow II), iron calcite (arrow I), kaolinite, well Mi 38, 3480.45m, single polarized light; (F). Illite, well Mi 73, 2421.1 m.
3.2 Pore type and structural characteristics
According to the analysis of CTS and SEM, various pores including residual primary intergranular pores, intergranular dissolved pores, intragranular dissolved pores, intergranular pores, and microfractures exist in the reservoir of the study area (Figure 3). Previous studies demonstrated that mercury injection parameter R50 of sandstone pore structure shows a significant correlation with reservoir porosity and permeability (Zhong et al., 2020). In the present study, based on the mercury injection experimental parameter R50 and the morphological characteristics of the capillary pressure curve of each sample, the pore structures are divided into three categories, type I, type II, and type Ⅲ. The type I pore-throat structure reservoirs are composed of quartz arenite in coarse grain and giant grain size. The pore types appear in the form of multiple pore combinations, including residual intergranular pores, intergranular dissolved pores, intragranular dissolved pores, and intergranular pores, however, it is dominated by the intergranular pores and the throat is mainly necked and curved lamellar throat. The type II pore-throat structure reservoirs mainly consist of quartz arenite in medium-grained, with the pore types similar to the type I reservoir, however, the pores are mainly dissolution pores, with the curved lamellar throats. The type Ⅲ pore-throat structure reservoirs are composed of quartz arenite and sublitharenite, fine-silt grained. The pores are mainly intragranular dissolved pores and intergranular pores, tubular throat. The pore structure characteristics of different types of reservoirs are shown in Table 2.
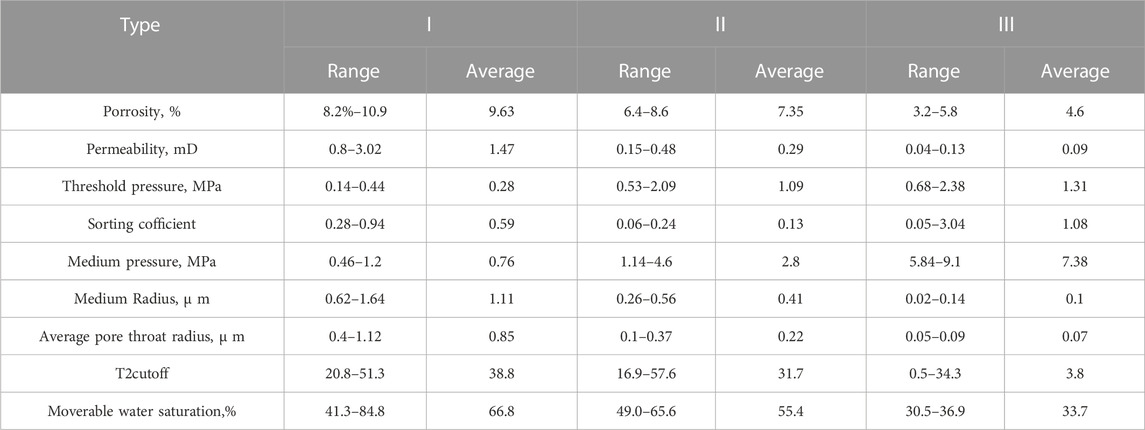
TABLE 2. Pore structure characteristic parameters of different types of tight sandstone reservoirs.
In terms of characterizing reservoir pore size and its distribution, The NMR technology shows higher accuracy than high-pressure mercury injection technology (Loucks et al., 2012; Li et al., 2019; Hu et al., 2020b). A large amount of research work has been conducted on pore classification based on pore size (Zou et al., 2012a; Zou et al., 2012b; Hu et al., 2020a). This research adopts the previous schemes of pore size division to divide pores into micropores, micro mesopores, mesopores, and macropores (Lai et al., 2016), and the corresponding T2 values are ≤ 1 m, 1 ≤ T2 ≤ 10 m, 10 ≤ T2 ≤ 100 m and 100 ≤ T2 ≤ 1000 m respectively (Figure 4A). By comparing the pore distribution characteristics of type I, II, and Ⅲ reservoirs at different stages, it is founded that with the deterioration of reservoir physical properties, the proportion of reservoir pore volume at different stages changes significantly. The proportion of macro pores decreases sharply from the average of 32.84% of type I reservoirs to the average of 1.63% of type Ⅲ reservoirs; The proportions of micro mesopores and micropores in type I and type II reservoirs are low, but they increase rapidly to an average of 25.16% and 36.77% respectively in type Ⅲ reservoirs. The proportion of mesopores increases first and then decreases, and shows the highest proportion in type II reservoirs, accounting for 78.98%.
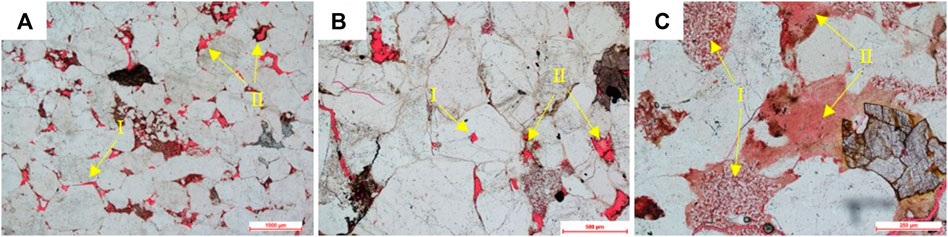
FIGURE 4. Pore types and pore characteristics of tight sandstone reservoirs (A). Residual intergranular pore (arrow I), intergranular dissolved pore (arrow II), well Mi 35, 2539.85m, single polarized light; (B). Intragranular dissolved pore (arrow I), intergranular dissolved pore (arrow II), well Mi 51, 2151.41m, single polarized light; (C). Kaolinite intercrystalline pore (arrow I), illite intercrystalline pore (arrow II), well Mi38, 3480.45m, single polarized light.
3.3 Change of reservoir permeability under effective stress state
The DP-P test result of 11 sandstone samples is shown in Figure 5A. It appears that as the effective stress increases from 0 MPa to 50MPa, the permeability shows a good exponential function decreasing trend. To investigate the influence of dynamic effective stress on permeability quantitatively, the dimensionless parameter DK (permeability loss rat) was introduced to evaluate the permeability sensitivity caused by stress. The DK can be calculated through the formula as follows:
where k0 is the permeability of sandstone samples under initial confining pressure, mD; Ki is the permeability of sandstone samples after applying confining pressure for i times, mD.
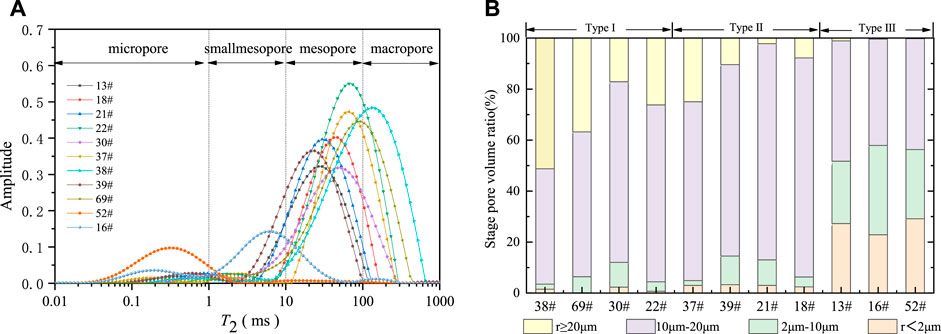
FIGURE 5. Reservoir (A) pore size division and (B) stage pore volume ratio of different types of pore structure reservoir.
The variation of permeability damage rate of different samples with different effective stress is shown in Figure 5B. When effective stress reaches 50MPa, the permeability loss rate of samples ranges from 81.51% to 99.74%, with an average of 93.01%, which indicates that effective stress can compress reservoir pores, resulting in great changes in reservoir pore structure, and the permeability response of samples with different pore structures differs greatly to the same effective stress.
4 Discussion
4.1 Pore compressibility of tight sandstone reservoirs
The pore compression coefficients of 11 sandstone samples under different effective stress are calculated, as shown in Figure 6A. When effective stress is 3Mpa, the pore compression coefficients of sandstone samples are between 0.054 and 0.125, with an average of 0.084. When effective stress increases to 50MPa, the pore compression coefficients are between 0.013 and 0.040, with an average of 0.021. The pore compression coefficients decrease with the increase of the confining pressure. The comparison analysis of the pore compressibility characteristics among the three types of reservoirs (Figure 6B) indicates that under the same effective stress, the type Ⅲ reservoir shows the largest average pore compressibility coefficient, and the type I reservoir has the smallest average pore compressibility coefficient, which indicates that the response sensitivity of pore compressibility to the change of effective stress increases from type I to type Ⅲ reservoirs.
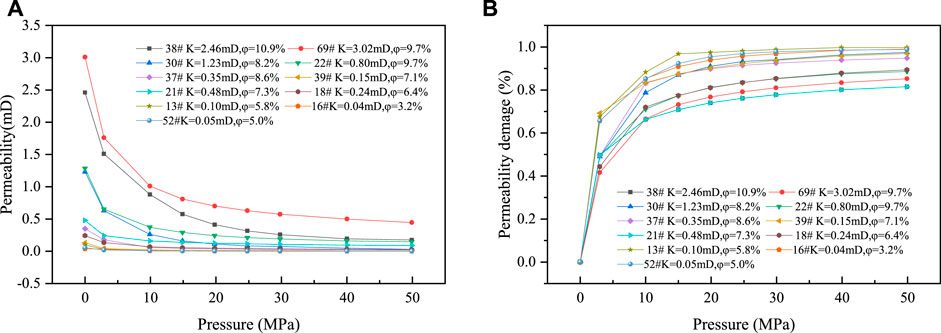
FIGURE 6. Variation of (A) permeability and (B) permeability damage rate of different samples under dynamic effective stress.
The effect of effective stress on pore compressibility among the tested samples shows obvious stages. During the stage of effective stress less than10MPa, with the increase of effective stress, the pore compressibility of samples decreases sharply. However, when effective stress reaches 10MPa, the change of pore compressibility coefficient to the increase of stress is not obvious. The unit stress-strain rate of reservoir pore volume decreases gradually and the pore compressibility coefficient tends to be stable, which reflects that pores are more difficult to be compressed in the later stage of compression. It is probably because pores and fractures of sandstone samples used to show high compressibility under the low-pressure stage, during that period, the large, medium-sized pores and micro-fractures tend to close firstly with the increasing effective pressure, thereby resulting in the obvious decrease of sandstone permeability (Figure 5A). However, with the continuous increase of the effective stress, the decreasing rate of pore-fracture compressibility slows down to a very obvious extent. It is mainly because in this stage, the increase of stress can only cause the closure of some small pores, which leads to the slight change in the pore compressibility coefficient of sandstone during the later stage of stress increase (Figure 6A).
4.2 Influencing factors of pore compressibility
4.2.1 Porosity
The relationship between porosity and pore compressibility is analyzed, as shown in Figure 7, it is found that pore compressibility is negatively correlated to porosity. However, it is well known that loose rocks with high porosity are easier to be compressed than dense rocks. It should be pointed out that the compressibility coefficient is the rate of volume change under pressure. For rocks with the same volume, the higher the porosity, the less the skeleton volume, and the weaker level of support, therefore, the pore compressibility coefficient would be quite large. On the contrary, rocks with lower porosity show larger skeleton volume, stronger lever of support and smaller pore compressibility. The compressibility coefficient is not inversely proportional to the pore volume but directly proportional to the change rate of the pore volume. The smaller the pore volume is, the more difficult it is for the pores to be compressed. Therefore, compared with large pores, the change of small pore volume is smaller, however, the changing rate for pore volume is often greater than that of large pores.
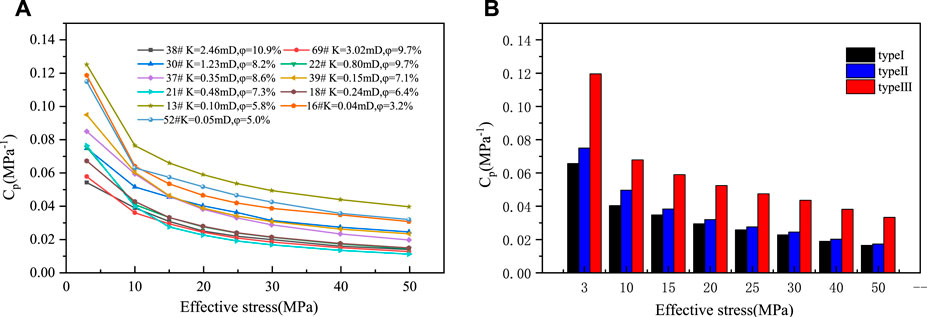
FIGURE 7. Pore compressibility characteristics of tight sandstone reservoirs (A) Distribution of pore compressibility coefficient of different samples under different effective stresses. (B) Pore compressibility of different types of reservoirs.
4.2.2 Lithology
Tight sandstone is composed of skeleton particles and interstitial materials that show a quite different compaction resistance properties. Skeleton particles of the tight sandstone reservoirs in the study area mainly consist of quartz and rock fragments. Quartzes and felspars with strong hardness and brittleness are not easy to be compressed, therefore the shape and size of skeleton particles are hardly get changed with the increase of effective stress (Zhang et al., 2004). The higher the relative content of quartz, the stronger the support of the reservoir rock skeleton and the more difficult it is for reservoir media to be compressed (Figure 8A). Therefore, the pore compression coefficient of type I reservoirs with higher quartz detrital particles is the smallest (Figure 6A). The type Ⅲ reservoirs dominated by sublithiarenite are high in phyllite, slate fragments (Figures 9A, B), mica and other flexible components content. In addition, the abundant ductile clay mineral cement such as illite and kaolinite (Figures 9D, F) in type Ⅲ reservoirs are easy to deform and break under external force. When effective stress increases, the ductile fragments and clay mineral particles are first compacted, deformed, and arranged more closely, and then the reservoir permeability gets reduced (He et al., 2012), At the same time, the loss of pore space makes the reservoir medium show strong pore compressibility. Therefore, the content of ductile material in sandstone is positively correlated with the pore compressibility coefficient (Figures 8B, C). Rigid cement existing among skeleton particles, such as over growth of quartz cement and continuous crystal cementation of carbonate cement (Figure 9E), can resist external stress and provide a strong supporting effect on pores and fractures, thus reducing the reservoir porosity compressibility (Bloch et al., 2002; Henares et al., 2016) (Figure 8D).
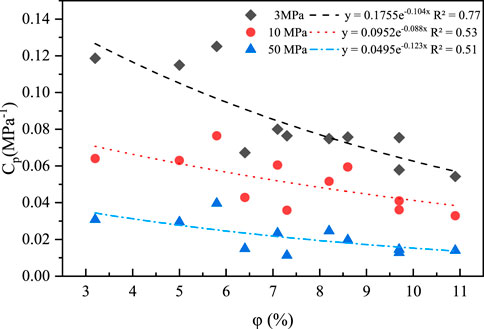
FIGURE 8. Relationship between reservoir porosity and pore compressibility under different stress states.
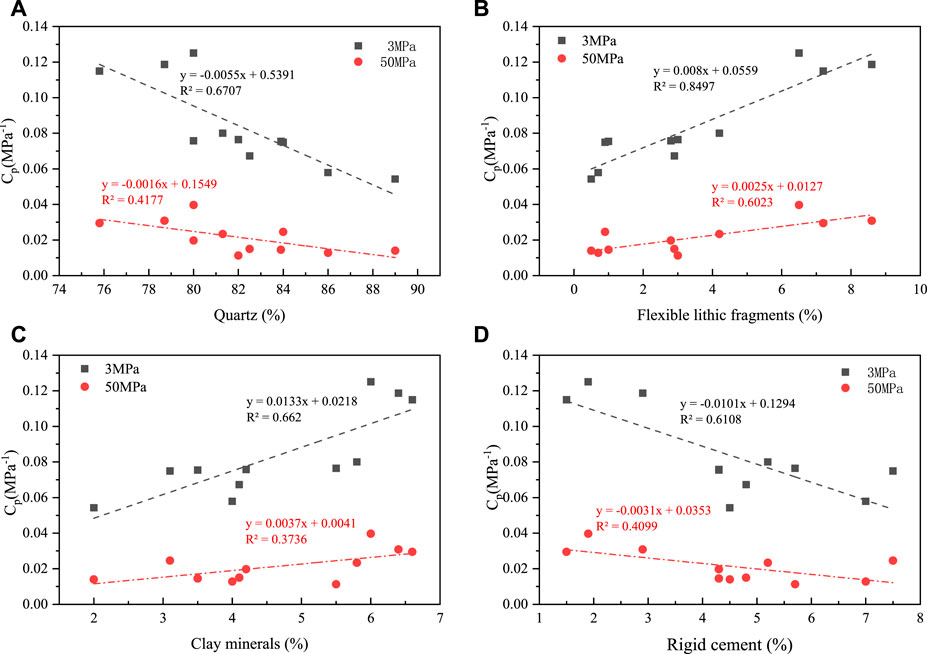
FIGURE 9. Relationship between reservoir material composition and pore compressibility: (A) Quartz, (B) Flexibe fragments, (C) Clay minerals, and (D) Rigid cement.
4.2.3 Pore structure characteristics
There is a close relationship between reservoir micropore structure and reservoir pore compressibility. Micro-pore structure of tight sandstone reservoirs differs greatly (Liu et al., 2019) (Table 2; Figure 6), resulting in the different compressibility in the different types of reservoirs. In general, type Ⅲ reservoirs with high displacement pressure, irreducible water saturation, low median pore throat radius, and T2 geometric average have high pore compressibility (Figure 10; Figure 6).
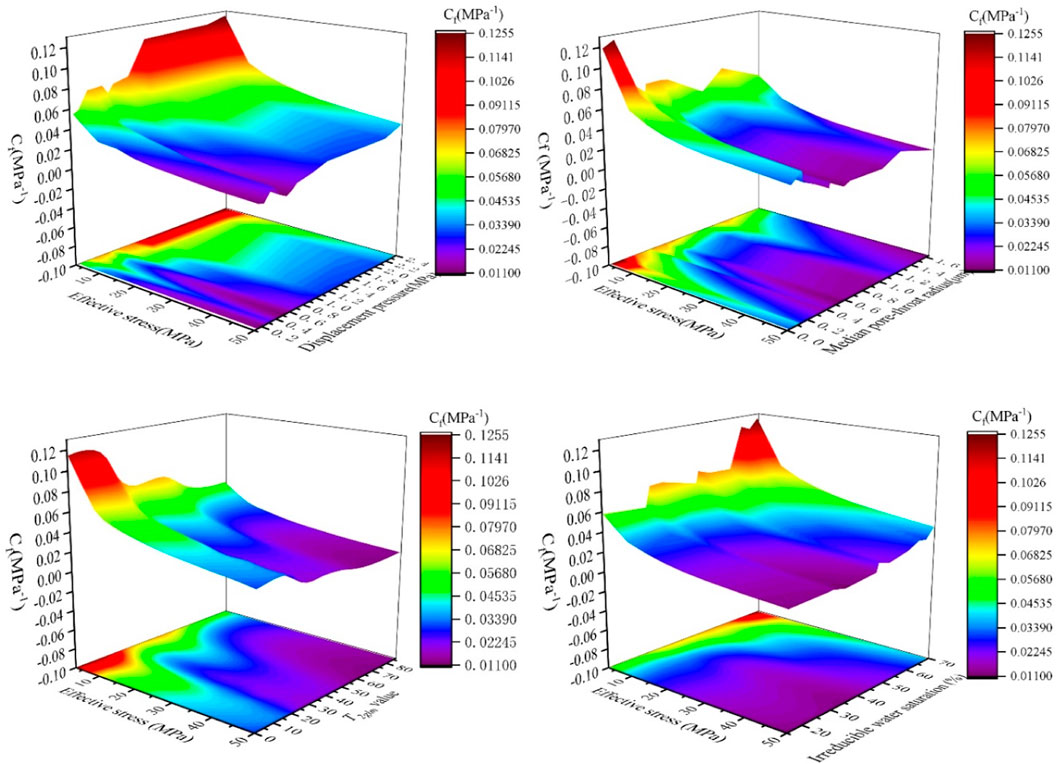
FIGURE 10. Variation trend of pore compressibility coefficient with different effective stress and pore structure parameters.
The distribution and variation trend of reservoir pore compressibility coefficient with different pore structure parameters under different effective stress is shown in Figures 10A–D. With the continuous increase of displacement pressure and irreducible water saturation, the continuous decrease of the median pore throat radius, and NMR T2glm, the pore compression coefficient of sandstone reservoir samples keeps increasing, meanwhile, in the process of increasing effective stress, the pore compression coefficient of sandstone samples with higher displacement pressure, higher irreducible water saturation, lower median pore throat radius and NMR T2glm shows a more obvious decrease trend. However, the final pore compression coefficient is still greater than that of sandstone samples with lower displacement pressure and lower irreducible water saturation (Figure 10; Figure 6B), which the reason is that the sandstone with lower displacement pressure and irreducible water saturation, large average pore throat radius and T2glm are mainly type I reservoir sandstone and it is mostly pure and is of good physical property, low content of ductile rock fragments and clay minerals, high content of rigid cement and less content of compressible deformation materials among skeleton particles. When effective stress increases, the ductile rock fragments and clay minerals among quartz particles are compressed first. With the destruction and deformation of ductile materials, the support force of sandstone reservoir skeleton particles increases, the reservoir pore compression changes from the compression of ductile materials to that of rigid skeleton particles and the pore volume strain rate decreases greatly, resulting in the overall performance of the rapid decrease of pore compression coefficient before the effective stress reaches 10 MPa and the slow decrease after that. In addition, type I reservoirs mainly consist of large pores, and the proportion of small size pores is relatively low (Figure 4B). The reduction of the pore volume of large pores shows a very small changing rate. However, reservoirs with high displacement pressure, high irreducible water saturation, small average pore throat radius and T2glm value, show a relatively high content of compressible deposit composition such as ductile fragments and fillings, and a relatively low pore space as well. The low stress resistance and small pore volume make these reservoirs show a higher pore compression coefficient.
4.2.4 Pore heterogeneity of the reservoir
Comparison and analysis of the relationship between stage pore volume and pore compressibility coefficient under different pressure. The results are shown in Figure 11. Pore compressibility coefficients is positively correlated with the volume of micropores and micro mesopores in sandstone reservoirs (Figures 11A, B), while it is negatively correlated with the volume of mesopores and macropores (Figures 11C, D), and the pore compressibility coefficient has a greater correlation coefficient with micropores and micro mesopores, which all indicate that the loss of pore space of micropores and micro mesopores, etc, caused by compression and destruction of clay minerals runs through the whole effective stress loading process, and the response of pore volume ratio of micropores and micro mesopores to the change of reservoir pore compressibility is more obvious. However, the correlation coefficient between pore compression coefficient and macropores, mesopores is lower, indicating that the compressibility of macropores and mesopores are jointly controlled by many factors, such as sorting, rounding, arrangement of rock fragments particles, and the mechanical properties of cement, which results in the difference of pore compression degree of different types of reservoir samples under changing stress state.
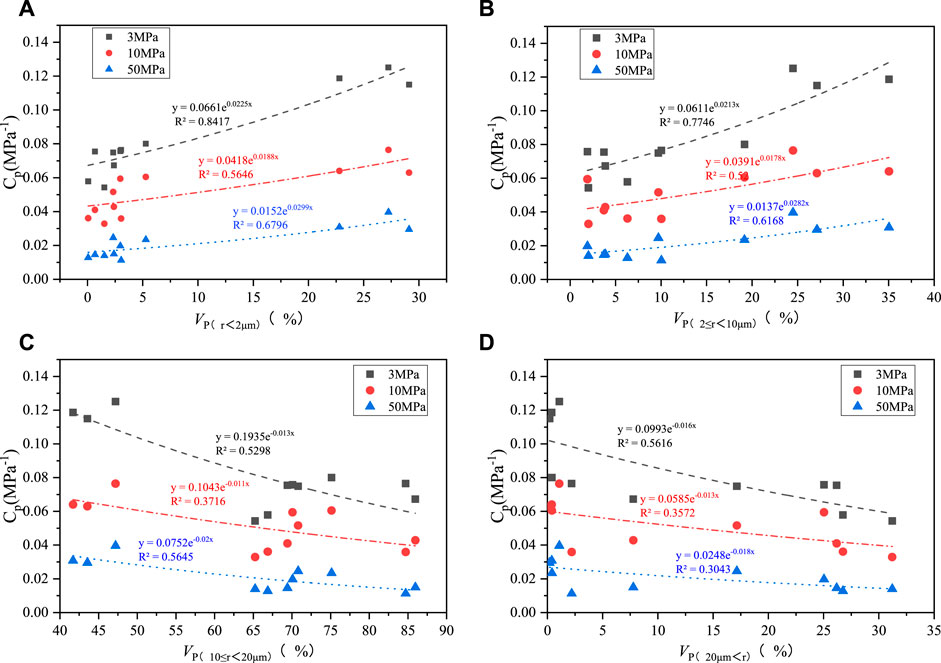
FIGURE 11. Relationship between stage pore volume and pore compressibility: (A) Volume of pores (r < 2 μm), (B) Volume of pores (2 μm ≤ r < 10 μm), (C) Volume of pores (10 μm ≤ r < 20 μm), and (D) Volume of pores (20 μm < r).
In the present study, the micropores and micro mesopores are regarded as small pores, correspondingly, the mesopores and macropores are considered macropores. On this basis, the stage fractal dimension of small pores and macropores of different samples are obtained (Zhang et al., 2022) (Figure 12A), In addition, the relationship between the stage pore fractal dimension and pore compressibility coefficient is analyzed (Figure 12B), It is found that reservoir pore compressibility coefficient has an obvious positive correlation with the fractal dimension DL of mesopores and macropores, while a negative correlation with the fractal dimension Ds of micropores and micro mesopores. The pore fractal dimension is jointly controlled by the dispersion degree of reservoir pore size distribution and the complexity of the pore surface (Wu et al., 2019; Hu et al., 2020a). The Larger DL indicates fewer large pores developing in reservoirs and the reservoir total porosity is small, resulting in a large change rate of pore volume under a stress state, to present a large pore compression coefficient, but it does not mean that reservoir medium is easier to be compressed. On the contrary, the larger the DS, the higher the proportion of relatively large pores in reservoirs, corresponding to the large total porosity in the reservoir, which caused the smaller change rate of pore volume under dynamic stress.
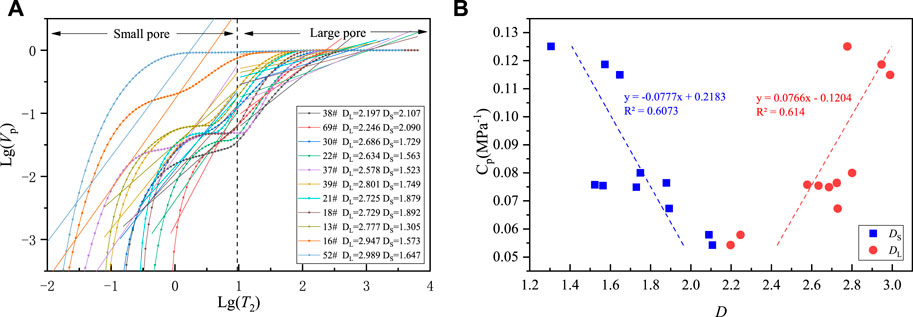
FIGURE 12. Relationship between pore distribution heterogeneity and pore compressibility. (A) Pore-throat fractal dimension based on NMR, (B) Relationship between pore fractal dimension and pore compressibility.
4.3 Pore compressibility mechanism
The deformation of sandstone reservoir medium resulted from the deformation and destruction of skeleton particles and interstitial materials under effective stress can lead to the change of reservoir pore-throat morphology and loss of reservoir space, which is macroscopically reflected in the compressibility of reservoirs (Shan and Zhou, 2020). The compression deformation of sandstone reservoirs is not a single complete elastic deformation or ductile deformation, but an extremely complex elastic-ductile deformation process, which is jointly controlled by the sandstone deposit composition, contact relationship of detrital particles, arrangement of the detrital particles, and the mode of cementation and type of cement.
When tight sandstone is compressed, deformation happens in the throat firstly (Ruan and Wang, 2002), and large and medium-sized pores and micro-fractures also close at first with the increase of pressure. Slate, phyllite soft rock fragments and kaolinite, illite, and other clay minerals filled in reservoir throat are deformed and damaged by compression, resulting in the occupancy of the pore space and the great reduction of the pore volume. All of those make the reservoirs more compact (Fjaer et al., 2008), and make the permeability of sandstone decrease significantly. At this stage (stage I), the sandstone reservoir is dominated by viscoplastic failure and deformation of ductile rock fragment and clay minerals. During this stage, the sandstone reservoir shows high permeability damage and pore compressibility. (Figure 13). After the compression of the first stage, reservoir rigid quartz particles are in close contact. With the further increase of effective stress, the closure of the reservoir throat will not continue, the damage increment of reservoir permeability decreases and small-scale non-ideal elastic deformation of rigid quartz particles occurs in sandstone reservoirs, which cause a small amount of loss of intergranular pore space (stage II) (Figure 13), thereby presenting a small pore compression coefficient. The compression deformation of sandstone reservoirs without ductile material mainly happens in stage II.
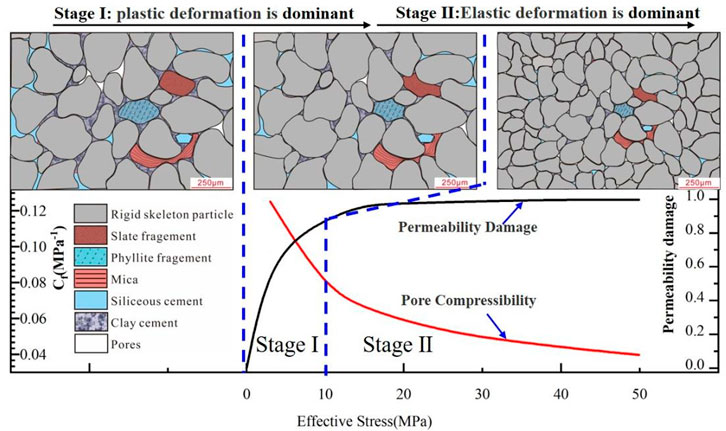
FIGURE 13. Schematic diagram of pore compression mode of tight sandstone reservoirs.
5 Conclusion
In this study, the characteristics, influencing factors and, mechanism of pore fracture compressibility of tight sandstone reservoir are analyzed and the main conclusions are as follows:
1) Sandstone in the study area are mainly quartz arenite and sublitharenite. The content of quartz detrital particles is 75.8%–89%, with an average of 81.79%. Fewer rock fragments, ranging from 3% to 16.1%, with an average of 9.14%, and almost free of feldspar. The content of interstitial materials is 6.5%–11.2%, with an average of 9.07%. The type I reservoirs mainly consist of mesopores and macropores, accounting for 60.57% and 32.84% respectively. Mesopores are dominated in Type II reservoirs, accounting for 78.98% of the total pore volume. There are almost no macropores, while a similar proportion of mesopores, micro mesopores and micropores in the type Ⅲ reservoirs.
2) The study of pore compressibility shows that the pore compressibility coefficient decreases gradually with the increase of effective stress, and the reduction rate shows the two-stage characteristics of rapid in the early stage and slow in the later stage. The pressure turning point is between 3 and 10 MPa. The type Ⅲ reservoir shows the largest average pore compression coefficient, however, type I for the lowest value.
3) The coefficient of pore compressibility is not inversely proportional to pore volume, but directly proportional to the change rate of pore volume. The higher the content of rigid detrital particles, quartz and carbonate cement in sandstone, the smaller the pore compressibility coefficient while the higher the content of ductile components such as soft rock fragments and clay minerals, the greater the pore compression coefficient. The pore structure of the reservoir is closely related to the pore compressibility, reservoir with low displacement pressure, large average pore throat radius, and small T2glm value show a lower compressibility coefficient. Moreover, the compressibility coefficient of the reservoir is positively correlated with DL (dimension of large pores such as mesopores and macropores) and negatively correlated with DS (the fractal dimension of micropores and micro mesopores).
4) The compression deformation of sandstone reservoirs is jointly controlled by the material composition of skeleton particles, the contact relationship between skeleton particles, the arrangement of particles, the mode of cementation, and type of cement. It is considered the the pore compression of sandstone including two stages, viscoplastic destructive deformation of ductile components for the first and then the small-scale non-ideal elastic deformation on rigid particles.
Data availability statement
The original contributions presented in the study are included in the article/supplementary material, further inquiries can be directed to the corresponding author.
Author contributions
Conceptualization: YG Data curation: YH Formal analysis: YH; YH Funding acquisition:YH; YG Investigation: YH; YG; HQ Methodology: YH; HQ; Project administration: Key Laboratory of Coalbed Methane Resources and Reservoir Formation Process of the Ministry of Education (China University of Mining and Technology) Resources: YG; HQ Supervision: YG; HQ Roles/Writing–original draft:YH Writing–review and editing: YH; YG; HQ.
Acknowledgments
We acknowledge the support from the National Natural Science Foundation of China (No. 41772130) and the Jiangsu Graduate Student Scientific Research and Innovation Program (KYCX21_2325). The authors wish to acknowledge the Research Institute of Petroleum Exploration & Development of Changqing Oilfield Company for providing the cores and some geological data. We also thank the reviewers for constructive comments that improved the manuscript.
Conflict of interest
The authors declare that the research was conducted in the absence of any commercial or financial relationships that could be construed as a potential conflict of interest.
Publisher’s note
All claims expressed in this article are solely those of the authors and do not necessarily represent those of their affiliated organizations, or those of the publisher, the editors and the reviewers. Any product that may be evaluated in this article, or claim that may be made by its manufacturer, is not guaranteed or endorsed by the publisher.
References
Bloch, S., Lander, R. H., and Bonnell, L. (2002). Anomalously high porosity and permeability in deeply buried sandstone reservoirs: Origin and predictability. AAPG Bulletin 86, 301–328.doi:10.1306/61EEDABC-173E-11D7-8645000102C1865D
Cai, Y., Liu, D., Pan, Z., Yao, Y., Li, J., and Qiu, Y. (2013). Pore structure and its impact on CH4 adsorption capacity and flow capability of bituminous and subbituminous coals from Northeast China. Fuel 103, 258–268. doi:10.1016/j.fuel.2012.06.055
Chen, D., Pan, Z., and Ye, Z. (2015). Dependence of gas shale fracture permeability on effective stress and reservoir pressure: Model match and insights. Fuel 139, 383–392. doi:10.1016/j.fuel.2014.09.018
Desbois, G., Urai, J. L., Kukla, P. A., Konstanty, J., and Baerle, C. (2011). High-resolution 3D fabric and porosity model in a tight gas sandstone reservoir:A new approach to investigate microstructures from mm- to nm-scale combining argon beam cross-sectioning and SEM imaging. Journal of Petroleum Science and Engineering. 78 (2), 243–257. doi:10.1016/j.petrol.2011.06.004
Dong, J. J., Hsu, J. Y., Wu, W. J., Shimamoto, T., Hung, J. H., Yeh, E. C., et al. (2010). Stress-dependence of the permeability and porosity of sandstone and shale from TCDP Hole-A. International Journal of Rock Mechanics and Mining Sciences. 47 (7), 1141–1157. doi:10.1016/j.ijrmms.2010.06.019
Dou, X., Liao, X., Zhao, X., Wang, H., and Lv, S. (2015). Quantification of permeability stress-sensitivity in tight gas reservoir based on straight-line analysis. Journal of Natural Gas Science and Engineering. 22, 598–608. doi:10.1016/j.jngse.2015.01.011
Fjaer, E., Holt, R. M., Horsrud, P., Raaen, A. M., and Risnes, R. (2008). Petroleum related rock mechanics. Second. Amsterdam, Netherlands: Elsevier (isbn:978-0-44450260-5.
Guo, C., Xu, J., Wei, M., and Jiang, R. (2015). Experimental study and numerical simulation of hydraulic fracturing tightsandstone reservoirs. Fuel 159, 334–344. doi:10.1016/j.fuel.2015.06.057
Harmer, J., Callcott, T., Maeder, M., and Smith, B. E. (2001). A novel approach for coal characterization by NMR spectroscopy: Global analysis of proton T1 and T2 relaxations. Fuel 80 (3), 417–425. doi:10.1016/s0016-2361(00)00103-4
He, J., Fu, Y., Shen, G., Zhu, X., and Wu, Q. (2012). Coupling relations between the petrologic characteristics and stress-sensitiveness in low-permeability sandstone reservoirs. Petroleum Geology. 33, 923–931.doi:10.11743/ogg20120614
He, J., Ling, K., Pei, P., and Ni, X. (2016). Calculation of rock compressibility by using the characteristics of downstream pressure change in permeability experiment. Journal of Petroleum Science and Engineering. 143, 121–127. doi:10.1016/j.petrol.2016.02.030
Henares, S., Caracciolo, L., Viseras, C., Fernandez, J., and Yeste, L. M. (2016). Diagenetic constraints on heterogeneous reservoir quality assessment: A triassic outcrop analog of meandering fluvial reservoirs. AAPG Bulletin. 100 (9), 1377–1398. doi:10.1306/04011615103
Higgs, K. E., Zwingmann, H., Reyes, A. G., and Funnell, R. H. (2007). Diagenesis, porosity evolution, and petroleum emplacement in tight gas reservoirs, Taranaki basin, New Zealand. Journal of Sedimentary Research. 77, 1003–1025. doi:10.2110/jsr.2007.095
Hu, Y., Guo, Y., Shangguan, J., Zhang, J., and Song, Y. (2020). Fractal characteristics and model applicability for pores in tight gas sandstone reservoirs: A case study of the upper paleozoic in Ordos Basin. Energy & Fuels 34 (12), 16059–16072. doi:10.1021/acs.energyfuels.0c03073
Hu, Y., Guo, Y., Zhang, J., Shangguan, J., Li, M., Quan, F., et al. (2020). A method to determine nuclear magnetic resonance T2 cutoff value of tight sandstone reservoir based on multifractal analysis. Energy Science & Engineering. 8 (4), 1135–1148. doi:10.1002/ese3.574
Huang, Z., Gu, Q., Wu, Y., Wu, Y., Li, S., Zhao, K., et al. (2021). Effects of confining pressure on acoustic emission and failure characteristics of sandstone. International Journal of Mining Science and Technology. 31 (05), 963–974. doi:10.1016/j.ijmst.2021.08.003
Jiang, R., Liu, C., Zhang, J., Zeng, Q., He, P., Huang, J., et al. (2020). Quantitative reservoir characterization of tight sandstone using extended elastic impedance. Natural Resources Research. 30, 395–409. doi:10.1007/s11053-020-09711-6
Jones, F. O., and Owens, W. W. (1980). Alaboratory study of low-permeability gas sands. Journal of Petroleum Exploration and Production Technology. 32 (9), 1631–1640. doi:10.2118/7551-pa
Kang, Y., Zhang, H., Chen, Y., Li, Q., You, L., and Cheng, Q. (2006). Comprehensive research of tight sandstones gas reservoirs stress sensitivity in DaNiuDi gas field. Nat. Gas Geosci. 17 (3), 335–344. In Chinese. doi:10.3969/j.issn.1672-1926.2006.03.011
Lai, F., Li, Z., Wei, Q., Zhang, T., and Zhao, Q. (2016). Experimental investigation of spontaneous imbibition in a tight reservoir with nuclear magnetic resonance testing. Energy & Fuels 30 (11), 8932–8940. doi:10.1021/acs.energyfuels.6b01324
Lai, J., Wang, G., Wang, Z., Chen, J., Pang, X., Wang, S., et al. (2018). A review on pore structure characterization in tight sandstones. Earth-Science Reviews. 177, 436–457. doi:10.1016/j.earscirev.2017.12.003
Li, C., Liu, G., Cao, Z., Yuan, W., Wang, P., and You, Y. (2019). Analysis of petrophysical characteristics and water movability of tight sandstone using low-field nuclear magnetic resonance. Natural Resources Research. 29, 2547–2573. doi:10.1007/s11053-019-09582-6
Li, C., Wang, S., and Zhou, Y. (2004). Effect of rock compressibility on reservoir dynamic reserves determination. Petrol. Geol. Oilfield Dev. in Daqing 23 (6), 31–32. In Chinese. doi:10.3969/j.issn.1000-3754.2004.06.012
Li, P., Zheng, M., Bi, H., Wu, S., and Wang, X. (2017). Pore throat structure and fractal characteristics of tight oil sandstone: A case study in the Ordos Basin, China. Journal of Petroleum Science and Engineering. 149, 665–674. doi:10.1016/j.petrol.2016.11.015
Li, S., Tang, D., Pan, Z., Xu, H., and Huang, W. (2013). Characterization of the stress sensitivity of pores for different rank coals by nuclear magnetic resonance. Fuel 111, 746–754. doi:10.1016/j.fuel.2013.05.003
Liu, D., Sun, W., and Ren, D. (2019). Experimental investigation of pore structure and movable fluid traits in tight sandstone. Processes 7 (3), 149. doi:10.3390/pr7030149
Liu, G., Yin, H., Lan, Y., Fei, S., and Yang, D. (2020). Experimental determination of dynamic pore-throat structure characteristics in a tight gas sandstone formation with consideration of effective stress. Marine and Petroleum Geology. 113, 104170. doi:10.1016/j.marpetgeo.2019.104170
Liu, S., and Harpalani, S. (2014). Compressibility of sorptive porous media: Part 1. Background and theory. AAPG Bulletin. 98 (9), 1761–1772. doi:10.1306/03241413133
Lorenz, J. C. (1999). Stress-sensitive reservoirs. Journal of Petroleum Technology. 51 (01), 61–63. doi:10.2118/50977-ms
Loucks, R. G., Reed, R. M., Ruppel, S. C., and Hammes, U. (2012). Spectrum of pore types and networks in mudrocks and a descriptive classification for matrix-related mudrock pores. AAPG Bulletin. 96 (6), 1071–1098. doi:10.1306/08171111061
Mckee, C. R., Bumb, A. C., and Koenlg, R. A. (1988). Stress-dependent permeability and porosity of coal and other geologic formations. SPE Formation Evaluation. 3 (01), 81–91. doi:10.2118/12858-pa
Meng, Y., Luo, C., Li, G., and Liu, H. (2019). An experimental study on stress sensitivity of tight sandstone gas reservoirs during nitrogen drilling. Arabian Journal of Geosciences. 12 (18), 576. doi:10.1007/s12517-019-4779-0
Ouyang, Z., Liu, D., Cai, Y., and Yao, Y. (2016). Fractal analysis on heterogeneity of porefractures in middle-high rank coals with NMR. Energy & Fuels 30 (7), 5449–5458. doi:10.1021/acs.energyfuels.6b00563
Rezaee, R., Saeedi, A., and Clennell, B. (2012). Tight gas sands permeability estimation from mercury injection capillary pressure and nuclear magnetic resonance data. Journal of Petroleum Science and Engineering. 88, 92–99. doi:10.1016/j.petrol.2011.12.014
Ross, D. J. K., and Bustin, R. M. (2008). Characterizing the shale gas resource potential of Devonian–Mississippian strata in the Western Canada sedimentary basin: Application of an integrated formation evaluation. AAPG Bulletin. 92 (1), 87–125. doi:10.1306/09040707048
Ruan, M., and Wang, L. (2002). Low-permeability oilfield development and pressure-sensitive effect. Acta Pet. Sin. 23 (3), 73–76. In Chinese.doi:10.7623/syxb200203016
Seidle, J. P., Jeansonne, D. J., and Erickson, D. J. (1992). “Application of matchstick geometry to stress dependent permeability in coals,” in In: Presented at SPE Rocky mountain regional meeting, Casper, Wyoming, Wyoming, United States, May 1992. SPE 24361. doi:10.2118/24361-MS18–21
Shan, J., and Zhou, X. (2020). Starting conditions of particle migration in tight sandstone reservoir development. Processes 8 (11), 1491. doi:10.3390/pr8111491
Sheng, Y., Hu, Q., Gao, H., Shi, Y., Dang, Y., Shao, F., et al. (2016). Evaluation on stress sensibility of low reservoir in situ conditions. Acta Scientiarum Naturalium Universitatis Pekinensis. 52 (6), 1025–1033. In Chinese.doi:10.13209/j.0479-8023.2016.050
Shi, J., and Durucan, S. (2010). Exponential growth in san juan basin fruitland coalbed permeability with reservoir drawdown: Model match and new insights. SPE Reservoir Evaluation & Engineering. 13, 914–925. doi:10.2118/123206-pa
Shi, J., Pan, Z., and Durucan, S. (2014). Analytical models for coal permeability changes during coalbed methane recovery: Model comparison and performance evaluation. International Journal of Coal Geology. 136, 17–24. doi:10.1016/j.coal.2014.10.004
Vairogs, J., Hearn, C. L., Dareing, D. W., and Rhoades, V. W. (1971). Effect of rock stress on gas production from lowpermeability reservoirs. J. Pet. Techno. 23 (09), 1161–1167. doi:10.2118/3001-pa
Wang, F., Liu, Y., Hu, C., Wang, Y., Shen, A., and Liang, S. (2018). Experimental study on feasibility of enhanced gas recovery through CO2 flooding in tight sandstone gas reservoirs. Processes 6 (11), 214. doi:10.3390/pr6110214
Wu, Y., Zhao, Y., and Li, P. (2019). Effect of the heterogeneity on sorptivity in sandstones with high and low permeability in water imbibition process. Processes 7 (5), 260. doi:10.3390/pr7050260
Yang, D., Wang, W., Li, K., Chen, W., Yang, J., and Wang, S. (2019). Experimental investigation on the stress sensitivity of permeability in naturally fractured shale. Environ. Earth ScEnvironmental Earth Sciencesi. 78, 55. doi:10.1007/s12665-019-8045-2
Yao, W., Xu, Y., Wang, C., Xia, K., and Hokka, M. (2021). Dynamic Mode Ⅱ fracture behavior of rocks under hydrostatic pressure using the short core in compression(SCC) method. International Journal of Mining Science and Technology. 31 (05), 927–937. doi:10.1016/j.ijmst.2021.08.001
You, W., Dai, F., Liu, Y., Du, H., and Jiang, R. (2021). Investigation of the influence of intermediate principal stress on the dynamic responses of rocks subjected to true triaxial stress state. International Journal of Mining Science and Technology. 31 (05), 913–926. doi:10.1016/j.ijmst.2021.06.003
Yuan, J., Jiang, R., and Zhang, W. (2018). The workflow to analyze hydraulic fracture effect on hydraulic fractured horizontal well production in composite formation system. Advances Geo-Energy ReAdvances in Geo-Energy Researchs. 2 (3), 319–342. doi:10.26804/ager.2018.03.09
Zhang, H., Kang, Y., Chen, Y., Li, Q., You, L., and He, J. (2004). Deformation theory and stress sensitivity of tight sandstones reservoirs. Nat. Gas Geosci. 15, 482–486. doi:10.3969/j.issn.1672-1926.2004.05.008
Zhang, J., Chu, X., Wei, C., Zhang, P., Zou, M., Wang, B., et al. (2022). Review on the application of low-field nuclear magnetic resonance technology in coalbed methane production simulation. ACS omega 7, 26298–26307. doi:10.1021/acsomega.2c02112
Zhang, J., Wei, C., Zhao, J., Ju, W., Chen, Y., and Landry, S. T. (2019). Comparative evaluation of the compressibility of middle and high rank coals by different experimental methods. Fuel 245, 39–51. doi:10.1016/j.fuel.2019.01.052
Zhang, L., Huang, M., Xue, J., Li, M., and Li, J. (2021). Repetitive mining stress and pore pressure effects on permeability and pore pressure sensitivity of bituminous coal. Natural Resources Research. 30, 4457–4476. doi:10.1007/s11053-021-09902-9
Zhang, R., Ning, Z., Yang, F., Wang, X., Zhao, H., and Wang, Q. (2015). Impacts of nanopore structure and elastic properties on stress-dependent permeability of gas shales. Journal of Natural Gas Science and Engineering. 26, 1663–1672. doi:10.1016/j.jngse.2015.02.001
Zhong, X., Zhu, Y., Liu, L., Yang, H., Li, Y., Xie, Y., et al. (2020). The characteristics and influencing factors of permeability stress sensitivity of tight sandstone reservoirs. Journal of Petroleum Science and Engineering. 191, 107221. doi:10.1016/j.petrol.2020.107221
Zimmerman, R., Somerton, W., and King, M. (1986). Compressibility of porous rocks. Journal of Geophysical Research: Solid Earth. 91 (B12), 12765–12777. doi:10.1029/jb091ib12p12765
Zong, Y., Han, L., Meng, Q., and Wang, Y. (2020). Strength properties and evolution laws of cracked sandstone samples in re-loading tests. International Journal of Mining Science and Technology. 30 (02), 251–258. doi:10.1016/j.ijmst.2019.03.004
Zou, C., Yang, Z., Tao, S., Li, W., Wu, S., Hou, L., et al. (2012). Nano-hydrocarbon and the accumulation in coexisting source and reservoir. Petroleum Exploration and Development+ 39, 15–32. doi:10.1016/s1876-3804(12)60011-1
Keywords: tight gas, pore compressibility, medium deformation, sandstone reservoirs, ordos basin
Citation: Hu Y, Guo Y, Qing H and Hou Y (2023) Study on influencing factors and mechanism of pore compressibility of tight sandstone reservoir—A case study of upper carboniferous in ordos basin. Front. Earth Sci. 10:1100951. doi: 10.3389/feart.2022.1100951
Received: 17 November 2022; Accepted: 19 December 2022;
Published: 23 January 2023.
Edited by:
Junjian Zhang, Shandong University of Science and Technology, ChinaReviewed by:
Junjian Zhang, Shandong University of Science and Technology, ChinaXiaoqi Wang, Suzhou University, China
Copyright © 2023 Hu, Guo, Qing and Hou. This is an open-access article distributed under the terms of the Creative Commons Attribution License (CC BY). The use, distribution or reproduction in other forums is permitted, provided the original author(s) and the copyright owner(s) are credited and that the original publication in this journal is cited, in accordance with accepted academic practice. No use, distribution or reproduction is permitted which does not comply with these terms.
*Correspondence: Yinghai Guo, Z3lpbmdoYWlAMTYzLmNvbQ==