 Sen Wang1
 Sixiang Ling
 Chunwei Sun
94% of researchers rate our articles as excellent or good
Learn more about the work of our research integrity team to safeguard the quality of each article we publish.
Find out more
ORIGINAL RESEARCH article
Front. Earth Sci., 06 January 2023
Sec. Environmental Informatics and Remote Sensing
Volume 10 - 2022 | https://doi.org/10.3389/feart.2022.1100363
This article is part of the Research TopicAdvances and Applications of Artificial Intelligence and Numerical Simulation in Risk Emergency Management and TreatmentView all 22 articles
The Yunnan–Tibet traffic corridor runs through the Three Rivers Region, southeastern Tibetan Plateau, which is characterized by high-relief topography and active tectonics, with favourable conditions for landslides. It is of great significance to identify the key predisposing factors of landslides and to reveal the landslide susceptibility in this area. A total of 2,308 landslides were identified as learning samples through remote sensing interpretation and detailed field surveys, and four machine learning algorithms involving logistic regression (LR), random forest (RF), naïve Bayes (NB) and multilayer perceptron (MLP) were compared to model the landslide susceptibility. Through the multicollinearity test, 13 influential factors were selected as conditioning factors. The area under the curve (AUC) values of LR, RF, NB and MLP models are .788, .918, .785 and .836 respectively, indicating that the four models have good or very good prediction accuracy in landslide susceptibility assessment along the Yunnan–Tibet traffic corridor. In addition, the elevation, slope, rainfall, distance to rivers, and aspect play a major role in landslide development in the study area. The susceptibility zoning map based on the best RF model shows that the areas with high susceptibility and very high susceptibility account for 12.24% and 6.72%, respectively, and are mainly distributed along the Jinsha River, the Lancang River and the G214 highway.
The Yunnan–Tibet traffic corridor is located in the Three Rivers Region in the southeastern part of the Qinghai–Tibet Plateau, and the corridor mainly involves the G214 National Highway and the planned corridor. The Jinsha River, Lancang River, and Nujiang River flow southward parallel to the Three Rivers Region. The geological environment is fragile due to steep terrain, substantial river incision, active tectonic activity, weak lithology, and frequent earthquakes (Zhang et al., 2000; Zhang et al., 2016). These internal and external dynamics of geological processes provide favourable conditions for the occurrence of geological hazards, especially landslides (Li et al., 2019; Ling et al., 2021; Zhao et al., 2019; Yan et al., 2022). Landslides are the most critical type of geological disaster and have the characteristics of a wide distribution area, high frequency of occurrence, fast movement speed, and severe losses. Because of the uplift of the Qinghai–Tibet Plateau, the internal and external dynamic geological processes are enormously intertwined, and creating complex geological conditions and intense dynamic valley processes; these processes bring more uncertainty to the occurrence of landslides in the Yunnan–Tibet traffic corridor (Peng et al., 2004; Peng et al., 2020). Frequent landslides not only cause heavy casualties and property losses but also seriously affect the construction and safe operation of Yunnan–Tibet highways and planned corridors and restrict the development of the regional economy. However, landslide investigations in the study area are limited due to factors such as high elevations, and poor traffic conditions. Therefore, it is of great significance to integrate the existing survey data, analyse the key predisposing factors, and predict the potential landslide-prone zones in the area.
Landslide susceptibility evaluation is based on existing landslide investigations and evaluates the possibility of landslide occurrence under a combination of conditioning factors (Niu et al., 2012; Wen et al., 2022). The common methods for landslide susceptibility evaluation include deterministic and non-deterministic methods (Kavzoglu et al., 2019). The deterministic method is mainly based on the quantitative calculation of slope stability. Non-deterministic methods mainly include mathematical analytical methods, such as the analytic hierarchy process, fuzzy comprehensive evaluation, information method, probability ratio, logistic regression, neural network, support vector machine, etc. (Yao et al., 2008; Youssef et al., 2016; Kavzoglu et al., 2019; Huang et al., 2020; Ling et al., 2022). These methods have achieved good application results in evaluating regional landslide susceptibility. In recent years, with the rapid development of artificial intelligence, machine learning algorithms have been applied by many researchers in the fields of earthquake prediction, groundwater storage change prediction, precipitation data correction, and landslide susceptibility mapping (Yao et al., 2008; Youssef et al., 2016; Kavzoglu et al., 2019; Huang et al., 2020; Ling et al., 2022). These frequently used algorithms mainly include regression algorithms, instance-based learning, neural network (NN) algorithms, Bayesian algorithms, kernel-based learning algorithms and decision tree (DT) algorithms (Huang et al., 2022b). However, different algorithm models have their unique characteristics, and the performance of each model varies according to the input data, model structure, and accuracy (Nachappa et al., 2020). Therefore, it is not reliable to use only one algorithm model for landslide susceptibility assessment in a region, and it requires comparative evaluation of multiple models.
Logistic regression (LR) algorithm is a kind of regression algorithms. LR, which is a multivariable analysis model, and can be used to predict the presence or absence of characteristics or results according to the values of a group of prediction variables. The advantages of LR are fast training speed, easy to use and explain. However, LR cannot be used to solve non-linear problems, because the decision surface of logical regression is linear, and it is more sensitive to multicollinearity data (Ayalew and Yamagishi, 2005; Pradhan and Lee 2010). Pham et al. (2017a) evaluated and compared prediction capability of Bagging Ensemble Based Alternating Decision Trees (BADT), LR, and J48 Decision Trees (J48DT) for landslide susceptibility mapping at part of the Uttarakhand State (India), and the three landslide models all performed well. Among them, BADT model has the highest prediction ability in the validation data set, followed by LR model and J48DT model. Random forest (RF) algorithm is a kind of DT algorithms, which is an ensemble of separately trained binary decision trees (Ravì et al., 2016). RF model can handle a large number of input variables without deleting variables, and return a very small classification set to maintain high prediction accuracy (Zhang et al., 2017). In addition, RF models have no prior assumptions about model dependency and can handle classified data and continuous data. However, when more trees are added, the RF model will not over fit, but will produce a small generalization error (Peters et al., 2007; Ließ et al., 2012). Chen et al. (2018) used the best-first decision tree, random forest, and naïve Bayes tree to evaluate the landslide susceptibility in the Longhai area of China. Comparing the evaluation results of the three models, the RF has the best performance. Naïve Bayes (NB) algorithm is a kind of Bayesian algorithms, which is an independent feature model with simple probability classification. Due to its simplicity of construction of no requirement of complex iterative parameter estimation scheme, it has stable classification efficiency and performs well for small-scale data (Sikorska and Seibert, 2018). However, its shortcomings are also obvious, because the assumption that the attributes of the NB model are independent of each other is often untenable in practical applications. When the number of attributes is large or the correlation between attributes is good, the classification effect is poor (Lee et al., 2020). Lee et al. (2020) used NB and Bayesian network models to draw landslide susceptibility map in Umyeonsan, Korea. Both of the two models have relatively high accuracy, and the performance of NB model is slightly better than that of Bayesian network model. Multilayer perceptron (MLP) algorithm is a kind of NN algorithms. It is defined as a biological excitation feed-forward network composed of multiple layers, each layer containing multiple artificial neuron units (Yan et al., 2006). Multilayer structure and non-linear activation function enable MLP to identify non-linearly separable data with high accuracy. However, the neural unit is prone to death, leading to data diversification and loss (Kavzoglu et al., 2019). Hong et al. (2019) applied four models, NB, MLP, kernel logistic regression (KLR), and J48 bagging, to evaluate the susceptibility of landslides in Youfang area, China. It is found that the MLP model is the most stable and reasonable.
In this paper, we identified landslides by remote sensing interpretation and field geological survey verification and constructed conditioning factor combinations. Then, four machine learning methods, namely, logistic regression, multilayer perceptron, random forest, and naïve Bayes, were used to draw landslide susceptibility index maps. Finally, these results were compared and evaluated with mathematical methods and knowledge from field surveys. This study can provide a reference for the planning and construction of roads, railways, and hydropower projects in the region.
This paper selects the river basin along the G214 National Highway from Shangri-La County to Bangda town as the study area, with a total area of 23,858.54 km2. The study area is the 35 km buffer zone on both sides of the highway and the intersection of the area within the first watershed (Figure 1).
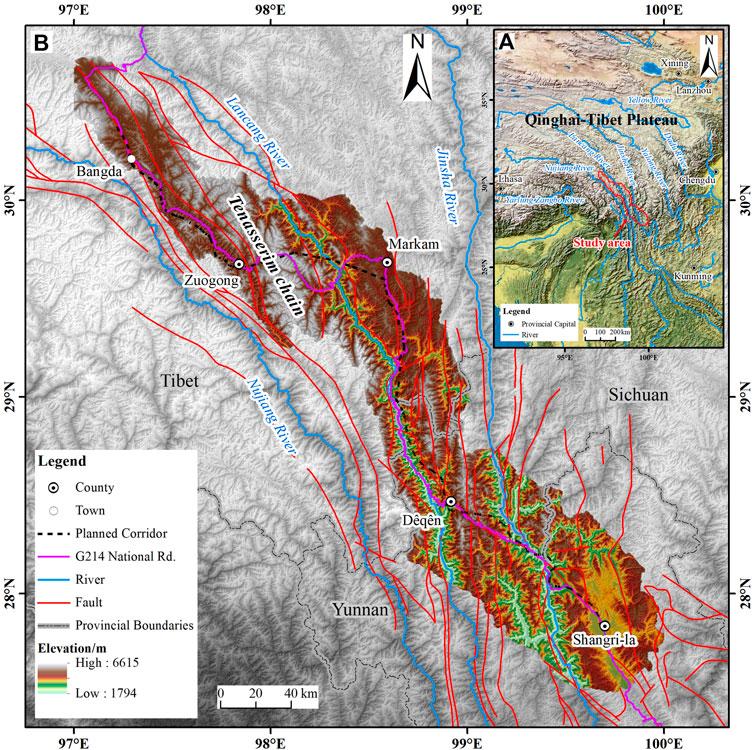
FIGURE 1. Location and tectonic map of the study area. (A) Study area location index map. (B) Regional topographic and tectonic map.
The study area is located at the southeastern edge of the collisional extrusion zone between the Eurasian and Indian plates, and the regional tectonic line is spreading north–south under solid extrusion. In addition, the neotectonic movements are intense (Peng et al., 2004). The active fault zones mainly include the Dêqên–Zhongdian fault zone, the Batang fault zone, the Jinsha fault zone, the Lancang fault zone, and the Nujiang fault zone (Chai et al., 2021). The stratigraphy of the region is well distributed and involves almost all eras, and a wide variety of rocks is present. Mesozoic terrestrial lacustrine, fluvial mudstone, and muddy sandstone strata are widely exposed, with significant thicknesses, complex lithologies, and rapid phase changes, and they are mostly soft rocks. Some areas contain slate, schist, micrite, and other metamorphic rocks. Magmatism is active, and the magmatic bodies are enormous. In addition, sedimentary rocks and early granites are generally subject to varying degrees of low-temperature and high-pressure powerful metamorphism.
Regarding geomorphological units, the area is located on the southeastern edge of the Tibetan Plateau in the middle and northern sections of the Hengduan Mountains. The area is characterized by high mountain and valley landscapes, with intermontane basins and lakes of varying sizes, juxtaposed peaks and valleys, and consistent spreading directions. The mountains are steep, most are above 4,000 m in absolute height, and the peaks are above 5,000 m, some of which reach 6,000 m or more; the peaks have year-round snow and modern glaciers. Due to the increased downcutting force of the river, the high mountain valley terrain is very well developed, with relative height differences reaching 1,000 to 1,500 m. In the north–central part, away from the gorge, the plateau surface is at altitudes of 4,200 to 4,300 m, representing a well-preserved level of ravines, and the tributaries of the three rivers have slower drops. The whole region is mainly influenced by the warm and humid air currents of both the Southeast Pacific Ocean and Southwest Indian Ocean. The distribution of the annual precipitation in the study area shows an overall trend of decreasing from southwest to northeast. At the same time, the seasonal distribution of precipitation is highly uneven, with distinct rainy and dry seasons. The rainy season is between June and September and accounts for more than 80% of the year.
The entire landslide susceptibility assessment process includes the following five steps (Figure 2): 1) preparing a landslide inventory; 2) selecting and assessing the landslide conditioning factors; 3) modeling process using the LR, MLP, RF, and NB models; 4) validating and comparing the susceptibility models; and 5) producing landslide susceptibility maps.
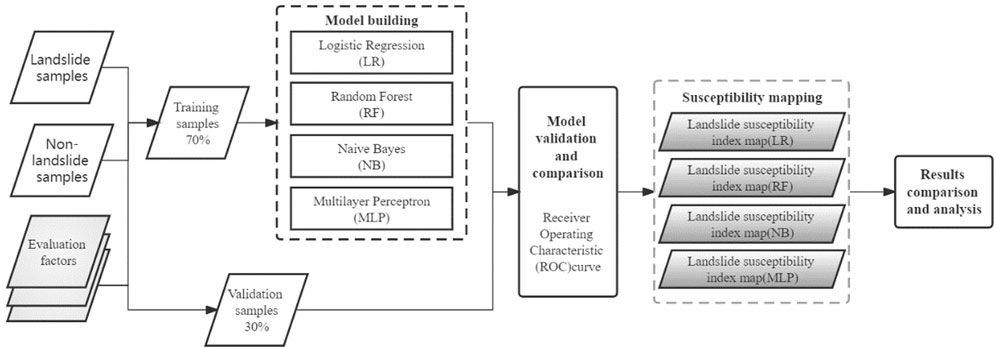
FIGURE 2. Flow chart of landslide susceptibility evaluation.
Landslide inventory is an essential input data for landslide modeling, and accurate landslide location is an important guarantee for reliable landslide susceptibility assessment. Remote sensing interpretation can be carried out according to landslide image features (e.g., rock exposure and vegetation damage) on satellite images and landslide geomorphological features (e.g., crown, headscarp, abnormal benches and landslide acceleration mass) on digital elevation model (DEM). Then, field surveys were carried out to confirm the landslide characteristics such as the headscarf, tension cracks, grab ends, undrained depressions, bulges, and lobes.
Through remote sensing interpretation of satellite images in the study area, we identified 2,308 landslide hazard points and verified 80% of landslides through two-month-long field surveys in August 2017 and August 2020. These landslide samples (Figure 3) are mainly distributed in the Jinsha River valley, Lancang River valley, and along the G214 highway. ArcGIS software was used to randomly generate the same number of random points for the landslide samples as the non-landslide samples (2,308), forming a total data set of 4,616 samples. Of these, 3,232 (70%) samples were randomly selected for machine learning modelling. The remaining 1,384 (30%) samples were used for model testing, with the same number of landslide and non-landslide samples in the training and testing samples.
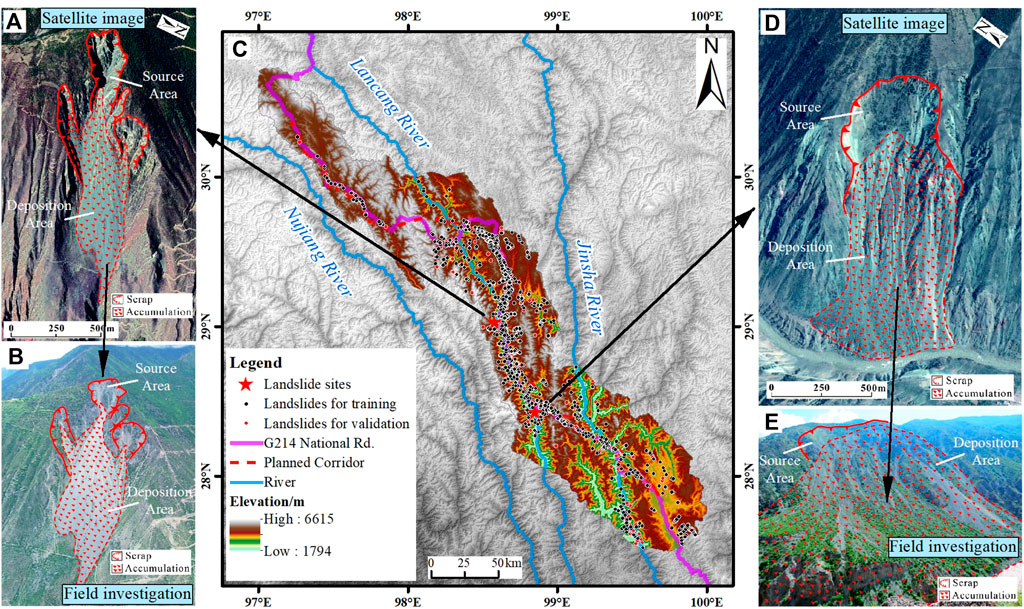
FIGURE 3. Landslide inventory map with interpretation and field validation examples. (A,D) Landslide interpretation from remote sensing images. (B,E) Field validation photographs corresponding to (A,D), respectively. (C) Landslide inventory map.
Reviewing the previous literature and combining the geological characteristics of the region, the following 13 quantifiable extraction factors were selected: elevation, slope angle, slope aspect, plan curvature, profile curvature, engineering rock group, distance to faults, distance to rivers, topographic wetness index (TWI), mean annual rainfall, normalized difference vegetation index (NDVI), land cover, and distance to roads (Table 1) (Reichenbach et al., 2018; Yao et al., 2020). Among them, the basic topographic and geomorphic factors, such as elevation, slope, aspect, plan curvature, profile curvature, and TWI, were calculated from the Advanced Land Observing Satellite (ALOS) World 3D– 30 m (AW3D30) (30 m × 30 m resolution) data that are freely disclosed by the geographic data cloud; the engineering rock group and fault data are from the 1:200,000-scale regional geological map; the NDVI data are calculated from Landsat-8 remote sensing data (2021.04.23-2021.05.08); and the data on rivers, roads, rainfall, and land cover are all from online public data. Considering the actual situation of the study area, a grid unit of 90 m × 90 m was finally selected, with a total of 2,942,534 grids.

TABLE 1. Conditioning factors and data sources.
Through ArcGIS software, the distribution map of each conditioning factor was drawn (Figure 4). Among all factors, specific values cannot be given for engineering rock groups and land cover types. The data were divided into 6 engineering rock groups according to the degree of softness and hardness of the main lithology of the stratum (Yao et al., 2020). Group 1 includes bulk structure and is mainly composed of Pleistocene and Holocene strata; Group 2 includes soft and weak rock layers that are mainly composed of conglomerate, mudstone, and shale; Group 3 contains softer rock layers that are mainly composed of slate, sandstone, and muddy tuff; Group 4 contains harder rock layers that are mainly composed of tuff and dolomite; Group 5 includes hard rock layers that are mainly composed of ejecta; and Group 6 contains tough rock layers that are mainly composed of intrusive rocks (Figure 4F). The range of NDVI values is -1 to 1. When the NDVI is less than 0, the surface is a water system, glaciers, or snow, and when the NDVI is 0, the surface is rock or bare soil. When the NDVI is greater than 0, the surface is vegetation, and when the NDVI is larger, the vegetation is lusher (Figure 4K).
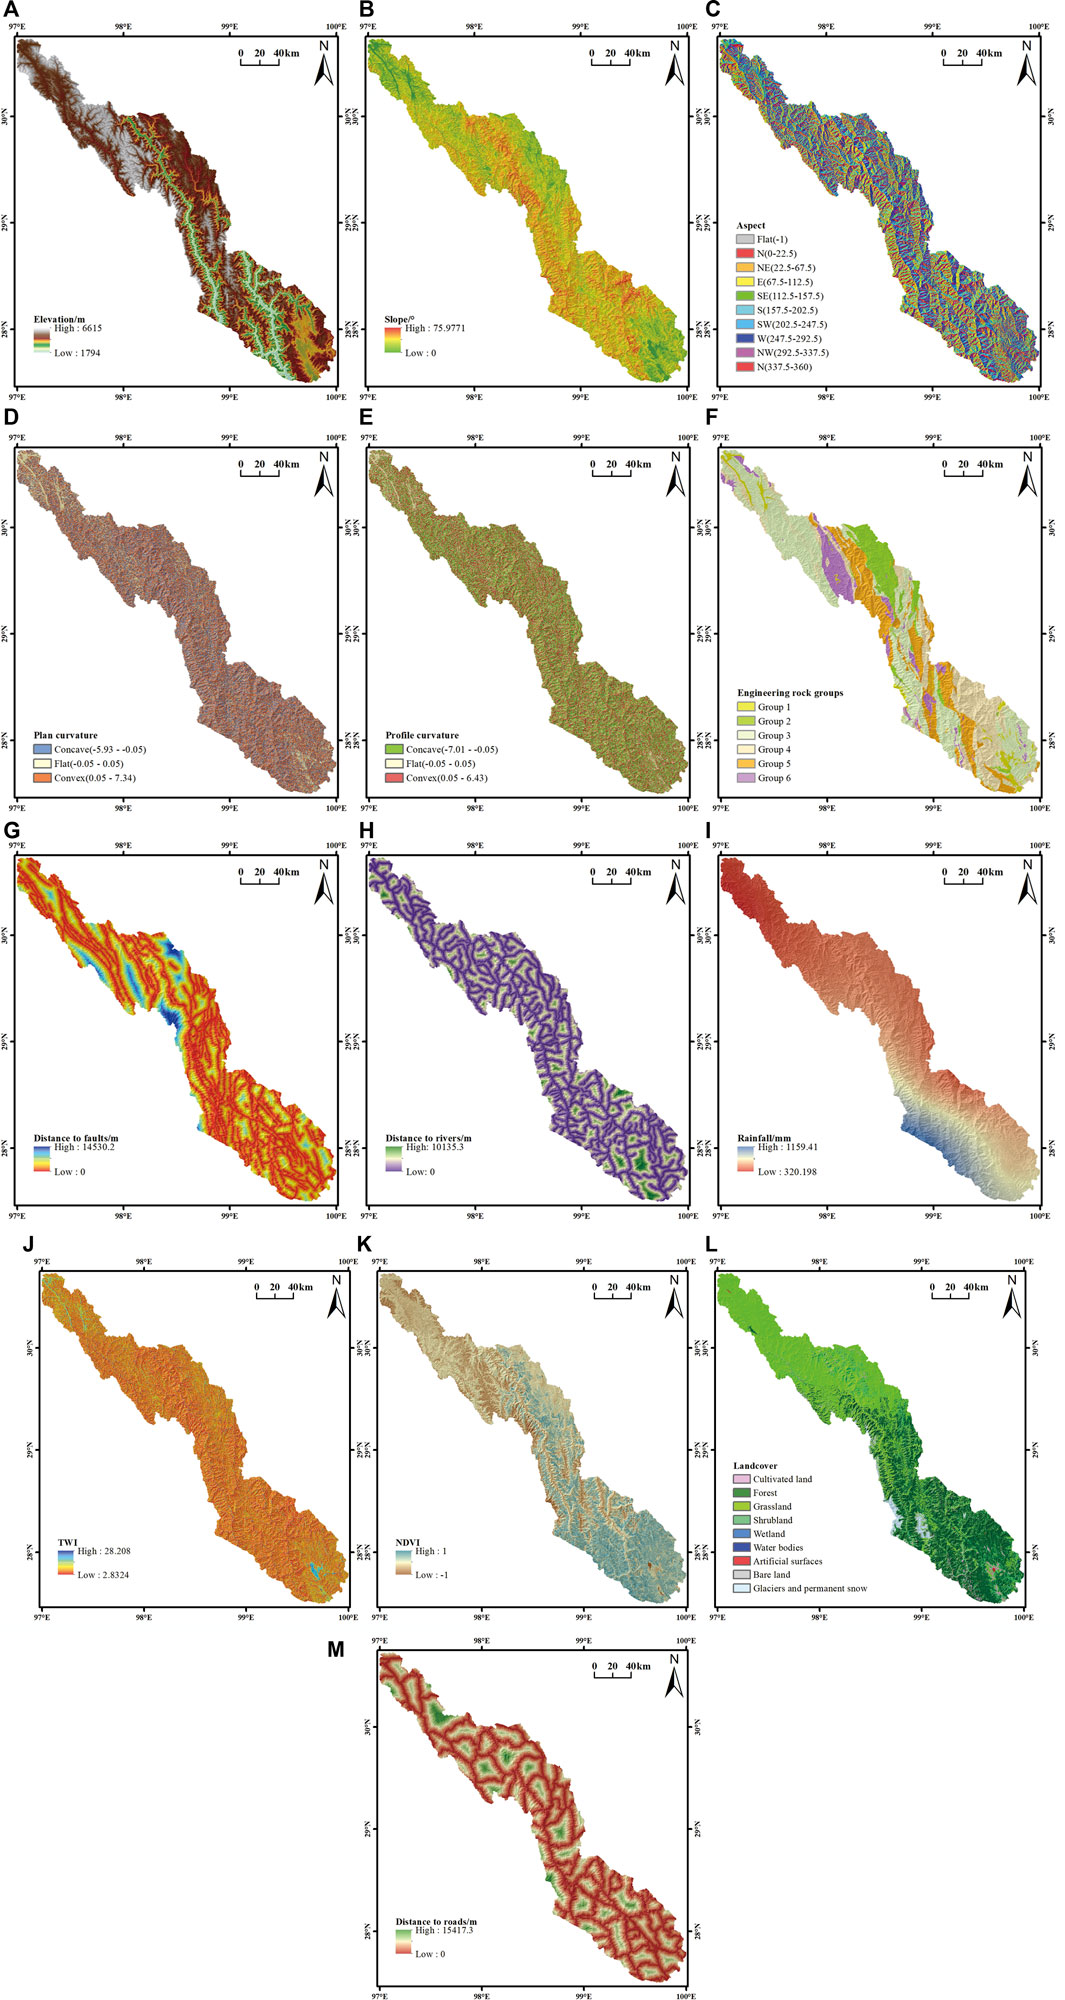
FIGURE 4. (Continued).
Multicollinearity among evaluation factors should be considered in screening susceptibility factors (Tamura et al., 2019). Multicollinearity refers to the fact that the explanatory variables in the model are not objective and accurate because of the precise or high correlation (Thompson et al., 2017). This paper tested multicollinearity by applying the variance inflation factor (VIF) and tolerance. The VIF is reciprocal to the tolerance values, which are calculated using Equations 1, 2:
where
The LR is a generalized linear regression analysis model that can better solve the problem of binary variables in the vulnerability assessment of geological disasters (Ozdemir and Altural, 2013). In the current situation, the dependent variable is a binary variable representing presence or absence of landslide. Where the dependent variable is binary, the logistic link function is applicable (Atkinson and Massari, 1998). When the probability of an event is P, the range of P values is 0–1, and the probability of the event not occurring is 1- P. When the probability value P is close to 0 or 1, it is difficult to determine the value of P, so it is necessary to transform the value of P and take the natural logarithm of P/(1- P), which is called the Logit transform, that is, Logit P =z, so P is:
where x1, x2, · · ·, xn is the landslide impact factor; β0 is the constant term; and β1, β2, · · ·, βn are the regression coefficients.
MLP is a feed-forward artificial neural network model that maps multiple input data sets to a single output data set (Ramchoun et al., 2016). A single-layer perceptron can learn only linear functions, while MLP can also learn non-linear functions, which is suitable for non-linear problems, such as landslide susceptibility evaluation. The parameters of MLP mainly include the number of neurons in the hidden layer and the type of activation function. The role of the activation function is to introduce non-linearity into the neuron’s output (Lin et al., 2008; Bui et al., 2016). MLP can use any form of activation function, but to learn efficiently using the backpropagation algorithm, the activation function must be restricted to be differentiable. Commonly used activation functions include sigmoid, tanh, and ReLU. In the landslide susceptibility mapping, input layer is the landslide conditioning factors, output layer is the result (1 or 0) class, and the hidden layer is the classifying tool (Ermini et al., 2005; Zare et al., 2013). In this paper, let x = xi, i = 1, 2, … 13 be the vector of the 13 landslide induced factors, y = 1 or 0. The formula of MLP for classification is
where f (x) is an hidden function (Pham et al., 2017b).
RF mainly obtains the optimal classification result through the voting results of each tree in multiple decision trees (Youssef et al., 2016). Each decision tree has more comprehensive variable input information due to the method of replacement and the data set obtained by randomly obtaining data features. The model’s robustness can be improved by integrating multiple decision trees, which can prevent model overfitting (Ravì et al., 2016). The main feature of the RF model is that it can give the Gini index of the corresponding input variable, that is, the importance order of each input variable. In the RF tree, impurity is used to measure the optimal segmentation, and the importance of the basic environmental factor is calculated by the reduction value DGk of the Gini index of environmental factor k when the node is divided (Masetic and Subasi, 2016). It involves calculating the percentage of the average Gini reduction in the sum of the average Gini reductions of all basic environmental factors, as follows:
where m, n, and t are the total numbers of basic environmental factors, the number of classification trees and the number of nodes in a single tree, respectively; DGkhj is the reduction value of the Gini index of the kth factor on the jth node of the hth tree; and Pk is the kth factor in the severity of the underlying environmental factors.
NB is a method based on Bayes’ theorem and assumes that feature conditions are independent of each other (Kavzoglu et al., 2019). First, through the given training set, with the assumption that the feature words are independent of each other, the joint probability distribution is learned from input to output, and then based on the learned model, X is input to find the output Y that maximizes the posterior probability (Bhargavi and Jyothi, 2009).
There is a sample data set
NB is based on the independence of each feature. In the case of a given category y, the above formula can be further expressed as follows:
From the above two equations, the posterior probability can be calculated as follows:
Since the number of P(X) is fixed, only the numerator part of the above formula needs to be compared when comparing the posterior probability. Therefore, a NB calculation in which the sample data belong to category yi can be obtained:
Positive predictive rate (PPR), negative predictive rate (NPR), sensitivity, specificity, accuracy (ACC), F-measure (
where TP (true positive) and TN (true negative) are the numbers of pixels that are correctly classified as landslides. FP (false positive) and FN (false negative) are the numbers of pixels that are incorrectly classified.
The receiver operating characteristic (ROC) curve reflects the relationship between sensitivity and specificity (Mandrekar, 2010). It is a graph generated at different thresholds from the false positive rate (1-specificity) on the x-axis and the true positive rate (sensitivity) on the y-axis. Sensitivity and specificity represent the probability that the model correctly judges landslides and non-landslides. However, these two indicators cannot show the overall accuracy of the model performance, so the area under the curve (AUC) value is generally used to test the model accuracy. The AUC value refers to the area enclosed by the ROC curve and the coordinate axis and is an evaluation index for calculating the performance of the binary classifier. The AUC value ranges from 0 to 1, and the closer the AUC value is to 1, the higher the prediction accuracy of the model (Mandrekar, 2010; Shahabi et al., 2019).
By extracting the training data set and performing collinearity diagnosis on the values of all evaluation factors of each sample, Table 2 is obtained. The results show that the VIF values of all landslide conditioning factors are lower than the threshold value of 10, of which the maximum value is only 2.25 and the minimum value is 1.03. There is no multicollinearity problem among the factors influencing the landslides in the study area, and all proposed landslide conditioning factors are suitable for use in the study area.
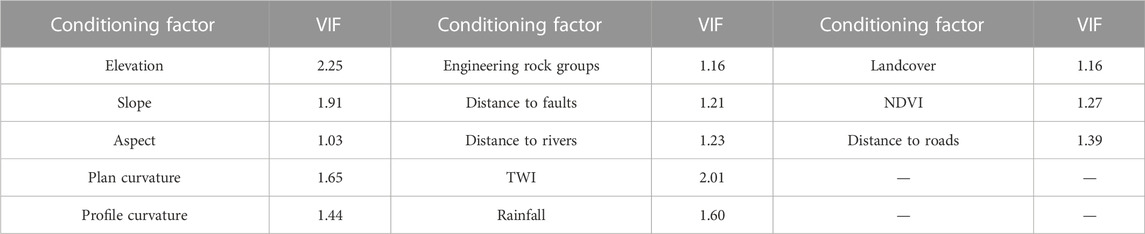
TABLE 2. Inspection table for the VIF values of the landslide evaluation factor.
In the process of landslide modelling through a machine learning algorithm, the importance of each conditioning factor can be obtained by analysing the characteristics of variables. The importance obtained by different algorithms is inconsistent, as shown in Figure 5. If the importance of each conditional factor is equal, the importance of the conditional factor is 1/13, equal to .077. We believe that the condition factor with importance greater than .077 is the main factor controlling the landslide development. In the LR model, elevation, slope, distance to rivers and distance to roads are the main factors; in the MLP model, elevation, rainfall and plan curvature are the main factors; in the RF model, elevation, slope, distance to rivers, profile curvature, aspect, rainfall and distance to roads are the main factors; in the NB model, aspect, plan curvature, slope, rainfall and distance to faults are the main factors. Among the four models, the elevation, slope and rainfall importance of three models are the main factors; the distance to rivers, aspect, distance to roads, distance to faults and plan curvature importance of two models are the main factors; the profile curvature importance of one model is the main factor; and the TWI, NDVI, landcover and engineering rock groups importance of none model are the main factors. It can be found that topographic factors (elevation, slope, aspect, plan curvature, and profile curvature), meteorological and hydrological factors (rainfall and distance to rivers), human activity factor (distance to roads) and tectonic factor (distance to faults) are of higher importance.

FIGURE 5. Relative importance of landslide conditioning factors.
The probability distributions of landslide occurrence predicted by the four models, LR, RF, NB, and MLP, are shown in Figure 6. The landslide-prone locations in the four distribution maps are roughly the same, and they are all distributed along rivers, trunk faults, and highways, which is also consistent with the results obtained from field surveys and theoretical analysis. However, the four distribution maps have their characteristics and shortcomings. In the distribution map of the LR model, the area surrounding Markam County is displayed in red, indicating that the landslide susceptibility in this area is generally high. However, in addition to the river valley and the area along the highway, it includes many mountains. Compared with other model distribution maps, the area is too large, and the distribution is unreasonable. In the MLP model, the distribution of high-susceptibility regions is more reasonable. However, the probability of landslide occurrence is concentrated at both ends of 0 and 1, which causes a steep change in the evaluation result from low susceptibility to high susceptibility. This result does not match the actual situation. The RF and NB model distribution maps show relatively clear and coherent evaluation results. The distribution of high-risk areas also follows the characteristics of distribution along river valleys and highways, which are more reasonable.
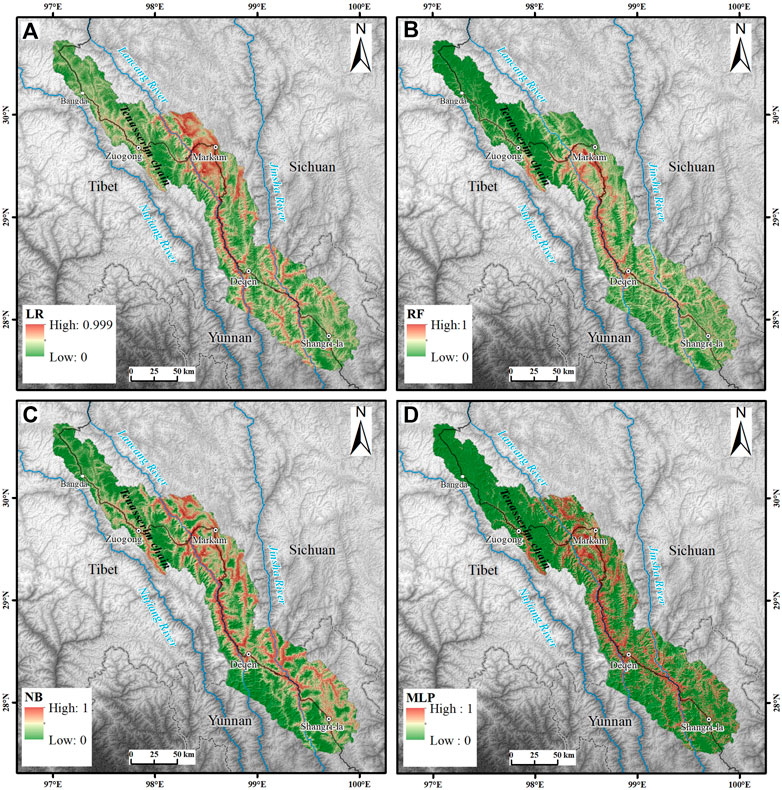
FIGURE 6. Landslide susceptibility index maps. (A) LR model (B) RF model (C) NB model (D) MLP model.
The performance of the applied models was assessed and compared using statistical indices (Table 3). For the performance of the landslide testing data set, the RF model (PPR = 80.95%, NPR = 85.56%, sensitivity = 86.56%, specificity = 79.62%, ACC = 83.09%, F1 = .84, and k = .66) performs the best, followed by MLP (PPR = 74.79%, NPR = 76.11%, sensitivity = 76.73%, specificity = 74.13%, ACC = 75.43%, F1 = .76, and k = .51), LR (PPR = 72.97%, NPR = 71.99%, sensitivity = 71.39%, specificity = 73.55%, ACC = 72.47%, F1 = .72, and k = .45), and NB (PPR = 69.99%, NPR = 73.17%, sensitivity = 75.14%, specificity = 67.77%, ACC = 71.46%, F1 = .72, and k = .43).
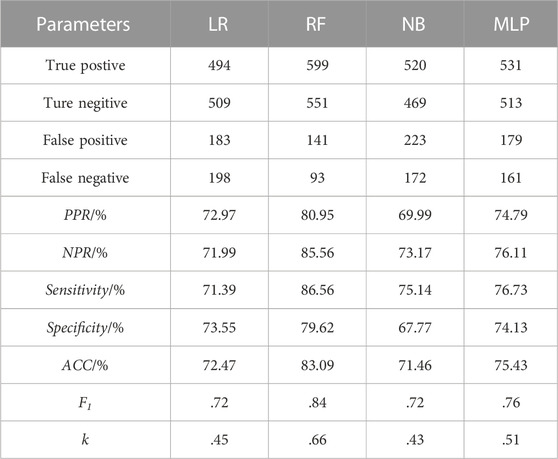
TABLE 3. Statistical index results of different models.
The ROC curves of LR, RF, NB and MLP models were drawn by extracting the landslide susceptibility probability values of the test sample points in each model, combined with the actual value of landslide occurrence at the test sample points (Figure 7). The AUC values of the LR, RF, NB, and MLP models are .788, .918, .785, and .836, respectively, all of which are greater than .7. When the AUC value ≤.5, the result has no predictive value; when .5 < AUC value ≤.7, the model accuracy is low; when .7 < AUC value ≤.9, the model accuracy is high; when .9 < AUC value ≤1, the model has very high accuracy (Chen et al., 2017). The AUC accuracy of the four models is high or very high, indicating that the susceptibility partitions of the four models can better predict the regional landslide susceptibility. Among them, the AUC value of the RF model is greater than .9, and the evaluation results are excellent. The order of accuracy of the four models is RF > MLP > LR > NB.
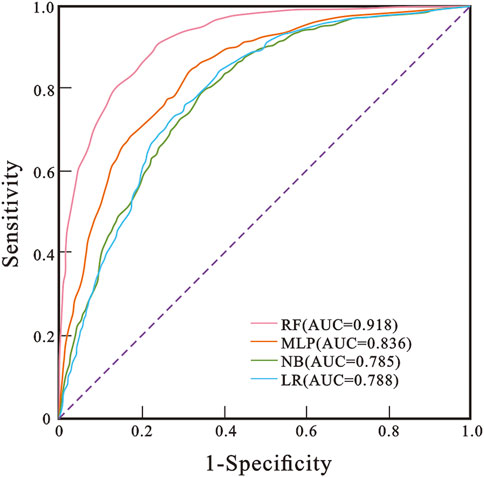
FIGURE 7. ROC curve of the prediction rate for the RF, MLP, NB, and LR models with the validation data set.
Calculate the average value of the importance of each model landslide conditioning factor in Figure 5, and the factors according to their importance are in the following order: elevation, slope, rainfall, distance to rivers, aspect, distance to roads, distance to faults, profile curvature, plan curvature, TWI, NDVI, land cover, and engineering rock group. Since the average importance is greater than .077, elevation, slope, rainfall, distance to rivers and aspect are the main factors controlling landslide development in the study area. The elevation indicates the potential energy of the slope and controls the stability of the slope to a large extent (Hong et al., 2020). It affects not only the water content and stress in the slope but also the strength of human engineering activities and the vegetation distribution on the slope surface. The slope reflects the steepness and gentleness of the surface and controls the stability of the slope body to a certain extent. As the slope increases, there is a strong stress concentration at the foot of the slope, which easily causes landslides under the induction of other factors (Kavzoglu et al., 2019). Rainfall has always been considered as the main inducement of landslide. Rainfall infiltration can increase the weight of the slope, enhance the pore water pressure, and reduce the shear strength of the slope forming materials, leading to the loss of slope stability (Yan et al., 2019). The river has cut and eroded the bank of the slope for a long time, especially in the flood season, which has greatly increased the free face of the front edge of the slope, creating natural conditions for the occurrence of geological disasters, mainly in the spatial distribution of landslides (Zhao et al., 2019). The slope aspect shows the inclination direction of the slope, which has a certain control over the formation and distribution of landslides in the study area. In particular, many aspects show significant differences between sunny and shady slopes. In the study area, the south-facing slope is exposed to the sun for a longer time, with stronger radiation, more luxuriant vegetation and a higher weathering degree. Therefore, the rock and soil mass characteristics in different slope directions are different, and the geological disasters developed on them are different spatially (Hong et al., 2017).
The LR model is more inclined to solve linear problems (Pradhan and Lee, 2010). For the non-linear susceptibility evaluation with 13 evaluation factors, the adaptability of the LR model is relatively poor, and the accuracy of the evaluation results is relatively low. The specific performance indicates that the probability distribution of landslide occurrence is unreasonable, and the AUC value is almost at the bottom of the four models. The processing power of RF models for high-dimensional data sets is excellent (Zhang et al., 2017). It can process thousands of input variables and determine the essential variables. In addition, it has the advantages of anti-interference and high-accuracy (Merghadi et al., 2020). In landslide susceptibility evaluation research, its performance has always been relatively stable and the performance is the best in this study. The NB model is less sensitive to missing data, and the algorithm is relatively simple (Sikorska and Seibert, 2018). When the NB model has a given output category and a large number of attributes, the classification effect is not good (Lee et al., 2020). This result leads to the lowest AUC value of this model. The MLP model has outstanding adaptability to the fitting of non-linear problems (Kavzoglu et al., 2019). The MLP model has a remarkable property: if enough neurons and layers are present, it is theoretically possible to learn arbitrary input‒output functions (Yan et al., 2006). Therefore, it performed well in this study. In conclusion, the study shows that the RF model is more suitable for landslide susceptibility evaluation in this area than the MLP, LR, and NB models.
The landslide susceptibility index values were normalized and classified into five susceptibility classes (very low, low, moderate, high, and very high) using the natural break method by LR, RF, NB, and MLP (Figure 8). Compared with the classification methods such as defined intervals, equal intervals, quantiles, and standard deviations, the natural break method depends on the intrinsic features of the dataset and has no subjective opinions (Chen and Zhang, 2021), so it was adopted in this study. The area and landslide proportion in each landslide susceptibility class are shown in Figure 9.
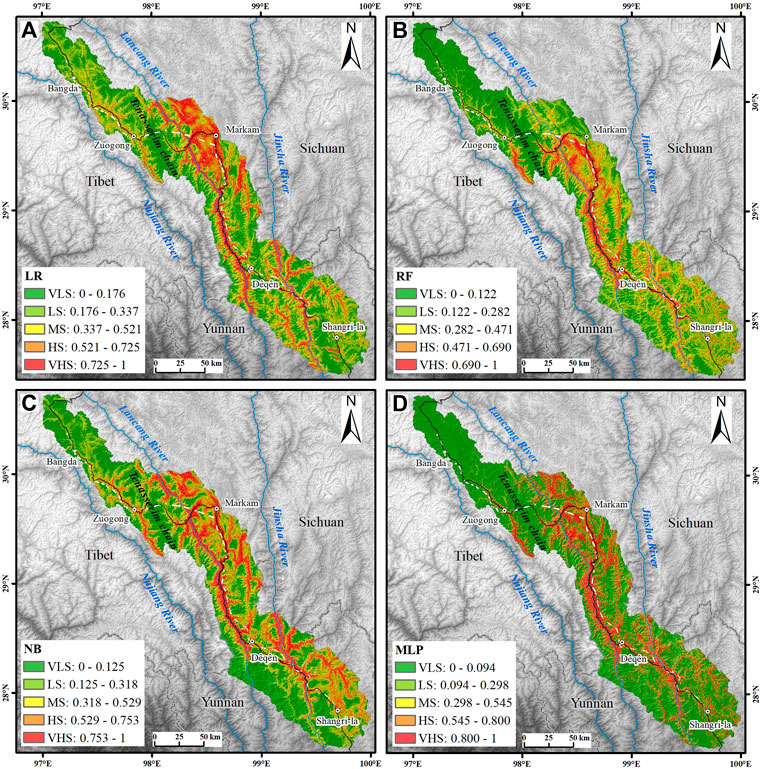
FIGURE 8. Landslide-prone zoning using the (A) LR method, (B) RF method, (C) NB method, and (D) MLP method. VLS, very low susceptibility; LS, low susceptibility; MS, moderate susceptibility; HS, high susceptibility; VHS, very high susceptibility.
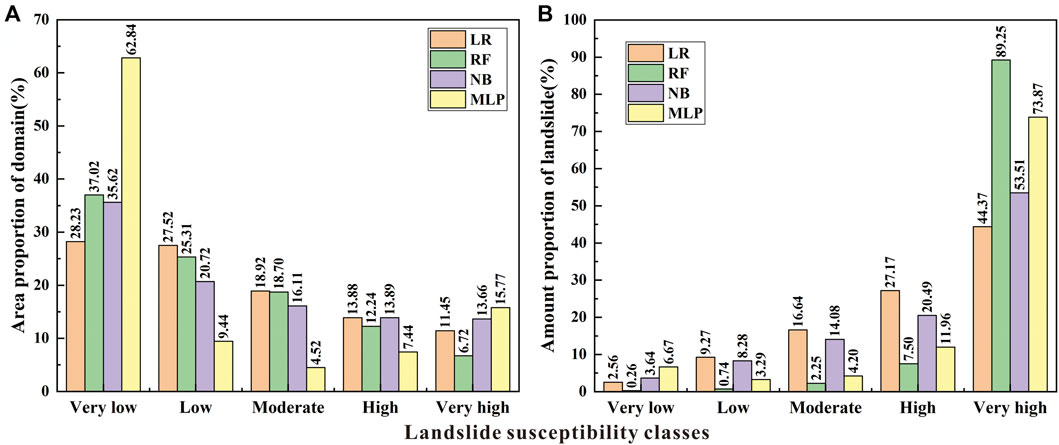
FIGURE 9. Quantitative analysis of the landslide susceptibility maps. (A) Area proportion of the domain in each susceptibility class. (B) Proportion of landslides in each susceptibility class.
In general, the area proportions of domains as very low, low, moderate, high and very high susceptibility classes of each model that decrease sequentially (Figure 9A). The area proportions of LR, RF and NB are similar, while the very low susceptibility class of MLP accounts for 62.84%, which is the majority. Overall, the proportion of landslides in the very low, low, moderate, high and very high susceptibility classes of each model increases sequentially (Figure 9B). Among them, the proportion of landslides in the very high susceptibility class of the RF model is the highest, reaching 89.25%, presenting the most efficient model for landslide prediction, followed by the MLP model (73.87%), while the proportion of landslides in the NB and LR models is the lowest. This finding is consistent with the ROC curve verification results.
In the RF model with the most reasonable prediction, very high, high, moderate, low and very low susceptibility zones accounted for 6.72%, 12.24%, 18.70%, 25.31% and 37.02% of the total area, respectively (Figure 9A). Among them, the total area of very low and low prone areas is close to 2/3, and these areas are mainly distributed in the gentle plateau area to the west of the Tenasserim chain and the peak area of alpine valleys. The total area of high and very high prone areas is close to 1/5, and these areas are mainly distributed in the Jinsha River and its tributaries, the Lancang River and its tributaries, and the steep canyon areas along the G214 highway (Figure 8B). These areas overlap greatly with human activities and pose significant security risks. The development of landslide hazards is affected by plate movement. The continuous uplift of the Qinghai–Tibet Plateau has created deep and steep river valley landforms, and the river valleys are often distributed along faults, resulting in the fragmentation of the bank slope rock mass and the development of fissures (Peng et al., 2004). In addition, the runoff on the bank slope surface is large. Therefore, the infiltration of rainfall and ice and snow melt water increases the water content of the bank slope, thereby increasing the pore water pressure inside the rock and soil mass; the freeze‒thaw cycle causes the joints and fissures to expand and penetrate. The cutting slope at the foot of the slope or the scouring of the river makes the front edge of the slope form a void and weakens the supporting force (Zhao et al., 2019). Under the superposition of these factors, the slope body cracks and slips under the action of gravity, forming a failure process of local sliding at the leading edge to creeping, pulling, and cracking, and then to overall sliding. For example, as shown in Figure 3D, the slope toe of Jianwangtong landslide was unstable due to long-term scouring by the river, resulting in traction sliding as a whole.
Some limitations and uncertainty should be noted in this study. First, due to the large area of the study area and the limitation of computer computing ability, the grid size of 90 m * 90 m is selected in this paper. This grid is so large that multiple landslides may be included in the same grid. These landslides may be on both banks of the river and at different elevations of the same slope, but they are all given the same parameters, resulting in a certain degree of distortion of the input data of the condition factors. Different algorithm models have their unique characteristics, and the performance of each model variables according to the input data (Nachappa et al., 2020). This will eventually lead to the deviation of landslide susceptibility assessment results. Second, the spatial resolution of some condition factors is inconsistent (such as elevation, engineering rock group and distance to rivers). Although it is difficult to accurately define the uncertainty caused by the inconsistent spatial resolution (Rahman et al., 2021), the interpolation and extraction made in the process of unifying the condition factor data into 90 m resolution will also affect the assessment results of each model, Especially the model with high sensitivity to input data.
Based on the results of this study, the following can be concluded:
1) This paper obtained 2,308 landslide sample data points and established a relatively complete landslide catalogue database. The elevation, slope, aspect, plan curvature, profile curvature, topographic wetness index, distance to rivers, mean annual rainfall, engineering rock group, distance to faults, normalized difference vegetation index, land cover, and distance to roads were selected as conditioning factors. By calculating the influential factor importance, it was found that the elevation, slope, rainfall, distance to rivers, and aspect play a significant role.
2) Four susceptibility index distribution maps were obtained using the LR, RF, NB, and MLP machine learning algorithms to train the model. AUC values of LR, RF, NB and MLP model test samples were .788, .918, .785, and .836, respectively. The results show that these four models have good prediction accuracy and are suitable for landslide susceptibility evaluation of the Yunnan–Tibet traffic corridor in the Three Rivers Region. Based on the distribution of the AUC values and susceptibility index, it was found that the evaluation result of the RF model is the most reasonable in this area.
3) Using the natural break method, the landslide susceptibility index values of the RF model were divided into five susceptibility classes: very high, high, moderate, low, and very low, with area ratios of 6.72%, 12.24%, 18.70%, 25.31% and 37.02%, respectively. The zones of high and very high landslide susceptibility are mainly distributed in the Jinsha River and its tributaries, the Lancang River and its tributaries, and the steep canyons along the G214 highway. The very low and low susceptibility zones are distributed in the gentle plateau area to the west of the Tenasserim chain and the peak areas of the alpine valleys. Affected by plate movement, the mountains in this area are towering and constantly rising, and the accompanying active faults break the rock mass and develop fissures, which makes the rivers strongly undercut and sidecut, thereby forming a steep river valley with unloading belts. Affected by topography, traffic engineering should be constructed along river valleys and face the threat of severe landslides and other geological slope disasters. The results can provide a scientific basis and reference for landslide disaster prevention and mitigation work in the major construction of traffic corridor in the three parallel river areas.
The original contributions presented in the study are included in the article/Supplementary Material, further inquiries can be directed to the corresponding author.
Conceptualization, SW, SL, and JH; Data curation, XW and SL; Formal analysis, SW, HW, and CS; Funding acquisition, SL; Investigation, SW, SL, and HW; Project administration, SL; Software, SW, HW, and JH; Supervision, XW; Validation, SL, CS, and JH; Visualization, SW, CS, and XW; Writing-original draft, SW and FW; Writing-Review and editing, SL, HW, and CS. All authors have read and agreed to the published version of the manuscript.
This research was funded by the National Natural Science Foundation of China (grant number 41907228), Sichuan Science and Techonology Program (grant number 2023YFS0364), Chengdu Science and Technology Program (grant number 2022-YF05-00340-SN), and Sichuan Science and Technology Innovation and Seeding Cultivation (grant number 2021086).
We greatly appreciate the field assistance provided by colleagues in China Railway Eryuan Engineering Group Co., Ltd. and Southwest Jiaotong University. We also thank the editor-in-chief, editor, and two reviewers for their critical comment and valuable suggestion to improve this manuscript.
The authors declare that the research was conducted in the absence of any commercial or financial relationships that could be construed as a potential conflict of interest.
All claims expressed in this article are solely those of the authors and do not necessarily represent those of their affiliated organizations, or those of the publisher, the editors and the reviewers. Any product that may be evaluated in this article, or claim that may be made by its manufacturer, is not guaranteed or endorsed by the publisher.
Arabameri, A., Pradhan, B., Rezaei, K., Sohrabi, M., and Kalantari, Z. (2019). GIS-based landslide susceptibility mapping using numerical risk factor bivariate model and its ensemble with linear multivariate regression and boosted regression tree algorithms. J. Mt. Sci. 16, 595–618. doi:10.1007/s11629-018-5168-y
Atkinson, P. M., and Massari, R. (1998). Generalized linear modeling of susceptibility to landsliding in the central Apennines. Italy Comput. Geosci. 24, 373–385. doi:10.1016/s0098-3004(97)00117-9
Ayalew, L., and Yamagishi, H. (2005). The application of GIS-based logistic regression for landslide susceptibility mapping in the Kakuda–Yahiko Mountains Central Japan. Geomorphology 65, 15–31. doi:10.1016/j.geomorph.2004.06.010
Bhargavi, P., and Jyothi, S. (2009). Applying naive bayes data mining technique for classification of agricultural land soils. Int. J. Comput. Sci. Netw. Secur. 9, 117–122.
Bui, D. T., Tuan, T. A., Klempe, H., Pradhan, B., and Revhaug, I. (2016). Spatial prediction models for shallow landslide hazards: A comparative assessment of the efficacy of support vector machines, artificial neural networks, kernel logistic regression, and logistic model tree. Landslides 13, 361–378. doi:10.1007/s10346-015-0557-6
Cama, M., Conoscenti, C., Lombardo, L., and Rotigliano, E. (2016). Exploring relationships between grid cell size and accuracy for debris-flow susceptibility models: A test in the giampilieri catchment (sicily, Italy). Environ. Earth Sci. 75, 238. doi:10.1007/s12665-015-5047-6
Chai, C. Y., Ling, S. X., Wu, X. Y., Hu, T., and Su, D. (2021). Characteristics of the in situ stress field and engineering effect along the lijiang to Shangri-La railway on the southeastern Tibetan plateau, China. Adv. Civ. Eng. 2021, 1–11. doi:10.1155/2021/6652790
Chen, W. W., and Zhang, S. (2021). GIS-based comparative study of Bayes network, Hoeffding tree and logistic model tree for landslide susceptibility modeling. Catena 203, 105344. doi:10.1016/j.catena.2021.105344
Chen, W., Xie, X., Wang, J., Pradhan, B., Hong, H., Bui, D. T., et al. (2017). A comparative study of logistic model tree, random forest, and classification and regression tree models for spatial prediction of landslide susceptibility. Catena 151, 147–160. doi:10.1016/j.catena.2016.11.032
Chen, W., Zhang, S., Li, R. W., and Shahabi, H. (2018). Performance evaluation of the GIS-based data mining techniques of best-first decision tree, random forest, and naive Bayes tree for landslide susceptibility modeling. Sci. Total Environ. 644, 1006–1018. doi:10.1016/j.scitotenv.2018.06.389
Choubin, B., Mosavi, A., Alamdarloo, E. H., Hosseini, F. S., Shamshirband, S., Dashtekian, K., et al. (2019). Earth fissure hazard prediction using machine learning models. Environ. Res. 179, 108770. doi:10.1016/j.envres.2019.108770
Ermini, L., Catani, F., and Casagli, N. (2005). Artificial neural networks applied to landslide susceptibility assessment. Geomorphology 66, 327–343. doi:10.1016/j.geomorph.2004.09.025
Hong, H. Y., Liu, J. Z., and Zhu, A. X. (2019). Landslide susceptibility evaluating using artificial intelligence method in the Youfang district (China). Environ. Earth Sci. 78, 488–520. doi:10.1007/s12665-019-8415-9
Hong, H. Y., Liu, J. Z., and Zhu, A. X. (2020). Modeling landslide susceptibility using LogitBoost alternating decision trees and forest by penalizing attributes with the bagging ensemble. Sci. total Environ. 718, 137231. doi:10.1016/j.scitotenv.2020.137231
Hong, H. Y., Pradhan, B., Sameen, M. I., Chen, W., and Xu, C. (2017). Spatial prediction of rotational landslide using geographically weighted regression, logistic regression, and support vector machine models in Xing Guo area (China). Geomatics, Nat. Hazards Risk 8, 1997–2022. doi:10.1080/19475705.2017.1403974
Huang, F. M., Cao, Z. S., Guo, J. F., Jiang, S. H., Li, S., and Guo, Z. Z. (2020). Comparisons of heuristic, general statistical and machine learning models for landslide susceptibility prediction and mapping. Catena 191, 104580. doi:10.1016/j.catena.2020.104580
Huang, J. P., Ling, S. X., Wu, X. Y., and Deng, R. (2022a). GIS-Based comparative study of the bayesian network, decision table, radial basis function network and stochastic gradient descent for the spatial prediction of landslide susceptibility. Land 11, 436. doi:10.3390/land11030436
Huang, J. P., Ma, N., Ling, S. X., and Wu, X. Y. (2022b). Comparing the prediction performance of logistic model tree with different ensemble techniques in susceptibility assessments of different landslide types. Geocarto Int., 1–31. doi:10.1080/10106049.2022.2087751
Kavzoglu, T., Colkesen, I., and Sahin, E. K. (2019). “Machine learning techniques in landslide susceptibility mapping: A survey and a case study,” in Landslides: Theory, practice and modelling (Berlin, Germany: Springer), 283–301. doi:10.1007/978-3-319-77377-3_13
Lee, S., Lee, M. J., Jung, H. S., and Lee, S. (2020). Landslide susceptibility mapping using naive bayes and bayesian network models in umyeonsan, korea. Geocarto Int. 35, 1665–1679. doi:10.1080/10106049.2019.1585482
Li, X. N., Ling, S. X., Sun, C. W., Xu, J. X., and Huang, T. (2019). Integrated rockfall hazard and risk assessment along highways: An example for Jiuzhaigou area after the 2017 Ms 7.0 Jiuzhaigou earthquake, China. J. Mt. Sci. 16, 1318–1335. doi:10.1007/s11629-018-5355-x
Ließ, M., Glaser, B., and Huwe, B. (2012). Uncertainty in the spatial prediction of soil texture: Comparison of regression tree and random forest models. Geoderma 170, 70–79. doi:10.1016/j.geoderma.2011.10.010
Lin, W. T., Chou, W. C., and Lin, C. Y. (2008). Earthquake-induced landslide hazard and vegetation recovery assessment using remotely sensed data and a neural network-based classifier: A case study in central taiwan. Nat. hazards 47, 331–347. doi:10.1007/s11069-008-9222-x
Ling, S. X., Sun, C. W., Li, X. N., Ren, Y., Xu, J. X., and Huang, T. (2021). Characterizing the distribution pattern and geologic and geomorphic controls on earthquake-triggered landslide occurrence during the 2017 Ms 7.0 Jiuzhaigou earthquake, Sichuan, China. Landslides 18, 1275–1291. doi:10.1007/s10346-020-01549-6
Ling, S. X., Zhao, S. Y., Huang, J. P., and Zhang, X. T. (2022). Landslide susceptibility assessment using statistical and machine learning techniques: A case study in the upper reaches of the minjiang river, southwestern China. Front. Earth Sci. 10, 986172. doi:10.3389/feart.2022.986172
Mandrekar, J. N. (2010). Receiver operating characteristic curve in diagnostic test assessment. J. Thorac. Oncol. 5, 1315–1316. doi:10.1097/JTO.0b013e3181ec173d
Masetic, Z., and Subasi, A. (2016). Congestive heart failure detection using random forest classifier. Comput. Methods Programs Biomed. 130, 54–64. doi:10.1016/j.cmpb.2016.03.020
Merghadi, A., Yunus, A. P., Dou, J., Whiteley, J., ThaiPham, B., Bui, D. T., et al. (2020). Machine learning methods for landslide susceptibility studies: A comparative overview of algorithm performance. Earth-Science Rev. 207, 103225. doi:10.1016/j.earscirev.2020.103225
Nachappa, T. G., Ghorbanzadeh, O., Gholamnia, K., and Blaschke, T. (2020). Multi-hazard exposure mapping using machine learning for the state of salzburg, Austria. Remote Sens. 12, 2757. doi:10.3390/rs12172757
Niu, R. Q., Peng, L., Ye, R. Q., and Wu, X. L. (2012). Landslide susceptibility assessment based on rough sets and support vector machine. J. Jilin Univ. Sci. Ed. 42, 430–439. (In Chinese with English abstract). doi:10.13278/j.cnki.jjuese.2012.02.015
Ozdemir, A., and Altural, T. (2013). A comparative study of frequency ratio, weights of evidence and logistic regression methods for landslide susceptibility mapping: Sultan Mountains, SW Turkey. J. Asian Earth Sci. 64, 180–197. doi:10.1016/j.jseaes.2012.12.014
Peng, J. B., Cui, P., and Zhuang, J. Q. (2020). Challenges to engineering geology of Sichuan-Tibet railway. Chin. J. Rock Mech. Eng. 39, 2377–2389. (In Chinese with English abstract). doi:10.13722/j.cnki.jrme.2020.0446
Peng, J. B., Ma, R. Y., Lu, Q. Z., Li, X. A., and Shao, T. Q. (2004). Geological hazards effects of uplift of Qinghai-Tibet Plateau. Adv. Earth Sci. 19, 457–466. (In Chinese with English abstract). doi:10.3321/j.issn:1001-8166.2004.03.018
Peters, J., Baets, B. D., Verhoest, N. E. C., Samson, R., Degroeve, S., Becker, P. D., et al. (2007). Random forests as a tool for ecohydrological distribution modelling. Ecol. Model. 207, 304–318. doi:10.1016/j.ecolmodel.2007.05.011
Pham, B. T., Bui, D. T., Prakash, I., and Dholakia, M. B. (2017b). Hybrid integration of Multilayer Perceptron Neural Networks and machine learning ensembles for landslide susceptibility assessment at Himalayan area (India) using GIS. CATENA 149, 52–63. doi:10.1016/j.catena.2016.09.007
Pham, B. T., Bui, D. T., and Prakash, I. (2017a). Landslide susceptibility assessment using bagging ensemble based alternating decision trees, logistic regression and J48 decision trees methods: A comparative study. Geotechnical Geol. Eng. 35, 2597–2611. doi:10.1007/s10706-017-0264-2
Pham, B. T., Trung, N. T., Qi, C. C., Phong, T. V., Dou, J., Ho, L. S., et al. (2020). Coupling RBF neural network with ensemble learning techniques for landslide susceptibility mapping. Catena 195, 104805. doi:10.1016/j.catena.2020.104805
Pradhan, B., and Lee, S. (2010). Delineation of landslide hazard areas on Penang Island, Malaysia, by using frequency ratio, logistic regression, and artificial neural network models. Environ. Earth Sci. 60, 1037–1054. doi:10.1007/s12665-009-0245-8
Rahman, M., Chen, N. S., Elbeltagi, A., Islam, M. M., Alam, M., Pourghasemi, H. R., et al. (2021). Application of stacking hybrid machine learning algorithms in delineating multi-type flooding in Bangladesh. J. Environ. Manag. 295, 113086. doi:10.1016/j.jenvman.2021.113086
Ramchoun, H., Janati Idrissi, M. A., Ghanou, Y., and Ettaouil, M. (2016). Multilayer perceptron: Architecture optimization and training. Int. J. Interact. Multimedia Artif. Intell. 4, 26–30. doi:10.9781/ijimai.2016.415
Ravì, D., Bober, M., Farinella, G. M., Guarnera, M., and Battiato, S. (2016). Semantic segmentation of images exploiting DCT based features and random forest. Pattern Recognit. 52, 260–273. doi:10.1016/j.patcog.2015.10.021
Reichenbach, P., Rossi, M., Malamud, B. D., Mihir, M., and Guzzetti, F. (2018). A review of statistically-based landslide susceptibility models. Earth-science Rev. 180, 60–91. doi:10.1016/j.earscirev.2018.03.001
Shahabi, H., Jarihani, B., TavakkoliPiralilou, S., Chittleborough, D., Avand, M., and Ghorbanzadeh, O. (2019). A semi-automated object-based gully networks detection using different machine learning models: A case study of bowen catchment, queensland, Australia. Sensors 19, 4893. doi:10.3390/s19224893
Sikorska, A. E., and Seibert, J. (2018). Value of different precipitation data for flood prediction in an alpine catchment: A bayesian approach. J. hydrology 556, 961–971. doi:10.1016/j.jhydrol.2016.06.031
Tamura, R., Kobayashi, K., Takano, Y., Miyashiro, R., Nakata, K., and Matsui, T. (2019). Mixed integer quadratic optimization formulations for eliminating multicollinearity based on variance inflation factor. J. Glob. Optim. 73, 431–446. doi:10.1007/s10898-018-0713-3
Thompson, C. G., Kim, R. S., Aloe, A. M., and Becker, B. J. (2017). Extracting the variance inflation factor and other multicollinearity diagnostics from typical regression results. Basic Appl. Soc. Psychol. 39, 81–90. doi:10.1080/01973533.2016.1277529
Wen, H., Wu, X. Y., Ling, S. X., Sun, C. W., Liu, Q., and Zhou, G. Y. (2022). Characteristics and susceptibility assessment of the earthquake-triggered landslides in moderate-minor earthquake prone areas at southern margin of Sichuan Basin, China. Bull. Eng. Geol. Environ. 81, 346. doi:10.1007/s10064-022-02821-w
Xiong, P., Tong, L., Zhang, K., Shen, X. H., Battiston, R., Ouzounov, D., et al. (2021). Towards advancing the earthquake forecasting by machine learning of satellite data. Sci. Total Environ. 771, 145256. doi:10.1016/j.scitotenv.2021.145256
Yan, F., Zhang, Q. W., Ye, S., and Ren, B. (2019). A novel hybrid approach for landslide susceptibility mapping integrating analytical hierarchy process and normalized frequency ratio methods with the cloud model. Geomorphology 327, 170–187. doi:10.1016/j.geomorph.2018.10.024
Yan, H. M., Jiang, Y. T., Zheng, J., Peng, C. L., and Li, Q. H. (2006). A multilayer perceptron-based medical decision support system for heart disease diagnosis. Expert Syst. Appl. 30, 272–281. doi:10.1016/j.eswa.2005.07.022
Yan, Y., Cui, Y. F., Huang, X. H., Zhou, J. J., Zhang, W. G., Yin, S. Y., et al. (2022). Combining seismic signal dynamic inversion and numerical modeling improves landslide process reconstruction. Earth Surf. Dynam. 10, 1233–1252. doi:10.5194/esurf-10-1233-2022
Yao, X., Deng, J. H., Liu, X. H., Zhou, Z. K., Yao, J. M., Dai, F. C., et al. (2020). Primary recognition of active landslides and development rule analysis for pan Three-river-parallel Territory of Tibet Plateau. Adv. Eng. Sci. 52, 16–37. (In Chinese with English abstract). doi:10.15961/j.jsuese.202000529
Yao, X., Tham, L. G., and Dai, F. C. (2008). Landslide susceptibility mapping based on support vector machine: A case study on natural slopes of Hong Kong, China. Geomorphology 101, 572–582. doi:10.1016/j.geomorph.2008.02.011
Youssef, A. M., Pourghasemi, H. R., Pourtaghi, Z. S., and Al-Katheeri, M. M. (2016). Landslide susceptibility mapping using random forest, boosted regression tree, classification and regression tree, and general linear models and comparison of their performance at Wadi Tayyah Basin, Asir Region, Saudi Arabia. Landslides 13, 839–856. doi:10.1007/s10346-015-0614-1
Zare, M., Pourghasemi, H. R., Vafakhah, M., and Pradhan, B. (2013). Landslide susceptibility mapping at vaz watershed (Iran) using an artificial neural network model: A comparison between multilayer perceptron (MLP) and radial basic function (RBF) algorithms. Arabian J. Geosciences 6, 2873–2888. doi:10.1007/s12517-012-0610-x
Zhang, D. F., Fengquan, L., and Jianmin, B. (2000). Eco-environmental effects of the qinghai-tibet plateau uplift during the quaternary in China. Environ. Geol. 39, 1352–1358. doi:10.1007/s002540000174
Zhang, K. X., Wu, X. L., Niu, R. Q., Yang, K., and Zhao, L. R. (2017). The assessment of landslide susceptibility mapping using random forest and decision tree methods in the Three Gorges Reservoir area, China. Environ. Earth Sci. 76, 405. doi:10.1007/s12665-017-6731-5
Zhang, Y. S., Guo, C. B., Yao, X., Yang, Z. H., Wu, R. A., and Du, G. L. (2016). Research on the geohazard effect of active fault on the eastern margin of the Tibetan Plateau. Acta Geosci. Sin. 37, 277–286. (In Chinese with English abstract). doi:10.3975/cagsb.2016.03.03
Keywords: landslide susceptibility, machine learning algorithms, variable importance, three rivers region, yunnan-tibet traffic corridor
Citation: Wang S, Ling S, Wu X, Wen H, Huang J, Wang F and Sun C (2023) Key predisposing factors and susceptibility assessment of landslides along the Yunnan–Tibet traffic corridor, Tibetan plateau: Comparison with the LR, RF, NB, and MLP techniques. Front. Earth Sci. 10:1100363. doi: 10.3389/feart.2022.1100363
Received: 16 November 2022; Accepted: 21 December 2022;
Published: 06 January 2023.
Edited by:
Chengyi Pu, Central University of Finance and Economics, ChinaReviewed by:
Yuan Feng, University of Nebraska-Lincoln, United StatesCopyright © 2023 Wang, Ling, Wu, Wen, Huang, Wang and Sun. This is an open-access article distributed under the terms of the Creative Commons Attribution License (CC BY). The use, distribution or reproduction in other forums is permitted, provided the original author(s) and the copyright owner(s) are credited and that the original publication in this journal is cited, in accordance with accepted academic practice. No use, distribution or reproduction is permitted which does not comply with these terms.
*Correspondence: Sixiang Ling, bGluZ3N4QHN3anR1LmVkdS5jbg==
Disclaimer: All claims expressed in this article are solely those of the authors and do not necessarily represent those of their affiliated organizations, or those of the publisher, the editors and the reviewers. Any product that may be evaluated in this article or claim that may be made by its manufacturer is not guaranteed or endorsed by the publisher.
Research integrity at Frontiers
Learn more about the work of our research integrity team to safeguard the quality of each article we publish.