 Musa Khan
 Huan Li
 Asad Khan2
 Waqas Hussain
 Rehan Khan
95% of researchers rate our articles as excellent or good
Learn more about the work of our research integrity team to safeguard the quality of each article we publish.
Find out more
ORIGINAL RESEARCH article
Front. Earth Sci. , 10 January 2023
Sec. Environmental Informatics and Remote Sensing
Volume 10 - 2022 | https://doi.org/10.3389/feart.2022.1096850
This article is part of the Research Topic Evaluation, Projection, and Prevention of Dynamic Geological Disasters: Advances and Applications of Geophysical Methods and Numerical Modeling View all 6 articles
The stability of tunnel site depends upon the deformation behaviors of the surrounding rocks, including joint density, mineral composition, micro cracks, and grain boundaries. The aim of this study was to analyze the mechanical properties of the Besham Complex in Northern Pakistan in terms of petrography and joint analysis. The Besham complex is prone to deformation as it is bounded by the Main Mantle Thrust (MMT) in the north, the Thakot fault (Tf) in the east, and the Swat block in the west. In the study area, the deformation was observed at the mesoscopic scale, while alteration in grains and fractures were determined at a microscopic scale. Detailed petrographic study of the representative samples from each station revealed that the area is dominantly composed of granite, quartz syenite, quartz monzonite, granodiorite, quartz-rich granitoid, monzogranite, alkali feldspar granite, and quartz monzodiorite. Extensive field work was performed to determine the joint volume (JV), in which the number of joints per cubic meter was recorded for each joint set. The rock quality designation (RQD) was calculated through JV analysis. An RQD value <25% suggested that most rocks are very poor quality, while samples with RQD values between 25% and 50% are poor quality. The petrographic analysis revealed that the dominant contents of the rock samples are feldspar (55.6%), quartz (27%), and mica (17.4%). Petrographic control over surface joint volume was established, suggesting that abundant feldspar, coarse grain, anhedral to subhedral grain shape, microcracks, and alteration of minerals provide planes of weakness for joints and thus reduce the RQD value. Therefore, some serious precautions and supporting measurements, such as shotcrete, rock bolts, metal mesh, and steel arch supports, are essential to avoid severe geo-hazards during further excavation.
Geotechnical and geological investigations of rock are very important factors for tunnel construction (Hoek, 1982; He et al., 2021; Ma et al., 2022). Sufficiently high stresses cause fractures in rocks, and an overall reduction in the bearing capacity of the rocks occurs (Ewy and Cook, 1990). The rock mass quality depends upon the rock mass deformability, rock mass strength, discontinuity, anisotropy, weathering, and alteration effects (Panthi, 2006; Abdelhamid et al., 2022). The construction of tunnels is a problematic engineering project that could be affected by unforeseen geological conditions; therefore, geological investigation plays a significant role in the construction of tunnels (Balasubramanian, 2016).
The construction of a tunnel could be affected by deformation of the surrounding rocks (Singh et al., 2011; Hao and Yan, 2015; Kainthola, 2015; Gomah et al., 2022. The deformation behavior of surrounding rocks has been studied, and various solutions have been proposed by many geologists. Huang and Huabo (2010) studied the construction of tunnels through a faulted rock mass of metasandstone overlain by slope debris and described the geological settings, highlighting the poor quality of the rocks in the area. Wang et al. (1984) studied the classification of rocks on an underground engineering basis, such as pressure control and stress on rocks, and also studied the rock deformation mechanisms, structures, and characteristics of the classification. Zhang (2016) performed a rock mass classification of the deformed rocks for underground excavation and engineering projects. Rock mass strength, rock classification, geology structure, stress and strain, and discontinuities all have a great impact on tunnel stability (Keykha et al., 2012). The rock quality designation (RQD) can be determined using number of joints per unit volume based on joint analysis (Abdeh Keykha and Huat, 2011). Previously, joint analysis has been carried out to find out the RQD to check the rock mass quality for a tunnel (Terzaghi, 1946). Palmström (1982) first used the scanline method to determine joint volume (Palmström, 1982). RQD is used to check the quality of rock mass for tunnels and engineering purposes (Deere, 1964) and has been used in many engineering projects for more than 20 years. The method is still in use (Deere, 1988; Abdeh Keykha and Huat, 2011). Palmström (1982) used RQD to determine rock mass quality in a case of no core logs, which can help determine the joint volume count. The mechanical response properties of rock are controlled by grain size, grain shape, degree of interlocking, types of contact, and mineral composition (Irfan, 1996; Sun et al., 2017; Ahmad et al., 2021).
In the study, a divergent tunnel is being constructed to divert the water of Khan Khwar to the power house of the Karora Hydropower Project. The purpose of this hydropower project is to produce 11.8 MW of electricity. The feasibility report of August 2011 was obtained from Associated Consultant Engineers ACE (PVT) (Ltd, 2011). This report revealed that the tunnel is sited on the complex lithology of the Besham Complex (Hussain et al., 2004) with mixed lithologies, that is, a heterogeneous mixture of schist, gneisses, granitic gneisses, amphibolites, blue quartzite, metapsammites and other pegmatites, mylonites, phyllonites, weakly deformed hornblende granodiorite and undeformed microgranites, pelite-rich metasedimentary rock, mafic dykes (LaFortune, 1988; Williams, 1989), and structures, such as shear zones, weak strata, fault gouges, mylonites, and microfolding, and the presence of groundwater, alteration products, and breccia (Ltd, 2011). The stabilization and construction of tunnel in a mélange zone is challenging work (Panthee et al., 2016).
The aim of this study was to identify the Karora Hydropower tunnel stability problems based on joint analysis (joint density), petrography, structural features (folding) analysis, and general geology of the study area. For this purpose, a field survey was conducted to collect 17 rock samples along the tunnel site (Figure 2) and determine joint volume and deformation, such as minor folds, joints, fractures, and weathering, and alteration at various stations.
The main objectives of this study include: 1) to determine RQD based on the number of joints per unit volume. 2) To evaluate the rock characteristics and compositional features such as mineralogy, grain boundary, grain texture, grain shape, fractures, and grain size using petrographic parameters. 3) To identify the mineralogical and textural characteristics of rock samples and their correlation with the engineering properties of the study area to determine how these parameters control the rock stability. 4) To correlate petrographic results and joint surface volume of the rocks to establish how the volume of a joint is controlled by petrography.
Geologically, Northern Pakistan is divided into three territories from north to south: the Eurasian Plate, the Kohistan Island Arc, and the Indian Plate (Figure 1) (Irving, 1979). In the late Triassic, Pangea was divided into two super continents, Laurasia to the north and Gondwanaland to the south, separated by the Tethys Ocean (Du Toit, 1937). The Indian Plate was part of Gondwanaland, which rifted away from this super continent about 130 Ma (Johnson et al., 1976), followed by the opening of the Indian Ocean and extensive sea floor spreading (Kazmi and January, 1997). The Indian Plate began to move northward; the Neotethys Ocean started to close around 130 Ma, and intra-oceanic subduction started to generate a series of volcanic arcs, such as Kohistan Ladakh, Kandhar, and Nuristan, during the Cretaceous (Searle, 1991; Treloar and Izatt, 1993). Between the Late Cretaceous and Eocene, the Indo-Pakistan landmass collided with the Kohistan Island Arc and the Eurasian Plate, which resulted in the Himalayan fold and thrust belt (Molnar and Tapponnier, 1975; Stocklin, 1977; Tahirkheli, 1979; Windley, 1983; Farah et al., 1984; Petterson and Windley, 1985; Baig and Lawrence, 1987; Yeats and Hussain, 1987). The squeezing of the Kohistan Ladakh arc between the Indian and Asian Plates and the closing of the Tethys produced two mega structures, the Main Karakoram Thrust (MKT) or the Shyok Suture in the north and the Main Mantle Thrust (MMT) or the Indus Suture in the south (Figure 1) (Rehman et al., 2011).
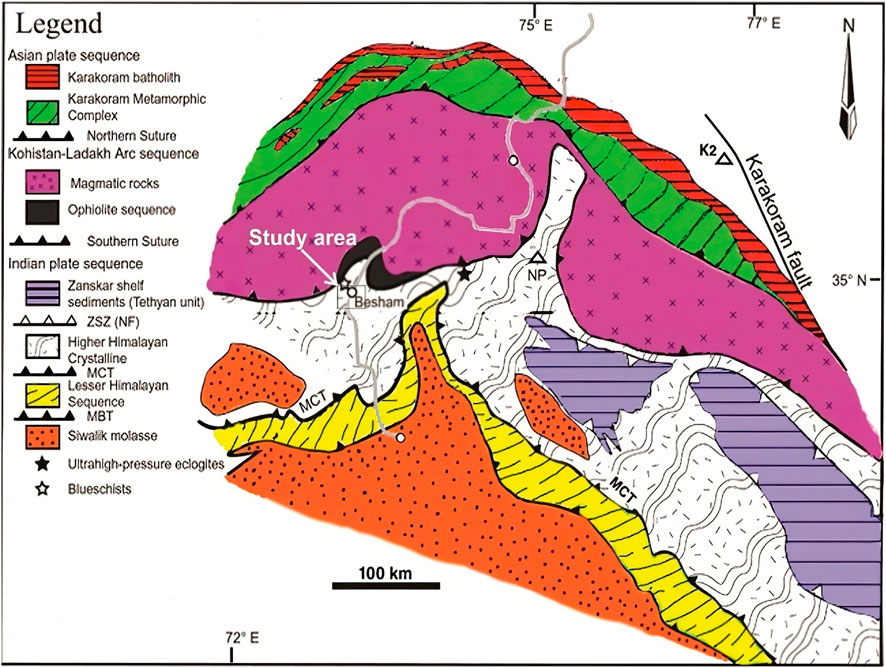
FIGURE 1. Regional geological map of the Northwest Himalaya showing major tectonic units of the Indian Plate, rocks of the Kohistan–Ladakh arc sequence, and the southern margin of the Asian Plate. Modified after Rehman et al. (2011).
The study area is situated in the south, close to the MMT, which passes about 20 km north of the study area, and in the rock mass belonging to the Indian Plate, as shown in the regional geological map (Figure 1). The Besham basement block is bounded on the east and west by the high-angle and north-trending Thakot and Puran Fault shear zones (Baig and Lawrence, 1987).
The research study area is located in the Besham Complex (Figure 2). The word “complex” is used to describe the rocks of the Besham area, where an assemblage of rocks of different origins are folded together, complicated, and intricately mixed (Ibrahim Shah, 1977). Stratigraphically, the Besham Complex is divided into five units (Besham group, mafic dykes, granitic intrusion and associated pegmatites, Karora group, and leucogranite). The oldest unit is the Besham group, which was defined and named by Fletcher et al. (1986).
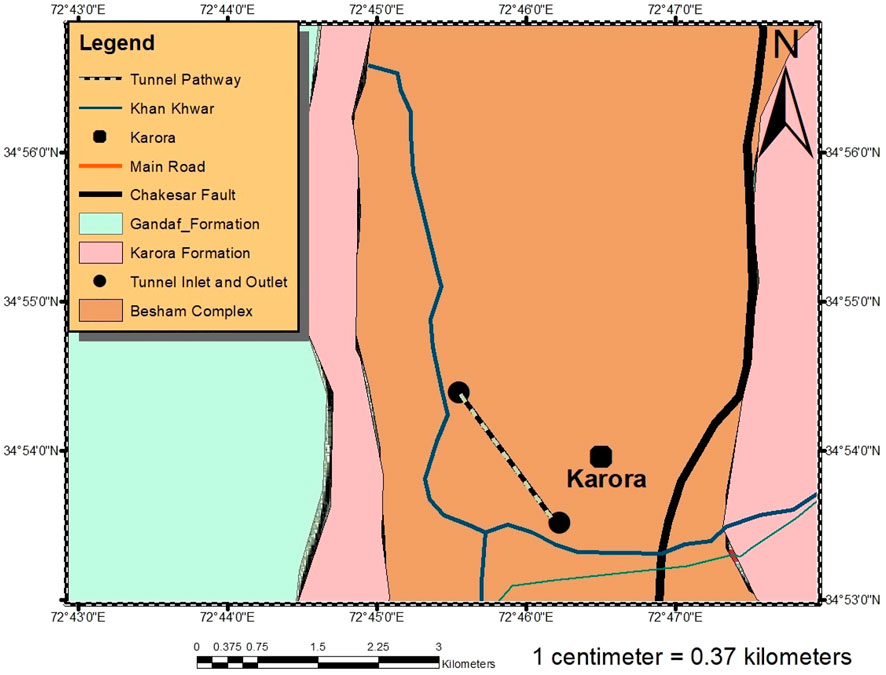
FIGURE 2. Detailed geological map of the study area modified after Hussain et al. (2004).
The Besham group is mainly composed of a heterogeneous mixture of schist, gneisses, amphibolites, blue quartzite, metapsammites, and other pegmatites, mylonites, phyllonites, weakly deformed hornblende granodiorite, and undeformed microgranites (Williams, 1989). The few amphibolites are cross cut by pegmatite. Boudinage structures have commonly been reported in the form of pegmatite and amphibolite within the gneisses (Williams, 1989). Structures found in the Besham group include tight, upright to recumbent folds (LaFortune, 1988; Baig, 1990). According to LaFortune (1988), the second oldest are the mafic dykes that intrude into the Besham group. These dykes have metamorphosed to amphibolite grade. The third group of rocks include small granitic intrusion and associated pegmatites. The granitic intrusions are named Shang and Dubair granodiorite and considered late stage differentiation of Lahore granite by Ashraf et al. (1980). LaFortune (1988) named pegmatite as Shorgara Pegmatites. The fourth unit of the Besham Complex is the Karora group, which lies unconformably over the earlier three units. Jan and Tahirkheli (1969) and Ashraf et al. (1980) identified an unconformity between the Besham and Karora groups. The Karora group is a pelite rich metasedimentary sequence that overlies unconformably on the Besham group. The lithologies of the Karora group are folded and crenulated phyllites and schists that have metamorphosed at greenschist to amphibolite facies (Williams, 1989). Conglomerate, carbonaceous, and calcareous metasediments of the Karora group provide evidence for more than one metamorphic event (Kazmi and January, 1997). The fifth unit is leucogranite, which intrudes into both the Karora and Besham groups according to LaFortune (1988). These rocks are equigranular, medium-grained and contain quartz, biotite, microcline, oligoclase, and accessory sphene and pyrite (Kazmi and January, 1997).
This study included field data acquisition, joint volume, and laboratory work. The detailed steps are described as follows.
The field trip was conducted for about 2 weeks in the study area. This procedure involved collecting data from the extensive geological field in the form of joint parameters through joint analysis, from which we could find the RQD value, and rock samples were collected for thin sections. These methods were used to determine the rocks’ mechanical response for the suitability of the Karora Hydropower tunnel construction. Rock samples for petrographic study from each station in the study area were selected. Important features like grain size, grain color, grain texture, and mineral composition were noted on the basis of hand specimen observation.
In the study area, the geographic coordinates of each station were recorded, and important field features like major and minor folding, deformation, and boudinage structures were also observed and photographed. The joint analysis, such as joint orientation, was performed by the directional data on the dip and strike of the joints, using a Silva Ranger Compass.
Joint density was determined through the scanline method using a 1-m measuring tape. We drew a 1 m cube using spray paint in the outcrop for each station. First, we determined whether the rock had one, two, or three sets of joints. We counted the number of joints for each set and then added them to obtain the value of JV to determine the RQD (see Eq. 1).
The RQD was developed and defined by Deere and Miller (1966). RQD is defined as the sum of intact core pieces longer than 10 cm in the total length of the core (Deere and Miller, 1966). Palmström (1982) proposed that when a core is unavailable, the RQD may be estimated from the number of joints per unit volume, in which the number of joints per meter cube is added for each joint set. The RQD values in this research were estimated from the number of joints per cubic meter. The suggested relationship between RQD and JV is given by Eq. 1 (Palmström, 1982).
JV (joint volume) is the sum of the number of joints per unit length for all joint sets.
After the field work, we selected 17 suitable samples for making thin sections. The thin section samples were cut at the National Centre of Excellence in Geology (NCEG), University of Peshawar’s rock cutting laboratory. Thin sections were examined for model mineralogy, micro cracks, grain boundary, and grain size at the petrography laboratory at the University of Swat’s Center for Earth and Space Sciences (CESS). Additionally, the data collected in the field were processed in the computer laboratory at CESS to generate geological and stratigraphic maps of the study area. The model mineralogy for rock sample classification was performed based on the International Union of Geological Sciences (IUGS). Finally, various structure features, such as drag fold, major fold, and boudinage structures, were marked, and rose diagrams were plotted for the direction of various stresses observed in the rocks by using the strike and dip of each joint sets (Tables 2, 3, and 4 and Figures 3A, 4A, and 5A). The laboratory work was accomplished using different software packages, such as Corel Draw X7, ArcGIS 10.5, WinRock Wizard, and GeoRose 0.5.1.
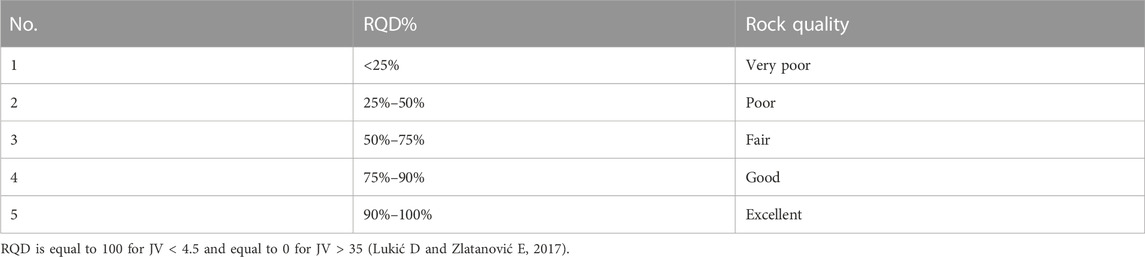
TABLE 1. Correlation between RQD and rock mass quality.
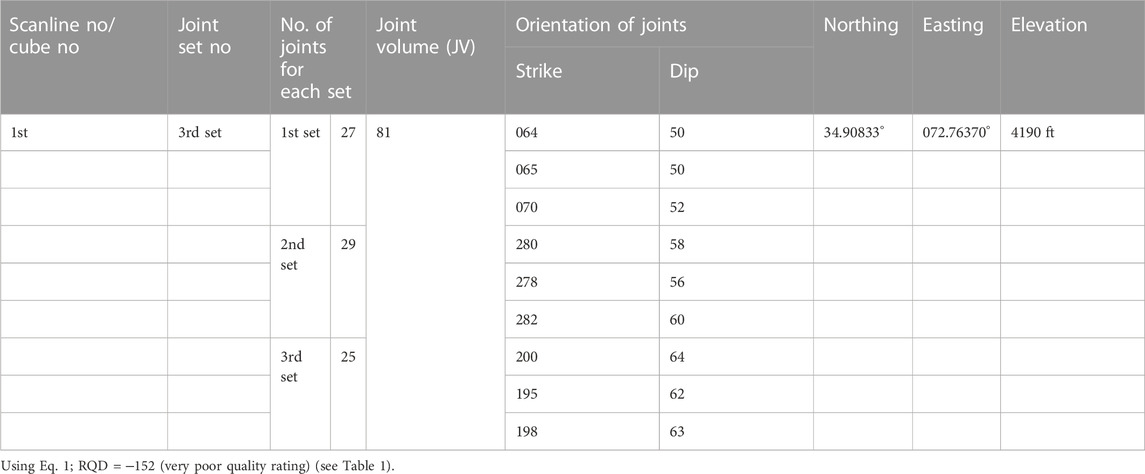
TABLE 2. JV, strike and dip data, and geographic coordinates of high joint density rocks.
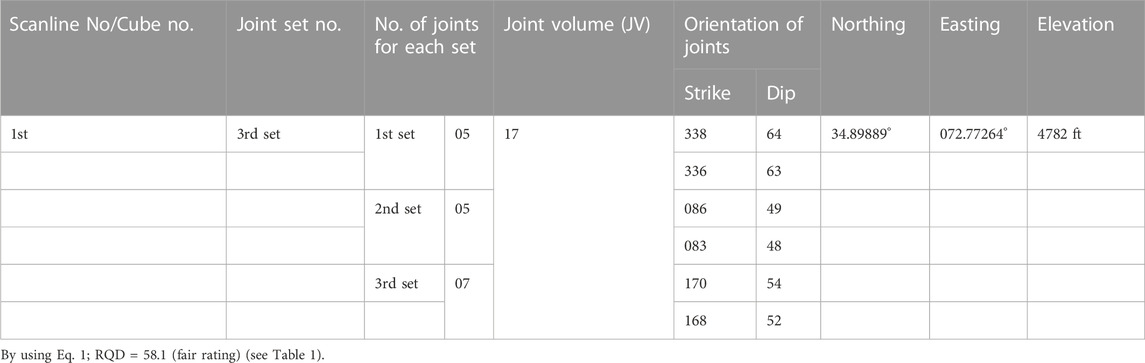
TABLE 3. JV, strike and dip data, and geographic coordinates of medium joint density rocks.
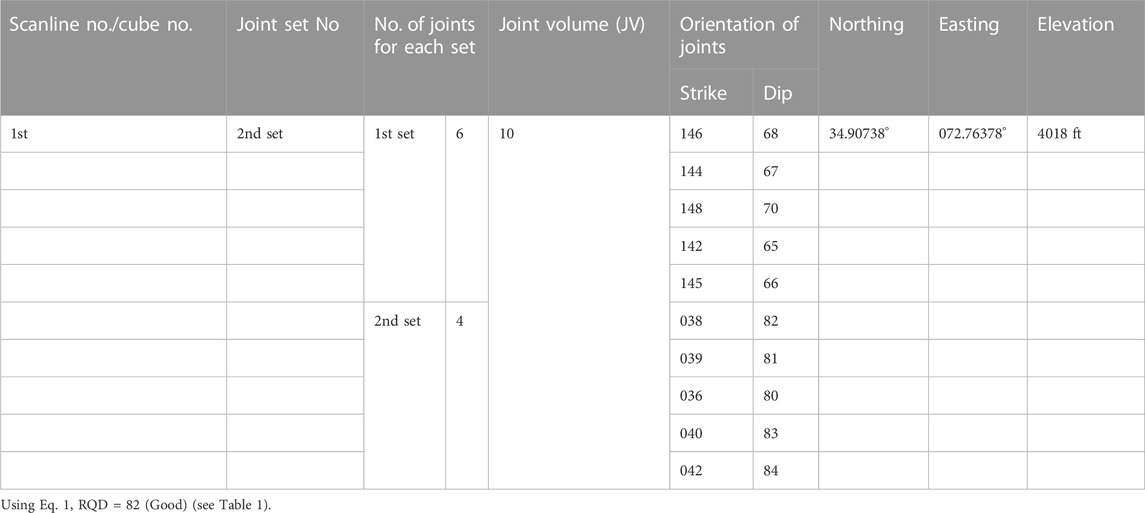
TABLE 4. JV, strike and dip data, and geographic coordinates of low joint density rocks.
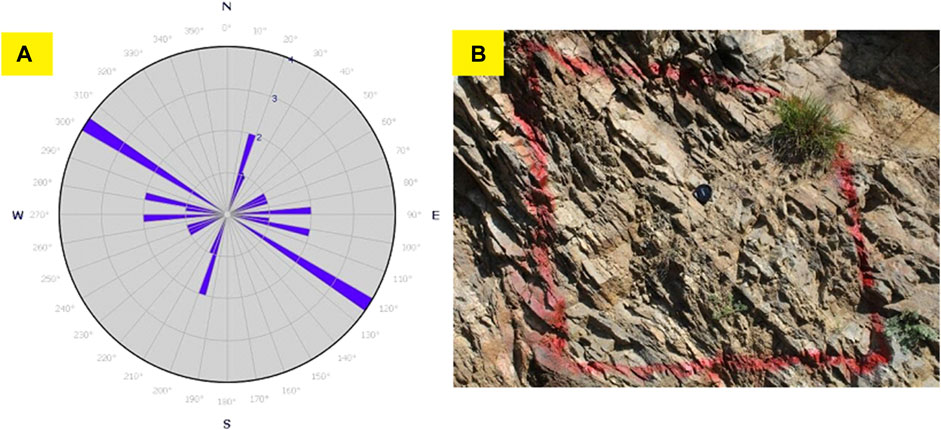
FIGURE 3. (A) Rose diagram showing the orientation of highly fractured rocks and (B) high joint density rocks.
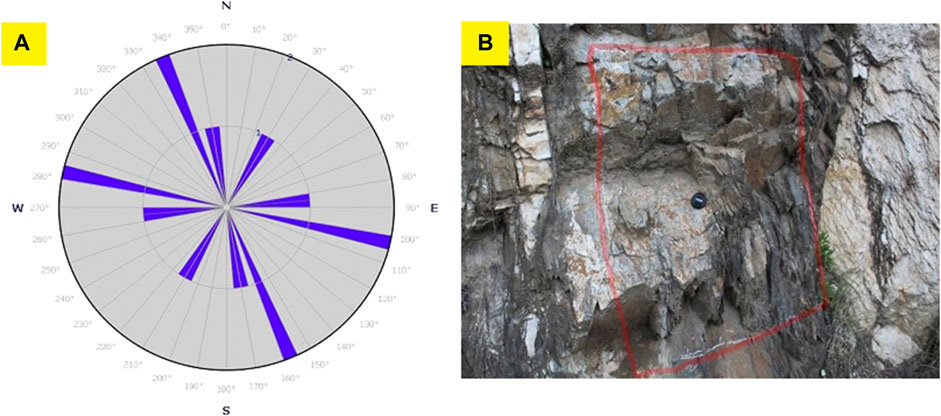
FIGURE 4. (A) Rose diagram showing the orientation of joints and (B) medium joint density rocks.
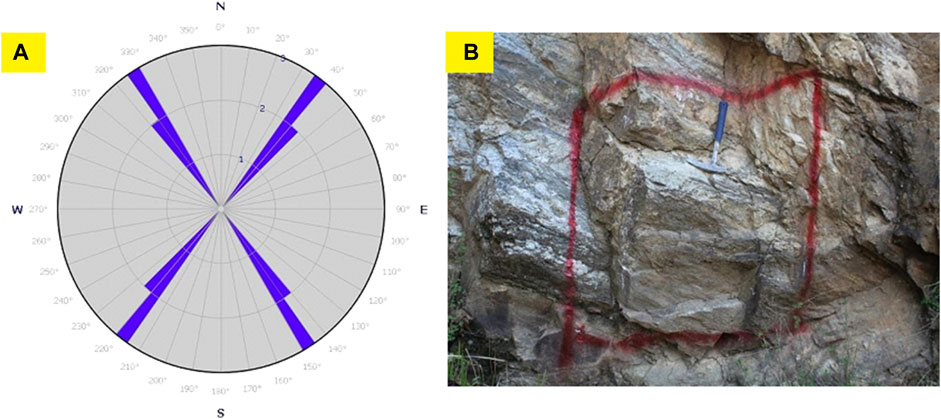
FIGURE 5. (A) Orientation of joints. (B) Low joint density rocks.
Joints are planar discontinuities of geological origin in a rock mass, along which there is no discernible or visible lateral displacement (Gumede, 2007). Joints are actually planes of weakness in a rock mass, and they directly or indirectly affect the stability of the rock mass (Gumede, 2007). Jointed rock masses are often found during tunnel excavation; most failures of the tunnel opening during excavation are reported to be related to joints (Ghorbani et al., 2015). Joints commonly occur in sets that are more or less parallel and are regularly spaced (Madkour, 2012). Often, several sets of joints have different directions so that a rock mass is broken up into a blocky structure (Jaeger et al., 2009). Because of the low tensile strength and shear strength, as well as the weakness of rock mass due to the unloading by excavation, rock masses are easy to slide along structural planes and weak zones (Abdellah et al., 2018). Under some conditions, joints may lead to disasters for underground excavations and tunnels (Ghorbani et al., 2015). The engineering properties of a rock mass depend upon far more on the geological defects within the rock mass than the rock strength itself; hence, the frequency and type of the joints are more important than the rock types (Ghorbani et al., 2015). Therefore, characterization and observation of the joints should be performed carefully (Palmström et al., 2001). Joint orientation describes the attitude of the joint in space. A joint orientation is only described by its dip and dip direction angle (Gumede, 2007). Palmström (1982) proposed that when core is unavailable, the RQD may be estimated from the number of joints per unit volume, in which the number of joints per cubic meter is added for each joint set.
High joint density rocks are highly deformed, highly jointed, and thin bedded. Due to the high degree of deformation and weathering, the rocks are very exposed, and colors are not visible (Figure 3B). The rock has three sets of joints (Table 2).
Medium joint density rocks are massively bedded and are less jointed (Table 3). The degree of weathering is high. For this reason, the rocks could not be identified. Here, the rocks were less deformed (Figure 4B).
Low joint density rocks are massively bedded and not highly deformed or jointed. The degree of weathering is low, and the rock had alternating white and dark bands resembling gneiss (Figure 5B). These rocks have two sets of joints (Table 4).
The structure found in the Besham area includes tight upright to recumbent isoclinal folds (Baig, 1990). The discontinuous tectonic lenses and pods are aligned parallel to foliation. The major north-trending folds affect all the units of the Besham group. The Karora group was deposited unconformably on the top of the Besham group, which was enveloped and preserved within synclines formed by these folds (Baig, 1990). The western limbs of these synclines are cut by high-angle, north-trending faults, some of which offset the MMT zone. The strata belonging to the Besham and Karora groups exhibit a predominantly north-trending foliation that dips steeply to the east or west. As a result of frequent folding and faulting resulting in the formation of anticlines and synclines, the study area is occupied by rock units belonging to both the Besham and Karora groups. The study area exhibits at least one major anticline in the weir site area and one major syncline in the middle of the tunnel area, followed by a series of anticlines and synclines in the area downstream of the powerhouse location.
Folded rocks were observed at various stations. The types of folds that were observed are isoclinal folds (Figure 8A), drag folds (Figures 6A,B), anticline folds (Figures 14A,B), fold limbs (Figure 7B), gentle folds (Figure 7A), and recumbent folds (Figure 8B). Boudinage structures and crushed rocks were also observed during the feasibility study (Figures 9A–C). These folded rocks, boudinage structures, and crushed rocks indicate that the area shows a high degree of deformation.
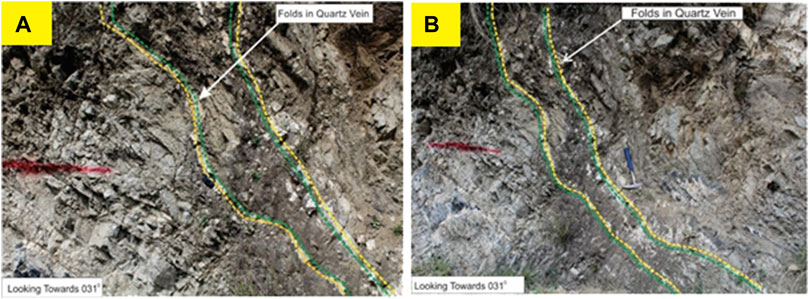
FIGURE 6. (A,B) Outcrop folding in the form of quartz/feldspar vein (drag fold) and Figure 14 Outcrop showing gentle fold with strike 031 and a dip angle of 54.

FIGURE 7. (A) Outcrop showing gentle fold with strike 031 and a dip angle of 54 and (B) fold limb.
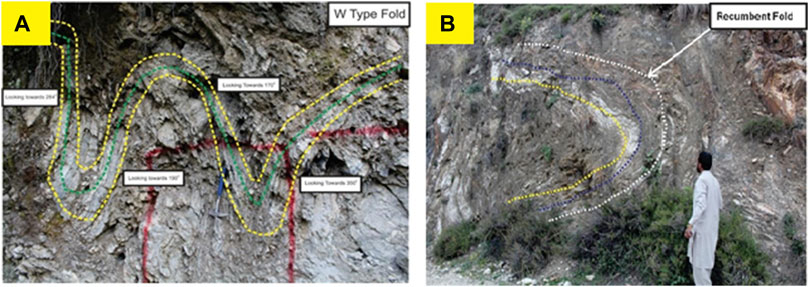
FIGURE 8. (A) Isoclinal-type fold. (B) Recumbent fold.
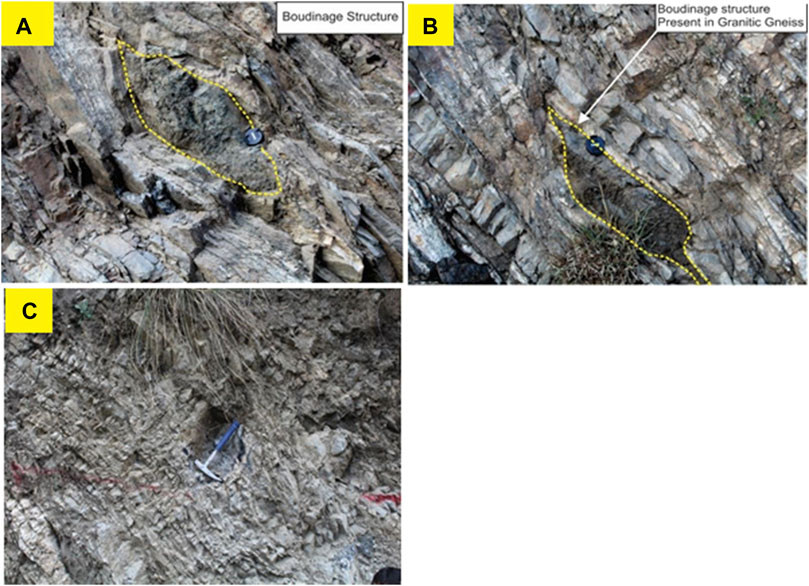
FIGURE 9. (A,B) Boudinage structures in granitic gneiss. (C) Highly deformed and crushed rocks and a boudinage structure.
Modal mineralogy and the textural relationships are described with the help of petrography (Tables 5, 6). Detailed microscopic examination comprising modal mineralogy and textural relationship of minerals is important. A total of 17 thin sections were studied under a petrographic microscope. The following parameters were determined: dominant minerology, grain size, pattern of contact, and shape of grains. These parameters were determined to evaluate their engineering properties (Yusof and Zabidi, 2016). Detailed petrographic investigations of the rocks exposed in the study area indicate that the proposed site is located in the Besham complex. Rocks of the proposed site dominantly consist of alkali feldspar, plagioclase, quartz, amphibole, and biotite; some muscovite and opaque minerals and sphene occur as an accessory constituent. Quartz and feldspar are the dominant constituent minerals (Table 6). Rocks show deformation in the form of mineralic deformation and micro cracking (Tables 5, 7). Granite, quartz syenite, quartz monzonite, granodiorite, quartz rich granitoid, monzogranite, alkali feldspar granite, and quartz monzodiorite are present in the study area (Figure 10).
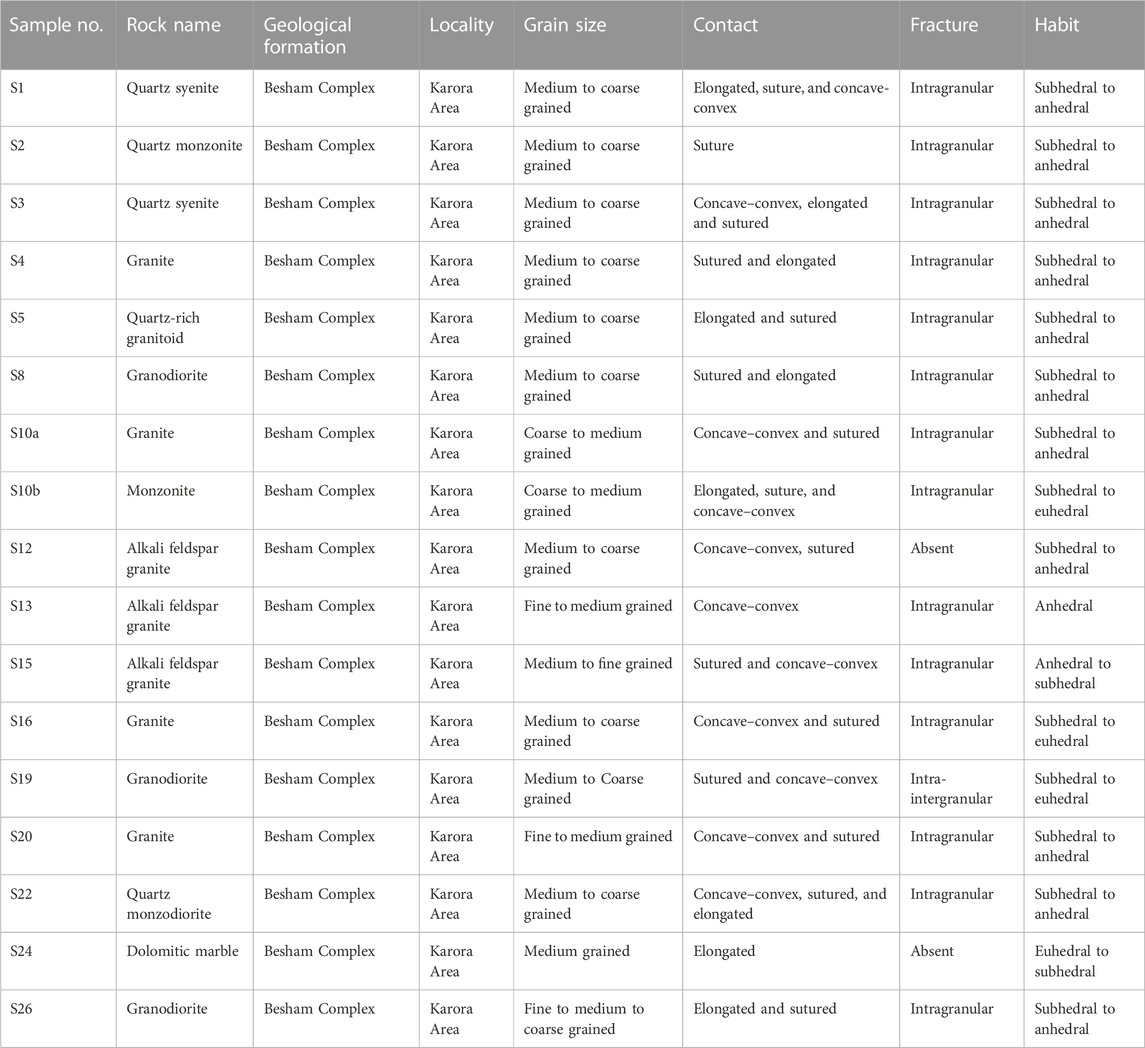
TABLE 5. Rock lithology, locality, and petrographic analysis of various minerals in the study area.
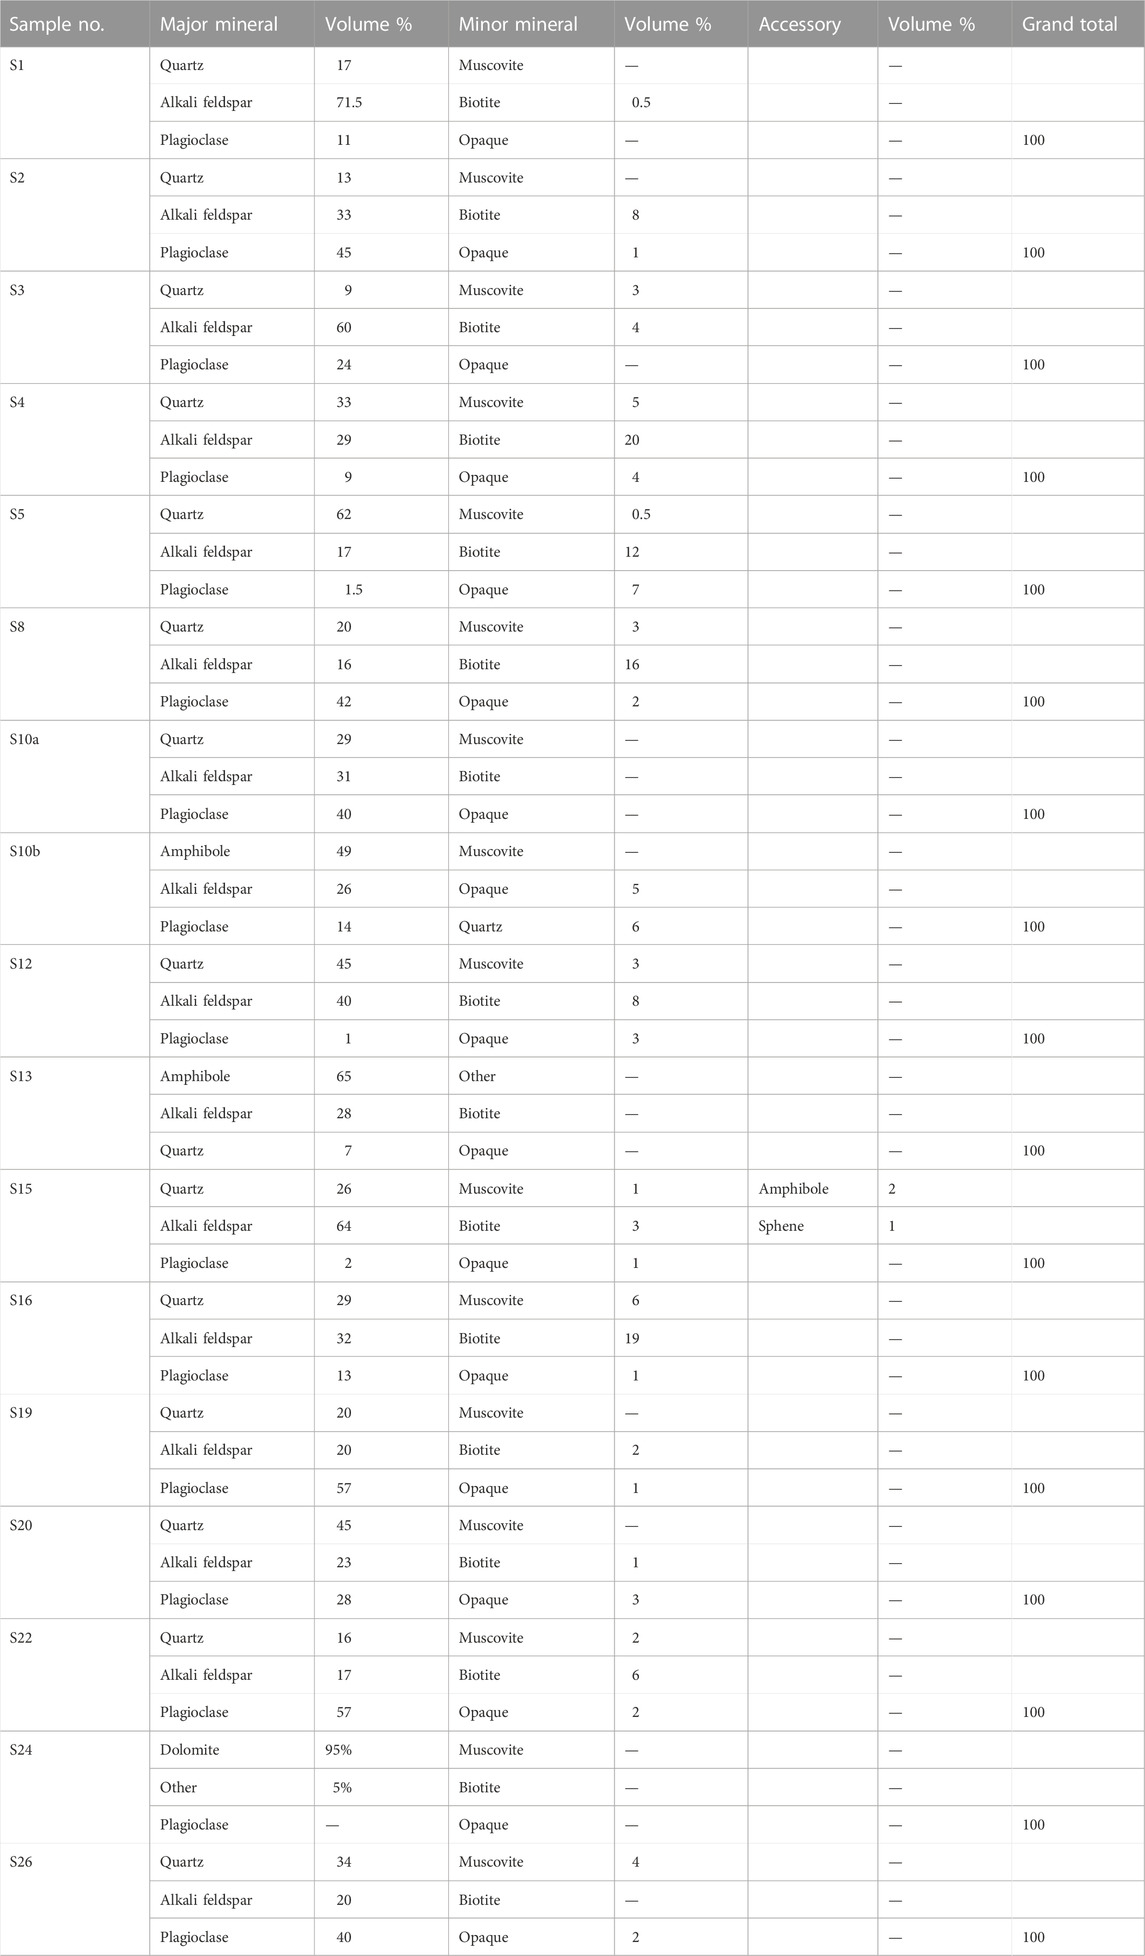
TABLE 6. Model mineralogy of the rocks.
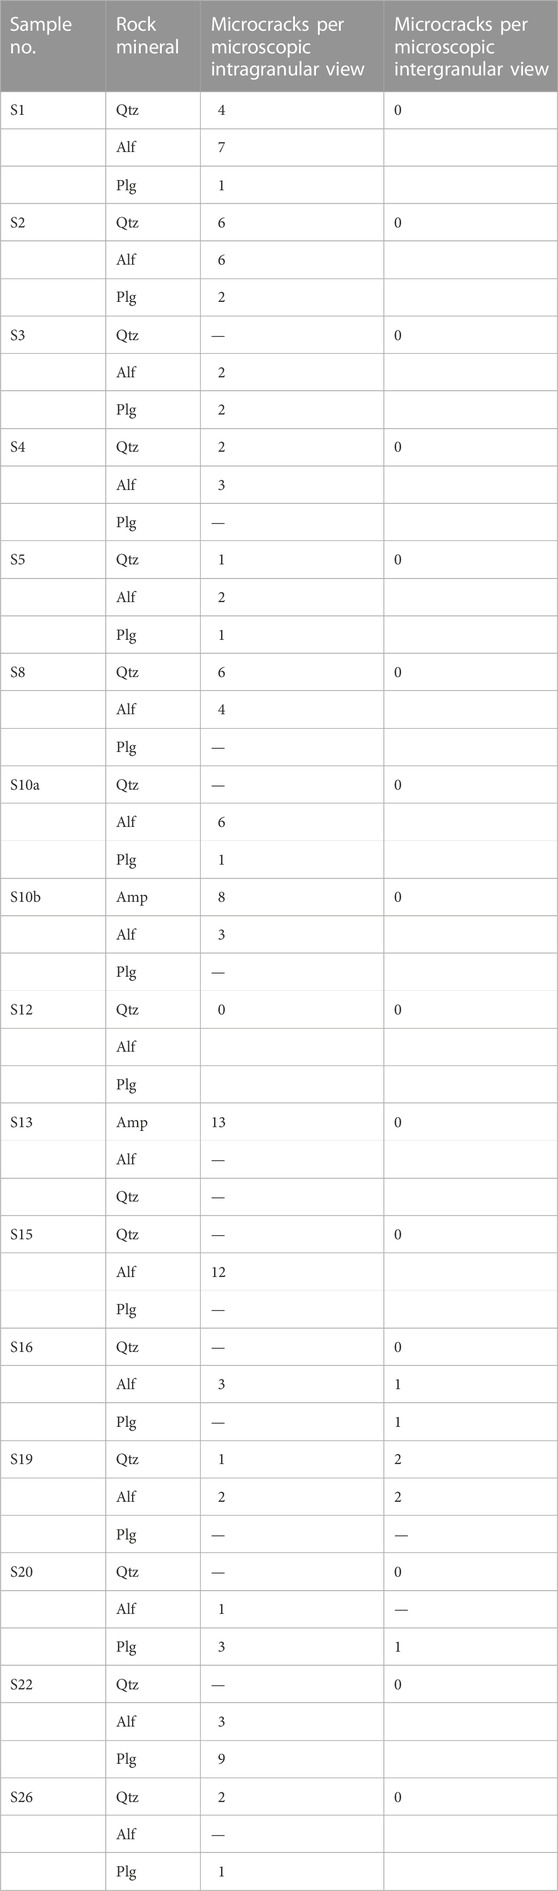
TABLE 7. Microcrack density in major minerals, such as quartz (Qtz), alkali feldspar (Alf), plagioclase (Plg), and amphibole (Amp).
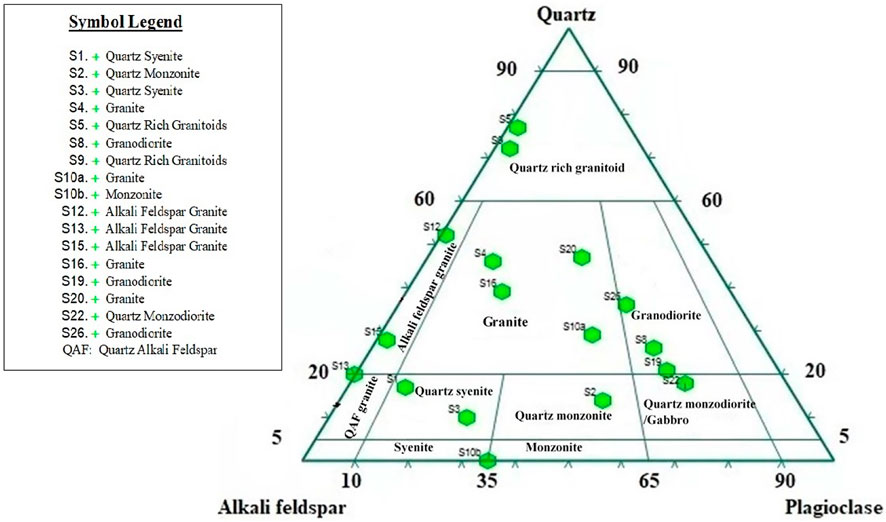
FIGURE 10. Quartz, alkali feldspar, and plagioclase (QAP) model composition of the studied rocks.
Quartz grains are mostly strained and show undulose extinction, while feldspar are often altered and have intragranular fracture (Figure 11). Alkali feldspar in some samples shows perthitic texture. Some rocks have a preferred alignment of biotite and muscovite that shows gneissosity. Amphiboles in one sample are highly altered (Figure 12). Further details for each of the petrographic samples are given in the following (Tables 5, 6).
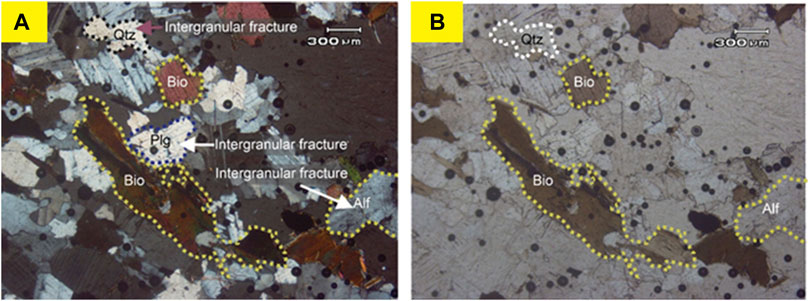
FIGURE 11. (A) Cross-polarized light (XPL) view showing intragranular fracture in feldspar (Alf, Plg) and quartz (Qtz) with biotite (Bio) on the left. (B) Photomicrograph showing the plane-polarized light (PPL) view of sample S2.
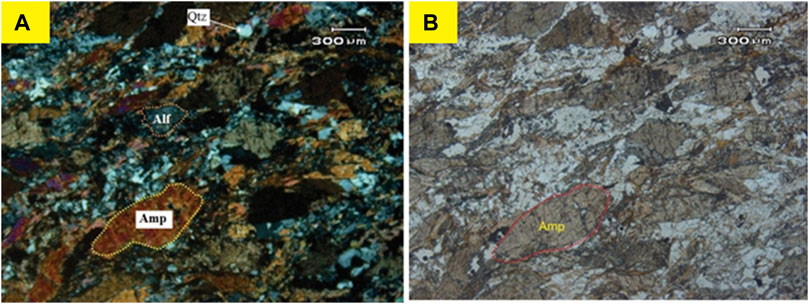
FIGURE 12. (A) XPL view of sample S13 showing a high amount of amphibole (Amp) with altered alkali feldspar (Alf) and a minute amount of quartz (Qtz) on the left. (B) Photomicrograph showing the PPL view of sample S13 on the right.
Feldspar grains are medium to coarse grained and are the dominant constituents. The contact of feldspar grains is sutured. The habits of these feldspar grains are subhedral to euhedral, and some grains are altered. Opaque minerals and biotite are found in minor amounts. Biotite has elongated contact with feldspar and quartz and has concave–convex contact with quartz (Figures 11A,B).
Amphibole and feldspar are the dominant minerals of the sample. The rock has pinchout structures that are more dominantly present in places. The anhedral grains of amphibole are fractured across the grain and are fine to medium grained with augen shapes. Alkali feldspar is the second-most abundant mineral present in fine to medium grain size, and quartz can be found in minute amounts (Figures 12A,B).
The rock is dominantly composed of quartz and feldspar. The rock contains subhedral to anhedral quartz grains that have granoblastic to xenoblastic texture. The grain size of quartz is medium. The contact of quartz grains with other grains of the rock is elongated and sutured. Anhedral to subhedral feldspar grain is the second-most dominant mineral of the rock, which is mostly altered. The grain of feldspar has sutured and elongated contact with quartz grain (Figures 13A,B). Biotite and opaque mineral grains are present in minor amounts in the form of veins and are limited to intergranular boundary. Leaching of opaque minerals can also be observed.
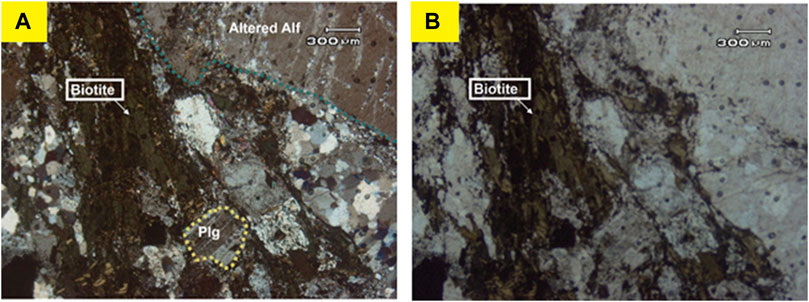
FIGURE 13. (A) XPL view of sample S5 showing altered alkali feldspar (Alf) phenocryst, plagioclase (Plg) with medium-grained quartz (Qtz), and a high amount of biotite. (B) Photomicrograph showing PPL view of sample S5.
Determination of microcracks is very important during petrographic observation because they can cause rock discontinuities that reduce the mechanical response of a rock (Nålsund and Jensen, 2013; Zhang et al., 2020). Kranz (1983) described these discontinuities as massive porosity and holes. The strength of the rock decreases as microcracks are increased in a rock sample. Grain boundaries are the preferred sites for flaws and cracks, which may later develop into penetrative fractures (Brattli, 1992). These microcracks are produced as a result of stress, and these stresses are increased by twin lamellae interaction, kink bands, and deformation lamellae (Kranz, 1983). The microcrack density was determined by the number of microscopic views per thin section. Only the major mineral component of the rocks was considered. Both intra- and inter-granular fractures were counted. The statistical data with the corresponding minerals and samples are given in Table 7.
Several factors should be considered when analyzing the stability of rocks for tunnel construction. Structural features in the study area of the tunnel have been recognized. The purpose of this research study is to evaluate the proposed site rock in terms of petrography and joint volume analysis for RQD.
During the fieldwork study of the proposed site, it was determined that most of the rocks were deformed (Figures 6A,B). The main or most common deformations were in fracture and joint forms, which greatly influence rock stability (Figures 3A,B, 4A,B, and 5A,B). These joints were present in two and three sets (Tables 2, 3 and 4). A large number of joints may affect the stability of structure by many ways; for example, rock falling from the slope or the floor of the tunnel might allow water to pass through, which can cause problems for underground construction. Joint analysis using scanline and joint volume determination leads to a suggested RQD for each station.
The following Table 8 is based on the RQD value and the number of joints from which the RQD value was interpreted, which provides information about the rock mass quality. Mesoscopic folding was also observed in the study (Figures 6A,B, 7A,B, 8A,B and 14A,B). These mesoscopic structures suggest that this area experienced a number of deformation events. Folding of the area rock is quite dangerous for underground excavation such as tunnels. It may cause caving or bulging of sides or collapse of the roof (Chen, 1992). The rocks in the Table 7 are evaluated through the RQD formula, RQD = 115−3.3 Jv (Eq. 1), to describe the quality of rock (Palmström, 1982).
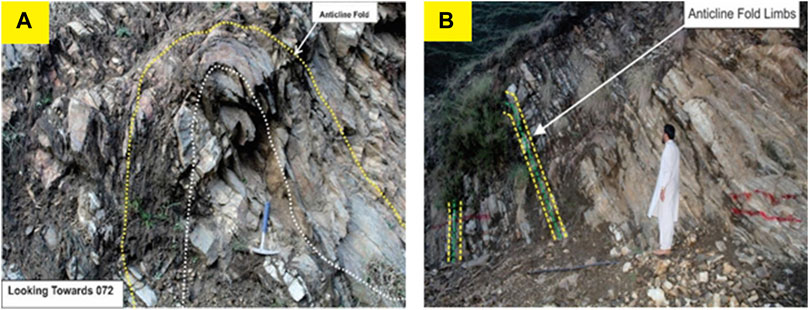
FIGURE 14. (A) Anticline fold looking toward 072° and (B) anticline fold that has a dominant lithology of gneiss. The limbs are not completely exposed due to vegetation.
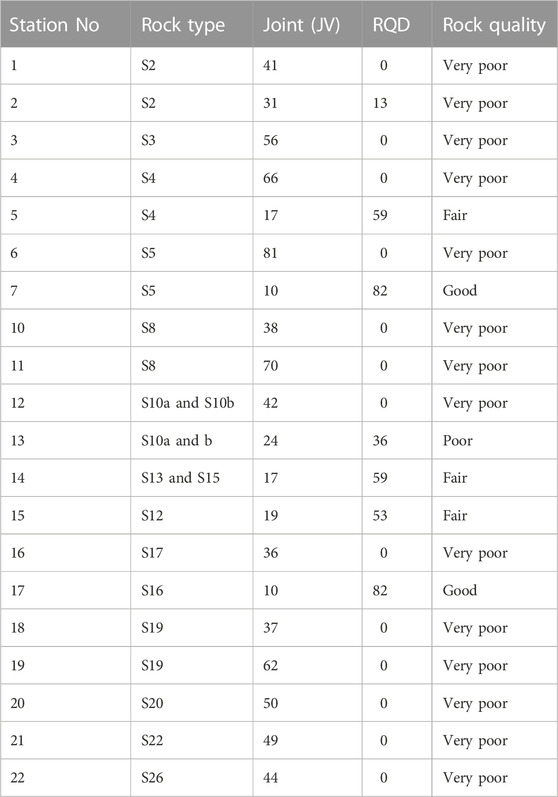
TABLE 8. Correlation of RQD and joint volume, which shows the rock quality.
Petrographic correlations were performed with their respective surface joint volume (JV). Petrographic features, such as grain boundary, shape, size, composition, and status of minerals, highly affect the pattern and density of a fracture. High-density joint volumes (Table 2) of the study area are correlated with their petrography; that is, sutured boundary, alteration of some grains, fractures, strained quartz, the presence of mica, and medium to coarse grains are features responsible for such a large amount of joints. Intermediate joint density volumes (Table 3) are correlated with the petrography of these stations; that is, elongated contact boundary, altered grains, medium to coarse grains, and the presence of mica are features responsible for an intermediate amount of joints. Low joint density volumes (Table 4) are correlated with petrography of the corresponding samples of these stations, that is, fine to medium grain, less fractured, suture contact boundary, and some grains of altered feldspar are features responsible for a low amount of joints. The results of the aforementioned correlations between petrography and joint volume analysis show that the joint volume/density is controlled by rock mineralogy and texture.
Petrographic properties, such as mineral grain size, grain shape, texture, grain boundary relation, deformation, micro cracks, and degree of alteration, affect the strength of rock (Spry, 2013). These properties were analyzed in thin sections through a polarizing microscope. Several investigations have been made on grain size, which is an important factor in the mechanical properties of rock (Brattli, 1992; Liu et al., 2005; Nålsund and Jensen, 2013; Yusof and Zabidi, 2016). These studies observed that decreasing grain size increases both the resistance to disintegration and abrasion. Microcracks such as grain boundaries and intragranular and intergranular fractures affect rock stability (Kranz, 1983). These microcracks affect the porosity and strength of the rock; in most cases, grain boundaries are preferred sites for flaws and fractures. A technique was developed by Brattli (1992) to measure microcracks by correlating microscopy and image analysis.
In summary, this study aimed to conduct a site investigation of the Karora Hydropower project based on petrography, structural study, and RQD. Petrographically, most of the rocks contain quartz, feldspar, mica, and small amounts of other minerals like amphibole, sphene, and opaque minerals. Rock samples are abundant in feldspar, quartz, and mica contents, with an average of 55.6%, 27%, and 17.4%, respectively. The presence of micro cracks, high feldspar, and low quartz contents in the rock samples significantly influences the rock strength. The rock strength increases with more quartz content, while the presence of more feldspar reduces rock strength. Similarly, the mica-preferred orientation provides a plane for joints and fracturing that can alter feldspar and, as a result, reduces the strength of the rock.
Additionally, the number of folded, crushed, and fractured rocks suggests instability in rock samples, and the strain released upon the removal of subsurface material together with water infiltration can cause collapse of the roof, caving, and bulging of the sides of a tunnel. The joint volume analysis of various locations in the study area also suggests that the RQD <25%; most of the rocks in the study area are of very poor quality. Finally, our research revealed that more attention must be paid during tunnel construction to avoid serious socio-economic damage.
The original contributions presented in the study are included in the article/supplementary material; further inquiries can be directed to the corresponding author.
Conceptualization, MK; methodology, MK and RK; software, MK and WH; validation, MK, AK, and RK; formal analysis, MK and WH; investigation, MK, HL, and AK; resources, RK and WH; data curation, WH; writing—original draft preparation, MK; writing—review and editing, MK, RK, and HL; visualization, RK and MK; supervision, HL and RK. All authors have read and agreed to the published version of the manuscript.
The authors want to thank Mr. Atta Ur Rehman for their fieldwork assistance. They also thank Dr. Muhammad Sajid, Assistant Professor at the Department of Geology, University of Peshawar, Pakistan, for his cooperation in thin section preparation. They would like to thank senior geologist Mr. Mian Syed Badshah for accommodation support.
The authors declare that the research was conducted in the absence of any commercial or financial relationships that could be construed as a potential conflict of interest.
All claims expressed in this article are solely those of the authors and do not necessarily represent those of their affiliated organizations, or those of the publisher, the editors, and the reviewers. Any product that may be evaluated in this article, or claim that may be made by its manufacturer, is not guaranteed or endorsed by the publisher.
Abdeh Keykha, H., and Huat, B. (2011). Determination rock quality designation RQD basis on joints.ScienceDirect, Amsterdam, Netherlands.
Abdelhamid, M. M. A., Mousa, B. G., Waqas, H., Elkotb, M. A., Eldin, S. M., Munir, I., et al. (2022). Artificial thermal quenching and salt crystallization weathering processes for the assessment of long-term degradation characteristics of some sedimentary rocks, Egypt. Minerals 12 (11), 1393. doi:10.3390/min12111393
Abdellah, W. R., Ali, M. A., and Yang, H.-S. (2018). Studying the effect of some parameters on the stability of shallow tunnels. J. Sustain. Min. 17 (1), 20–33. doi:10.46873/2300-3960.1118
Ahmad, T., Rizwan, M., Hussain, Z., Ullah, S., Ali, Z., Khan, A., et al. (2021). Mineralogical and textural influence on physico-mechanical properties of selected granitoids from besham syntaxis, northern Pakistan. Acta Geodyn. Geomaterialia 18 (3), 347–362. doi:10.13168/AGG.2021.0024
Ashraf, M., Chaudhry, M., and Hussain, S. (1980). General geology and economic significance of the lahor granite and rocks of the southern ophiolite belt in allai-kohistan area: A, 13. Geol. Bull. Univ. Peshawar, 207–213.
Baig, M., and Lawrence, R. (1987). Precambrian to early paleozoic orogenesis in the Himalaya. Kashmir J. Geol. 5, 1–22.
Baig, M. S. (1990). Structure and geochronology of Pre-Himalayan and Himalayan orogenic events in the Northwest Himalayan, Pakistan, with special reference to the Besham area, Oregon State University, .Corvallis, OR, United States.
Balasubramanian, A. (2016). Geotechnical investigations for tunnelling.report no:3.https://www.researchgate.net/publication/314503138_GEOTECHNICAL_INVESTIGATIONS_FOR_TUNNELLING report.
Brattli, B. (1992). The influence of geological factors on the mechanical properties of basic igneous rocks used as road surface aggregates. Eng. Geol. 33 (1), 31–44. doi:10.1016/0013-7952(92)90033-u
Deere, D. (1988). The rock quality designation (RQD) index in practice, Rock classification systems for engineering purposes. ASTM International.Pennsylvania, U S A.
Deere, D. U., and Miller, R. (1966). Engineering classification and index properties for intact rock. Univ At Urbana Dept Of Civil Engineering.: Illinois, Urbana, IL 61801, United States
Du Toit, A. L. (1937). Our wandering continents: An hypothesis of continental drifting. Oliver & Boyd.Edinburgh, U K.
Ewy, R., and Cook, N., 27. Elsevier, 387–407.Deformation and fracture around cylindrical openings in rock—I. Observations and analysis of deformationsProc. Int. J. Rock Mech. Min. Sci. Geomechanics Abstracts1990.
Farah, A., Lawrence, R., and DeJong, K. (1984). An overview of the tectonics of Pakistan: Marine geology and oceanography of Arabian Sea and Coastal Pakistan. New York: Van Nostrand Reinhold Company, 161–176.
Fletcher, C., Leake, R., and Haslam, H. (1986). Tectonic setting, mineralogy and chemistry of a metamorphosed stratiform base metal deposit within the Himalayas of Pakistan. J. Geol. Soc. 143 (3), 521–536. doi:10.1144/gsjgs.143.3.0521
Ghorbani, K., Zahedi, M., and Asaadi, A. (2015). Effects of statistical distribution of joint trace length on the stability of tunnel excavated in jointed rock mass. Int. J. Min. Geo-Engineering 49 (2), 289–296.
Gomah, M. E., Li, G., Khan, N. M., Sun, C., Xu, J., Omar, A. A., et al. (2022). Prediction of strength parameters of thermally treated Egyptian granodiorite using multivariate statistics and machine learning techniques. Mathematics 10 (23), 4523. doi:10.3390/math10234523
Gumede, T. (2007). Measurement of typical joint characteristics in South African gold mines and the use of these characteristics in the prediction of rock falls. J. South. Afr. Inst. Min. Metallurgy 107 (5), 335–344.
Hao, Z., and Yan, E. (2015). Chuan “the surrounding rock deformation and failure mechanism of wudang group schists tunnel”. Electron. J. Geotechnical Eng. 20, 6557–6576.
He, Y., Sun, B., and Wang, M. (20212021). Study on stability of tunnel surrounding rock and precipitation disaster mitigation in flowing sand body. 2021, doi:10.1155/2021/6043807Geofluids
Hoek, E. (1982). Geotechnical considerations in tunnel design and contract preparation. Trans. Instn Min. Metall. 91, A101–A109.
Huang, R., and Huabo, X. (2010). Deformation mechanism of a shallow double-arch tunnel in a sloping rock mass, Bull. Eng. Geol. Environ., 69, 89–97.
Hussain, A., Dipietro, J., Pogue, K., and Ahmed, I. (2004). Pak. Geol. map Ser. Map: Geological survey of Pakistan. 11.Geologic map of 43-B degree sheet of NWFP.
Irfan, T. (1996). Mineralogy, fabric properties and classification of weathered granites in Hong Kong. Q. J. Eng. Geol. Hydrogeology 29 (1), 5–35. doi:10.1144/gsl.qjegh.1996.029.p1.02
Irving, E. (1979). Pole positions and continental drift since the devonian: The Earth: Its origin, structure, and evolution. London: Academic Press, 567–593.
Jaeger, J. C., Cook, N. G., and Zimmerman, R. (2009). Fundamentals of rock mechanics. John Wiley & Sons.New York, USA.
Jan, M. Q., and Tahirkheli, R. (1969). The geology of the lower part of Indus kohistan (swat), west Pakistan. J. Himal. Earth Sci. 4.
Johnson, B., Powell, C. M., and Veevers, J. (1976). Spreading history of the eastern Indian Ocean and Greater India's northward flight from Antarctica and Australia. Geol. Soc. Am. Bull. 87 (11), 1560–1566. doi:10.1130/0016-7606(1976)87<1560:shotei>2.0.co;2
Kainthola, A. (2015). Tunnelling challenges and solutions-Indian scenario. Tunneling Assoc. India 4 (2), 89.
Kazmi, A. H., and Jan, M. Q. (1997). Geology and tectonics of Pakistan. Graphic publishers.Pakistan.
Keykha, H. A., Huat, B. B., Ali, T. A. M., and Moayedi, H. (2012). Effect of discontinuities on the stability of rock blocks in tunnel. Int. J. Phys. Sci. 7 (13), 2118–2123.
Kranz, R. L. (1983). Microcracks in rocks: A review. Tectonophysics 100 (1-3), 449–480. doi:10.1016/0040-1951(83)90198-1
LaFortune, J. R. (1988). Geology and geochemistry of Indian plate rocks south of the Indus Suture. northern Pakistan: Besham area.
Liu, H., Kou, S., Lindqvist, P.-A., Lindqvist, J. E., and Åkesson, U. (2005). Microscope rock texture characterization and simulation of rock aggregate properties. Sveriges Geologiska Undersökning, Uppsala, Sweden.
Ltd, A. C. E.-A. P. (2011). Feasibility study of karora hydropower project.Pakhtunkhwa Energy Development Organization.Khyber Pakhtunkhwa, Pakistan.
Lukić, D., and Zlatanović, E. (2017). RQD classification of rock masses. Sci. High. Educ. Funct. Sustain. Dev. 2 (October).
Ma, C., Fan, J., Ji, X., Shi, X., and Zeng, J. (20222022). Effect of the initial support of the tunnel on the characteristics of rockburst: Case study and mechanism analysis. Adv. Civ. Eng. 2022, 1–16. doi:10.1155/2022/7235619
Madkour, H. (2012). Parametric analysis of tunnel behavior in jointed rock. Ain Shams Eng. J. 3 (2), 79–103. doi:10.1016/j.asej.2012.01.002
Molnar, P., and Tapponnier, P. (1975). Cenozoic Tectonics of Asia: Effects of a Continental Collision: Features of recent continental tectonics in Asia can be interpreted as results of the India-Eurasia collision. Science 189 (4201), 419–426. doi:10.1126/science.189.4201.419
Nålsund, R., and Jensen, S. (2013). Grain size distribution and micro- cracks on rocks' mechanical strength,.Influ. MINERAL GRAIN SIZE.
Palmström, A., Sharma, V., and Saxena, K. (2001). In-situ characterization of rocks. BALKEMA Publ, 1–40, Amsterdam.
Palmström, A. “The volumetric joint count-a useful and simple measure of the degree of rock jointing,” in Proceedings of the (Fourth International Congress of the International Association of Engineering Geology1982), New Delhi, India, 1982, 221–228.
Panthee, S., Singh, P., Kainthola, A., and Singh, T. (2016). Control of rock joint parameters on deformation of tunnel opening. J. Rock Mech. Geotechnical Eng. 8 (4), 489–498. doi:10.1016/j.jrmge.2016.03.003
Panthi, K. K. (2006). Analysis of engineering geological uncertainties related to tunnelling in Himalayan rock mass conditions.PhD thesis, Fakultet University, Novi Sad, Serbia.
Petterson, M. G., and Windley, B. F. (1985). RbSr dating of the Kohistan arc-batholith in the TransHimalaya of north Pakistan, and tectonic implications. Earth Planet. Sci. Lett. 74 (1), 45–57. doi:10.1016/0012-821x(85)90165-7
Rehman, H. U., Seno, T., Yamamoto, H., and Khan, T. (2011). Timing of collision of the kohistan– Ladakh arc with India and asia: Debate. Isl. Arc 20 (3), 308–328. doi:10.1111/j.1440-1738.2011.00774.x
Searle, M. P. (1991). Geology and tectonics of the Karakoram mountains. John Wiley & Sons., River Street Hoboken, NJ United States.
Singh, A., Singh, K., Vashisht, N., and Boruah, P. “Pre-grouting in the HRT of Teesta III hydroelectric power project, North Sikkim, India,” in Proceedings International Conference on Underground Space Technology (ICUST 2011) (Bangalore, India: ISEG & NIRM2011).
Stocklin, J. (1977). Structural correlation of the alpine ranges between Iran and central asia. Memoire Hors-Serve 8, 333–353.
Sun, W., Wang, L., and Wang, Y. (2017). Mechanical properties of rock materials with related to mineralogical characteristics and grain size through experimental investigation: A comprehensive review. Front. Struct. Civ. Eng. 11 (Issue 3), 322–328. doi:10.1007/s11709-017-0387-9
Tahirkheli, R. K. (1979). The India-Eurasia suture zone in northern Pakistan: Some new data for interpretation at plate scale. Geodyn. Pak. 1, 125–130.
Treloar, P. J., and Izatt, C. N. (1993). Tectonics of the himalayan collision between the Indian plate and the Afghan block: A synthesis. Geol. Soc. Lond. Spec. Publ. 74 (1), 69–87. doi:10.1144/gsl.sp.1993.074.01.06
Wang, S., Yang, Z., and Liu, Z. (1984). Rock stability analysis of underground works. Beijing: Science Press.
Williams, M. P. (1989)., 22. Geological Bulletin, University of Peshawar, 65–82.The geology of the Besham area, north Pakistan, Deformation imbrication footwall Main Mantle thrust
Windley, B. F. (1983). Metamorphism and tectonics of the Himalaya. J. Geol. Soc. 140 (6), 849–865. doi:10.1144/gsjgs.140.6.0849
Yeats, R. S., and Hussain, A. (1987). Timing of structural events in the Himalayan foothills of northwestern Pakistan. Geol. Soc. Am. Bull. 99 (2), 161–176. doi:10.1130/0016-7606(1987)99<161:toseit>2.0.co;2
Yusof, N., and Zabidi, H. (2016). Correlation of mineralogical and textural characteristics with engineering properties of granitic rock from hulu langat, selangor. Selangor Procedia Chem. 19, 975–980. doi:10.1016/j.proche.2016.03.144
Zhang, L. (2016). Determination and applications of rock quality designation (RQD), J. Rock Mech. Geotechnical Eng., 8.
Zhang, X. P., Ji, P. Q., Peng, J., Wu, S. C., and Zhang, Q. (2020). A grain-based model considering pre-existing cracks for modelling mechanical properties of crystalline rock. Comput. Geotechnics 127, 103776. doi:10.1016/j.compgeo.2020.103776
Keywords: mechanical properties, joint analysis, petrography, Karora hydropower project, deformation, granitoids
Citation: Khan M, Li H, Khan A, Hussain W, Khan R and Ali R (2023) Mechanical properties of selected granitoids along the Karora hydropower project, Besham, Northern Pakistan: Insights from petrography and joint analysis. Front. Earth Sci. 10:1096850. doi: 10.3389/feart.2022.1096850
Received: 12 November 2022; Accepted: 12 December 2022;
Published: 10 January 2023.
Edited by:
Majid Khan, University of Science and Technology Beijing, ChinaReviewed by:
B. G. Mousa, Al-Azhar University, EgyptCopyright © 2023 Khan, Li, Khan, Hussain, Khan and Ali. This is an open-access article distributed under the terms of the Creative Commons Attribution License (CC BY). The use, distribution or reproduction in other forums is permitted, provided the original author(s) and the copyright owner(s) are credited and that the original publication in this journal is cited, in accordance with accepted academic practice. No use, distribution or reproduction is permitted which does not comply with these terms.
*Correspondence: Rehan Khan, cmVoYW5raGFuQGNzdS5lZHUuY24=; Huan Li, bGlodWFuQGNzdS5lZHUuY24=
Disclaimer: All claims expressed in this article are solely those of the authors and do not necessarily represent those of their affiliated organizations, or those of the publisher, the editors and the reviewers. Any product that may be evaluated in this article or claim that may be made by its manufacturer is not guaranteed or endorsed by the publisher.
Research integrity at Frontiers
Learn more about the work of our research integrity team to safeguard the quality of each article we publish.