 Canming Yuan
 Wen Nie
 Qihang Li
 Jiabo Geng
 Bibo Dai2
94% of researchers rate our articles as excellent or good
Learn more about the work of our research integrity team to safeguard the quality of each article we publish.
Find out more
ORIGINAL RESEARCH article
Front. Earth Sci., 19 January 2023
Sec. Geohazards and Georisks
Volume 10 - 2022 | https://doi.org/10.3389/feart.2022.1093764
This article is part of the Research TopicLarge Landslides in Sichuan-Tibet Railway: Recognition, Mechanism, and MitigationView all 6 articles
Image recording and analysis is an important but time-consuming method for understanding the rock mechanics mechanism. In this paper, a method for automatic batch identification of rock deformation areas is proposed. We crop the original image to remove irrelevant background. And we use adaptive threshold segmentation, region growth segmentation and global threshold segmentation and combine the characteristics of the image to identify the rock deformation area. Finally, we use image morphology processing to make the recognition result more accurate. For validation, 359 images of the rock samples of the uniaxial compression test were quickly identified. The identification time was approximately 5′56.83′. The average relative error of the method in the X and Y directions is 10.88% and 8.60%, respectively. In addition, using the identification results and the stress-strain curve, it was found that the water content and initial crack length of rock increase, and the compressive strength decreases; the effect of the initial fracture inclination on the compressive strength of the rock is not obvious.
The geological environment along the Sichuan Tibet Railway is complex and the rock mass structure is changeable. The rock engineering performance in some areas is poor, which is easy to induce natural disasters. To understand the rock failure mechanism affected by forces, some research based on computer technology has recently been carried out (Eshiet et al., 2018; Kou et al., 2019; Shou et al., 2020; Wang et al., 2020; Zhang et al., 2020). A color-based identification method for rock–soil interfaces and dissolution fissures provides a reference method for engineering applications to identify the rock structure of boreholes (Li et al., 2019). Liang and Zou proposed an improved semisupervised SVM-FCM algorithm method (CSVM-FCM) based on chaos to segment rock images (Liang and Zou, 2020). Purswani et al. compared the effectiveness of different image segmentation techniques in the analysis of porous media image data (Purswani et al., 2020). Sun et al. (2019) used a clustering superpixel segmentation algorithm combining color, spatial location, and texture to identify and separate waste rock and raw coal. Ge et al. (2019) determined the shear failure area of rock joints based on point cloud and image segmentation. Li and Zhang (2019) proposed a fracture segmentation method based on contour evolution and gradient direction consistency to accurately segment the fracture network in coal and rock CT image sequences. Lin et al. (2018) took the calculated porosity of the core image as a constraint to obtain the optimal threshold and calculated the segmented image more reasonably according to the actual porosity of each image. Chauhan et al. (2016) evaluated the performance and accuracy of machine learning technology to segment the rock particles, matrix and pore volume from the three-dimensional volume of the grayscale rock image of X-ray tomography. Obara (2007) proposed a new algorithm for rock particle segmentation using image color system transformation. Wang (2006) showed that the algorithm involving image classification and the depiction of debris based on the edge of the valley is an efficient method for depicting dense rock fragments.
Furthermore, for some complex rock failure scenes, a single image segmentation method is no longer suitable. Therefore, image segmentation by method superimposition and improvement as well as image multi-information combining processing was performed. Elaziz and Lu (2019) proposed a multitarget image segmentation method, which segmented images into different groups by finding the optimal threshold. Shi et al. (2016) proposed a new lung segmentation method based on multistrategy fusion to accurately segment lung regions from CT slices. Zhang and Zhang (2020) proposed a CNN-to-FCN method to perform semantic segmentation on crack pixels in high-resolution images. Tavakkoli Piralilou et al. (2019), Xie et al. (2021) combined object-based images with multiple machine learning methods to conduct research.
In short, the research of scholars has greatly promoted the progress of image segmentation methods and the cross-fusion of image segmentation methods with lithosphere (Li et al., 2022b). However, these methods are usually used to segment a single image and are not suitable for many images. As is known, every rock failure test is in terms of many images, and it is very time-consuming if we only use the methods above, one picture by one picture (Clarke and Vannucchi, 2020; Passchier et al., 2021).
Therefore, we propose a method for automatically identifying rock failure areas in batches. This method is based on the Python and OpenCV open-source library and combined with a variety of image segmentation methods to identify rock failure areas. The highlight of this method is that it can realize automatic batch identification of rock failure areas while saving manpower, material resources and time in the research process. We refine this method and use improved adaptive threshold segmentation, regional growth segmentation and global threshold segmentation methods to identify rock samples in the uniaxial compression failure process in a certain area along the Sichuan Tibet Railway.
We calculated the batch recognition time and the relative error of partial recognition images. The data show that this method can automatically identify many rock fractures while keeping the recognition accuracy and recognition time within a controllable range. Additionally, based on the image recognition results and the stress–strain curve of the rock under uniaxial compression, we can effectively analyze the variability factors that affect the compressive strength of the rock.
The overall flowchart of this study is shown in Figure 1. First, we select an area for sampling. After grinding into standard specimens, uniaxial compression test is carried out. See Section 2.1.1 for the preparation process of rock specimens. During the test, the monitoring system and data processing system are used to collect the deformation process images and stress-strain curves of rock specimens. See Section 2.1.2 for the test process.
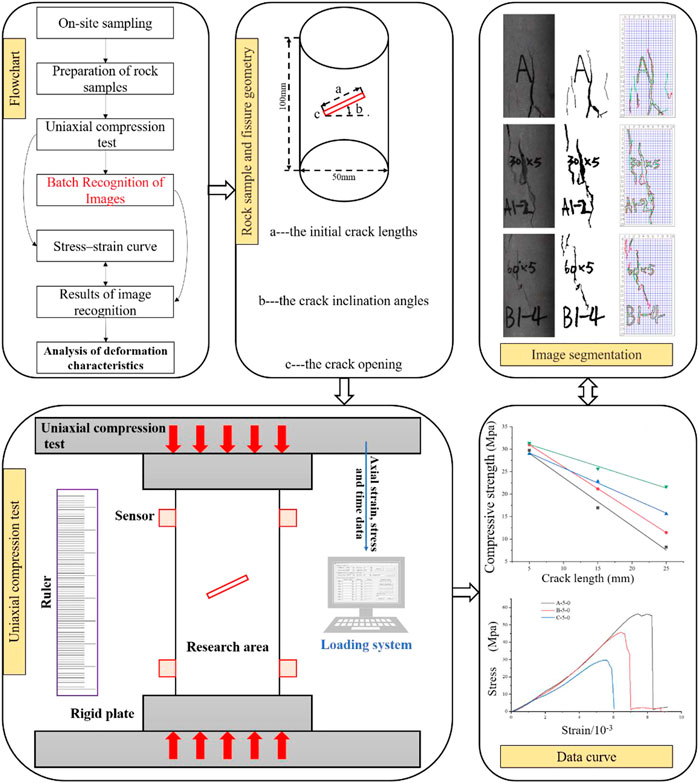
FIGURE 1. Overall flow chart of the study.
The original rock was processed into a standard test specimen with a diameter and height of 50 mm × 100 mm. A high-speed electric cutting machine was used to perform prefracture treatment (Figure 1: Rock sample and fissure geometry) for the subsequent uniaxial compression test. The initial crack lengths were 0 mm, 5 mm, 10 mm, 15 mm, and 25 mm, and the crack inclination angles were 0°, 30°, 45°, and 60°. The crack opening was 1 mm. We divided the rock samples into three states according to their different water contents, and the water content of the rock sample in the normal state was 0.91%. Part of the rock sample was dried using a 101-A blast electric heating constant temperature drying box to achieve 0% water content. Part of the rock sample was soaked until the water content of the rock samples reached a saturated state of 5.06% (Figure 2A) (Wen et al., 2013; Zhou et al., 2018).
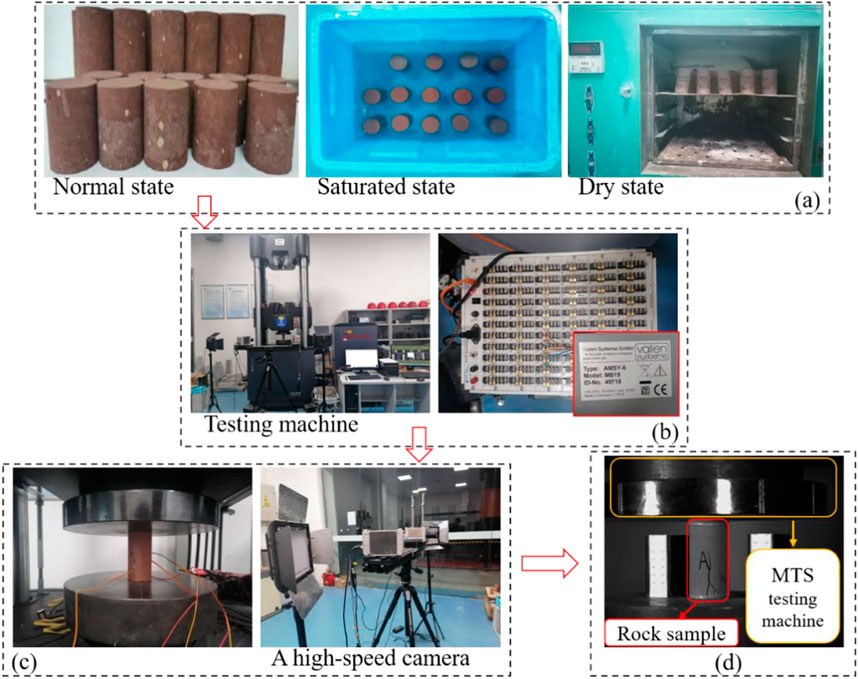
FIGURE 2. Uniaxial compression test equipment and rock sample compression process diagram; (A) The different moisture contents of the rock samples; (B) Testing machine; (C) Sensors and high-speed camera; (D) Testing process.
The equipment required for the test and the rock sample compression process are shown in Figure 2. An MTS815 electrohydraulic servo universal testing machine was used to conduct a 200 N uniaxial compression test on the rock samples. The main parameters of the equipment are as shown in Table 1. During the test, a high-speed camera (1280*1024 resolution, FPS: 2,000 frames per second) was used to record the entire rock sample compression process (Figure 2C). To monitor the transverse deformation and longitudinal deformation of the specimen under compression, a YJZ-16 strain gauge is used for our test (Figure 2B). The specific indexes of the YZ-16 intelligent digital strain gauge are as shown in Table 2.

TABLE 1. Parameters of MTS815 test machine.
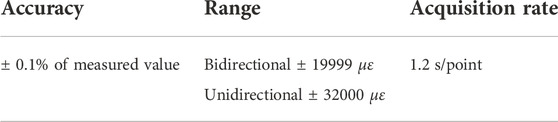
TABLE 2. The specific indexes of YZ-16.
We divide the saved image data into four groups: A, B, C and D. A indicates that the rock sample is dry; B indicates that the moisture content of rock sample is normal; C indicates that the moisture content of rock sample is saturated; D indicates that the moisture content of rock sample is between natural and saturated. Image data has a special naming method, such as A-0–0. The first parameter indicates the different moisture contents of the rock samples. The second parameter indicates the length of the prefracture of the rock sample. The third parameter represents the angle between the prefracture of the rock sample and the parallel line.
We proposed a method for automatic batch identification of deformed regions of laboratory rock samples based on the Python and OpenCV open-source libraries. The main process is shown in Figure 3.
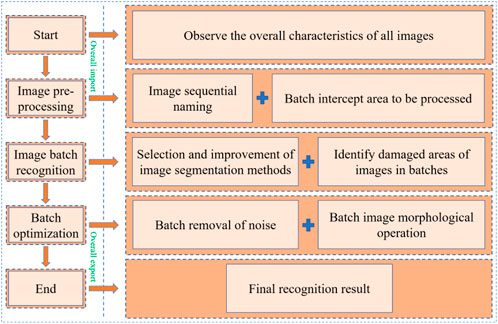
FIGURE 3. Method flowchart.
The image data saved in experiments always have chaotic naming, and the images also contain some irrelevant background areas, which causes confusion in information and reduces the image batch processing efficiency. We need to name all images sequentially, crop the original images and reserve the area to be processed.
The information presented by a large number of image samples is more complex, and it is difficult for a single method to identify all the images. We need to use a variety of image segmentation methods to recognize many images. Image segmentation methods based on threshold (Yen et al., 1995), edge (Khan et al., 2011), region (Zhang, 2018) and clustering (Levinshtein et al., 2009; Achanta et al., 2012) are mostly simple and effective and can be used to obtain key image feature information and improve image analysis efficiency. We chose the above four types of image segmentation methods to identify the different types of damaged areas of a small number of rocks to find a suitable segmentation method for the damaged area.
After completing image segmentation methods selection, we usually need to improve the different methods, such as combining the region growth segmentation method with image brightness and combining the adaptive threshold segmentation method with image contrast. Then, we merge the various improved methods to make the different methods run continuously without interfering with each other to realize the automatic batch recognition of rock failure images.
The initial batch recognition images usually contain considerable noise and present the characteristics of not being connected to other areas (Yang et al., 2019), so we should remove the noise. Additionally, if there is considerable noise near and connecting the target boundary in the initial recognition result images, we need to perform image morphological operations to eliminate the influence of the noise.
The detailed flow of batch identification of rock damage area, the method code and the segmentation method selection are determined as follows:
1) A total of 359 images were saved in the experiment, and the three groups of A, B, and C had the same number of 104 images. There are 47 images in Group D. We need to rename the image.
2) As shown in Figure 4, the recognition of irrelevant backgrounds increases the difficulty of batching and makes data processing more complicated (Li et al., 2022a; Li et al., 2022). Therefore, we cropped the 359 original batch images using the feature of small changes in the physical coordinates of the rock sample recognition areas. The code must be guaranteed to run continuously.
3) The methods selection process of batch identification of the rock damage area is shown in Figure 5. In the image segmentation method based on threshold, edge, region and clustering, we chose different small methods to identify the images numbered 103 and 278 to select the appropriate method for the batch process. The results are shown in Figures 6A,B
4) Comparison selection and improvement of methods: As shown in Table 3, in the threshold-based image segmentation method, adaptive threshold segmentation is suitable for identifying areas with long fractures in rock samples during uniaxial compression, while the various failure areas of the global threshold segmentation identified rock samples are less intersected, so the required parts can be extracted separately. The adaptive threshold segmentation equation is shown in Eq. 1 and the global threshold segmentation equation is shown in Eq. 2. In the region-based image segmentation method, region growth segmentation is suitable for identifying large-area damaged regions during uniaxial compression (Grompone von Gioi et al., 2012). Adaptive threshold segmentation is combined with image contrast to identify long cracks. The region growth segmentation is combined with the image brightness, and then the global threshold segmentation results are superimposed to identify the regions with both long cracks and large areas of damage to reach the final recognition result. The equation of image brightness change is shown in Eq. 3 and the equation of image contrast change is shown in Eq. 4.
Where
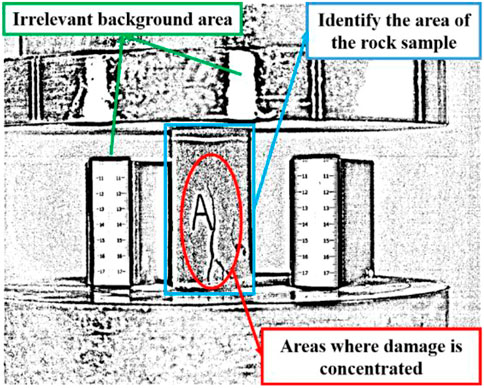
FIGURE 4. Picture overall characteristics.
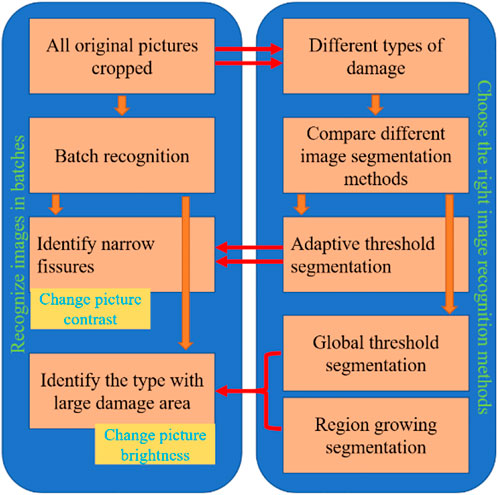
FIGURE 5. Flowchart of methods selection.
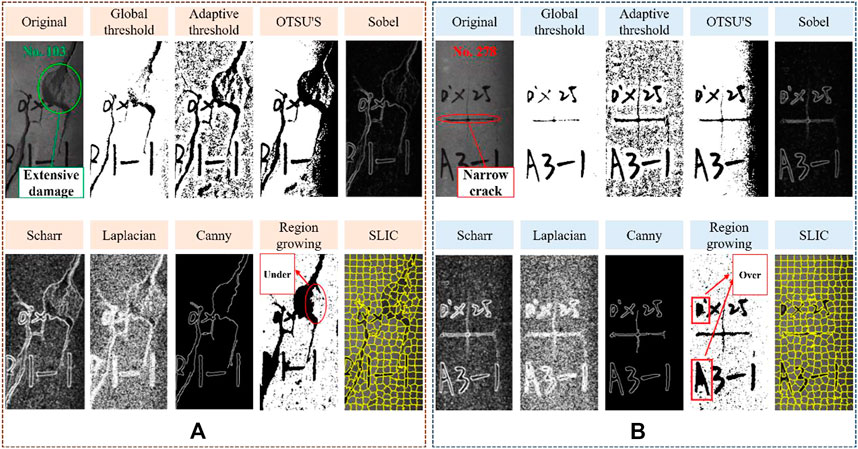
FIGURE 6. The results of image recognition methods; (A) No.103; (B) No.278.
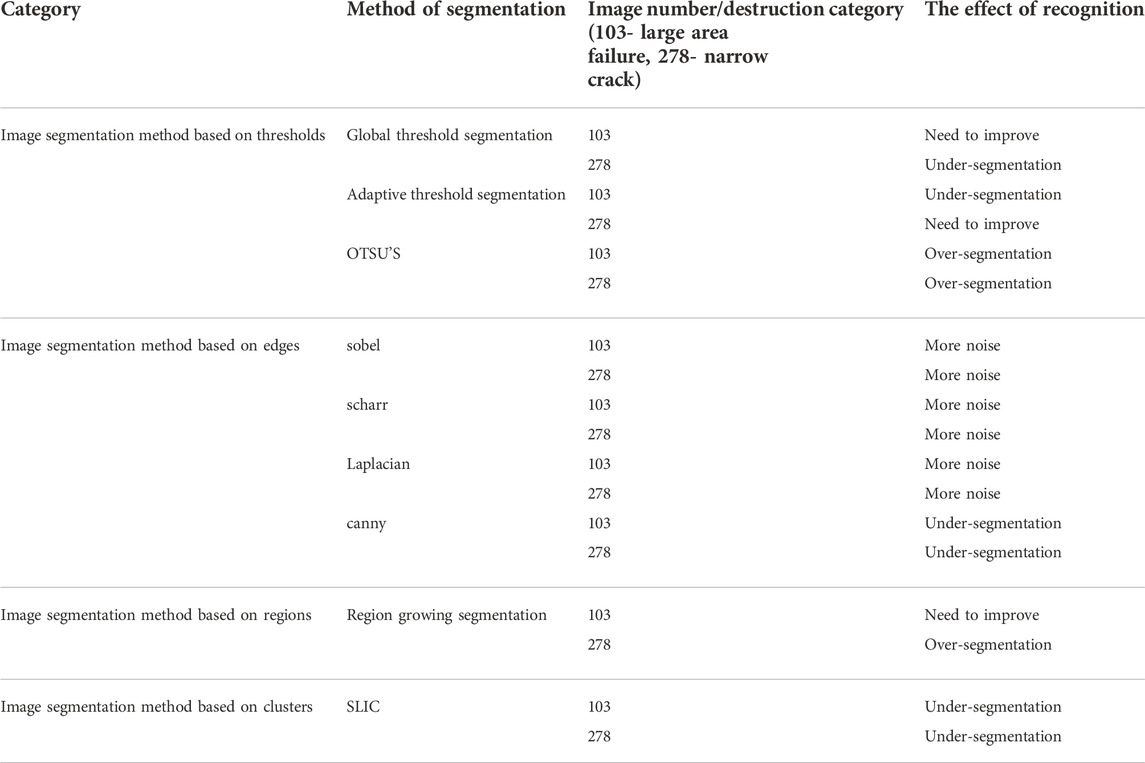
TABLE 3. Comprehensive comparison of image segmentation methods.
The threshold value
Where
Where
5) There are burrs and small-area connected domains in the binary graph. Therefore, we used the median filtering method to achieve the removal of small-area connected domains (Lindsay et al., 2019). The adjacent pixels in the image are arranged according to size, and the value in the middle of the sorted pixel is set as the pixel value after median filtering. The sharpness of the image can be adjusted by changing the k-size. When the k-size is 3, the best denoising effect can be achieved (Sheela and Suganthi, 2020; Li et al., 2022b). After the denoising operation, we used the morphological closing operation to remove burrs to make the result more perfect. The black holes in the image are removed by the first expansion operation, and the erosion operation does not change the deformation area (Jung et al., 2017). The choice of different structural elements leads to different degrees of segmentation (Figure 7). In this study, 3 × 3 structural elements for segmentation are adopted. The closing operation formula is as follows:
Where S is the structural element. X is the image.
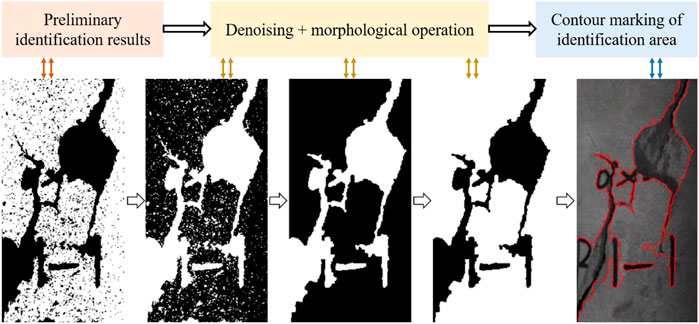
FIGURE 7. Image post-processing.
We identified the main rock batch identification process, but the continuity of the process is also essential.
We first perform batch preprocessing on the 359 images read. It includes sequential renaming (1–359), cropping, contrast change and brightness change. In the second step, we use the adaptive threshold segmentation method to segment the 359 images with changed contrast and output the identification results of narrow fissures. Additionally, we use global threshold segmentation and region growing segmentation to segment 359 images with changed brightness and output the recognition results of severely damaged regions. After the two recognition results are superimposed, 359 recognition result maps are obtained. Finally, we perform batch denoising and morphological processing on the recognition result map to reduce the recognition error.
Some of the results of the batch identification of the rock failure areas are shown in Figure 8. We used a HaSee Ares TXi-CUA laptop to run the code, and we identified the damaged area of 359 images. We ran the code three times and took the average. The time was approximately 5′56.83′ (Figure 9).
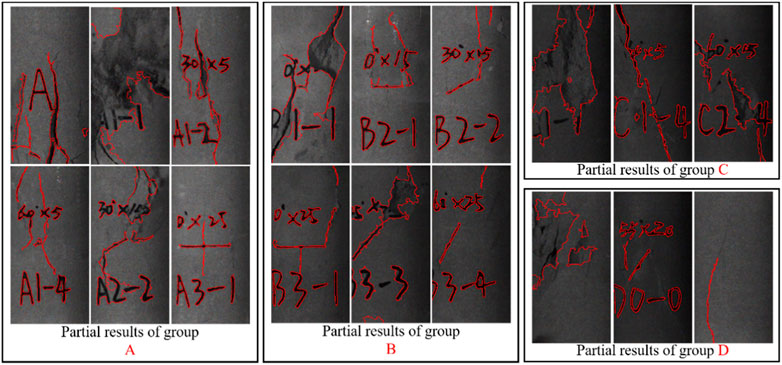
FIGURE 8. Partial recognition results; (A) Group A; (B) Group B; (C) Group C; (D) Group D.
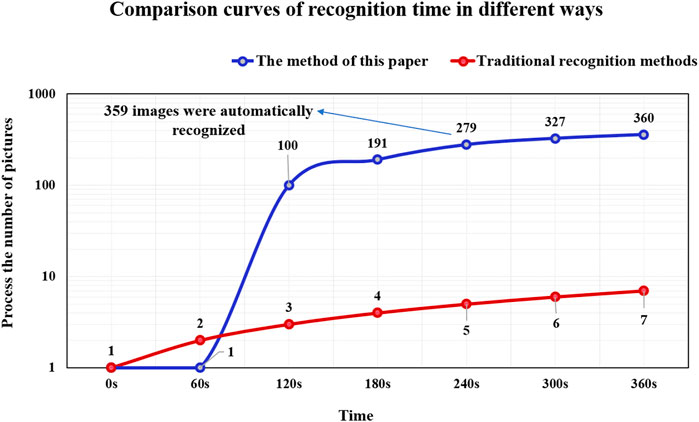
FIGURE 9. Recognition time chart.
Because of the identified contours are usually overestimated or underestimate compared to the real contours, we describe an error assessment method is as shown in Figure 10.

FIGURE 10. Error assessment method.
We hand-animated a total of 86 actual failure diagrams of rock samples in different initial states and compared them with the contours recognized by the automatic batch recognition method to obtain a comparison effect figure of the failure contour area (Figure 11). We imported the contour comparison figure into CAD and used CAD to draw the point coordinates of different contours. The contour coordinate points on the figure were selected to calculate the errors, following the principle of the same X coordinate and different Y coordinate (or different X coordinate and the same Y coordinate). The relative error calculation formula is as follows:
Where

FIGURE 11. Contour comparison and error analysis diagram (partial); (A) Group A; (B) Group B; (C) Group C; (D) Group D.
Table 4 shows the identification errors of rock sample failure areas in different initial states. The relative error value in the X-direction is 10.88%, and the relative error value in the Y-direction is 8.60%. The calculation results show that this automatic batch recognition method is effective.
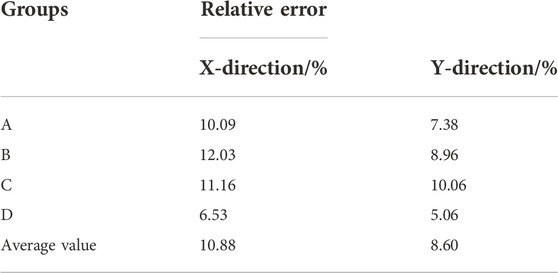
TABLE 4. Relative error analysis table.
The traditional recognition methods described in this paper use a single image segmentation method to recognize rock deformation images one by one. We analyze Figures 6A,B: if we use a single method to identify all the images, it will be difficult for us to obtain high-precision recognition results. In other words, the accuracy of traditional recognition methods is far lower than that of the recognition method proposed in this paper.
Traditionally, to identify rock sample failure images, each image needs to be processed separately. Importing, identifying and saving the results of a single image requires a certain amount of time. We analyze Figure 9: whether the traditional method processed the six images of Group A or Group B or the mixed images of Groups C and D, the average processing time of one image was approximately 1 min. The automatic batch identification method proposed in this paper did not identify any results within a minute of starting to run. This is because we first needed to preprocess 359 images. However, when the preprocessing of the image was completed, Figure 9 shows that compared with the traditional recognition method, the method proposed in this study greatly improves the recognition speed in the subsequent stages.
Further analysis of Figure 9 show that the method proposed in this paper has the fastest recognition speed within 60–120 s. However, the recognition speed continues to decrease in each subsequent time period. This is because during the recognition process, the computer heats up, which causes the processing performance to drop. If we improve computer performance or reduce computer heating problems, the processing time will be further reduced.
As shown in Figure 1 and the previous description, the A, B indicates the different moisture contents of the rock samples. The a indicates the length of the prefracture of the rock sample. The b represents the angle between the prefracture of the rock sample and the parallel line.
As shown in Figure 12, we combined the images and compared the two groups of test curves A-5-0 and B-5-0 simultaneously. It can be seen that the stress-strain curves of the samples under different moisture contents have good similarity, and their mechanical properties and deformation characteristics have the same change trend with the moisture content; the moisture content of the samples increased, the compressive strength decreased, and the peak strain decreased. When the moisture content of the sample increases from 0% to 0.91%, the compressive strength of rock sample decreases from 55.33Mpa to 45.20Mpa, and the compressive strength decreases by about 18.31%.
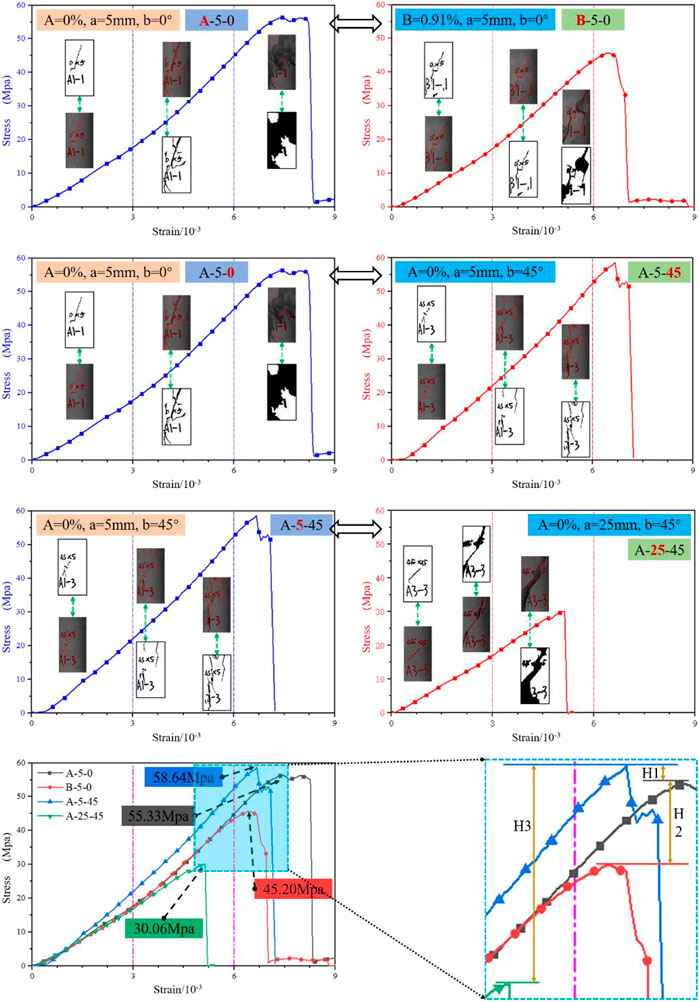
FIGURE 12. Variability factor analysis chart.
Combining the recognition result images and comparing the two sets of test curves A-5-0 and A-5-45 simultaneously, we can see that when the sample contains water and the crack length is constant, the prefabricated crack inclination has no obvious influence on its compressive strength. The overall change trend is similar. When the prefabricated crack inclination increases from 0° to 45°, the compressive strength of rock sample increases from 55.33Mpa to 58.64Mpa, with an increase of 5.98%.
Combining the recognition result images and comparing the two sets of test curves A-5-45 and A-25-45, we can see that the variation trend of mechanical properties and deformation characteristics of the sample with the crack length is the same. With the increase in the prefabricated crack length of the sample, the compressive strength of the sample decreases gradually. When the prefabricated crack length of the samples increases from 5 to 25 mm, the compressive strength of the rock sample decreases from 58.64Mpa to 30.06 Mpa, and the compressive strength decreases by 48.74%.
According to the uniaxial compression test data measured under different moisture contents and different initial crack lengths, the peak stress intensity and peak strain of rock samples can be obtained. By fitting the data with a function relationship, it can be found that the compressive strength of rock samples has a negative linear function relationship with water content and fracture length and a positive exponential function relationship with the rock sample fracture dip angle (Figure 13).
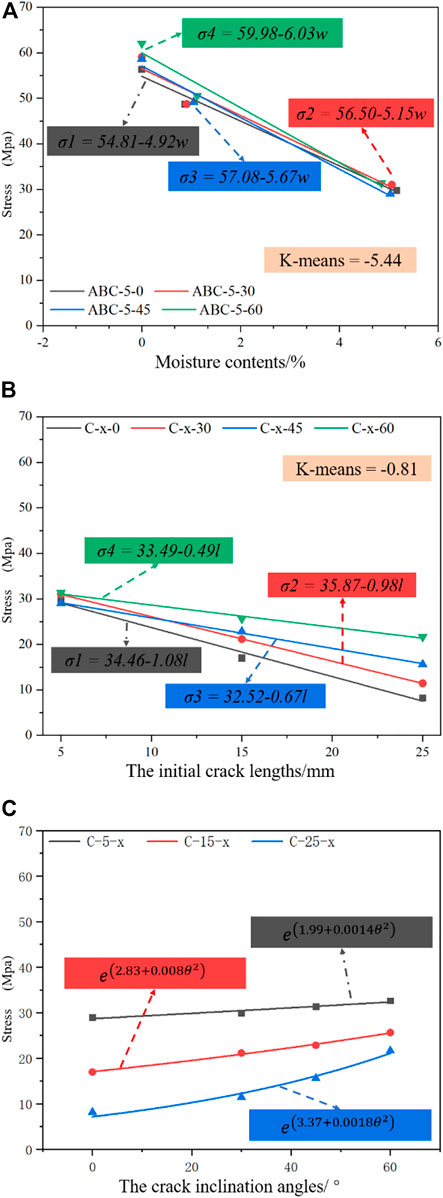
FIGURE 13. Characteristic curves of compressive strength of rock samples under different conditions; (A) Fitting curve of initial crack lengths and compressive strength in saturated state; (B) Fitting curve of rock moisture content and compressive strength; (C) Fitting curve of crack inclination angles and compressive strength in saturated state.
As shown in Eq. 7, Based on the fitting curve results, the functional expression between the compressive strength of rock samples and the variability factors can be obtained.
where
Analyzing the ABC-5-60 curve in Figure 13A, when the moisture content of the sample increases from 0% to 0.91%, the compressive strength of the rock sample decreases from 62.04 MPa to 47.54 When the moisture content of the sample increases from 0.91% to 5.06%, the compressive strength of the rock sample decreases from 47.54 to 31.35 MPa, and the compressive strength decreases by approximately 49.47%.
Analyzing the C-X-0 curve in Figure 13B, when the prefabricated crack length of the samples increases from 5 to 15 mm, the compressive strength of the rock sample decreases from 29.75 When the prefabricated crack length of the samples increases from 15 to 25 mm, the compressive strength of the rock sample decreases from 16.98 to 8.19 MPa, and the compressive strength decreases by 73.96%.
The C-15-X curve in Figure 13C shows that when the prefabricated crack inclination increases from 0° to 30°, the compressive strength of the rock sample increases from 16.98 When the prefabricated crack inclination increases from 30° to 45°, the compressive strength of the rock sample increases from 21.14 When the prefabricated crack inclination increases from 45° to 60°, the compressive strength of the rock sample increases from 22.84 to 25.63 MPa, an increase of 33.75%.
Through comprehensive analysis and comparative analysis, we can see that the influence of the sample moisture content on the sample compressive strength is dominant, followed by the initial crack length, and the crack inclination has the least influence on the sample compressive strength.
1) The automatic batch recognition method proposed in this paper combined adaptive threshold segmentation with image contrast to identify rock samples with long fractures, combined regional growth segmentation with image brightness and then superimposed the results of global threshold segmentation to identify rock samples with both long fractures and large areas of regional damage to reach the final recognition result. The recognition results show that this method can realize automatic batch recognition of rock failure areas. Compared with other single methods, this method can recognize rock images of different failure types.
2) Based on the recognition result and combined with the rock uniaxial compression stress–strain curve, we analyzed the influence of variability factors on the compressive strength of the rock. When the water content of the rock increases or the length of the initial fracture increases, the compressive strength of the rock gradually decreases. The influence of the water content of rock on the compressive strength of the rock is dominant. The initial crack angle of the rock has no obvious influence on its compressive strength.
3) The limitations of this automatic batch identification method for rock cracks are as follows. The physical coordinates method is used when cropping the pictures. If the location of the area to be processed is changeable, it will not work, so it is necessary to find an optimized method to extract the area to be processed. The batch processing time may be further shortened. The accuracy of batch processing needs to be improved. In the future, the above problems need to be solved.
The original contributions presented in the study are included in the article/supplementary material, further inquiries can be directed to the corresponding author.
Conceptualization, formal analysis, writing—original draft, CY; funding acquisition, methodology, writing—review and editing, WN; validation, QL; validation, JG; funding acquisition, BD; validation, JG.
This work was supported by Jiangxi Provincial Natural Science Foundation (No. 20212ACB214005), the National Natural Science Foundation of China (No. 52064016), Major science and technology projects of Anhui Province (No. 202003a0702002), the National Natural Science Foundation of China (No. 52130403) and the Graduate Research and Innovation Foundation of Chongqing, China (Grant No. CYB20023).
The authors declare that the research was conducted in the absence of any commercial or financial relationships that could be construed as a potential conflict of interest.
All claims expressed in this article are solely those of the authors and do not necessarily represent those of their affiliated organizations, or those of the publisher, the editors and the reviewers. Any product that may be evaluated in this article, or claim that may be made by its manufacturer, is not guaranteed or endorsed by the publisher.
Achanta, R., Shaji, A., Smith, K., Lucchi, A., Fua, P., and Süsstrunk, S. (2012). SLIC superpixels compared to state-of-the-art superpixel methods. IEEE Trans. Pattern Anal. Mach. Intell. 34, 2274–2282. doi:10.1109/TPAMI.2012.120
Chauhan, S., Rühaak, W., Anbergen, H., Kabdenov, A., Freise, M., Wille, T., et al. (2016). Phase segmentation of X-ray computer tomography rock images usingmachine learning techniques: an accuracy and performancestudy. Solid earth. 7, 1125–1139. doi:10.5194/se-7-1125-2016
Clarke, A. P., and Vannucchi, P. (2020). Structural anisotropy: Using image analysis to quantify block-in-matrix fabrics. J. Struct. Geol. 131, 103939. doi:10.1016/j.jsg.2019.103939
Elaziz, M. A., and Lu, S. (2019). Many-objectives multilevel thresholding image segmentation using Knee Evolutionary Algorithm. Expert Syst. Appl. 125, 305–316. doi:10.1016/j.eswa.2019.01.075
Eshiet, K. I.-I., Welch, M., and Sheng, Y. (2018). Numerical modelling to predict fracturing rock (Thanet chalk) due to naturally occurring faults and fluid pressure. J. Struct. Geol. 116, 12–33. doi:10.1016/j.jsg.2018.07.021
Ge, Y., Xie, Z., Tang, H., Chen, H., Lin, Z., and Du, B. (2019). Determination of shear failure regions of rock joints based on point clouds and image segmentation. Eng. Geol. 260, 105250. doi:10.1016/j.enggeo.2019.105250
Grompone von Gioi, R., Jakubowicz, J., Morel, J.-M., and Randall, G. (2012). LSD: a line segment detector. Image Process. Line 2, 35–55. doi:10.5201/ipol.2012.gjmr-lsd
Jung, J., Stachniss, C., and Kim, C. (2017). Automatic room segmentation of 3D laser data using morphological processing. ISPRS Int. J. Geoinf. 6, 206. doi:10.3390/ijgi6070206
Khan, J. F., Bhuiyan, S. M. A., and Adhami, R. R. (2011). Image segmentation and shape analysis for road-sign detection. IEEE Trans. Intell. Transp. Syst. 12, 83–96. doi:10.1109/TITS.2010.2073466
Kou, M., Liu, X., Tang, S., and Wang, Y. (2019). 3-D X-ray computed tomography on failure characteristics of rock-like materials under coupled hydro-mechanical loading. Theor. Appl. Fract. Mech. 104, 102396. doi:10.1016/j.tafmec.2019.102396
Levinshtein, A., Stere, A., Kutulakos, K. N., Fleet, D. J., Dickinson, S. J., and Siddiqi, K. (2009). TurboPixels: Fast superpixels using geometric flows. IEEE Trans. Pattern Anal. Mach. Intell. 31, 2290–2297. doi:10.1109/TPAMI.2009.96
Li, L., Yu, C., Han, Z., and Sun, T. (2019). Automatic identification of the rock-soil interface and solution fissures from optical borehole images based on color features. IEEE J. Sel. Top. Appl. Earth Obs. Remote Sens. 12, 3862–3873. doi:10.1109/JSTARS.2019.2940513
Li, Q., Geng, J., Song, D., Nie, W., Saffari, P., and Liu, J. (2022a). Automatic recognition of erosion area on the slope of tailings dam using region growing segmentation algorithm. Arab. J. Geosci. 15, 438. doi:10.1007/s12517-022-09746-4
Li, Q., Song, D., Yuan, C., and Nie, W. (2022b). An image recognition method for the deformation area of open-pit rock slopes under variable rainfall. Measurement 188, 110544. doi:10.1016/j.measurement.2021.110544
Li, X., Li, Q., Hu, Y., Chen, Q., Peng, J., Xie, Y., et al. (2022). Study on three-dimensional dynamic stability of open-pit high slope under blasting vibration. Lithosphere 2021, 6426550. doi:10.2113/2022/6426550
Li, Z., and Zhang, G. (2019). Fracture segmentation method based on contour evolution and gradient direction consistency in sequence of coal rock CT images. Math. Problems Eng. 2019, 1–8. doi:10.1155/2019/2980747
Liang, H., and Zou, J. (2020). Rock image segmentation of improved semi-supervised SVM–FCM algorithm based on chaos. Circuits Syst. Signal Process. 39, 571–585. doi:10.1007/s00034-019-01088-z
Lin, W., Li, X., Yang, Z., Lin, L., Xiong, S., Wang, Z., et al. (2018). A new improved threshold segmentation method for scanning images of reservoir rocks considering pore fractal characteristics. Fractals 26, 1840003. doi:10.1142/S0218348X18400030
Lindsay, J. B., Francioni, A., and Cockburn, J. M. H. (2019). LiDAR DEM smoothing and the preservation of drainage features. Remote Sens. 11, 1926. doi:10.3390/rs11161926
Obara, B. (2007). A new algorithm using image colour system transformation for rock grain segmentation. Mineralogy Petrology 91, 271–285. doi:10.1007/s00710-007-0200-x
Passchier, M., Passchier, C. W., Weismüller, C., and Urai, J. L. (2021). The joint sets on the Lilstock Benches, UK. Observations based on mapping a full resolution UAV-based image. J. Struct. Geol. 147, 104332. doi:10.1016/j.jsg.2021.104332
Purswani, P., Karpyn, Z. T., Enab, K., Xue, Y., and Huang, X. (2020). Evaluation of image segmentation techniques for image-based rock property estimation. J. Petroleum Sci. Eng. 195, 107890. doi:10.1016/j.petrol.2020.107890
Sheela, C. J. J., and Suganthi, G. (2020). An efficient denoising of impulse noise from MRI using adaptive switching modified decision based unsymmetric trimmed median filter. Biomed. Signal Process. Control 55, 101657. doi:10.1016/j.bspc.2019.101657
Shi, Z., Ma, J., Zhao, M., Liu, Y., Feng, Y., Zhang, M., et al. (2016). Many is better than one: An integration of multiple simple strategies for accurate lung segmentation in CT images. BioMed Res. Int. 2016, 1–13. doi:10.1155/2016/1480423
Shou, Y. D., Zhao, Z., and Zhou, X. P. (2020). Sensitivity analysis of segmentation techniques and voxel resolution on rock physical properties by X-ray imaging. J. Struct. Geol. 133, 103978. doi:10.1016/j.jsg.2020.103978
Sun, Z., Xuan, P., Song, Z., Li, H., and Jia, R. (2019). A texture fused superpixel algorithm for coal mine waste rock image segmentation. Int. J. Coal Prep. Util. 42, 1222–1233. doi:10.1080/19392699.2019.1699546
Tavakkoli Piralilou, S., Shahabi, H., Jarihani, B., Ghorbanzadeh, O., Blaschke, T., Gholamnia, K., et al. (2019). Landslide detection using multi-scale image segmentation and different machine learning models in the higher himalayas. Remote Sens. 11, 2575. doi:10.3390/rs11212575
Wang, W. (2006). An image segmentation algorithm for densely packed rock fragments of uneven illumination_. Rough Sets Knowl. Technol. 4062, 665–670.
Wang, Y., Zhang, H., Lin, H., Zhao, Y., and Liu, Y. (2020). Fracture behaviour of central-flawed rock plate under uniaxial compression. Theor. Appl. Fract. Mech. 106, 102503. doi:10.1016/j.tafmec.2020.102503
Wen, S., Han, L., Zong, Y., Meng, Q., and Zhang, J. (2013). Study on acoustic emission characteristics of sandstone uniaxial compression test with different moisture content. Coal Sci. Technol. 41, 46–48+52. doi:10.13199/j.cnki.cst.2013.08.016
Xie, W., Nie, W., Saffari, P., Robledo, L. F., Descote, P.-Y., and Jian, W. (2021). Landslide hazard assessment based on Bayesian optimization–support vector machine in Nanping City, China. Nat. Hazards (Dordr). 109, 931–948. doi:10.1007/s11069-021-04862-y
Yang, Y., Song, S., Yue, F., He, W., Shao, W., Zhao, K., et al. (2019). Superpixel-based automatic image recognition for landslide deformation areas. Eng. Geol. 259, 105166. doi:10.1016/j.enggeo.2019.105166
Yen, J-C., Chang, F-J., and Chang, S. (1995). A new criterion for automatic multilevel thresholding. IEEE Trans. Image Process. 4, 370–378. doi:10.1109/83.366472
Zhang, J., and Zhang, J. (2020). An improved nondestructive semantic segmentation method for concrete dam surface crack images with high resolution. Math. Problems Eng. 2020, 1–14. doi:10.1155/2020/5054740
Zhang, Y. (2018). An overview of image and video segmentation in the last 40 years. Available at: http://fx.jxustlib.chaoxing.com/detail_38502727e7500f26ea417ed5a8845d7660b0d09c5135d9fb1921b0a3ea255101e580949000984f4b7e127d7dcde5904e8a64dc1d3927f0c10e48b15e3fa8bcbf3a6bca1848ac39859b0b7588b5da9315?
Zhang, Y., Zhong, H.-R., Zhang, X., Gao, S.-C., and Zhang, D. (2020). Orthogonal microscopy image acquisition analysis technique for rock sections in polarizer angle domain. J. Struct. Geol. 140, 104174. doi:10.1016/j.jsg.2020.104174
Keywords: image segmentation, automatic batch recognition, uniaxial compression test, relative error, stress-strain curve
Citation: Yuan C, Nie W, Li Q, Geng J, Dai B and Gao J (2023) Automatic batch recognition of rock deformation areas based on image segmentation methods. Front. Earth Sci. 10:1093764. doi: 10.3389/feart.2022.1093764
Received: 09 November 2022; Accepted: 22 November 2022;
Published: 19 January 2023.
Edited by:
Danqing Song, Tsinghua University, ChinaReviewed by:
Yi He, Southwest Jiaotong University, ChinaCopyright © 2023 Yuan, Nie, Li, Geng, Dai and Gao. This is an open-access article distributed under the terms of the Creative Commons Attribution License (CC BY). The use, distribution or reproduction in other forums is permitted, provided the original author(s) and the copyright owner(s) are credited and that the original publication in this journal is cited, in accordance with accepted academic practice. No use, distribution or reproduction is permitted which does not comply with these terms.
*Correspondence: Wen Nie, d2VuLm5pZUB2aXAudG9tLmNvbQ==
Disclaimer: All claims expressed in this article are solely those of the authors and do not necessarily represent those of their affiliated organizations, or those of the publisher, the editors and the reviewers. Any product that may be evaluated in this article or claim that may be made by its manufacturer is not guaranteed or endorsed by the publisher.
Research integrity at Frontiers
Learn more about the work of our research integrity team to safeguard the quality of each article we publish.