 Yue Gao
 Yi Zhang
 Lili Lei
 Jie Tang
95% of researchers rate our articles as excellent or good
Learn more about the work of our research integrity team to safeguard the quality of each article we publish.
Find out more
ORIGINAL RESEARCH article
Front. Earth Sci. , 12 January 2023
Sec. Atmospheric Science
Volume 10 - 2022 | https://doi.org/10.3389/feart.2022.1093545
This article is part of the Research Topic Tropical Cyclone Intensity and Structure Changes: Theories, Observations, Numerical Modeling and Forecasting View all 19 articles
Super Typhoon Lekima (2019) is the fifth strongest typhoon to make landfall in mainland China since 1949. After its landfall, Typhoon Lekima moved northward along the coastline, resulting in an extreme rain event in Shandong Province that caused the highest precipitation in available meteorological records. A Weather Research and Forecasting (WRF) model simulation that properly produces the track and intensity of Typhoon Lekima and the spatio-temporal evolution of rainfall is used to analyze the multi-scale characteristics of the extreme rain event. The results show that different from the typhoon precipitation which occurred at low latitudes, the extreme rain event that occurred in mid-latitudes was influenced by the interactions of mid-latitude synoptic systems and typhoon circulation, especially with five mesoscale rainbands. The mid-latitude synoptic systems, mainly including the upper-tropospheric jet, the western North Pacific subtropical high, the mid-latitude trough, the low-level jets, and Typhoon Krosa (2019), allowed Typhoon Lekima to maintain its intensity after landfall and provided favorable kinematic, thermodynamic, and moisture conditions for the heavy rainfall in Shandong. Based on the evolution of the mesoscale rainbands, the extreme rain event can be divided into three stages. The first stage can be classified as distant rainfall, which was affected by two convective rainbands associated with boundary-layer processes. The second stage had the highest precipitation, featuring the formation of a frontal zone in Shandong, interacting with Typhoon Lekima. The third stage had weakened rainfall and was directly influenced by the spiral rainband of Typhoon Lekima.
Tropical cyclones (TCs) are large cyclonic systems with organized deep convections and warm core structures, which are usually formed over tropical and subtropical oceans. TCs are called hurricanes in the Atlantic and typhoons in the Pacific. About 90 TCs form globally each year, of which about 30 occur in the western North Pacific, where the most frequent and, often, the strongest TCs occur (Peduzzi et al., 2012). On an average, about seven typhoons make landfall in China each year, and China is one of the countries in the world which experience the largest number of typhoons and the most severe impacts (Zhang et al., 2009).
Disasters of typhoons are mainly caused by strong winds, heavy rainfall, and storm surges. Among them, heavy rainfall is the most severe one, which could cause mudslides, landslides, and many other related geological disasters (Jonkman et al., 2009). Meanwhile, heavy rainfall also occurs frequently, resulting in serious casualty and property loss in China (Meng et al., 2002; Zhang et al., 2013). In addition, there is an increasing trend for TC intensity in the 21st century due to global warming (Knutson et al., 2010; Emanuel, 2013), and the region of TC occurrence tends to expand with wider mid- and high-latitude areas (Kossin et al., 2014; Studholme and Gulev, 2018; Guo and Tan, 2022; Studholme et al., 2022). Thus, northern China in mid-latitudes becomes more vulnerable due to typhoons’ heavy rainfall, which requires special attention.
A favorable large-scale environment is necessary for typhoons’ heavy rainfall in mid-latitudes (Yu et al., 2020). A low-level jet, generally existing between a typhoon and the western Pacific subtropical high (WPSH), transports large amounts of warm and moist air northward from the tropic which then accumulate in the rainfall area. This process provides abundant water vapor and energy for precipitation and also leads to an unstable atmospheric condition (Wang et al., 2009; Byun and Lee, 2012; Schumacher and Galarneau, 2012). In the upper level, there is often an upper-tropospheric jet. The divergence in its equatorward entrance region contributes to the enhancement of quasi-geostrophic upward motion, and the rapid removal of latent heat from condensation over the rainfall area allows instability to be re-established (Galarneau et al., 2010; Bosart et al., 2012; Moore et al., 2013). Similarly, there is generally a mid-latitude westerly trough in the middle level. When a typhoon is located in front of the trough, the upper-level divergence will enhance the positive vorticity advection below (Ritchie and Elsberry, 2007; Leroux et al., 2016). When a typhoon is superimposed upon the trough, typhoon intensity and peripheral shear, which are both favorable to the maintenance of typhoons’ heavy rainfall, tend to increase under positive potential vorticity disturbance (Klein et al., 2000; Hanley et al., 2001; Zhou et al., 2022).
In a suitable large-scale environment, mesoscale fronts are favored to form, providing baroclinic energy for convectional organization in the rainfall area (Colle, 2003; Gao et al., 2009; Torn, 2010). The convergence of southward cold air behind the westerly trough and warm air transported northward from northeast of the typhoon can produce a frontal area in the middle level. Baek et al. (2014) showed that the warm air carried by Typhoon Rusa (2002) interacted with the cold air behind the trough to trigger frontogenesis in the middle troposphere, resulting in heavy rainfall over the Korean Peninsula. Between the strong, warm, and moist low-level jet and the mid-latitude cold and dry air, large thermal and moisture gradients can form, which contribute to the frontal area at the low level. Heavy rainfall caused by Hurricane Erin (2007) in the United States was associated with a warm frontogenesis in the lower troposphere (Schumacher et al., 2011). Frontal regions over the outer periphery of typhoons can enhance convections with increased vorticity through the growth of temperature gradients, promoting the development of a typhoon and associated rainfall (Han and Wu, 2008).
Moreover, mesoscale spiral rainbands of typhoon can directly influence heavy rainfall. Houze (2010) proposed three types of spiral rainbands based on the appearance: principal rainbands, secondary rainbands, and distant rainbands. Spiral rainbands can also be divided into inner and outer rainbands. Inner rainbands are mainly dominated by the vortex dynamic process, while outer rainbands with a looser organization of convections are dominated by the vortex’s dynamic process and the environment (Willoughby et al., 1984; Wang, 2008; Li and Wang, 2012). When approaching the mid-latitude westerly zone, the asymmetry of typhoon rainbands increases due to stronger environmental vertical wind shear, and precipitation is more likely to occur downshear left (Corbosiero and Molinari, 2003; Chen et al., 2006). For example, the south–north-oriented spiral rainband of northward-moving Typhoon Nina (1975) after landfall led to rainfall intensification in the southern Henan Province (Yang et al., 2017); the heavy precipitation near Shanghai during the landfall of Typhoon Fitow (2013) was associated with two spiral rainbands in its north (Bao et al., 2015).
Most previous studies of typhoon rainfall in China have focused on regions near the southeast coast and Taiwan (Chen et al., 2010; Lee et al., 2010; Li and Zhou, 2015). But the studies on typhoons and their associated rainfall in northern China provinces such as Shandong are limited, although under climate change, northern China would face heavier rainfall from typhoons. Moreover, the majority of previous studies focus on synoptic-scale analysis, yet there is a lack of detailed mesoscale studies, especially based on numerical simulations. Super Typhoon Lekima (2019) dramatically affected Shandong with an extreme rain event and record-breaking precipitation (He et al., 2020). It is the perfect case for understanding the multi-scale characteristics of an extreme rain event in Shandong, which could provide valuable knowledge for understanding the mechanisms of typhoon rainfall in mid-latitudes. The investigation of the extreme rain event caused by Typhoon Lekima has also provided guidance for precipitation prediction with similar processes, which is of great theoretical and practical importance for disaster risk management in China. Thus, in this study, we simulate the extreme rain event in the Shandong Province produced by Typhoon Lekima and analyze the characteristics of the multi-scale influence system during the rainfall process in detail.
The paper is organized as follows. Section 2 describes the data and configurations of numerical simulations. A brief description of Typhoon Lekima and the heavy rainfall in Shandong is provided in Section 3. Section 4 evaluates the numerical simulation and discusses the extreme rain event, mainly in three stages. The main factors influencing the track and intensity of Typhoon Lekima and the favorable conditions for precipitation are analyzed in Section 5. Section 6 examines the direct influence systems in different stages of the extreme rain event. Section 7 gives the conclusions.
Observations for Typhoon Lekima were obtained from the tropical cyclone best track dataset compiled by the Tropical Cyclone Information Center of the China Meteorological Administration (http://tcdata.typhoon.org.cn). It contains the storm’s central latitude and longitude, maximum 2-min average near-center 10-m wind speed, minimum central sea level pressure, etc. for every 3 h (Ying et al., 2014). The observed precipitation was collected from the Multi-source Merged Precipitation Analysis System (CMPAS)-hourly V2.1 dataset, which combines the automatic weather station and Climate Precipitation Centre Morphing (CMORPH) precipitation over China with a horizontal resolution of .1° (http://data.cma.cn). The observed composite radar reflectivity is available every 6 min from the National Meteorological Center (http://www.nmc.cn).
In order to reproduce Lekima’s northward movement along the land edge, and the location of the rainbands near Shandong Province, the three-dimensional, fully compressible, non-hydrostatic mesoscale numerical model, Advanced Research Weather Research and Forecasting Model (ARW-WRF) version 4.2 (Skamarock et al., 2019), is used. A combinational scheme of FNL (Final) re-analysis data as the initial conditions and ERA5 re-analysis data as the lateral boundary conditions is adopted. The National Centers for Environmental Prediction (NCEP) FNL global re-analysis has a horizontal resolution of .25° and a temporal resolution of 6 h. This product can properly characterize Lekima’s initial intensity so it is used as the initial condition. Lateral boundary conditions are produced from the European Centre for Medium-Range Weather Forecasts’ (ECMWF) latest ERA5 climate re-analysis. It has a horizontal resolution of .25° and an enhanced temporal resolution of 1 h, which allows for a detailed description of a large-scale background field. The simulation was initialized at 0600 UTC 9 August 2019 and integrated for 54 h until 1200 UTC 11 August.
As shown by Figure 1A, 2 one-way nested domains are used. Outer domain 1 (D01) has 565 × 426 grid points with a 12-km horizontal grid spacing, and inner domain 2 (D02) has 770 × 805 grid points with a 2.4-km horizontal grid spacing. The outer domain covers most of East Asia and the western North Pacific for analyzing the large-scale circulation, while the inner domain covers the typhoon activity region during the integration period and Shandong Province for analyzing the structure of Typhoon Lekima and mesoscale precipitation systems. There are 56 vertical levels, and they are stretched with gradually decreasing vertical resolution as the height increases, with the finest vertical resolution (approximately 70 m) in the boundary layer and the coarsest one (about 1 km) near the top of the model at 10 hPa. The terrain feature around Shandong Province is shown in Figure 1B.
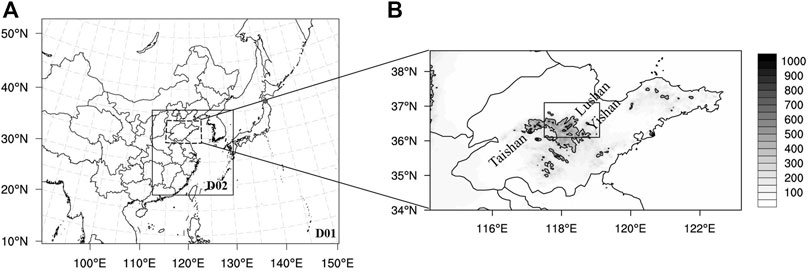
FIGURE 1. (A) Domains for numerical simulations, where outer domain D01 and inner domain D02 have 12- and 2.4-km horizontal grid spacings, respectively; (B) Zoomed terrain height (shaded; unit: m) of the black dashed box in (A) near Shandong Province with the main mountains. Black contours in (B) show the terrain heights of 300 m and 600 m. The black solid box in (B) indicates the heavy rainfall area as in Figure 2.
The model physics parameterization are chosen as follows: the Weather Research and Forecasting (WRF) single-moment six-class (WSM 6) microphysics scheme (Hong and Lim, 2006), the rapid radiative transfer model for general circulation (RRTMG) longwave and shortwave radiation scheme (Iacono et al., 2008), the Yonsei University (YSU) boundary layer scheme (Hong et al., 2006), and the Noah land surface model (Chen and Dudhia, 2001). The Kain–Fritsch cumulus parameterization scheme (Kain, 2004) and moisture-advection-modulated trigger function (Ma and Tan, 2009) are only used for subgrid-scale deep convection in D01.
Lekima, the ninth typhoon over western North Pacific in 2019, was formed east of the Philippines. It featured strong intensity at landfall and long duration over land with strong winds and rainfall, which caused a severe disaster and drew widespread concern (He et al., 2020). Lekima became a tropical depression around 1800 UTC 3 August 2019 and then moved to the northwest and intensified rapidly into a tropical storm around 1200 UTC 4 August; it became a severe storm around 1800 UTC 5 August, became a typhoon around 1800 UTC 6 August, and then a severe typhoon around 1200 UTC 7 August, with the supply of water vapor and energy from the wide and warm ocean surface. Lekima finally became a super typhoon around 1800 UTC 7 August and made the first landfall in Wenling, Zhejiang Province, around 1800 UTC 9 August with a maximum sustained near-surface wind speed of 52 m/s and a minimum central sea level pressure of 930 hPa. By then, it became the fifth strongest super typhoon to make landfall in mainland China since 1949. After its first landfall, Lekima decayed rapidly to typhoon intensity and subsequently moved northward toward the Yellow Sea and made the second landfall in Qingdao, Shandong Province, around 1200 UTC 11 August, with a maximum sustained near-surface wind speed of 23 m/s and a minimum central sea level pressure of 982 hPa. After its second landfall, Lekima continued to move northward through the Shandong Peninsula, hovered near Laizhou Bay for about 1 day, and eventually moved northeast into the Bo Sea, decaying into a tropical depression. The China Metrological Administration stopped numbering it at 0600 UTC 13 August 2019.
The extreme rain event in Shandong mainly occurred from 0000 UTC 10 August to 1200 UTC 11 August 2019 before Lekima’s landfall in Shandong, with maximum accumulated precipitation exceeding 400 mm. The precipitation center was located in central Shandong Province including the western part of Weifang, the southern part of Dongying, and the central part of Zibo, denoted by the black solid box (36. 1°−37. 1°N, 117. 5°−119. 1°E) in Figure 2, which is defined as “heavy rainfall area” in this study. According to Figure 1B, the heavy rainfall area denoted by the black solid box is located in the mountainous area of central Shandong near Taishan Mountain, Lushan Mountain, and Yishan Mountain, so the orographic lifting caused by convergence in front of the mountains might contribute to the enhancement and spatial distribution of precipitation (Lin et al., 2002; Wu et al., 2002; Yang et al., 2008).
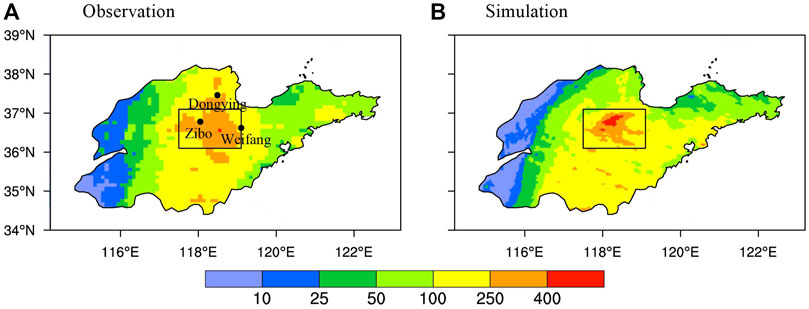
FIGURE 2. Accumulated precipitation (unit: mm) of (A) observation and (B) simulation for Shandong Province from 0000 UTC 10 August to 1200 UTC 11 August 2019. The rectangle zone (36. 1°−37. 1°N, 117. 5°−119. 1°E) indicated by the black solid box is used to perform the area-averaged time series in Figure 6.
In this section, the WRF simulation is verified relative to observations, with a focus on the reproduction of the evolution of Typhoon Lekima after landfall. The track, intensity, and the spatio-temporal evolution of the extreme rain event in Shandong Province from 0000 UTC 10 August to 1200 UTC 11 August 2019 are evaluated.
Figure 3 shows Lekima’s track and intensity from observation and simulations. The simulated typhoon center is determined by the minimum sea level pressure in D02. The simulated typhoon moves slower than the observation after landfall, leading to an approximate 3-h lag since 0000 UTC 10 August (Figure 3A). Compared with the observed track from the best track dataset, the simulated typhoon reproduced the northward track along the coastal line with a slightly eastward (within 150 km) north of 30。N well. Because the simulated WPSH’s eastward retreat process is consistent with that of the observation and the simulated typhoon’s moving speed is slower than that of the observation, the simulated TC track appears to deviate eastward under the steering of WPSH circulation which moved eastward earlier.
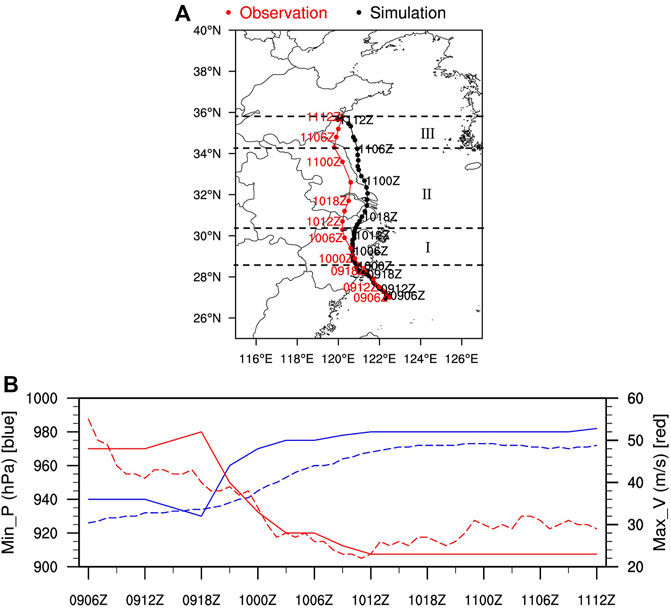
FIGURE 3. Observed and simulated tracks and intensities of Lekima from 0600 UTC 9 August to 1200 UTC 11 August 2019. (A) Observed track from the best track dataset (red line with filled circles denoting Lekima’s location every 3 h) and the simulated track from WRF (black line with filled circles denoting Lekima’s location every 1 h). Dashed lines and I, II, and III denote the three stages of the extreme rain event in Figure 4; (B) time series of the observed (solid line) and simulated (dashed line) maximum sustained 10-m wind speed (red line; unit: m/s) and minimum central sea level pressure (blue line; unit: hPa).
Figure 3B compares the maximum sustained 10-m wind speed and the minimum central sea level pressure from the observations and simulations. The intensity of Lekima is also well simulated with a decay after the first landfall in Zhejiang around 1800 UTC 9 August, despite the underestimated decaying rate. The simulated typhoon intensity is also stronger than those of the observed quantities, which might be due to the closer distance to the coastline and more sufficient water vapor supply due to the eastward track bias. The observed and simulated typhoon intensities do not decay significantly when passing through Shandong.
Accumulated precipitation from 0000 UTC 10 August to 1200 UTC 11 August 2019 in Shandong Province from D02 simulation is compared to the observed precipitation (Figure 2). The WRF simulation captures the spatial pattern of the heavy rainfall, with the maximum over 400 mm in central Shandong, but slightly underestimates the range of rainfall over 250 mm. Figure 4 shows the evolution of the observed and simulated hourly rainfall average over the heavy rainfall area (black solid box in Figure 2). Both hourly rainfalls show similar magnitudes and temporal evolutions, except for a time lag in the simulated one that is probably related to the southward track bias. Considering the evolution of precipitation and influence systems, the extreme rain event in Shandong can be divided into three stages. The three stages for observations and simulations are shown by the dashed and dotted lines in Figure 4, respectively, with notations of I, II, and III. The locations of Lekima during the three stages are shown in Figure 3A. During stage I, the typhoon’s center was located in Zhejiang Province, about 800 km away from Shandong Province; thus, Lekima did not directly affect Shandong at this time, and the rainfall was weak. Lekima moved northward to Jiangsu Province along the coastline during stage II, and its outer rainband started to affect Shandong directly, producing the strongest precipitation. During stage III, Lekima was located on the Yellow Sea and continued to move north. The rainfall in Shandong Province caused by the typhoon gradually decreased.
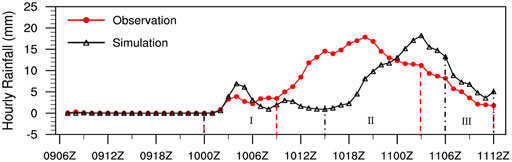
FIGURE 4. Evolution of hourly rainfall (unit: mm) averaged over the heavy rainfall area (black solid box in Figure 2) from 0600 UTC 9 August to 1200 UTC 11 August 2019 for observation (red line with circles) and simulation (black line with triangles). The three stages of the extreme rain event from observation (simulation) are separated by dashed (dash-dotted) lines, and I, II, and III denote the three stages.
Since the typhoon position and movement of rainbands from the landfall typhoon greatly affected the spatial distribution of typhoon precipitation, the performance of the WRF model for simulating the rainband characteristics was further examined. Figures 5A–C show observed composite radar reflectivity during the three stages, while (D)–(F) show the corresponding simulation results when the typhoon center is located close to that of the observation. It can be seen that the shapes and locations of the simulated and observed rainbands in each stage are in good agreement. Multiple southwest–northeast-oriented rainbands affected Shandong for a long time, resulting in the extreme rain event.
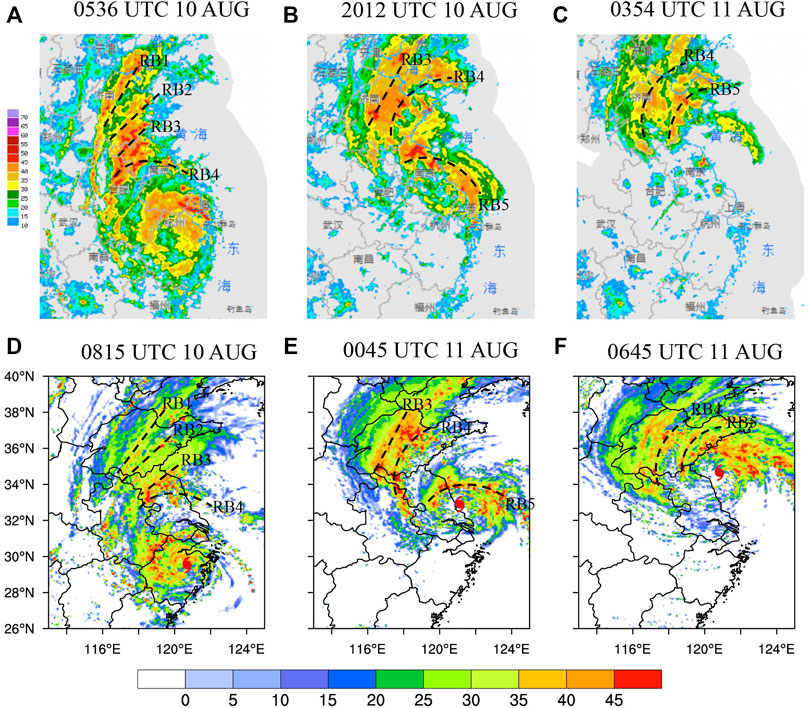
FIGURE 5. Observed (A–C) and simulated (D–F) composite radar reflectivities (unit: dBZ). Observation: (A) 0536 UTC 10 August 2019, (B) 2012 UTC 10 August 2019, (C) 0354 UTC 11 August 2019; simulation: (D) 0815 UTC 10 August 2019, (E) 0045 UTC 11 August 2019, and (F) 0645 UTC 11 August 2019. Black dashed lines denote the positions of rainbands, and typhoon symbols indicate the locations of Lekima’s center.
During stage I of the extreme rain event, Shandong Province is affected by both rainband 1 (denoted as RB1) and rainband 2 (denoted as RB2). Both rainbands are about 800 km away from the typhoon center in a southwest–northeast linear structure, with RB1 located in the north and RB2 in the south (Figures 5A, D). Rainband 3 (denoted as RB3) and rainband 4 (denoted as RB4) in the northwest of Lekima are located south of Shandong Province, which have no influence on Shandong during the stage I. As Lekima moves northward, RB1 and RB2 propagate northwestward to northern Shandong and weaken, and the extreme rain event enters stage II. Shandong is mainly affected by RB3 and RB4 that are about 600 km away from the typhoon center (Figures 5B, E). RB3 is located north of RB4. The spiral rainband 5 (denoted as RB5), about 200 km north of the typhoon center, has not influenced Shandong Province during stage II. But as Lekima moves further north, RB3 and RB4 propagate to the northwest, and RB5 starts to affect central Shandong, entering stage III of the extreme rain event (Figures 5C, F). Along with the movement of Lekima into mid-latitudes, the structure of RB5 dissipates gradually.
The aforementioned analysis shows that the WRF simulation was a good reproduction of the track, intensity change of Typhoon Lekima, and the impacts on the Shandong Province when the typhoon propagated northward. The location of the precipitation center, evolution of rainfall, and distribution of main rainbands have all been reasonably reproduced. Thus, the simulation can be used to obtain detailed diagnostics to understand the multi-scale characteristics of this extreme rain event in Shandong produced by the northward-moving Typhoon Lekima. The large-scale environment and mesoscale systems contributed to the extreme rain event, which will be analyzed in subsequent sections.
As can be seen in the previous section, Typhoon Lekima moves northward along the coastline after landfall. The typhoon intensity does not decay significantly when influencing Shandong and the minimum central sea level pressure is maintained at about 980 hPa. In this section, from the perspective of a large-scale environment, the main systems that influence the typhoon’s track and intensity and favorable conditions for the extreme rain event at each stage are analyzed.
The extreme rain event in Shandong Province occurred under a favorable configuration of synoptic systems, which are stable through the event and provide persistent impacts. The analyses here use the D01 simulation.
At the upper-level of 200 hPa (Figures 6A, B), there is an upper-tropospheric westerly jet of wind speed over 30 m/s, intensified to over 60 m/s at 0300 UTC 11 August 2019. It gradually evolves from north–south to east–west orientation, with a tendency of northward propagation. There are divergences of non-geostrophic winds in the equatorward entrance region of the upper-tropospheric jet. Lekima is located in the equatorward entrance region of the upper-tropospheric jet during the extreme rain event, and the anti-cyclonic divergent wind field at the upper-level over Lekima prohibits its fast decay. On the other hand, upper-tropospheric southerly outflows from Lekima extend poleward to enhance the southwesterly upper-tropospheric jet in front of the trough.
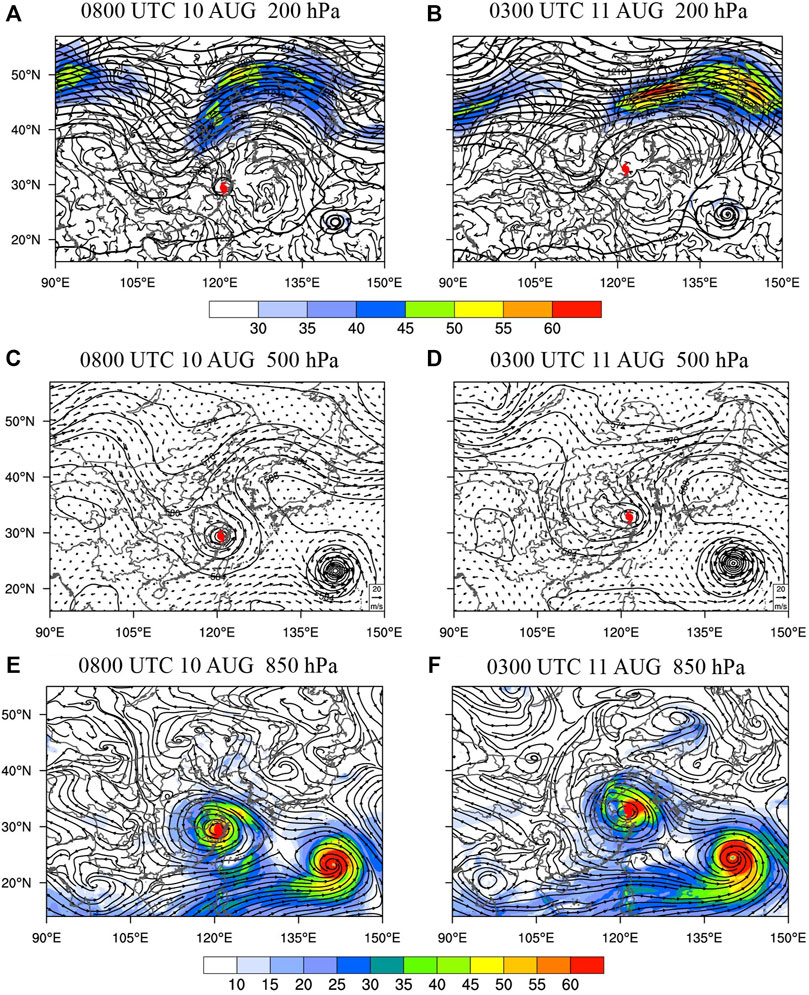
FIGURE 6. For 0800 UTC 10 August 2019, (A) the 200-hPa geopotential height (contours; unit: dagpm), horizontal wind speed (shaded; unit: m/s), and horizontal non-geostrophic winds (streamlines); (C) the 500-hPa geopotential height (contours; unit: dagpm) and horizontal winds (vectors, unit vector represents 20 m/s); and (E) the 850-hPa horizontal winds (streamlines) and horizontal water vapor flux (shaded; unit: kg/(hPa·m·s)) from the D01 simulation. (B), (D), (F) as in (A), (C), (E), but at 0300 UTC 11 August. Typhoon symbols indicate the locations of Lekima’s center.
At the mid-level of 500 hPa (Figures 6C, D), the large-scale environment in eastern Asia is characterized by two ridges and one trough. The mid-latitude westerly trough is located in northern China, the western ridge is located over the Tibetan Plateau, and the eastern ridge is located over the Korean Peninsula, superimposed on the WPSH. There is another typhoon, Typhoon Krosa, at Lekima’s southeast. It tends to push the WPSH northward and eastward and limits the strength of the WPSH. Steered by southerlies on the western flank of the WPSH, Lekima keeps moving northward, close to the coastline and slowly enough to influence Shandong for a long time. One of the unique features about Typhoon Lekima is its proximity to the coastline after landfall (Ding et al., 2020), which allows it to receive more water vapor from the oceans and maintain its intensity. Lekima moves into the westerly trough as it propagates northward, and the positive potential vorticity disturbance in the trough area can help Lekima maintain its intensity as well.
At the level of 850 hPa (Figures 6E, F), abundant moisture from the ocean in the East and the South China Sea is transported to Lekima by a southeasterly low-level jet between the typhoon and the WPSH and a southwesterly low-level jet in its southeast of the typhoon. The horizontal water vapor flux is over 30 kg/(hPa·m·s), which helps maintain Lekima’s intensity (Wu et al., 2015) and provides a sufficient source of water vapor for heavy rainfall. The maintenance of typhoon intensity can also sustain the southeasterly low-level jet through a pressure gradient between Lekima and the WPSH. The cyclonic circulation of Typhoon Krosa in Lekima’s southeast drains water vapor from the western North Pacific in its east and the tropical oceans in its south, and transports the water vapor to Lekima by easterlies on the southern flank of the WPSH, which enhances the southeasterly low-level jet and helps maintain typhoon intensity. Previous studies have also shown that in cases of binary typhoons, the western typhoons receive warm and moist air from the eastern ones (Wang et al., 2021a).
Vertical wind shear with appropriate magnitudes could be beneficial to the maintenance of the intensity and structure of landfall typhoons and, thus, to the production of rainfall (Yang et al., 2017). There is a significant negative correlation between the typhoon intensity change and the vertical wind shear resulting from three thermodynamic effects (upper-level ventilation, mid-level ventilation, and low-level ventilation) (Wang, 2012) and dynamical effects by eddy-induced angular momentum mixing across the radius of the maximum wind (Xu and Wang, 2013). Through statistical analysis based on TCs in the western North Pacific, it is found that when the deep-layer shear (difference of the mean horizontal wind vectors within a radius of 500 km from typhoon center between 300 and 1,000 hPa) is less than 11 m/s and the low-level shear (difference between 850 and 1,000 hPa) is less than 3.5 m/s, so the typhoon does not decay easily (Wang et al., 2015). During the heavy rain event in Shandong, the deep-layer shear is basically below 11 m/s and still below 16 m/s even with an increase after 0000 UTC 11 August, led by the mid-latitude westerly trough; the low-level shear is smaller than 3 m/s (Figure 7).
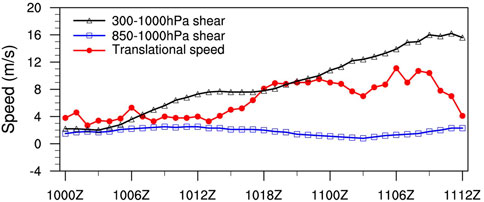
FIGURE 7. Time series of deep-layer vertical wind shear between 300 and 1,000 hPa (black line with triangles), low-level shear between 850 and 1,000 hPa (blue line with squares) within a radius of 500 km from the typhoon center, and translational speed of Lekima (red line with filled circles) from 0000 UTC 10 August to 1200 UTC 11 August, 2019, from the D02 simulation (unit: m/s).
Wang et al. (2015) also point out that when the translational speed of typhoons exceeds 12 m/s, it is detrimental to the typhoon’s intensity. This is often explained as a result of the development of a strong asymmetric structure in fast-moving storms (Uhlhorn et al., 2014). The speed of Lekima is slow and does not exceed 12 m/s during the whole process. As a result, the environmental background is favorable for Lekima to maintain its intensity after landfall without decaying rapidly.
Based on the aforementioned analysis, the WPSH is pushed northward and eastward by Typhoon Krosa in Lekima’s southeast, and Lekima moves north along the coastline, steered by southerlies on the western flank of the WPSH during the extreme rain event. The proximity to the coastline enables Lekima to receive sufficient water vapor from oceans by low-level jets.
Kinematic and thermodynamic processes and moisture are important for heavy rainfall. Considering the configuration of synoptic systems in Figure 6, the favorable conditions for the most intense precipitation center in Shandong Province are analyzed for different stages, based on the time–height series of related physical quantities averaged near the rainfall center (black solid box in Figure 2), as shown by Figure 8.
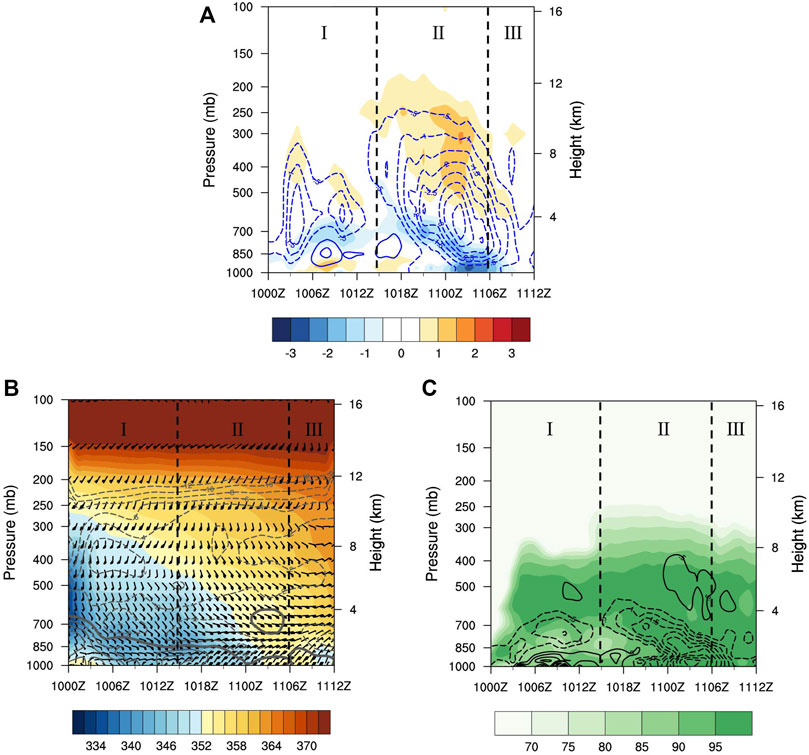
FIGURE 8. Time–height series of area-averaged (A) horizontal divergence (shaded; unit: 10−4 s−1) and vertical velocity (contours, positive values are in solid contours, negative values are in dashed contours; unit: Pa/s); (B) equivalent potential temperature (shaded; unit: K), equivalent potential temperature change with height (contours, positive values are in solid contours, negative values are in dashed contours, zero values are in bold contours; unit: 10−2 K/hPa), and horizontal winds (barbs); (C) relative humidity (shaded; unit: %) and divergence of the horizontal water vapor flux (contours, positive values are in solid contours, negative values are in dashed contours; unit: 10−4 kg/(hPa·m2·s)) over the heavy rainfall area (black solid box in Figure 2) from 0000 UTC 10 August to 1200 UTC 11 August 2019 from the D02 simulation. I, II, and III denote the three stages of the extreme rain event.
The time–height series of area-averaged horizontal divergence and vertical velocity (Figure 8A) indicates that the divergence zone in the equatorward entrance region evolves from controlling southern Shandong to the entire Shandong Province, as the upper-tropospheric jet propagates northward. The heavy rainfall area is controlled by the divergence exceeding 500 hPa with an enhanced trend due to the jet intensification, and the associated dynamical forcing for ascent flows contributes to the development of heavy rainfall. The low-level convergence and the corresponding updraft are twice enhanced at 0300 UTC 10 August and 0900 UTC 10 August 2019 during stage I, possibly affected by RB1 and RB2, respectively. The convergent layer is located between 700–500 hPa at the beginning of stage II, with weak divergence and downdraft at a low level. Low-level convergence becomes significant in the heavy rainfall area later in stage II, and the updraft reaches the maximum velocity over 4 Pa/s. During stage III, the upward motion weakens.
Figure 8B shows equivalent potential temperature and horizontal winds, and areas with solid contours denote unstable zones. Central Shandong is controlled by the mid-latitude westerly trough at the beginning of stage I, with cold and dry air located between 700–500 hPa. A potentially unstable stratification exists below 700 hPa, where equivalent potential temperature decreases with height. The cold and dry air sinks down as the southern part of the trough merges into the typhoon circulation and eventually becomes a cold pad with warm air lift-up. There is an unstable region appearing near 700 hPa later in stage II (after 1100 UTC), which is just near the strongest uplift center. The appearance of this unstable region may be due to the heat dissipation by enhanced the divergence above the ascending center. The low level of the heavy rainfall area is controlled by southeasterlies between the typhoon and the WPSH at its northeast during stage I while turning to northeasterlies during stage II, starting to be directly influenced by typhoon circulation in the northwest. Winds over the heavy rainfall area turn clockwise with height, which suggests the presence of warm advection in the troposphere when Lekima approaches. As a result, equivalent potential temperature increases with time, providing thermodynamic forcing for the ascent flows of the heavy rainfall.
Figure 8C shows relative humidity and divergence of horizontal water vapor flux. The southeasterly low-level jet on the northeast side of typhoon propagates to the north as Lekima moves northward, conveying water vapor to Shandong in the northwest. At the same time, the horizontal wind field in Lekima’s north, composed of easterlies and northerlies, facilitates the convergence of water vapor in central Shandong. Maximum relative humidity exceeds 95% during all three stages that is nearly saturated, and thus, sufficient source of water vapor is provided for heavy rainfall. A saturated layer with relative humidity above 95% is located in middle level near 600 hPa during stage I. The saturated layer becomes the thickest, in stage II, due to a thicker layer of water vapor convergence, extending from 1,000 hPa to about 400 hPa.
In conclusion, the strong pressure gradient between Lekima and the WPSH in the northeast of Lekima is caused by the maintenance of typhoon intensity. Both the strong pressure gradient and the easterly airflow transported by Typhoon Krosa contribute to the enhancement of southeasterly low-level jet on the northeast side of Lekima, which conveys large amounts of water vapor to Shandong Province. The warm advection brought to Shandong by the approaching Lekima and the dynamical forcing for ascent flows in the equatorward entrance region of upper-tropospheric jet provide favorable background conditions for the heavy rainfall as well.
Under favorable large-scale environments, the location and intensity of the heavy rainfall are mainly determined by the positions and intensities of the mesoscale systems, and the accumulated precipitation is affected by duration of the influencing mesoscale systems. According to the composite radar reflectivity in Figure 5, five mesoscale rainbands (RB1, RB2, RB3, RB4, and RB5) in the north quadrant of Lekima affect Shandong successively, which directly influence the heavy rainfall. The generation, evolution, and structure of the five main mesoscale rainbands in different stages of the extreme rain event are examined here.
Figures 9A,B zoom into the area of interest near Shandong Province and provide composite radar reflectivity during stage I of the extreme rain event. The main rainbands affecting the heavy rainfall area in stage I are RB1 and RB2, and this subsection focuses on their generation mechanisms. At the beginning of stage I, there is a convergence of westerlies in front of the westerly trough and southerlies on the western flank of the WPSH at 500 hPa, and a rainband forms in front of the trough, northwest of Shandong under favorable dynamical forcing for ascent (Figure 9A). RB1 forms in central Shandong between the rainband in front of the trough and Lekima. After Lekima propagates northward, RB2 begins to develop in the southeast of RB1, and RB1 weakens due to the cut-off of warm and moist flows from the southeast by RB2 (Figure 9B).
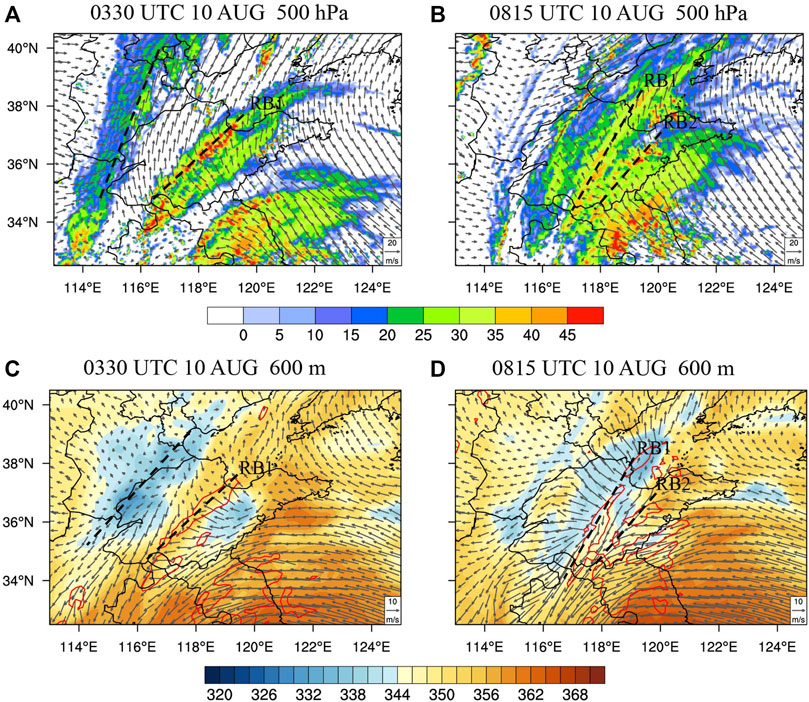
FIGURE 9. For 0330 UTC 10 August 2019, (A) composite reflectivity (shaded; unit: dBZ) and 500-hPa horizontal winds (vectors, unit vector represents 20 m/s); (C) 600-m-equivalent potential temperature (shaded; unit: K), horizontal winds (vectors, unit vector represents 10 m/s), and 32-dBZ composite reflectivity (red contours) from the D02 simulation. (B) and (D) as in (A) and (C), but at 0815 UTC 10 August. Black dashed lines indicate the positions of the rainbands.
Considering that the terrain height near Shandong Province is basically below 600 m (Figure 1B), the distribution of related physical quantities at 600 m can reflect a relatively realistic boundary layer condition. Figures 9C, D show horizontal cross-sections of equivalent potential temperature and horizontal winds at the height of 600 m at the same time as in Figures 9A, B. A southwest–northeast-oriented cold pool exists in the boundary layer beneath the rainband in front of trough, denoted by the blue-shaded area in Figure 9C. Cold pools result from the evaporation cooling of precipitation, and the penetrative downdraft transports cold and dry air from the middle troposphere into the boundary layer (Barnes and Garstang 1982). The large thermal and moisture gradients between the cold pool caused by rainbands in front of the trough and the surrounding non-precipitation areas generate divergent outflows. The cold outflows pointing to the south converge with the warm, moist southeasterlies transported northward from Lekima’s northeast, forming a boundary layer convergence line in central Shandong and contributing to the generation and intensification of linear convective rainband RB1 (denoted by red solid contours in Figure 9C). After RB1 moves northwestward, cold outflows appear in the boundary layer beneath it and converge with warm, moist southeasterlies from the south, producing another linear convective rainband RB2 parallel to RB1 in its southeast (Figure 9D). RB2 also propagates to the northwest and influences Shandong Province later.
The rainfall in Shandong during stage I can be classified as distant rainfall, affected by convective rainbands RB1 and RB2, respectively. The two convective rainbands are far from the main body of Lekima and are indirectly influenced by typhoon circulation. RB1 and RB2 are both triggered and organized by the boundary-layer convergence line that is formed from the convergence of the outflows to the south of the cold pool, while the cold pool is generated by previous precipitation in the northwest and the warm, moist southeasterlies transported northward from the northeast side of Lekima. The mechanism of the generation of convective systems, as the new rainband generated in the southeast of the old rainband, is called “Band Training.” It has also been mentioned in studies of rainfall caused by the Mei-Yu front (Luo et al., 2014; Wang et al., 2021b).
During stage II, RB1 and RB2 propagate northwestward and weaken, while RB3 and RB4 in Lekima’s northwest propagate into central Shandong successively, producing the strongest precipitation (Figure 10). RB3 is positioned at the radially outward side of Lekima with reflectivity basically below 45 dBZ, while RB4 is positioned at the radially inward side of Lekima consisting of individual convective cells with a reflectivity over 45 dBZ. RB3 and RB4 are located in areas with strong gradients of equivalent potential temperature. In order to understand their developing mechanisms, five vertical cross sections are taken along the AB direction perpendicular to the rainbands (Figures 10A, C), and the average characteristics along the five vertical profiles are studied. A (B) is on the radially inward (outward) side of Lekima in the southeast (northwest).
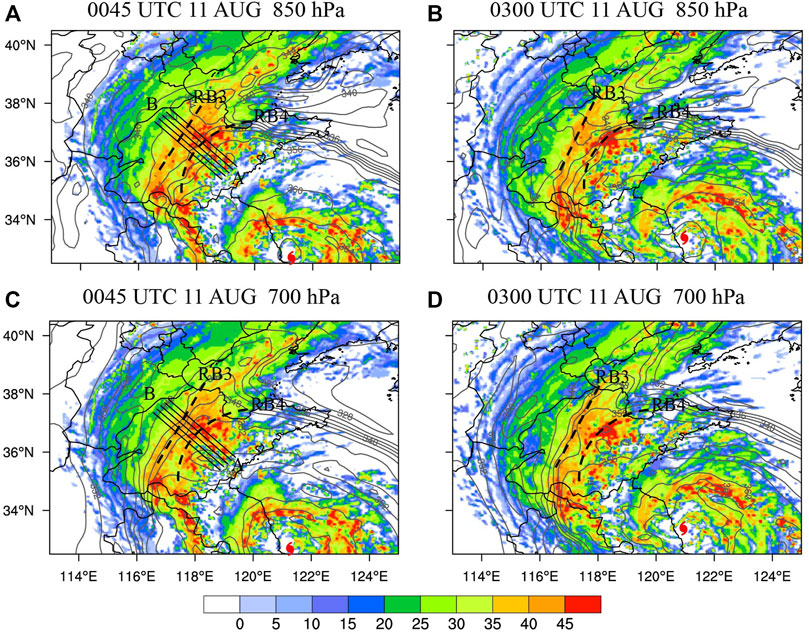
FIGURE 10. Composite reflectivity (shaded; unit: dBZ) and 850-hPa equivalent potential temperature (contours; unit: K) from the D02 simulation at (A) 0045 UTC 11 August; (B) 0300 UTC 11 August 2019. (C) and (D) as in (A) and (B) but at 700 hPa. Black solid lines indicate the positions of the vertical cross sections taken in Figure 11, black dashed lines indicate the positions of the rainbands, and typhoon symbols denote the locations of Lekima’s center.
Figure 11 shows the average of five vertical cross-sections of reflectivity, vertical velocity, equivalent potential temperature, and winds. A frontal zone tilting with height from side A to side B with a strong gradient of equivalent potential temperature can be seen in Figure 11B. The dry and cold air invades from an altitude of nearly 3 km from the “B” side and sinks afterward, while the warm and moist air lifts up from the “A” side along the front from the boundary layer. The collision of warm and cold air triggers the frontal convection systems, which is further organized into RB3 and RB4. RB3 is triggered near the level of 700 hPa, and RB4 is triggered near 850 hPa due to the different heights of the collision of warm and cold air. The reflectivity and the penetrative updraft of RB4 are stronger compared to that of RB3 (Figure 11A).
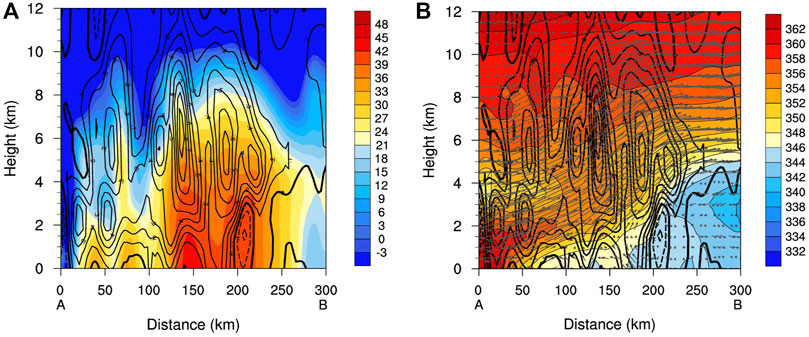
FIGURE 11. The average of five vertical cross-sections along AB in Figures 10A, C of the vertical velocity (contours with interval of .1, positive values are in solid contours, negative values are in dashed contours, zero values are in bold contours; unit: m/s) with (A) reflectivity (shaded; unit: dBZ); (B) equivalent potential temperature (shaded; unit: K) and winds (vectors) from the D02 simulation. X-axis coordinate is the horizontal distance from A (unit: km), and y-axis coordinate is the height (unit: km).
Heavy rainfall produced by a frontal zone due to the interaction between typhoon and mid-latitude systems is a unique physical process in northward-moving typhoons. How does the front in the northwest of Lekima develop? Miller (1948) proposed a frontogenesis function to quantitatively show the Lagrangian change rate of the magnitude of the horizontal equivalent potential temperature gradient in the frontal zone, which is adopted here. Following Miller (1948), the frontogenesis function (denoted as
where
There is frontogenesis with
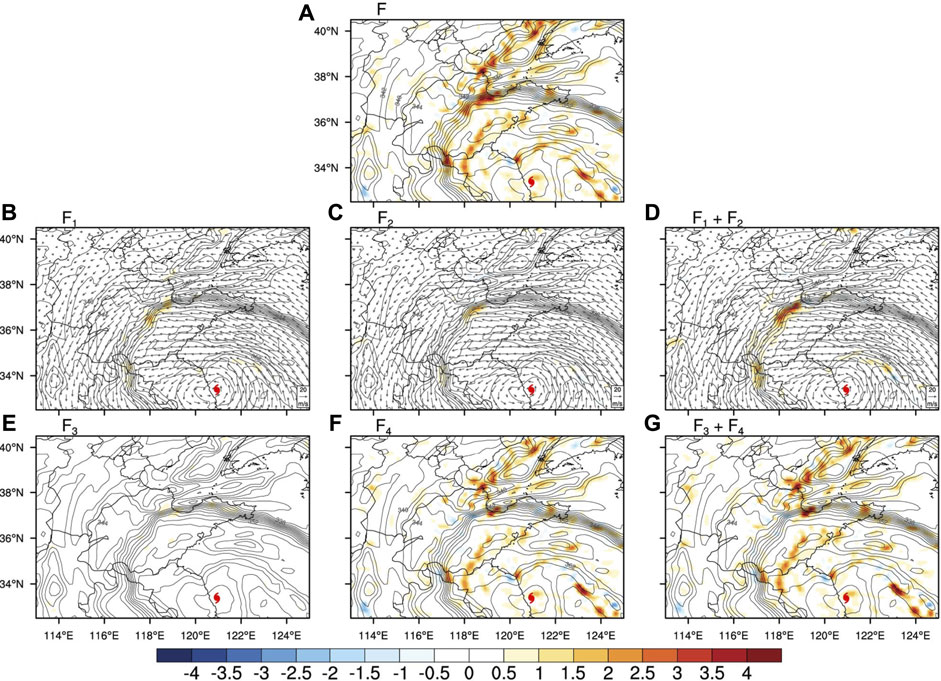
FIGURE 12. For 0300 UTC 11 August 2019, the 850-hPa equivalent potential temperature (gray contours; unit: K) with (A) frontogenesis function (
Therefore, as Lekima propagates northward, its peripheral circulation directly affects Shandong Province during stage II. The horizontal wind field in Lekima’s north, composed of southeasterlies and northeasterlies, leads to frontogenesis in the frontal zone between cold, dry continental air in the northwest and warm, moist oceanic air near the typhoon in the northwest of Lekima. The front tilts toward the northwest with height, and the frontal convective systems are organized into two convective rainbands RB3 and RB4. The heaviest precipitation occurs in Shandong under the influence of RB3 and RB4. It is worth mentioning that the extra-tropical transition of Typhoon Lekima is identified by the cyclonic phase space (CPS) method (Hart 2003) in this study, and it is found that although the baroclinicity of the precipitation area is enhanced and the frontal rainband appears at this stage, the typhoon does not appear to be in transition at this time.
As Lekima moves further north, the extreme rain event enters stage III. RB3 and RB4 continue moving toward northwest and out of the heavy rainfall area, while central Shandong is mainly controlled by RB5. RB5 is about 200 km north of the typhoon center and can be classified as the principal rainband (Houze, 2010). As a result, the precipitation during this stage is mainly due to the direct influence of the typhoon spiral rainband. Considering that Lekima has moved northward into mid-latitudes by this time and is now influenced by mid-latitude systems, how does the rainband structure change? We further analyze the vertical structure of RB5 and compare it with the typical structure of typhoon principal rainband proposed by Hence and Houze (2008).
Five radius–height cross-sections toward the typhoon center with a distance of 50 km are taken at convective cells embedded in RB5 with composite reflectivity greater than 40 dBZ (Figure 13A). A (B) denotes the radially inward (outward) side of Lekima. Figures 13B–E show the averaged radius–height cross-sections of reflectivity, vertical velocity, horizontal divergence, radial velocity, and tangential velocity.
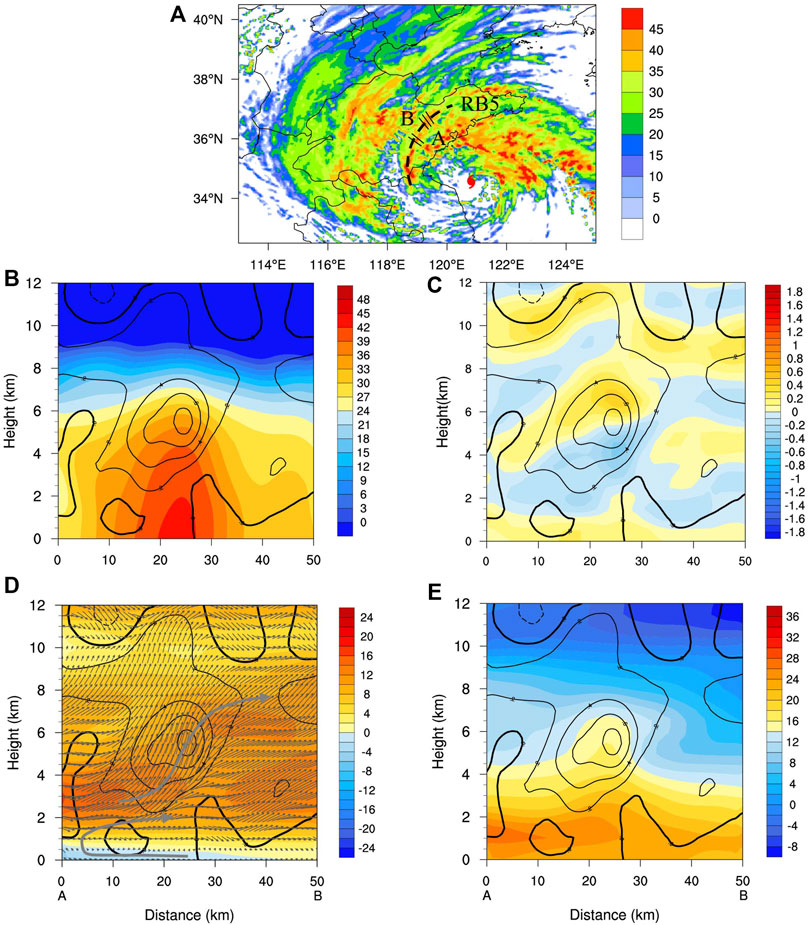
FIGURE 13. (A) Composite reflectivity (shaded; unit: dBZ) at 0645 UTC 11 August 2019; the black dashed line indicates the position of the rainband, the typhoon symbol denotes the location of Lekima’s center, and black solid lines indicate the positions of radius–height cross-sections taken in (B–E). The average of five radius–height cross-sections of vertical velocity (contours with interval of .2, positive values are in solid contours, negative values are in dashed contours, zero values are in bold contours; unit: m/s) with (B) reflectivity (shaded; unit: dBZ); (C) horizontal divergence (shading; 10−3 s−1); (D) radial velocity (shaded; unit: m/s) and winds (vectors); and (E) tangential velocity (shaded; unit: m/s) from D02 simulation, x-axis coordinate is the horizontal distance from A (unit: km), and y-axis coordinate is the height (unit: km).
Convective cells in RB5 slightly tilt radially outward (the side of B) with height (Figure 13B). The vertical circulation of RB5 is characterized by a low-level overturning flow and a middle-level rising radial outflow from the side of typhoon center and lifted near the convective cell (Figure 13D). The radial inflow is located only below 1 km and turns upward near the side of A, while the radial outflow layer is above 1 km. A strong outflow from the side of A exists between the height of 2–4 km and leads to the convergence center in Figure 13C, blocked by the convective cell developing upward. In conjunction with the convergence, upward motions occur above 1.5 km near the convection center with the maximum near z = 6 km, while the layer below 1.5 km is dominated by weak subsidence due to divergence. According to tangential velocity (Figure 13E), there is a secondary horizontal wind maximum (SHWM) with the maximum wind speed over 26 m/s near z = 1.5 km. In comparison with the structure of the principal rainband of Hence and Houze (2008) (their Figure 13), RB5 shows similar characteristics of radial inflow in the lower level, rising radial outflow in the upper level, and the presence of SHWM near the top of boundary layer. However, here, the height of SHWM and radial inflow is lower in RB5, and weak subsidence exists at a low level.
Thus, as Lekima moves further north, rainfall in Shandong is directly produced by the spiral rainband RB5 during stage III. Lekima has moved into mid-latitudes by this time, experiencing structural changes. As a result, the kinematic structure of RB5 differs from that of a typical typhoon’s principal rainband in terms of vertical flow fields and height of the radial inflow and SHWM.
The mechanisms and forecasts of landfalling typhoon precipitation are challenging scientific problems. Lekima, the ninth typhoon in the western North Pacific in 2019, is the fifth strongest super typhoon to make landfall in mainland China since 1949. Lekima moved northward after a landfall, resulting in an extreme rain event in Shandong Province from 0000 UTC 10 August to 1200 UTC 11 August 2019, with maximum accumulated precipitation in central Shandong exceeding 400 mm, becoming the process with highest precipitation since meteorological records were kept in Shandong. This extreme rain event is a typical process under the interaction of mid-latitude systems and typhoon circulation. This study uses the mesoscale numerical WRF model (version 4.2) with two fixed grids at 12- and 2.4-km horizontal spacing for simulation, which was a good reproduction of the track, intensity of Typhoon Lekima, distribution of the main rainbands, and the spatio-temporal evolution of rainfall in Shandong. On this basis, we use the simulation to explore multi-scale characteristics of this extreme rain event in terms of favorable large-scale environments and mesoscale rainbands.
Synoptic systems in middle and low latitudes are stable during the process. The main system at the upper level is an upper-tropospheric westerly jet with wind speeds over 30 m/s. At the middle level, other than the WPSH, there exists a mid-latitude westerly trough, and Shandong is located in front of the trough. A southeasterly low-level jet and a southwesterly low-level jet can be seen at the low level. In addition, there is another Typhoon Krosa in the western North Pacific in Lekima’s southeast. In the aforementioned background, Lekima maintains its intensity for a long time after landfall. The relatively slow translation speed and weak vertical wind shear can also help Lekima maintain its intensity. Under the influence of the large-scale environmental field formed by the typhoon and the westerly trough system, it provides favorable dynamic, thermal, and water vapor conditions for the heavy precipitation area.
During the torrential rainfall, five mesoscale rainbands in Lekima’s north affect Shandong successively, which directly influence the heavy rainfall. Considering the evolution of precipitation and mesoscale rainbands, the extreme rain event in Shandong can be divided into three stages. Stage I can be classified as distant rainfall, and two linear convective rainbands affect Shandong successively, both of which are triggered by the boundary-layer convergence line. The boundary-layer convergence line is formed by the interaction between the cold pool outflow caused by the precipitation of the westerly trough and the warm and humid airflow transported by the typhoon. The precipitation in stage II is the strongest. There exists a frontal zone in central Shandong between warm, moist air carried by Lekima and cold, dry air behind the trough in the northwest. The front tilts toward the northwest with height, and warm, moist air transported by southeasterly low-level jet on the southeast side is lifted up along the front to form precipitation. According to the frontogenesis function, deformation and convergence in the horizontal wind field, composed of southeasterlies and northeasterlies in Lekima’s north, plays a crucial role in frontogenesis. During stage III, Shandong is directly influenced by the principal rainband. However, this rainband shows a kinematic structure different from that of a typical typhoon principal rainband due to Lekima’s structural change and weaker typhoon intensity after moving into mid-latitudes.
The precipitation of landfalling typhoon is affected by multiple physical processes, multi-scale systems, and is related to the internal processes in the typhoon, the interaction between typhoon and the environment, and the underlying surface. This research discusses the influences of the environment and typhoon rainband on heavy rainfall in Shandong after Lekima’s landfall. Considering that the precipitation center is located in the mountainous area of central Shandong, we have also conducted a numerical experiment exploring the effects of mountainous terrains on the intensity and spatial distribution of this extreme rain event in Shandong Province. The results show that the topography in central Shandong mainly affects the location of the precipitation center, while the impact on precipitation intensity is not significant, which is not discussed in this paper due to the limitation of pages. The internal dynamic processes in a typhoon play important roles in the propagation and development of typhoon rainbands, but the influence of internal dynamical processes such as vortex Rossby waves on the formation of rainbands is not considered because the typhoon is far away from Shandong Province in precipitation stage I. However, during the second and third stages, how the internal dynamic processes in typhoon changes and how they influence the movement and development of rainbands when Lekima interacts with the mid-latitude systems require further study.
The raw data supporting the conclusion of this article will be made available by the authors, without undue reservation.
YZ conceptualized this study. YG executed numerical experiments, analyzed the data, and wrote the manuscript. LL gave comments on the numerical experiment. YZ, LL, and JT provided revision advice for the submitted version of the manuscript.
This work was sponsored by the National Natural Science Foundation of China under Grants 42192555, 41775057.
The authors declare that the research was conducted in the absence of any commercial or financial relationships that could be construed as a potential conflict of interest.
All claims expressed in this article are solely those of the authors and do not necessarily represent those of their affiliated organizations, or those of the publisher, the editors, and the reviewers. Any product that may be evaluated in this article, or claim that may be made by its manufacturer, is not guaranteed or endorsed by the publisher.
Baek, E. H., Lim, G. H., Kim, J. H., and Kug, J. S. (2014). Antecedent mid-tropospheric frontogenesis caused by the interaction between a tropical cyclone and midlatitude trough: A case study of typhoon Rusa (2002). Theor. Appl. Climatol. 118 (1-2), 9–24. doi:10.1007/s00704-013-1045-3
Bao, X. W., Davidson, N. E., Yu, H., Hankinson, M. C. N., Sun, Z. A., Rikus, L. J., et al. (2015). Diagnostics for an extreme rain event near Shanghai during the landfall of typhoon Fitow (2013). Mon. Wea. Rev. 143 (9), 3377–3405. doi:10.1175/MWR-D-14-00241.1
Barnes, G. M., and Garstang, M. (1982). Subcloud layer energetics of precipitating convection. Mon. Wea. Rev. 110 (2), 102–117. doi:10.1175/1520-0493(1982)110<0102:sleopc>2.0.co;2
Bosart, L. F., Cordeira, J. M., Galarneau, T. J., Moore, B. J., and Archambault, H. M. (2012). An analysis of multiple predecessor rain events ahead of tropical cyclones ike and lowell: 10-15 september 2008. Mon. Wea. Rev. 140 (4), 1081–1107. doi:10.1175/MWR-D-11-00163.1
Byun, K. Y., and Lee, T. Y. (2012). Remote effects of tropical cyclones on heavy rainfall over the Korean Peninsula - statistical and composite analysis. Tellus A Dyn. Meteorol. Oceanogr. 64, 14983. doi:10.3402/tellusa.v64i0.14983
Chen, F., and Dudhia, J. (2001). Coupling an advanced land surface–hydrology model with the penn state–ncar Mm5 modeling system. Part I: Model implementation and sensitivity. Mon. Wea. Rev. 1292 (4), 569–585. doi:10.1175/1520-0493(2001)129<0569:caalsh>2.0.co;2
Chen, J. M., Li, T., and Shih, C. F. (2010). Tropical cyclone- and monsoon-induced rainfall variability in taiwan. J. Clim. 23 (15), 4107–4120. doi:10.1175/2010JCLI3355.1
Chen, S. Y. S., Knaff, J. A., and Marks, F. D. (2006). Effects of vertical wind shear and storm motion on tropical cyclone rainfall asymmetries deduced from trmm. Mon. Wea. Rev. 134 (11), 3190–3208. doi:10.1175/MWR3245.1
Colle, B. A. (2003). Numerical simulations of the extratropical transition of floyd (1999): Structural evolution and responsible mechanisms for the heavy rainfall over the northeast United States. Mon. Wea. Rev. 131 (12), 2905–2926. doi:10.1175/1520-0493(2003)131<2905:nsotet>2.0.co;2
Corbosiero, K. L., and Molinari, J. (2003). The relationship between storm motion, vertical wind shear, and convective asymmetries in tropical cyclones. J. Atmos. Sci. 602 (2), 366–376. doi:10.1175/1520-0469(2003)060<0366:trbsmv>2.0.co;2
Ding, Y. F., Liu, J. P., Chen, S. Z., Cheng, X., and Zheng, Z. J. (2020). Uniqueness of Lekima compared to tropical cyclones landed in the East coast of China during 1979-2019. Acta Oceanol. Sin. 39 (8), 121–124. doi:10.1007/s13131-020-1639-4
Emanuel, K. A. (2013). Downscaling Cmip5 climate models shows increased tropical cyclone activity over the 21st century. Proc. Natl. Acad. Sci. 110(30), 12219–12224. doi:10.1073/pnas.1301293110
Galarneau, T. J., Bosart, L. F., and Schumacher, R. S. (2010). Predecessor rain events ahead of tropical cyclones. Mon. Wea. Rev. 138 (8), 3272–3297. doi:10.1175/2010mwr3243.1
Gao, S., Meng, Z., Zhang, F., and Bosart, L. F. (2009). Observational analysis of heavy rainfall mechanisms associated with severe tropical storm bilis (2006) after its landfall. Mon. Wea. Rev. 137 (6), 1881–1897. doi:10.1175/2008mwr2669.1
Guo, Y.-P., and Tan, Z.-M. (2022). Influence of track change on the inconsistent poleward migration of typhoon activity. J. Geophys. Res. Atmos. 127, e2022JD036640. doi:10.1029/2022JD036640
Han, Y., and Wu, R. S. (2008). The effect of cold air intrusion on the development of tropical cyclone. Chin. J. Geophys. 51 (5), 931–943. (in Chinese). doi:10.1002/cjg2.1288
Hanley, D., Molinari, J., and Keyser, D. (2001). A composite study of the interactions between tropical cyclones and upper-tropospheric troughs. Mon. Wea. Rev. 1292 (10), 2570–2584. doi:10.1175/1520-0493(2001)129<2570:acsoti>2.0.co;2
Hart, R. E. (2003). A cyclone phase space derived from thermal wind and thermal asymmetry. Mon. Wea. Rev. 131 (4), 585–616. doi:10.1175/1520-0493(2003)131<0585:acpsdf>2.0.co;2
He, L., Chen, S., and Guo, Y. (2020). Observation characteristics and synoptic mechanisms of typhoon Lekima extreme rainfall in 2019. J. Appl. Meteorol. Sci. 31 (5), 513–526.
Hence, D. A., and Houze, R. A. (2008). Kinematic structure of convective-scale elements in the rainbands of hurricanes katrina and rita (2005). J. Geophys. Res. 113 (D15), D15108. doi:10.1029/2007JD009429
Hong, S. Y., and Lim, J. O. J. (2006). The wrf single-moment 6-class microphysics scheme (Wsm6). Asia-Pac. J. Atmos. Sci. 42.
Hong, S. Y., Noh, Y., and Dudhia, J. (2006). A new vertical diffusion package with an explicit treatment of entrainment processes. Mon. Wea. Rev. 134 (9), 2318–2341. doi:10.1175/MWR3199.1
Houze, R. A. (2010). Clouds in tropical cyclones. Mon. Wea. Rev. 138 (2), 293–344. doi:10.1175/2009mwr2989.1
Iacono, M. J., Delamere, J. S., Mlawer, E. J., Shephard, M. W., Clough, S. A., and Collins, W. D. (2008). Radiative forcing by long-lived greenhouse gases: Calculations with the aer radiative transfer models. J. Geophys. Res. 113 (D13), D13103. doi:10.1029/2008JD009944
Jonkman, S. N., Maaskant, B., Boyd, E., and Levitan, M. L. (2009). Loss of life caused by the flooding of new orleans after hurricane katrina: Analysis of the relationship between flood characteristics and mortality. Risk Anal. 29 (5), 676–698. doi:10.1111/j.1539-6924.2008.01190.x
Kain, J. S. (2004). The kain-fritsch convective parameterization: An update. J. Appl. Meteorol. 43 (1), 170–181. doi:10.1175/1520-0450(2004)043<0170:tkcpau>2.0.co;2
Klein, P. M., Harr, P. A., and Elsberry, R. L. (2000). Extratropical transition of Western north pacific tropical cyclones: An overview and conceptual model of the transformation stage. Wea. Forecast 15 (4), 373–395. doi:10.1175/1520-0434(2000)015<0373:etownp>2.0.co;2
Knutson, T. R., McBride, J. L., Chan, J., Emanuel, K., Holland, G., Landsea, C., et al. (2010). Tropical cyclones and climate change. Nat. Geosci. 3 (3), 157–163. doi:10.1038/ngeo779
Kossin, J. P., Emanuel, K. A., and Vecchi, G. A. (2014). The poleward migration of the location of tropical cyclone maximum intensity. Nat. 509(7500), 349-352, doi:10.1038/nature13278
Lee, M. H., Ho, C. H., and Kim, J. H. (2010). Influence of tropical cyclone landfalls on spatiotemporal variations in typhoon season rainfall over south China. Adv. Atmos. Sci. 27 (2), 443–454. doi:10.1007/s00376-009-9106-3
Leroux, M.-D., Plu, M., and Roux, F. (2016). On the sensitivity of tropical cyclone intensification under upper-level trough forcing. Mon. Wea. Rev. 144 (3), 1179–1202. doi:10.1175/mwr-d-15-0224.1
Li, Q. Q., and Wang, Y. Q. (2012). A comparison of inner and outer spiral rainbands in a numerically simulated tropical cyclone. Mon. Wea. Rev. 140 (9), 2782–2805. doi:10.1175/MWR-D-11-00237.1
Li, R. C. Y., and Zhou, W. (2015). Interdecadal changes in summertime tropical cyclone precipitation over southeast China during 1960-2009. J. Clim. 28 (4), 1494–1509. doi:10.1175/JCLI-D-14-00246.1
Lin, Y.-L., Ensley, D. B., Chiao, S., and Huang, C.-Y. (2002). Orographic influences on rainfall and track deflection associated with the passage of a tropical cyclone. Mon. Wea. Rev. 1302 (12), 2929–2950. doi:10.1175/1520-0493(2002)130<2929:oiorat>2.0.co;2
Luo, Y. L., Gong, Y., and Zhang, D. L. (2014). Initiation and organizational modes of an extreme-rain-producing mesoscale convective system along a mei-yu front in east China. Mon. Wea. Rev. 142 (1), 203–221. doi:10.1175/MWR-D-13-00111.1
Ma, L. M., and Tan, Z. M. (2009). Improving the behavior of the cumulus parameterization for tropical cyclone prediction: Convection trigger. Atmos. Res. 92 (2), 190–211. doi:10.1016/j.atmosres.2008.09.022
Meng, Z. Y., Chen, L. S., and Xu, X. D. (2002). Recent progress on tropical cyclone research in China. Adv. Atmos. Sci. 19 (1), 103–110. doi:10.1007/s00376-002-0037-5
Miller, J. E. (1948). On the concept of frontogenesis. J. Meteor. 5 (4), 169–171. doi:10.1175/1520-0469(1948)005<0169:otcof>2.0.co;2
Moore, B. J., Bosart, L. F., Keyser, D., and Jurewicz, M. L. (2013). Synoptic-scale environments of predecessor rain events occurring east of the rocky mountains in association with atlantic basin tropical cyclones. Mon. Wea. Rev. 141 (3), 1022–1047. doi:10.1175/mwr-d-12-00178.1
Novak, D. R., Bosart, L. F., Keyser, D., and Waldstreicher, J. S. (2004). An observational study of cold season-banded precipitation in northeast us cyclones. Wea. Forecast 19 (6), 993–1010. doi:10.1175/815.1
Peduzzi, P., Chatenoux, B., Dao, H., De Bono, A., Herold, C., Kossin, J., et al. (2012). Global trends in tropical cyclone risk. Nat. Clim. Change 2 (4), 289–294. doi:10.1038/NCLIMATE1410
Ritchie, E. A., and Elsberry, R. L. (2007). Simulations of the extratropical transition of tropical cyclones: Phasing between the upper-level trough and tropical cyclones. Mon. Wea. Rev. 135 (3), 862–876. doi:10.1175/mwr3303.1
Schumacher, R. S., Galarneau, T. J., and Bosart, L. F. (2011). Distant effects of a recurving tropical cyclone on rainfall in a midlatitude convective system: A high-impact predecessor rain event. Mon. Wea. Rev. 139 (2), 650–667. doi:10.1175/2010MWR3453.1
Schumacher, R. S., and Galarneau, T. J. (2012). Moisture transport into midlatitudes ahead of recurving tropical cyclones and its relevance in two predecessor rain events. Mon. Wea. Rev. 140 (6), 1810–1827. doi:10.1175/mwr-d-11-00307.1
Skamarock, W. C., Klemp, J. B., Dudhia, J., Gill, D. O., Liu, Z., Berner, J., et al. (2019). A description of the advanced research WRF model version 4. Boulder, CO: NCAR.
Studholme, J., Fedorov, A. V., Gulev, S. K., Emanuel, K., and Hodges, K. (2022). Poleward expansion of tropical cyclone latitudes in warming climates. Nat. Geosci. 15(1), 14-28, doi:10.1038/s41561-021-00859-1
Studholme, J., and Gulev, S. (2018). Concurrent changes to hadley circulation and the meridional distribution of tropical cyclones. J. Clim. 31 (11), 4367–4389. doi:10.1175/JCLI-D-17-0852.1
Torn, R. D. (2010). Diagnosis of the downstream ridging associated with extratropical transition using short-term ensemble forecasts. J. Atmos. Sci. 67 (3), 817–833. doi:10.1175/2009jas3093.1
Uhlhorn, E. W., Klotz, B. W., Vukicevic, T., Reasor, P. D., and Rogers, R. F. (2014). Observed hurricane wind speed asymmetries and relationships to motion and environmental shear. Mon. Wea. Rev. 142, 1290–1311. doi:10.1175/MWR-D-13-00249.1
Wang, M. Y., Ren, F. M., Xie, Y. J., Li, G. P., Yang, M. J., and Feng, T. (2021a). Characteristics and causes of extreme rainfall induced by binary tropical cyclones over China. Asia-Pac. J. Atmos. Sci. 57 (2), 311–320. doi:10.1007/s13143-020-00201-6
Wang, Q. W., Zhang, Y., Zhu, K. F., Tan, Z. M., and Xue, M. (2021b). A case study of the initiation of parallel convective lines back-building from the South side of a mei-yu front over complex terrain. Adv. Atmos. Sci. 38 (5), 717–736. doi:10.1007/s00376-020-0216-2
Wang, Y. Q. (2008). Rapid filamentation zone in a numerically simulated tropical cyclone. J. Atmos. Sci. 65 (4), 1158–1181. doi:10.1175/2007JAS2426.1
Wang, Y. Q., Wang, Y. Q., and Fudeyasu, H. (2009). The role of typhoon songda (2004) in producing distantly located heavy rainfall in Japan. Mon. Wea. Rev. 137 (11), 3699–3716. doi:10.1175/2009MWR2933.1
Wang, Y., Rao, Y., Tan, Z.-M., and Schönemann, D. (2015). A statistical analysis of the effects of vertical wind shear on tropical cyclone intensity change over the Western north pacific. Mon. Wea. Rev. 143 (9), 3434–3453. doi:10.1175/mwr-d-15-0049.1
Wang, Y. (2012). Recent research progress on tropical cyclone structure and intensity. Trop. Cyclone Res. Rev. 1, 254–275. doi:10.6057/2012TCRR02.05
Willoughby, H. E., Marks, F. D., and Feinberg, R. J. (1984). Stationary and moving convective bands in hurricanes. J. Atmos. Sci. 41 (22), 3189–3211. doi:10.1175/1520-0469(1984)041<3189:samcbi>2.0.co;2
Wu, C.-C., Yen, T.-H., Kuo, Y.-H., and Wang, W. (2002). Rainfall simulation associated with typhoon herb (1996) near taiwan. Part I: The topographic effect. Wea. Forecast 17 (5), 1001–1015. doi:10.1175/1520-0434(2003)017<1001:rsawth>2.0.co;2
Wu, L., Su, H., Fovell, R. G., Dunkerton, T. J., Wang, Z., and Kahn, B. H. (2015). Impact of environmental moisture on tropical cyclone intensification. Atmos. Chem. Phys. 15 (24), 14041–14053. doi:10.5194/acp-15-14041-2015
Xu, Y.-M., and Wang, Y. (2013). On the initial development of asymmetric vertical motion and horizontal relative flow in a mature tropical cyclone embedded in environmental vertical shear. J. Atmos. Sci. 70, 3471–3491. doi:10.1175/JAS-D-12-0335.1
Yang, L., Liu, M. F., Smith, J. A., and Tian, F. Q. (2017). Typhoon Nina and the August 1975 flood over central China. J. Hydrometeorol. 18 (2), 451–472. doi:10.1175/JHM-D-16-0152.1
Yang, M.-J., Zhang, D.-L., and Huang, H.-L. (2008). A modeling study of typhoon nari (2001) at landfall. Part I: Topographic effects. J. Atmos. Sci. 65 (10), 3095–3115. doi:10.1175/2008jas2453.1
Ying, M., Zhang, W., Yu, H., Lu, X. Q., Feng, J. X., Fan, Y. X., et al. (2014). An overview of the China meteorological administration tropical cyclone database. J. Atmos. Ocean. Technol. 31 (2), 287–301. doi:10.1175/JTECH-D-12-00119.1
Yu, J., Gao, S., Zhang, L., Shen, X., and Guo, L. (2020). Analysis of a remote rainstorm in the yangtze river delta region caused by typhoon mangkhut (2018). J. Mar. Sci. Eng. 8 (5), 345. doi:10.3390/jmse8050345
Zhang, J. Y., Wu, L. G., Ren, F. M., and Cui, X. P. (2013). Changes in tropical cyclone rainfall in China. J. Meteorol. Soc. Jpn. 91 (5), 585–595. doi:10.2151/jmsj.2013-502
Zhang, Q. A., Wu, L. G., and Liu, Q. F. (2009). Tropical cyclone damages in China 1983-2006. Bull. Am. Meteorol. Soc. 90(4), 489-496, doi:10.1175/2008BAMS2631.1
Keywords: Typhoon Lekima, heavy rainfall, frontogenesis, rainband, convergence line
Citation: Gao Y, Zhang Y, Lei L and Tang J (2023) Multi-scale characteristics of an extreme rain event in Shandong Province, produced by Typhoon Lekima (2019). Front. Earth Sci. 10:1093545. doi: 10.3389/feart.2022.1093545
Received: 09 November 2022; Accepted: 30 December 2022;
Published: 12 January 2023.
Edited by:
Yuqing Wang, University of Hawaii at Manoa, United StatesReviewed by:
Jianqi Sun, Institute of Atmospheric Physics (CAS), ChinaCopyright © 2023 Gao, Zhang, Lei and Tang. This is an open-access article distributed under the terms of the Creative Commons Attribution License (CC BY). The use, distribution or reproduction in other forums is permitted, provided the original author(s) and the copyright owner(s) are credited and that the original publication in this journal is cited, in accordance with accepted academic practice. No use, distribution or reproduction is permitted which does not comply with these terms.
*Correspondence: Yi Zhang, eWl6aGFuZ0BuanUuZWR1LmNu
Disclaimer: All claims expressed in this article are solely those of the authors and do not necessarily represent those of their affiliated organizations, or those of the publisher, the editors and the reviewers. Any product that may be evaluated in this article or claim that may be made by its manufacturer is not guaranteed or endorsed by the publisher.
Research integrity at Frontiers
Learn more about the work of our research integrity team to safeguard the quality of each article we publish.