 Yingming Yang1,2
 Zhibo Ma
- 1State Key Laboratory of Water Resource Protection and Utilization in Coal Mining, Beijing, China
- 2National Energy Investment Group Co., Beijing, China
- 3School of Mechanics and Civil Engineering, China University of Mining and Technology, Beijing, China
- 4Shendong Coal Technology Research Institute, Shendong Coal Group Co., Shenmu, China
The pattern of layered rock crack propagation in mining and geotechnical engineering directly influences the production efficient of coal mines and the safety of workers. To reveal the characteristics of crack propagation in layered rock, the three-point bending experiment and numerical investigation were carried out to study the crack propagation process of single sandstone samples, sandstone-sandstone-sandstone combined samples, and sandstone-mudstone-sandstone combined samples. Using digital speckle correlation methods and acoustic emission techniques, the crack propagation process of the specimens was examined. The results show that the main factors affecting crack propagation include rock layer strength, bedding plane strength, and the position of pre-existing fractures. The presence of the bedding plane hinders the propagation of cracks, and when the bedding plane’s strength decreases, cracks that originated from the bedding plane spread horizontally along it. The weakening of the intermediate rock layer strength of the combined samples can lead to the initiation of microcracks within it earlier than macroscopic cracks, allowing many options for the initiation and propagation of following cracks. Meanwhile, the load-time curves of the combined samples during the experiment displays a double-peak characteristic. Furthermore, the presence of pre-existing fractures inside the layered rock might result in the unpredictability of the crack starting point and subsequently influence the crack propagation course.
1 Introduction
The crack propagation of rock is an essential factor affecting the stability of rock formations. With the advancement of mining engineering and geotechnical engineering, both the maintenance of deep mining roadways and the excavation of tunnels are strongly tied to the initiation and propagation path of cracks within the rock (Gao et al., 2004; Tien et al., 2006; Shang et al., 2016; Li et al., 2020). The fracture pattern of layered rocks in shale gas extraction directly determines the efficient exploitation of energy (Zhu et al., 2018; Zhu et al., 2019; Zhu et al., 2020). Layered rock is composed of two or more different rock layers, which is often found in the excavation sections of roadways and tunnels. The most typical layered rock is the composite roof in coal mine, and it is called composite stratum in tunnel engineering (Liu et al., 2013; Cheng et al., 2016). The mechanical properties of rock layer in composite roof are different, which generally exhibit a layered distribution of weak interlayers with relatively low interlayer thickness and bonding (Su et al., 2011; Jiang et al., 2014). Similar to the single-layered rock, there are also many microcracks and joints in the layered rock. Therefore, it is of great significance to study the crack propagation in layered rock.
Numerous laboratory investigations have been carried out on the propagation of cracks at the bedding plane. Saiang et al. (Saiang et al., 2005) investigated the relationship between the shear strength of the cemented concrete rock joints and the bond strength at the bond interface by direct shear tests. Li et al. (2006) conducted a laboratory investigation to study the crack initiation and propagation in layered rock mass. Yu et al. (2009) carried out similar tests under uniaxial compression and found that the damage of horizontally layered rocks is strongly related to the bond strength between the layers, and the higher the bond strength, the more similar the form of damage to that of single rock. Cho et al. (2012) investigated the relationship between its strength and bedded plane by uniaxial compression and Brazilian cleavage tests of shales at different angles. Jiang et al. (2012) study the influence of mudstone interlayer on the mechanical properties of bedded salt rocks by uniaxial and triaxial compression experiments. Wasantha et al. (2014) investigated the mechanical behavior and damage modes of bedded-sandstone with bedding layers in different orientations, under uniaxial compression. Masri et al. (2014) investigated the strength and deformation properties of shale under different laminae orientation, temperature, and surrounding pressure. Zhou et al. (2016) conducted three-point bending tests on single-layered limestone specimens and bedded specimens with weak planes to analyze the crack propagation paths in layered rock and proposed 3 modes of crack propagation. Morgan and Einstein (2017) conducted a series of unconfined compression tests on shales containing natural bedding planes and found that cracks at the ends of joints usually propagation along the bedding plane. Wang et al. (2019) investigated the crack propagation behaviors of artificially layered rocks containing variable dip bedding planes and single structural flaws in uniaxial compression, and found that bedding planes play a decisive role in crack propagation.
Besides, the researchers also used several advanced macro and micro test methods were used to further study crack propagation behaviors. Peng et al. (2011) investigated the crack propagation pattern of bedded salt rock by using a scanning electron microscope (SEM) experimental system with real-time observation. Yang et al. (2011) examined the relationship between the real-time crack propagation process and the axial stress-strain behavior of brittle sandstone containing three fissures by using photographic monitoring techniques. Ishida et al. (2010) used acoustic emission technique to study crack cracking during direct shearing of rocks, and the results showed that acoustic emission has a high accuracy to detect crack development during direct shearing. Dai et al. (2014) used digital image correlation methods to measure the crack propagation process in stratified rock specimens and found that interfacial failure and slip could arrest the crack propagation. Zuo et al. (2016) conducted a triaxial compression experiment on coal-rock assemblages, and the computed tomography (CT) was used to identify the internal crack propagation of rocks.
Numerous academics used numerical calculations to continue studying the process of rock crack propagation (Chang et al., 2015; Yin et al., 2015; Guo et al., 2017; Yin and Meng, 2018; Han et al., 2019). However, it is still unknown how the bedding plane affects the way that layered rock cracks spread. This study examined the properties of crack propagation in layered rock using experimental and numerical methods. In the meantime, AE and a high-speed camera were utilized in this investigation to examine the crack growth process. Moreover, the effect of the pre-existing fractures on crack propagation process in layered rock was discussed.
2 Materials and methods
2.1 Experimental process
In this study, the sandstone and mudstone samples were sourced from Dianping Mine in Lvliang City, Shanxi Province, China. All samples were cored from the same intact block without obvious cracks. In the three-point bend experiment, the rectangular samples of 200 mm (length), 50 mm (width), and 30 mm (height) were prepared (ASTM, 1984). In order to maximize the natural state of the bedding plane, the sandstone and mudstone surfaces were bonded with the binder, respectively (Figure 1A). The samples were then covered with a flat iron block and left in a dry atmosphere for 48 h so that the binder could fully harden.
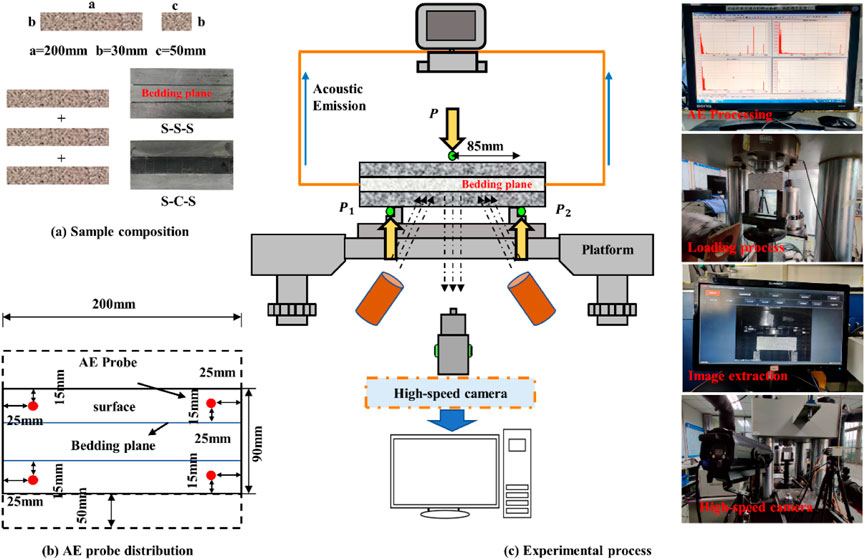
FIGURE 1. Three-point bending test process for layered rock combined body. (A) Sample composition. (B) AE probe distribution. (C) Experimental process.
As shown in Table 1, the samples were divided into control group and experimental group, “S-S-S” represents the sandstone-sandstone-sandstone combined sample, “S-M-S” represents the sandstone-mudstone-sandstone combined sample. The loading rate of 0.5 mm/min was adopted in the three-point bending experiment. The AE probe were attached to the samples at the preset positions, as shown in Figure 1B. The AE hardware was set up with a pre-amplification of 40 dB, sampling rate of 3 MHz, sample length of 3 k and a bandpass filtration of 20–400 kHz. To avoid ambient noise, the threshold is set to be 45 dB. The AEWin software with a hit-based mode is used for acquisition of the AE parameters where the PDT (peak definition time) = 300 µs, HDT (hitdefinition time) = 800 μs and HLT (hit lockout time) = 1,000 µs (Zhang and Zhou, 2020a; Zhang and Zhou, 2020b; Zhang et al., 2022). To guarantee good contact between the loading bar and the sample, a pre-pressure was applied before the experiment. The sample was then loaded using a displacement-controlled mode (0.5 mm/min) until failure (Figure 1C). The mechanical loading process was accompanied by the monitoring of high-speed photographic system and AE monitoring system.

TABLE 1. Experimental specimen design.
2.2 Sample mechanical parameters
The sandstone and mudstone samples were cut into cylindrical samples of 50 mm in diameter and 100 mm in height for uniaxial compression test according to the International Society for Rock Mechanics (ISRM) recommendation. The mechanical properties of the samples are shown in Table 2.
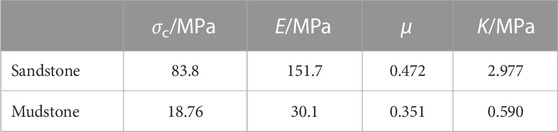
TABLE 2. Main mechanical properties of sandstone and mudstone.
Direct shear tests are required to determine the mechanical characteristics of the bedding planes in the combined sample of layered rock. Therefore, 50 mm in diameter and 100 mm in height cylindrical samples of six sandstone and mudstone samples were created. Two samples were joined together by a binder to create a combined 200 90 50 mm layered rock sample, as illustrated in Figure 2. The binder selected in this study was made of rock powder and epoxy resin in a ratio of 1:5.
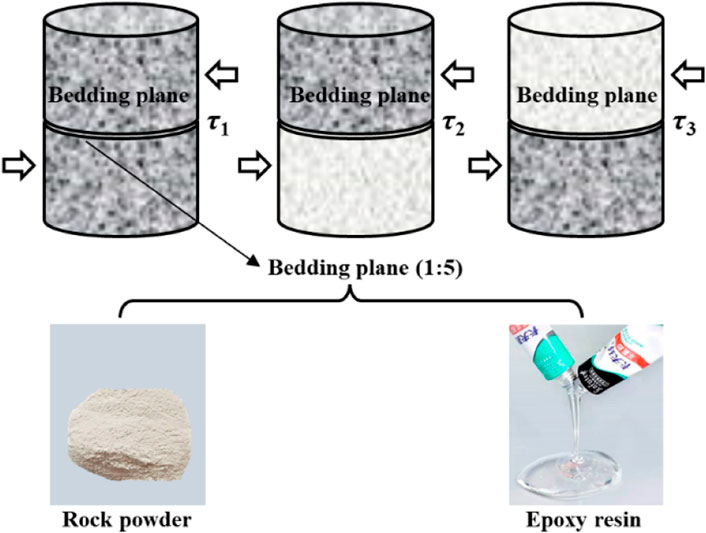
FIGURE 2. The experimental material preparation for sandstone-mudstone combined specimens.
After curing at room temperature for 48 h, the combined samples were placed in a shear box, and stress-strain curves were obtained to calculate the shear strength of the bedding plane, as shown in Table 3. The shear strength of the bedding plane obtained in the direct shear tests is approximately the same as some of the measured and empirical data from previous studies (Xu et al., 2012; Heng et al., 2014; Zhang et al., 2014; Heng et al., 2015).

TABLE 3. Shear strength of bedding plane in sandstone-mudstone combined body.
3 Results
3.1 Three-point bending crack propagation in layered rock
As shown in Figure 3, the cracks produced in single sandstone sample penetrated the whole sample due to the concentrated load, and the cracks has no obvious deflection in the direction. The crack in the A1 is in the middle of the sample from the point of initiation to penetration. However, the path of cracks propagation in both the A2 and A3 appeared at an angle. This may be due to the presence of pre-existing fractures within the rock samples, causing an offset in the location of the crack initiation point. The cracks nevertheless reach the top loading point.
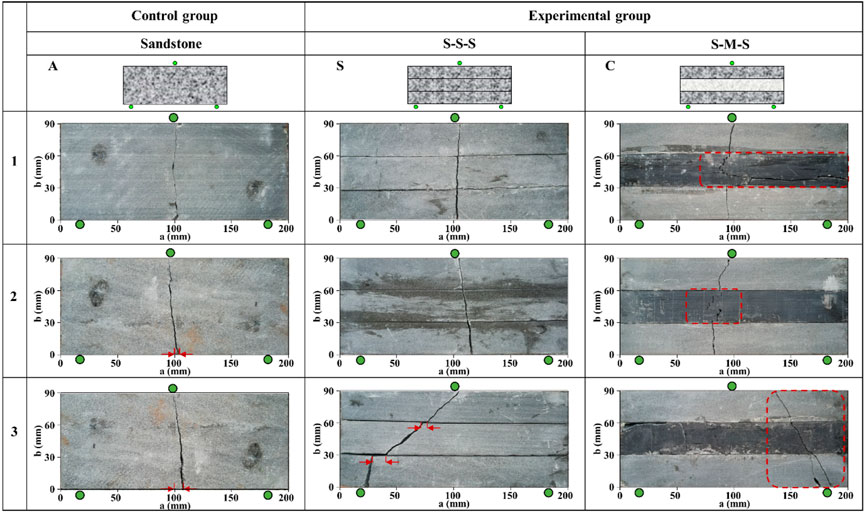
FIGURE 3. Crack propagation pattern of experimental specimens.
The S1 and S2 of the S-S-S combined sample exhibit the same crack initiation and propagation as the single sandstone samples. The cracks penetrated the whole sample without deflecting the crack propagation path at the bedding plane. However, the presence of pre-existing fractures within the underlying sandstone of S3 resulted in uneven stress concentrations at the sample’s left and right support points. As a result, the fracture in S3 widens and spreads obliquely in the direction of the higher loading point from the left support point. Then, the crack propagation through the layer is further observed by changing the mechanical properties of the intermediate layer (i.e., the S-M-S combined sample), as shown in Figure 3. The crack propagation in the intermediate layer is entirely different from that in the S-S-S sample. In the experiments C1 and C2 specimens, the mudstone layer is damaged earlier than the sandstone layer, and multiple macroscopic cracks appear. The microfractures in the mudstone layer prevented the cracks from expanding horizontally at the bedding plane when the sandstone layer’s cracks penetrated into it. In other words, the microfractures produced by the loading of the mudstone layer provide multiple paths for subsequent crack propagation. In addition, the presence of pre-existing fractures within the rock causes the emergence of cracks in C3 to be fraught with randomness. This shows that the crack will quickly pass through the mudstone layer and will not extend at the bedding plane because the vertical stress component at the crack tip is greater than the tensile strength of the mudstone and the horizontal stress component at the crack tip is less than the shear strength at the bedding plane.
3.2 AE characteristics and load time curves of layered rock
The load force, AE counts rate, and AE accumulated energy are all plotted, as seen in Figure 4. The single sandstone samples and S-S-S samples can be divided into 3 stages during three-point bending experiment. In the initial stage of loading, there is a minor AE counts rate. As the increase of loading force, the sample enters the elastic deformation stage, the number of internal cracks gradually increases, and the AE accumulated energy increases. In the third stage, the number of microcracks within the sample increases dramatically and interconnects and penetrates. Moreover, the number of AE counts rate and AE accumulated energy also increase dramatically. Then, a penetration crack is produced on the sample surface, the specimen fails, and the AE counts rate and accumulated energy immediately disappear.
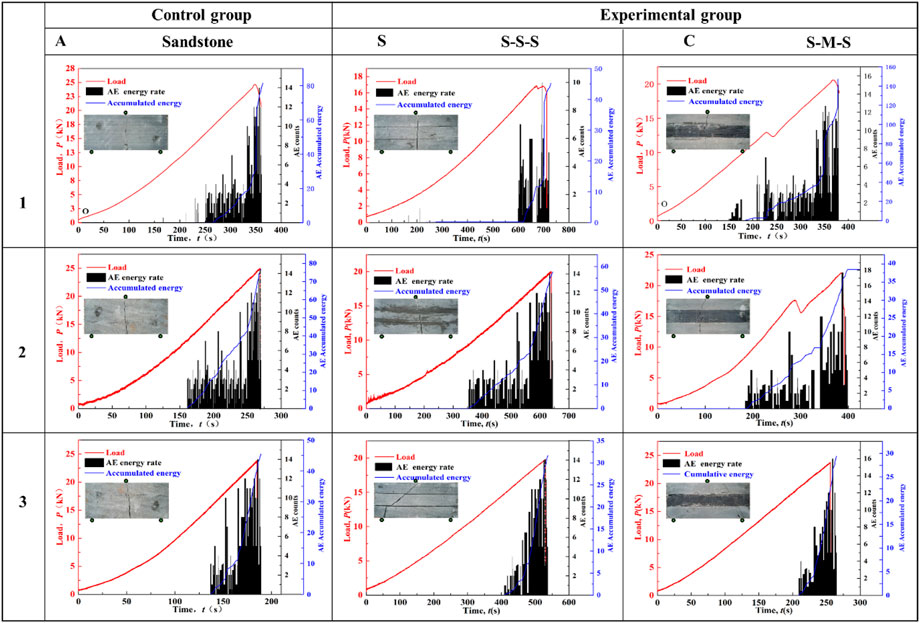
FIGURE 4. Variation of load and AE energy with time.
It can be seen from the load-time curves that the peak load of the S-S-S samples is significantly lower than that of the single sandstone samples, indicating that the presence of the bedding plane reduces the strength of the sandstone. The presence of the bedding plane impedes the stress transfer path, and the failure time of the S-S-S samples is about 300 s, which is longer than that of the single sandstone samples. Moreover, the difference in peak load and failure time between the same group of three samples demonstrate the random distribution of pre-existing fractures in the rock. The load time curves for the S-M-S samples can be shown to have a double-peak feature in Figure 4. At the first peak, an “unloading” phenomenon occurred in the samples, indicating that microcracks had developed within the intermediate rock layer (i.e., mudstone layer), which consumed the strain energy stored in the specimen. At the same time, the load does not cause the sample to failure, and the upper and lower sandstone layers are still in the elastic phase. Under the compression of the upper and lower sandstone layers, the strength of the rock sample briefly recovers, with the load continuing to rise and reaching the second peak.
The AE counts rate had been present for some time before the S-M-S samples reached the first peak load, confirming that the cracks first originated within the mudstone layer. This is because the occurrence of AE events represents the initiation of damage (Guo et al., 2021). The AE accumulated energy of the S-M-S samples increases continuously with time. The sandstone layer at the bottom of the S-M-S specimens splits and spreads into the mudstone layer as the second peak of the load approaches, and the AE cumulative energy reaches its maximum value. The S-M-S samples fail when the cracks penetrate the microcracks formed in the first stage mudstone layer. It is worth noting that the presence of pre-existing fractures in the C3 also resulted in a significant reduction in the failure time of the sample.
According to Figure 5, The distribution of the AE event locations for both S1 and C2 at different periods is obtained based on AE location. At the initial stage of the loading, the AE events are generated and distributed in the middle of the underlying sandstone support point. The height for the AE events occurrences range is 19.96 mm. As the loading force approaches its peak, the size of the AE events distribution range increases to 43 mm, and AE events begin to appear at the bedding plane. The distribution of AE events then extends into the middle sandstone layer. Furthermore, it is evident from the C2 AE position results that the first AE event generation area is also located in the center of the sandstone support point. This is mainly because the stress concentration phenomenon first occurs in the bottom layer of the rock sample. Unlike the S1, with the appearance of the first peak load, the AE events location is mainly concentrated at the intermediate bedding plane and the intermediate mudstone layer. The distribution of the AE events suggests that the microcracks are created within the middle mudstone layer at this stage, laying the groundwork for crack propagation in the sandstone layer underneath.
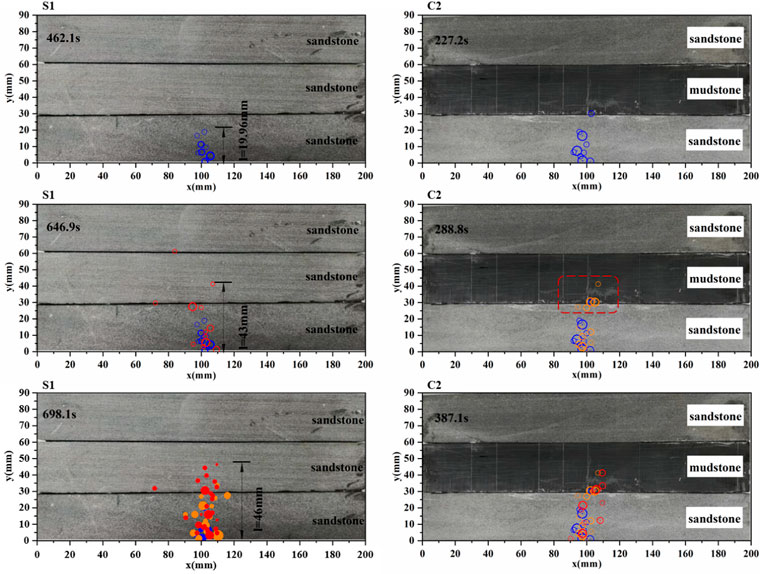
FIGURE 5. Acoustic emission positioning of A1 and C2 specimens.
3.3 DSCM analysis of layered rock
To further investigate the deformation behavior of sample during three-point bending experiment, the X-direction and Y-direction displacements of A1, S1, and C2 are obtained using DSCM analysis (Figures 6, 7). The displacement cloud in the X-direction of the A1 shows a precise symmetrical distribution, as shown in Figure 6. As the loading force increases, the X-directional displacement at the bottom of A1 is much higher than the other positions, and the X-directional removal gradually increases. Eventually, the A1 is damaged by tensile cracks. In contrast, the displacement clouds of S1 and C2 in the X-direction are asymmetrically distributed, indicating a short pause in the crack as it passes through the bedding plane. In addition, as the intermediate rock layer weakened (i.e., the C2 sample), numerous microcracks formed in the mudstone layer in the load phase of the sample, and the initiation and propagation of the microcracks prevented the continued transmission of horizontal displacement (X-directional displacement).
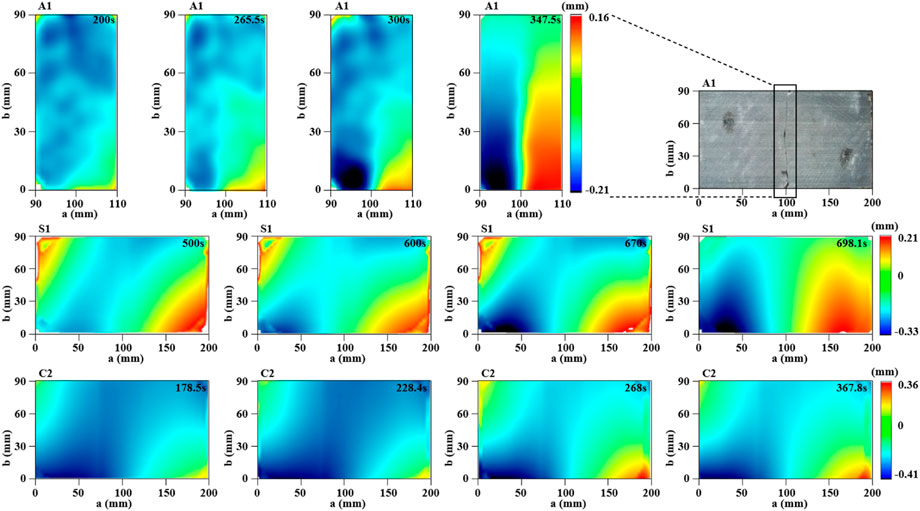
FIGURE 6. X-direction displacement cloud map.
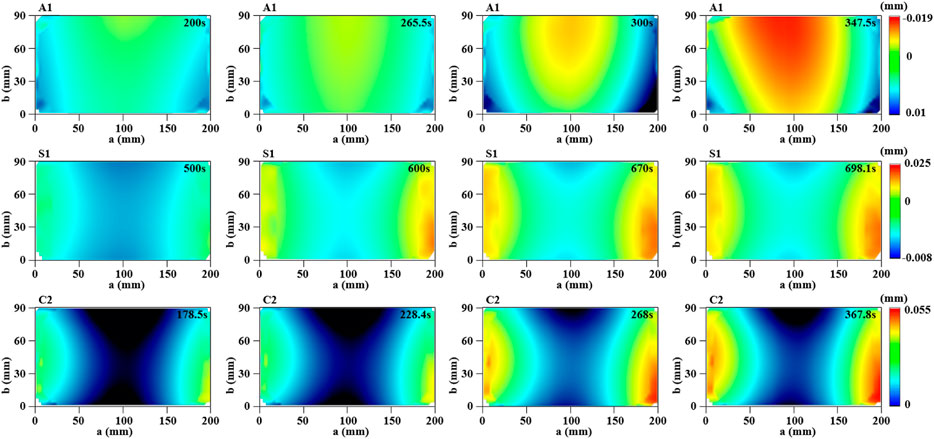
FIGURE 7. Y-direction displacement cloud map.
Similarly, the Y-direction displacement clouds of the samples can be divided into two parts: the middle and the sides. Due to the presence of the bedding plane, the displacement values in the Y-direction are lower in the middle of the S1 and C2 than in the A1. The C2 is more visible in this situation. The middle mudstone layer first developed microcracks and produced Y-direction displacement, resulting in the near-zero longitudinal removal of the upper and lower sandstone layers upon failure.
Combining AE and DSCM techniques, the research team also analyzed the rock fracture process zone (FPZ) as well. There are three stages in the cracking process of rock materials: 1) the stage of fracture process zone development, 2) the stage of large crack initiation and growth, and 3) the stage of specimen failure (Zhang and Zhou, 2022). Figure 4 shows the variation of acoustic emission events with loading time. Figures 6, 7 show the results of DSCM analysis for specific time points. Initially, the FPZ forms a displacement concentration zone on the surface of the specimen (e.g., 265.5 s deformation phase for specimen A1, 600 s deformation phase for specimen S1, and 228.4 s deformation phase for specimen C2), and this damage state corresponds to the first rising segment of the AE count rate (Figures 4, 6, 7). This process is slow and without any mutation (no significant macroscopic cracking is produced). Subsequently, due to the stress amplification, large scale cracks appear on the surface of the specimen, which means that the specimen will have more deformation and also implies that the stable crack extension stage will come (e.g., 300 s deformation phase for specimen A1, 670 s deformation phase for specimen S1). The AE count rate exhibits a continuous increase. In contrast, the C2 specimen consumes the strain energy stored in the specimen during the macroscopic crack expansion due to the lower strength of the mudstone layer, and continued loading is required in order to be able to trigger the continued crack expansion. Therefore, the acoustic emission appears to be a process of first decreasing and then increasing (the U-shaped curve relation between the AE event rate and the loading time). Eventually, failure occurs in all specimens as macroscopic cracks extend to the boundary of the specimen.
3.4 Fracture surface 3D scan analysis of layered rock
The rock fracture surface records the process of crack initiation and propagation in the whole loading process. Selecting the fracture surfaces of A1, S1, and C2 for 3D laser scanning (Figure 8). The S-S-S sample (S1) and the S-M-S sample (C2) have a higher degree of fracture surface roughness and fluctuation than the single sandstone sample (A1). Moreover, the locations of greater roughness are mostly located in the intermediate rock layers. Studies have revealed that the degree of fracture surface roughness is proportional to the number of crack paths during rock fracture (Song et al., 2018). Therefore, the greater the roughness of the fracture surface, the more violent the fracture process. The change degree of the fracture surface in the middle of the C2 exceeds 1.5 cm, further indicating the large number of cracks generated within the mudstone layer.
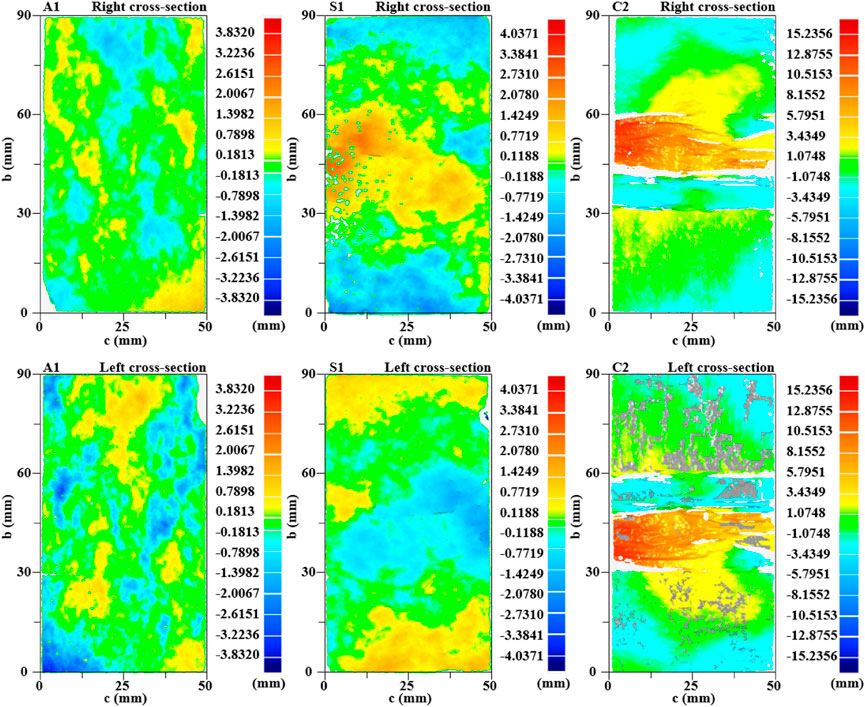
FIGURE 8. Cloud map of fracture surface fluctuation.
4 Discussion
4.1 Numerical modeling set-up
Classic laboratory tests bear the intrinsic limitation of non-repeatability, the numerical simulation based on PFC2D was used to simulate the cracks propagation in the layered rock. The three-point bending model of the layered rock was established based on the particle-based model in PFC2D. The linear Parallel Bond model was used for the rock layer, and the Smooth-joint contact model was used for the bedding plane (Itasca Consulting Group Inc, 2014).
As shown in Figure 9A, the model size is 200 mm in length and 90 mm in height. A total of 43,314 particles were generated in the model. The two circle walls at the end of the model are fixed to provide restraint, apply speed to the upper circle wall for loading, and the model is loaded by displacement-controlled mode (1 mm/s) until sample failure. Then, the S-S-S combined model and the S-M-S combined model was established and parameter calibrated by trial-and-error method. The final parameters were obtained as shown in Tables 4, 5, and the parameter calibration results are shown in Figure 9B. Through the above model calibration and verification, the feasibility of the model is fully verified, which shows that the parameter calibration results of the model are accurate.
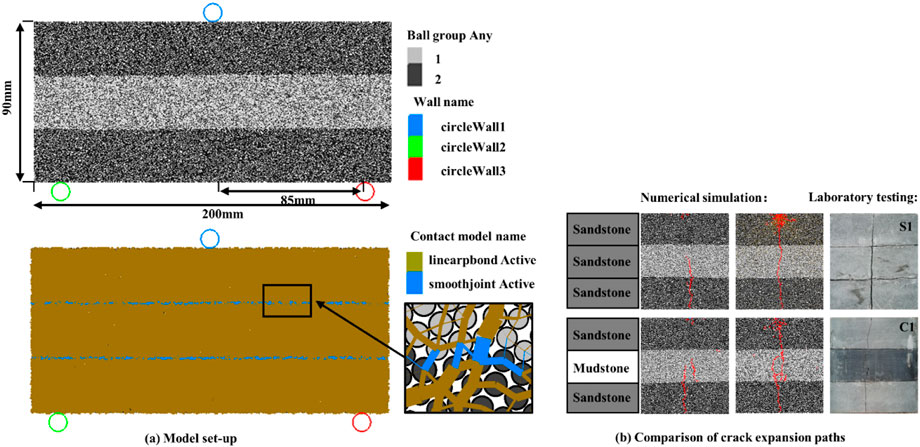
FIGURE 9. Numerical modeling. (A) Model set-up. (B) Comparison of crack propagation paths in numerical simulations and physical experiments.
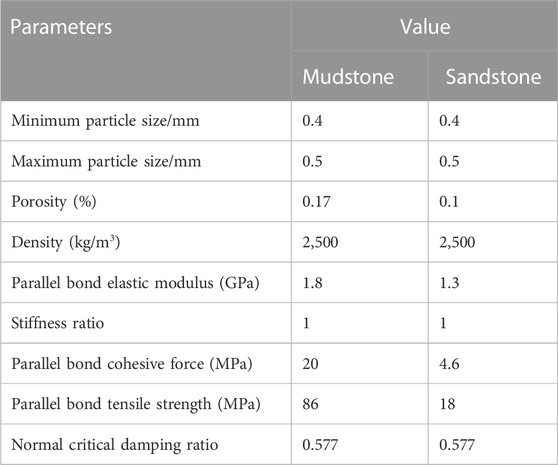
TABLE 4. Calibration results of microscopic parameters of media.
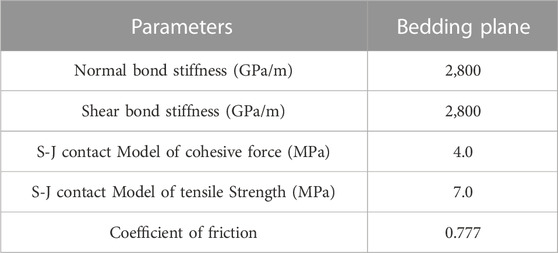
TABLE 5. Calibration results of bedding plane parameters.
4.2 Effect of randomness of initial crack
The pre-existing fractures within the rock are random, and the presence of the bedding plane hinders load transfer. As shown in Figure 3, the S3 and C3 show a different pattern of crack propagation due to the pre-existing fractures within the bottom sandstone. To fully understand the effect of pre-existing fractures on the pattern of crack propagation in the combined sample, the horizontal distance between the pre-existing fractures and the loading point is defined as X (Figures 10, 11). The crack propagation is simulated for the cases of X = 70, 60, 50, 40, 30, and 20 mm in turn.
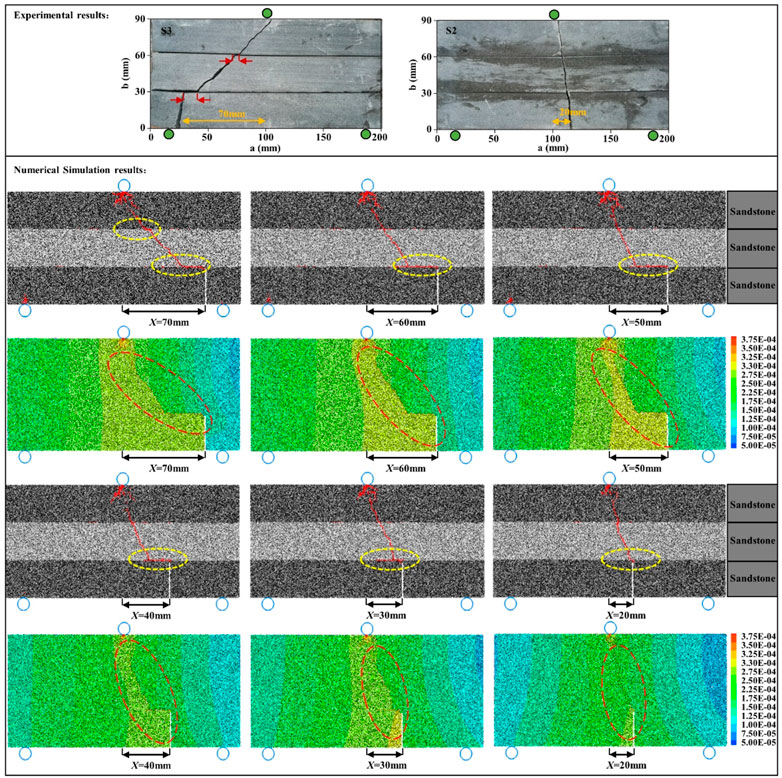
FIGURE 10. Crack propagation paths and surface displacement clouds for S-S-S model with different X values.
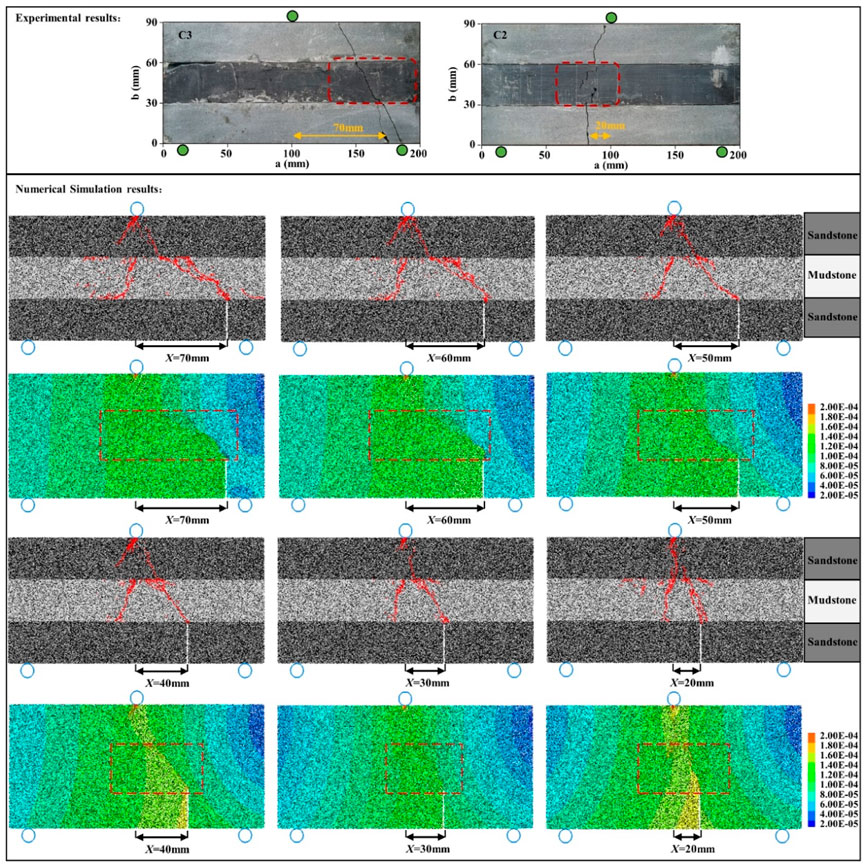
FIGURE 11. Crack propagation paths and surface displacement clouds for S-M-S model with different X values.
In the S-S-S combined model, the crack propagation continued to develop from the end of the pre-existing fractures and did not initiate new cracks in other positions. As shown in Figure 10, the cracks always extend horizontally along the bedding plane for a certain distance before transforming into through-layer propagation when the X value is large. Then, the crack interlaminar propagation distance decreases as the X-value decreases. When X = 20 mm, the cracks do not appear interlayer propagation but rather show through-layer propagation and move towards the loading point position. The load required for the development of cracks perpendicular to the bedding plane is always significantly more than that necessary for parallel development (Li et al., 2006). This phenomenon is consistent with the crack propagation pattern of in the three-point bending experiment.
Whereas, in the S-M-S combined model, the cracks are more easily to propagate within the mudstone layer due to the weak strength of the mudstone layer. Not only do the cracks extend along the end of the pre-existing fractures, but a crack also appears at the location of the loading point in the middle of the mudstone layer (Figure 11). Regardless of the increasing or decreasing X value, the cracks always penetrated from the end of the pre-existing fractures to the upper loading point and do not extend at the bedding plane layer. Moreover, the crack propagation path is no longer a clear path, but shows a general propagation direction, and the cracks show many fine bifurcations in the process of propagation (the C2 and C3 samples).
In the S-S-S combined model, the surface displacements are concentrated around the crack. However, in the S-M-S combined model, the surface displacements increase in a wide range inside the intermediate mudstone layer. The difference in the path of crack propagation in the S-S-S combined model and the S-M-S combined model is mainly influenced by the shear strength of the bedding plane and the tensile strength of the rock layer. The numerical simulations further validate the results from the laboratory investigations.
4.3 Effect of rock strength on crack propagation
The cracks propagation path of layered rock in three-point bending experiments is influenced by the strength of the intermediate rock layer. To further investigate the influence of the difference in strength between the intermediate layer (M-layer) and the adjacent layers (S-layer) on the crack propagation pattern of the layered rock combined model. Five different strength ratios of the S-layer to the M-layer, 1:1, 1:2, 1:3, 2:1, and 3:1, are chosen to investigate the crack propagation pattern in numerical simulation.
It can be noticed from Figure 12 that as the strength of the M-layer decreases, the cracks propagate in large numbers in the M-layer. The surface displacement cloud shows an overall increase in displacement in the intermediate of the combined model, indicating that the eventual damage is no longer the propagation pattern of one major crack but the multiple cracks (Figure 12). In contrast, when the strength of the M-layer is greater than or equal to the S-layer, the macroscopic propagation path of the crack is reduced, and an apparent concentration appears in the displacement cloud. The simulation results show that the strength of the rock strength has a preventing effect on the crack expansion, and the preventing effect increases with the increase of the strength of the rock strength (Dai et al., 2014). As the strength of the M-layer continues to increase, cracks begin to appear in the top of S-layer and expand at the bedding plane.
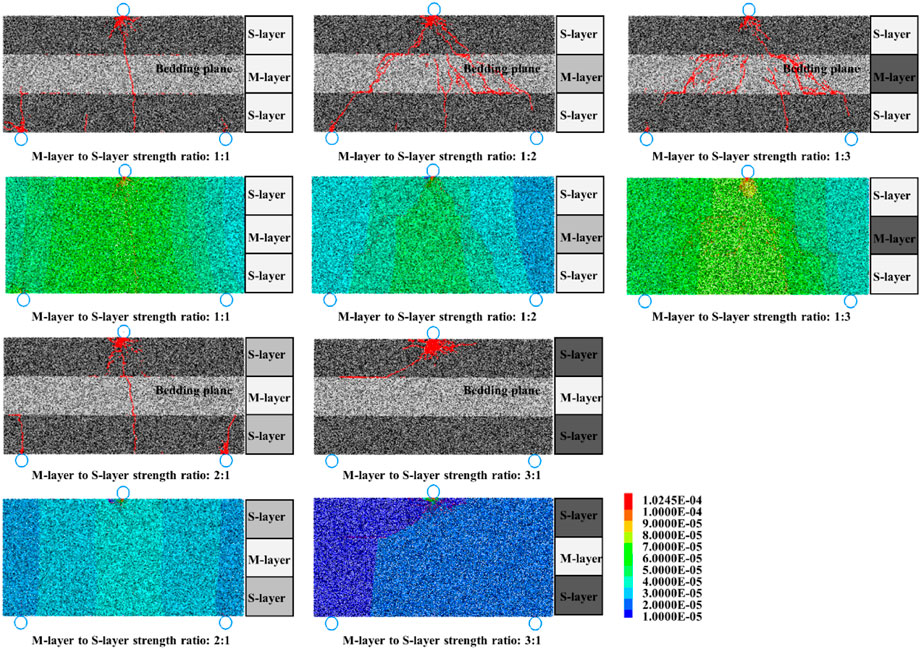
FIGURE 12. Crack propagation paths and surface displacement clouds for different materials strength ratios.
To further illustrate the crack propagation process, three sets of models with strength ratios of 1:1, 1:3, and 3:1 between the S-layer and M-layer are selected for analysis (Figure 13). When the strength of S-layer and M-layer are consistent (i.e., 1:1), the crack propagation pattern in the model is similar to the S-S-S sample. The crack appears in the middle of two circle walls at the lower end of the model and expands to the upper loading point. During this process, the crack is not extended at the bedding plane. When the strength ratio between S-layer and M-layer is 1:3, the crack within the combined sample is first initiate in the M-layer, and the crack initiation time is advanced from 19,603 to 15,444 steps. Meanwhile, as the damage degree in the middle layer increases, the crack also begins to propagate at the bedding plane, providing multiple paths for the crack propagation at the bottom. The position of tensile crack propagation in the bottom layer also moves from the middle to the sides. Then, when the strength of the M-layer is much higher than that of the S-layer (i.e., 3:1), cracks are initiated from the top of the model. The high strength of the M-layer hinders the through-layer crack propagation, and the crack starts to move horizontally at the bedding plane.
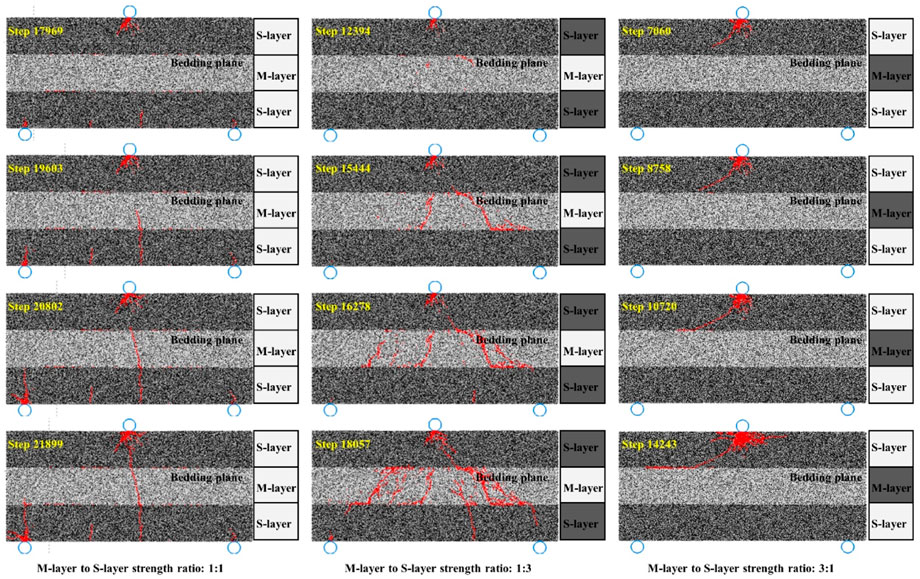
FIGURE 13. Crack propagation processes for different materials strength ratios.
4.4 Effect of bedding plane strength on crack propagation
In order to investigate the effect of the bedding plane strength on crack propagation, five ratios of bedding plane and rock strength are selected in the model, 1:10, 1:5, 1:2, 1:1.5, and 1:1, respectively. Additionally, the strength of S and M-layers are consistent.
When the strength of the bedding plane is much lower than the strength of rock layer, two horizontal cracks appear at the upper and lower bedding planes of the model (Figure 14). Meanwhile, horizontal and vertical cracks appear to penetrate within the model. The model displacement cloud has a clear layering feature. As the strength of the bedding plane gradually approaches that of the strength of rock layer (i.e., bedding plane to M and S-layers strength ratio: 1:2), the length of the horizontal crack at the bedding plane becomes shorter, and the surface displacement in the middle of the model increases. However, the vertical cracks still intersect the horizontal cracks. When the strength of bedding plane and the rock layer are consistent (i.e., bedding plane to M and S-layers strength ratio: 1:1), horizontal cracks do not appear at the bedding plane, and vertical cracks run directly through the entire model. The pattern of crack propagation is the same as that of the crack in the single sandstone sample (i.e., A1).
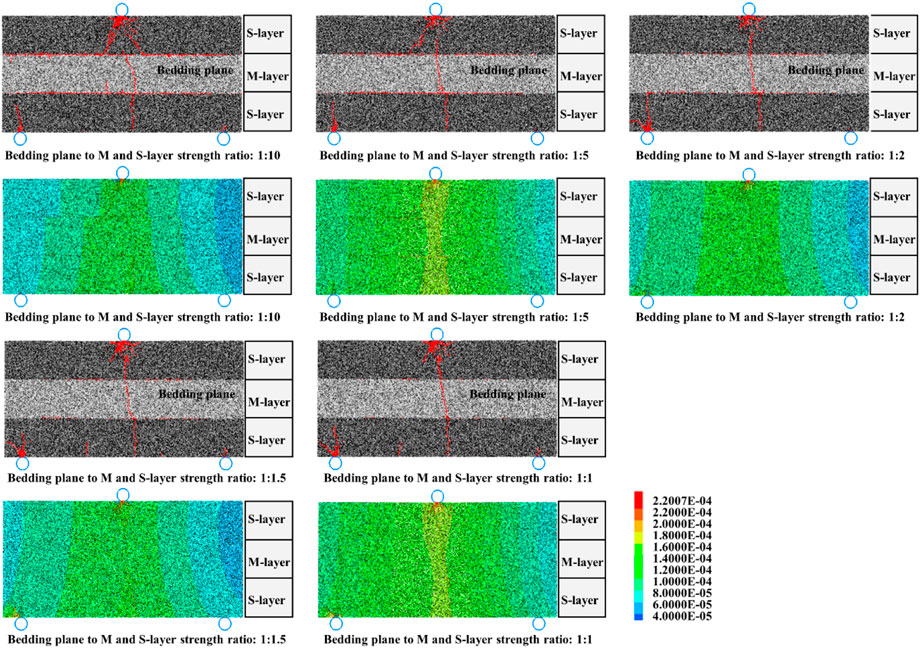
FIGURE 14. Crack propagation paths and surface displacement clouds for different bedding planes strength.
As shown in Figure 15, three groups of typical models with different bedding plane strengths are selected to analyze the crack propagation process. When the strength of the bedding plane is weak (i.e., bedding plane to M and S-layers strength ratio of 1:10), the crack initiate at the bedding plane during loading and extends interlayer along the bedding plane. Subsequently, vertical tensile cracks appear at the bottom of the model and continue to expand upwards. Due to horizontal cracks at the bedding plane, the vertical crack no longer exhibits interlaminar propagation. Then, horizontal cracks at the upper bedding plane extend through the layers towards the loading point.
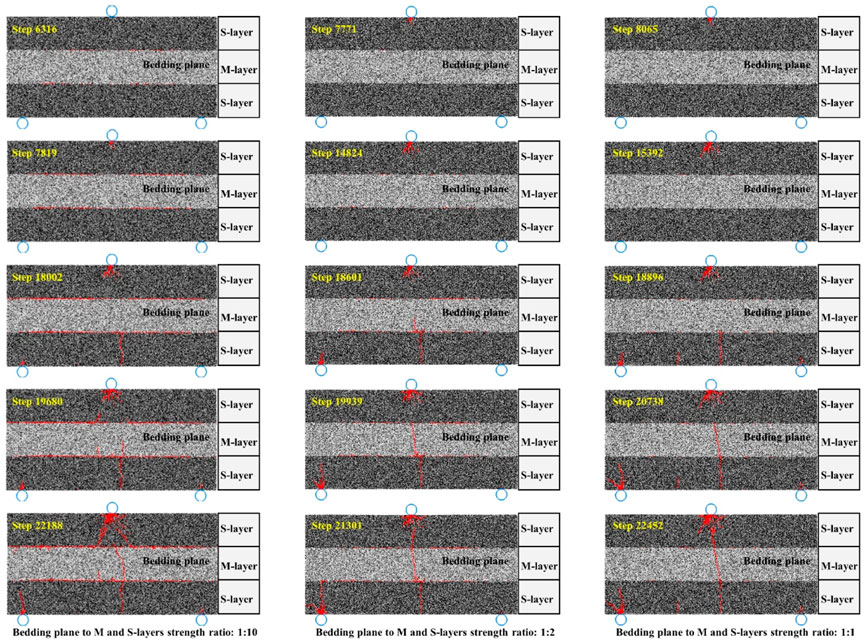
FIGURE 15. Crack propagation processes for different bedding planes strength.
As the ratio of the bedding plane’s strength and the rock layer’s strength increases, the length of interlaminar crack horizontal propagation decreases. The increased strength of the bedding plane hinders the propagation of interlaminar cracks and increases the time step for these cracks to initiate. Meanwhile, the cracks in the model have also been reduced from multiple to one. When the bedding plane’s strength and the rock layer’s strength ratio is 1:1, horizontal cracks are no longer produced between the bedding planes. The cracks initiated at the bottom of the model penetrate directly through the entire model. The effect of bedding plane strength on crack extension in this study is consistent with the crack extension pattern observed in a previous study (Han et al., 2019).
5 Conclusion
In this paper, based on three-point bending experiments on single sandstone samples, sandstone-sandstone-sandstone combined samples, and sandstone-mudstone-sandstone combined samples, the load-time curve, crack propagation path, surface displacement clouds, AE accumulated energy of the layered rock was analyzed by DSCM and AE techniques. Furthermore, numerical simulations were carried out to investigate the effects of rock strength ratio, bedding plane strength, and pre-existing fractures position on the crack propagation path in layered rock. The main conclusions are as follows:
1) The rock strength, the bedding plane strength, and the position of pre-existing fractures are all important factors influencing the propagation of cracks.
2) The presence of bedding planes decreases the strength of the samples and impedes the stress transfer path, resulting in an increase of failure time. When the strength of the bedding plane is weak, cracks initiate at the bedding plane earlier than at the bottom of the sample, and the length of cracks propagation at the bedding plane is longer.
3) From the load-time curves, the peak loads of the composite rock samples are significantly lower than those of the pure sandstone. When the intermediate layer is weak, microcracks first sprout during the loading process, providing multiple paths for macroscopic crack expansion. Meanwhile, the intermediate rock layer strength reduction also leads to an increase in the roughness of the fracture surface of the samples and a violent fracture process. In contrast, the increase in the strength of the intermediate layer will hinder the through-layer crack propagation.
4) The pre-existing fractures within the combined samples play a crucial role in the cracks initiation and propagation. When the strength of each rock layer is consistent, the greater the horizontal distance between the pre-existing fractures and the loading point, the longer the interlayer propagation length of the cracks. Besides, as the strength of the intermediate rock layer decreases, the cracks show many fine bifurcations in the process of propagation.
Data availability statement
The datasets presented in this study can be found in online repositories. The names of the repository/repositories and accession number(s) can be found in the article/Supplementary Material.
Author contributions
YY and ZM discussed and conceived the research. ZM and WZ performed the numerical simulation. GL and PZ revised the article.
Funding
This work was provided by National Natural Science Foundation of China (No 52004012), Science and Technology Project of National Energy Group (No. GJNY2030XDXM-19-03.1), and supported by the Fundamental Research Funds for the Central Universities (2022YJSLJ14; 2021JCCXLJ05).
Acknowledgments
The authors wish to thank the reviewers for careful and constructive suggestions.
Conflict of interest
Author YY was employed by National Energy Investment Group Co., China. Authors WZ and GL were employed by Shendong Coal Group Co.
The remaining authors declare that the research was conducted in the absence of any commercial or financial relationships that could be construed as a potential conflict of interest.
Publisher’s note
All claims expressed in this article are solely those of the authors and do not necessarily represent those of their affiliated organizations, or those of the publisher, the editors and the reviewers. Any product that may be evaluated in this article, or claim that may be made by its manufacturer, is not guaranteed or endorsed by the publisher.
References
Astm, (1984). Standard test method for plane-strain fracture toughness of metallic materials. Philadelphia, USA: ASTM Int.
Chang, X., Wang, J. H., Tang, C. A., and Ru, Z. L. (2015). Effects of interface behavior on fracture spacing in layered rock. Rock Mech. Rock Eng. 49 (5), 1733–1746. doi:10.1007/s00603-015-0852-5
Cheng, J. L., Yang, S. Q., Du, L. K., Wen, S., and Zhang, J. Y. (2016). Three-dimensional numerical simulation on interaction between double-shield TBM and surrounding rock mass in composite ground. Chin. J. Rock Mech. Eng. 35 (03), 511–523. doi:10.13722/j.cnki.jrme.2015.0693
Dai, S. H., Wang, Z., Ma, S. L., and Pan, Y. S. (2014). Study on characteristics of crack propagation in stratified rock. J. China Coal Soc. 39 (02), 315–321. doi:10.13225/j.cnki.jccs.2013.2018
Gao, J. H., Kang, T. H., Jin, Z. M., and Zheng, T. B. (2004). Similar simulation study on crack development law of surrounding rocks of roadway with great-thick thin-bedded top roof. Chin. J. Rock Mech. Eng. (19), 3292–3297.
Guo, L. W., Latham, J. P., and Xiang, J. S. (2017). A numerical study of fracture spacing and through-going fracture formation in layered rocks. Int. J. Solids Struct. 110-111, 44–57. doi:10.1016/j.ijsolstr.2017.02.004
Guo, P. Y., Gu, J., Su, Y., Wang, J., and Ding, Z. W. (2021). Effect of cyclic wetting–drying on tensile mechanical behavior and microstructure of clay-bearing sandstone. Int. J. Coal Sci. Technol. 8 (5), 956–968. doi:10.1007/s40789-020-00403-3
Han, W. G., Cui, Z. D., Tang, T. W., Zhang, J. Y., and Wang, Y. Z. (2019). Effects of different bedding plane strength on crack propagation process under three points bending. J. China Coal Soc. 44 (10), 3022–3030. doi:10.13225/j.cnki.jccs.2018.1351
Heng, S., Guo, Y. T., Yang, C. H., Daemen, J. J. K., and Li, Z. (2015). Experimental and theoretical study of the anisotropic properties of shale. Int. J. Rock Mech. Min. Sci. 74, 58–68. doi:10.1016/j.ijrmms.2015.01.003
Heng, S., Yang, C. H., Zeng, Y. J., Zhang, B. P., Guo, Y. T., Wang, L., et al. (2014). Anisotropy of shear strength of shale based on direct shear test. Chin. J. Rock Mech. Eng. 33 (05), 874–883. doi:10.13722/j.cnki.jrme.2014.05.002
Ishida, T., Kanagawa, T., and Kanaori, Y. (2010). Source distribution of acoustic emissions during an in-situ direct shear test: Implications for an analog model of seismogenic faulting in an inhomogeneous rock mass. Eng. Geol. 110 (3-4), 66–76. doi:10.1016/j.enggeo.2009.11.003
Jiang, D. Y., Fan, X. Q., Ren, T., Chen, J., and Ren, S. (2012). The experiment to research the mudstone interbeds which affect the mechanical characters of the layered rock salt. Appl. Mech. Mater. 226-228, 1279–1284. doi:10.4028/www.scientific.net/AMM.226-228.1279
Jiang, L. S., Ma, N. J., Bai, L., Li, Y. J., and Zhang, L. (2014). Deformation and failure characteristics and roof caving hidden danger classification of roadways compound roof. J. China Coal Soc. 39 (07), 1205–1211. doi:10.13225/j.cnki.jccs.2013.1219
Li, A., Liu, Y., Dai, F., Liu, K., and Wei, M. D. (2020). Continuum analysis of the structurally controlled displacements for large-scale underground caverns in bedded rock masses. Tunn. Undergr. Space Technol. 97, 103288. doi:10.1016/j.tust.2020.103288
Li, L. Y., Ning, H. L., Liu, Z. B., She, Y. L., Liu, D. A., and Fu, J. H. (2006). Special phenomena of fracture and mechanism analysis of layered rock mass. Chin. J. Rock Mech. Eng. (2), 3933–3938.
Liu, Q. S., Shi, K., and Huang, X. (2013). Feasibility of application of TBM in construction of deep coal mine and its key scientific problems. J. Min. Saf. Eng. 30 (05), 633–641.
Masri, M., Sibai, M., Shao, J. F., and Mainguy, M. (2014). Experimental investigation of the effect of temperature on the mechanical behavior of Tournemire shale. Int. J. Rock Mech. Min. Sci. 70, 185–191. doi:10.1016/j.ijrmms.2014.05.007
Morgan, S. P., and Einstein, H. H. (2017). Cracking processes affected by bedding planes in Opalinus shale with flaw pairs. Eng. Fract. Mech. 176, 213–234. doi:10.1016/j.engfracmech.2017.03.003
Peng, R. D., Wu, Z. D., Zhou, H. W., and Zuo, J. P. (2011). Meso-experimental investigation on crack evolution in bedded salt rock. Chin. J. Rock Mech. Eng. 30 (2), 3953–3959.
Saiang, D., Malmgren, L., and Nordlund, E. (2005). Laboratory tests on shotcrete-rock joints in direct shear, tension and compression. Rock Mech. Rock Eng. 38 (4), 275–297. doi:10.1007/s00603-005-0055-6
Shang, J., Hencher, S. R., and West, L. J. (2016). Tensile strength of geological discontinuities including incipient bedding, rock joints and mineral veins. Rock Mech. Rock Eng. 49 (11), 4213–4225. doi:10.1007/s00603-016-1041-x
Song, Z. Y., Ji, H. G., Liu, Z. Q., and Tan, J. (2018). Morphology and failure mechanism of the shear fracture surface of weakly cemented sandstone with water saturation. J. China Coal Soc. 43 (09), 2444–2451. doi:10.13225/j.cnki.jccs.2017.1767
Su, X. G., Li, Y. B., and Yang, Y. K. (2011). A Research into Extra-thick compound mudstone roof roadway failure mechanism and security control. Procedia Eng. 26, 516–523. doi:10.1016/j.proeng.2011.11.2200
Tien, Y. M., Kuo, M. C., and Juang, C. H. (2006). An experimental investigation of the failure mechanism of simulated transversely isotropic rocks. Int. J. Rock Mech. Min. Sci. 43 (8), 1163–1181. doi:10.1016/j.ijrmms.2006.03.011
Wang, D. J., Tang, H. M., Elsworth, D., and Wang, C. Y. (2019). Fracture evolution in artificial bedded rocks containing a structural flaw under uniaxial compression. Eng. Geol. 250, 130–141. doi:10.1016/j.enggeo.2019.01.011
Wasantha, P. L., Ranjith, P. G., and Shao, S. S. (2014). Energy monitoring and analysis during deformation of bedded-sandstone: Use of acoustic emission. Ultrasonics 54 (1), 217–226. doi:10.1016/j.ultras.2013.06.015
Xu, J., Wu, H., Lu, L. F., Yang, H. W., and Tan, H. Y. (2012). Experimental study of acoustic emission characteristics during shearing process of sandstone under different water contents. Chin. J. Rock Mech. Eng. 31 (05), 914–920.
Yang, S. Q., Liu, X. R., and Jing, H. W. (2013). Experimental investigation on fracture coalescence behavior of red sandstone containing two unparallel fissures under uniaxial compression. Int. J. Rock Mech. Min. Sci. 63, 82–92. doi:10.1016/j.ijrmms.2013.06.008
Yang, S. Q., Yang, D. S., Jing, H. W., Li, Y. H., and Wang, S. Y. (2011). An experimental study of the fracture coalescence behaviour of brittle sandstone specimens containing three fissures. Rock Mech. Rock Eng. 45 (4), 563–582. doi:10.1007/s00603-011-0206-x
Yin, D. W., and Meng, X. X. (2018). Numerical simulation on uniaxial compression failure of a roof rock–coal–floor rock composite sample with coal persistent joint. Geotechnical Geol. Eng. 37 (1), 13–23. doi:10.1007/s10706-018-0585-9
Yin, P. F., Yang, S. Q., and Zeng, W. (2015). A simulation study on strength and crack propagation characteristics of layered composite rock with single fissure. J. Basic Sci. Eng. 23 (03), 608–621. doi:10.16058/j.issn.1005-0930.2015.03.019
Yu, Y. Q., Hu, M. Y., Yang, X. L., and Liang, W. M. (2009). Similarity simulation of bedded composite rock. Metal Mine, (01), 21-24+91.
Zhang, G. M., Li, Y. P., Liu, W., and Zhang, G. H. (2014). Study of shear strength properties of interfaces in bedded salt formations based on sedimentary characteristics. Chin. J. Rock Mech. Eng. 33 (2), 3631–3638. doi:10.13722/j.cnki.jrme.2014.s2.030
Zhang, J. Z., and Zhou, X. P. (2020a). AE event rate characteristics of flawed granite: From damage stress to ultimate failure. Geophys. J. Int. 222 (2), 795–814. doi:10.1093/gji/ggaa207
Zhang, J. Z., Zhou, X. P., and Du, Y. H. (2022). Cracking behaviors and acoustic emission characteristics in brittle failure of flawed sandstone: A true triaxial experiment investigation. Rock Mech. Rock Eng.12 doi:10.1007/s00603-022-03087-0
Zhang, J. Z., and Zhou, X. P. (2020b). Forecasting catastrophic rupture in brittle rocks using precursory AE time series. J. Geophys. Res. Solid Earth 125 (8). doi:10.1029/2019jb019276
Zhang, J. Z., and Zhou, X. P. (2022). Fracture process zone (FPZ) in quasi-brittle materials: Review and new insights from flawed granite subjected to uniaxial stress. Eng. Fract. Mech. 274, 108795. doi:10.1016/j.engfracmech.2022.108795
Zhou, Y. Y., Feng, X. T., Xu, D. Q., Chen, D. F., and Jun, L. S. (2016). Experimental study of mechanical response of thin-bedded limestone under bending conditions. Rock Soil Mech. 37 (07), 1895–1902. doi:10.16285/j.rsm.2016.07.009
Zhu, H. J., Ju, Y. W., Huang, C., Chen, F. W., Chen, B. Z., and Yu, K. (2020). Microcosmic gas adsorption mechanism on clay-organic nanocomposites in a marine shale. Energy 197, 117256. doi:10.1016/j.energy.2020.117256
Zhu, H. J., Ju, Y. W., Huang, C., Han, K., Qi, Y., Shi, M. Y., et al. (2019). Pore structure variations across structural deformation of silurian longmaxi shale: An example from the chuandong thrust-fold belt. Fuel 241, 914–932. doi:10.1016/j.fuel.2018.12.108
Zhu, H. J., Ju, Y. W., Qi, Y., Huang, C., and Zhang, L. (2018). Impact of tectonism on pore type and pore structure evolution in organic-rich shale: Implications for gas storage and migration pathways in naturally deformed rocks. Fuel 228, 272–289. doi:10.1016/j.fuel.2018.04.137
Keywords: layered rock, crack propagation, three-point bending test, numerical simulation, digital speckle correlation method
Citation: Yang Y, Ma Z, Zhang W, Liu G and Zhang P (2023) Study on crack propagation in layered rock under the three-point bending conditions. Front. Earth Sci. 10:1084272. doi: 10.3389/feart.2022.1084272
Received: 30 October 2022; Accepted: 13 December 2022;
Published: 10 January 2023.
Edited by:
Zhentao Dong, China University of Petroleum, Huadong, ChinaCopyright © 2023 Yang, Ma, Zhang, Liu and Zhang. This is an open-access article distributed under the terms of the Creative Commons Attribution License (CC BY). The use, distribution or reproduction in other forums is permitted, provided the original author(s) and the copyright owner(s) are credited and that the original publication in this journal is cited, in accordance with accepted academic practice. No use, distribution or reproduction is permitted which does not comply with these terms.
*Correspondence: Zhibo Ma, bWF6aGlib19zaGFueGlAMTYzLmNvbQ==