 Fei Tang
 Donglin Dong1*
- 1Department of Geological Engineering and Environment, China University of Mining and Technology, Beijing (CUMTB), Beijing, China
- 2Hebei Geological Environment Monitoring Institute, Shijiazhuang, China
- 3Institute of Ecological and Environmental Engineering, Power China Northwest Engineering Corporation Limited, Xi’an, China
Cement slurry is widely used in grouting reinforcement of coal mine floor. Under the action of water-force coupling, the floor of abandoned roadway reinforced by cement slurry is prone to damage. The failure characteristics of grouting concretion body under water-force coupling were studied by using RFPA software considering the heterogeneity of rock mass. The numerical simulation results show that the acoustic emission (AE) of numerical samples of the same strength with different lower boundary pressure decreases with the increase of lower boundary pressure, and the acoustic emission of numerical samples of the same lower boundary pressure with different strength increases with the increase of compressive strength. The lower the water pressure at the lower boundary is, the lower the softening degree of the sample is, and the sample is more prone to brittle fracture under external load. The numerical simulation results have important guiding significance for the grouting concretion body protection of coal mine floor in the future.
Introduction
Due to the long geological evolution process and chamber excavation, the supporting pressure of surrounding rock exceeds its peak strength, and there must be a large number of weak planes (such as joints, fractures) in the rock mass (Hyett et al., 1992; Nikbakhtan and Osanloo, 2009; Xiujun et al., 2012). In underground engineering construction, grouting method is often used to strengthen and control, so as to improve the bearing capacity and waterproof performance of surrounding rock and ensure the safety of engineering construction (Tuerkmen and Oezguezel, 2003; He et al., 2005; Zhang et al., 2015a). When the coal mining face is completed, the floor of the abandoned roadway will receive the action of external force and water pressure. Under the action of water-force coupling, grouting concretion body in coal mine floor is prone to cracking and crushing (Meng et al., 2013; Xie et al., 2015).
The stability control of weak and broken surrounding rock has always been one of the major problems puzzling the safety and efficient production of coal mines (Zhao et al., 2017; Liu et al., 2018; Wang et al., 2018; Wang et al., 2019; Zhou et al., 2020). Under the influence of high stress, fault fracture zone and weak cementation, the broken degree of surrounding rock is high, and the phenomena of roof fall and floor heave occur frequently (Gao et al., 2004; Pan et al., 2020). The strength and frequency of roadway repair are increased, and grouting reinforcement can improve self-bearing capacity of surrounding rock in situ. Grouting reinforcement technology is an efficient roadway support method in the process of coal mining, it is mainly through the injection of a certain slurry material into the surrounding rock to effectively support the roadway. However, groundwater can affect the strength of the grouting concretion body, and even cause roadway damage (Zhang et al., 2015b; Niu et al., 2017; Fan and Ma, 2018; Cai, 2020).
As early as the 1980s, P. D. Evdokimov et al. studied the influence of grouting on shear properties of fractured rock mass (Evdokimov et al., 1970). In the 1990s, Zhou et al. (1993) strengthened and grouted the weakly weathered rock mass near the base surface during the construction of Ertan Arch Dam, and theoretically analyzed the mechanism of rock mass mechanical changes by fracture-damage mechanics method. Zong et al. (2013) carried out the confined grouting reinforcement of cracked rock samples and tested the mechanical properties of grouting reinforced samples by using self-made grouting system. Han et al. (2011) revealed the essence and mechanisms of grouting reinforcement, measured the roughness of structural plane in cracked rock mass, and analyzed the influence of grouting on strength, joint roughness coefficient and stiffness of structural plane through the shear test of structural plane of rupture rock sample around grouting reinforcement. Wang et al. (2007) carried out experimental research on the mechanical properties of post-peak grouting reinforcement samples, and found that the higher the strength of the reinforced solid itself, the higher the strength of the grouting reinforced solid, and the higher the bond strength of the slurry, the higher the strength after grouting. Lei et al. (2015) defined the material parameters of irregular concretion, and analyzed the characteristics of stress and deformation under loads after grouting. Wael et al. (2021) discussed the influence of five different sizes of sand on the ultimate stress (MPa) of hand-mixed cement-grouted sands modified with polymer. Liu et al. (2021) analyzed influences on the performance of cement-based grout used to reform the upper Middle Ordovician limestone in Hanxing mining area. Zhang and Barry (2019) used the finite element method to examine the relative influence of a number of key factors controlling the stability and surface deformations of shallow, horizontal coal mine goafs overlain by sedimentary rock and grouting concretion body. Zhang et al. (2019) compared the microscopic properties of a new borehole sealing material with ordinary cement grout. From the above analysis, it can see that the effect of different water pressures on the fracture characteristics of grouting concretion body has not been studied.
In 1995, Professor Tang proposed the real failure process analysis method, namely the RFPA (Realistic Failure Process Analysis) method (Chen et al., 2021a). This method is based on the basic theory of finite element and fully considers the characteristics of non-linearity, inhomogeneity and anisotropy that accompany the rock fracture process (Tang et al., 2000; Tang, 2003; Chen et al., 2021b). RFPA is a real fracture process analysis system that uses elastic mechanics as a stress analysis tool and elastic damage theory as a medium deformation analysis module (Chen et al., 2022; Yang, 2004).
In this paper, based on the above research, the failure characteristics of grouting concretion body under water-force coupling are studied by using RFPA software considering the heterogeneity characteristics of rock mass.
Introduction to RFPA-Flow
A brief introduction to the basic principles of RFPA-Flow
1) The seepage process in the rock satisfies the Biot consolidation theory (Tang, 2003; Yang, 2004).
where
2) The relationship between permeability and stress-strain function is satisfied in the elastic state of microscopic unit, and the permeability Kf increases after the element is damaged and ruptured, the Kf can be written as:
3) The rock structure is non-uniform, and the damage parameters of the unit bodies composing the rock satisfy a certain probability distribution.
Element permeability-damage coupling equation
When the stress state of the meso-element meets a given damage threshold, the element begins to be damaged, and the elastic modulus of the damaged element is:
where D is the damage variable, E and
For the element subjected to uniaxial compression, the failure criterion of the element adopts the Mohr-Coulomb criterion, namely:
where
When the shear stress reaches the Mohr-Coulomb damage threshold, the damage variable D is expressed as follows:
where
where
Numerical model
The size of the grouting concretion body is 70.7 mm × 70.7 mm, and the numerical model is composed of 202 × 202 mesoscopic units. The mechanical parameters of the unit obey the Weibull distribution. The mechanical model of the grouting concretion body under the action of water-force coupling is simplified into a plane strain problem in RFPA software for research (see Figure 1). The physical and mechanical parameters of grouting concretion body are shown in Table 1. The displacement loading method is adopted, and the displacement increment of each step is 0.005 mm/step. As the grouting concretion body belongs to brittle material, which is compressive but not tensile, the constitutive relationship of grouting concretion body in numerical simulation is simplified to elastic brittleness, as shown in Figure 2.
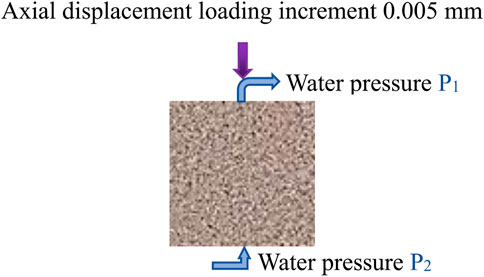
FIGURE 1. Numerical model.
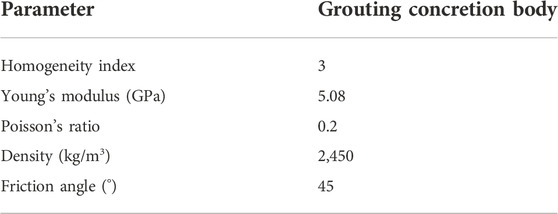
TABLE 1. Physical and mechanical parameters of grouting concretion body.
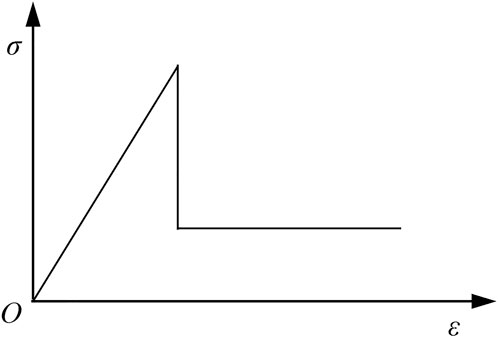
FIGURE 2. Elastic-brittle constitutive relationship of grouting concretion body.
In order to study the influence of different water pressure on the failure characteristics of grouting concretion body, the compressive strength of grouting concretion body is 12.55 MPa, the upper boundary water pressure P1 is 1 MPa, and the lower boundary water pressure P2 is 3 MPa, 5 MPa and 7 MPa respectively. Each sample is marked as WP3, WP5 and WP7 respectively. In order to study the failure characteristics of grouting concretion bodies with different compressive strengths under the action of water-force coupling, the upper boundary water pressure and the lower boundary water pressure of the numerical model are taken as 1 MPa and 5 MPa respectively, and the compressive strengths of the grouting concretion bodies are 7.55 MPa, 12.55 MPa and 17.55 MPa respectively. Each sample is marked as CS7, CS12 (WP5) and CS17 respectively. Note: In two different comparative tests, WP5 sample and CS12 sample are the same sample.
Numerical simulation results and analysis
Comparative analysis of specimen fracture morphology
Figure 3 shows the failure modes of water pressure samples with the same strength and different lower boundaries. It can be seen from Figure 3 that when the lower boundary water pressure is 3 MPa, the fracture morphology of the sample is the most serious, and a serious fracture zone appears on the right side of the sample. When the water pressure at the lower boundary is 7 MPa, the fracture morphology of the sample is relatively light, and only a macroscopic crack appears in the lower left corner of the sample. When the water pressure at the lower boundary is 5 MPa, the fracture severity of the sample is between the lower boundary water pressure of 3 MPa and 7 MPa, and a serious fracture zone appears in the lower right corner of the sample. The above numerical test phenomenon shows that the smaller the lower boundary water pressure the specimen bears, the more serious the fracture morphology of the specimen. The reason for the above test phenomenon is that the lower the water pressure at the lower boundary is, the lower the softening degree of the sample is, and the sample is more prone to brittle fracture under external load. The greater the water pressure at the lower boundary, the higher the softening degree of the sample, and the sample is more likely to crack in a certain local area under the action of external load.
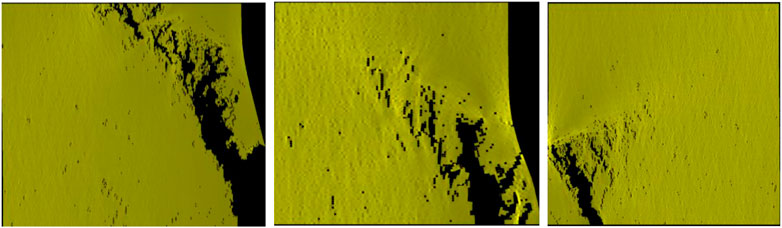
FIGURE 3. Failure modes of water pressure samples with the same strength and different lower boundaries.
Figure 4 shows the failure modes of samples with different strength under water pressure at the same lower boundary. As can be seen from Figure 4, when the compressive strength of the sample is 17.55 MPa, the fracture morphology of the sample is the most serious, and multiple macroscopic penetrating fracture zones appear on the right side of the sample. When the compressive strength of the sample is 7.55 MPa, the fracture morphology of the sample is relatively light, and only a macroscopic crack appears in the lower right corner of the sample. When the compressive strength of the sample is 12.55 MPa, the fracture severity of the sample is between the compressive strength of 7.55 MPa and 17.55 MPa. A macroscopic crack also appears in the lower right corner of the sample, and there is a macroscopic penetrating crack in the upper left side of this macroscopic crack. The above numerical test phenomenon shows that the greater the compressive strength of the sample, the more serious the fracture morphology of the sample.
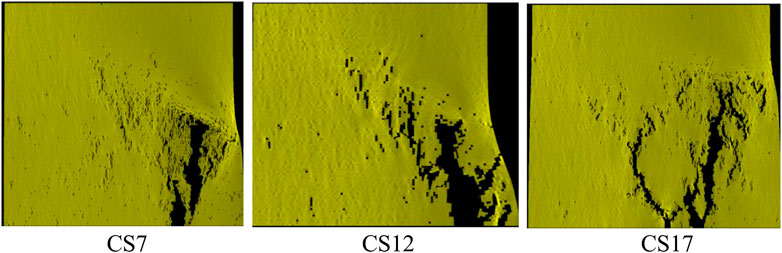
FIGURE 4. Failure modes of samples with different strength under water pressure at the same lower boundary.
Figure 5 shows the fracture process of WP5 sample (with compressive strength of 12.55 MPa and lower boundary water pressure of 5 MPa). Under the influence of inhomogeneity, the unit with weak strength in the sample first breaks, as shown in Figure 5A,B. Continue to load. Since the water pressure at the lower part of the sample is higher than that at the upper part, the lower part of the sample also breaks, as shown in Figure 5C. Under the combined action of external force and water pressure, the cracks inside the sample and the cracks at the lower boundary of the sample slowly penetrate, as shown in Figure 5D,E. When the external force further increases and exceeds the compressive strength of the rock mass, the crack already penetrated in the lower right corner of the sample further increases and finally forms a macroscopic crack, as shown in Figure 5F.
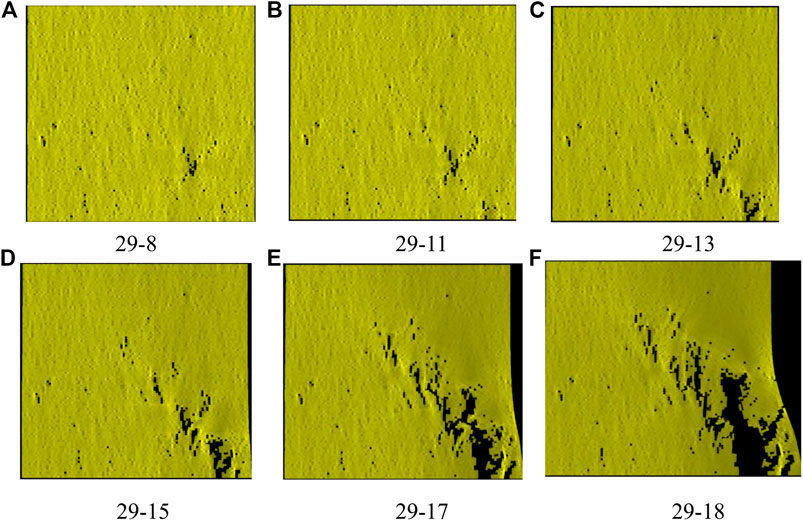
FIGURE 5. Fracture process of WP5 (CS5) sample. Loading step 29-8, Loading step 29-11, Loading step 29-13, Loading step 29-15, Loading step 29-17, Loading step 29-18.
Comparative analysis of AE parameters
As shown in Figures 6, 7, when the water pressure at the lower boundary is 3 MPa, the AE quantity reaches the maximum of 134 at step 26 (see Table 2), and the AE energy reaches the maximum of 0.15 J at step 27. When the water pressure at the lower boundary is 5 MPa, the AE quantity and energy have two peaks. The AE quantity reached the maximum of 123 at step 25, and the AE energy also reached the maximum of 0.1 J at step 25. At the beginning of the force, the AE quantity shows a sudden rise and fall phenomenon at the third step. Moreover, the quantity and energy of AE also appear the first peak at step 23. When the quantity and energy of AE reach the peak for the second time, the sample is completely destroyed. The appearance of the first peak can be used as an early warning, indicating that the sample is about to be completely destroyed. When the water pressure at the lower boundary is 7 MPa, the AE quantity reaches the maximum value of 101 at step 22, and the AE energy reaches the maximum value of 0.06 J at step 22. At the beginning of the force, the quantity of AE shows a sudden rise and fall phenomenon at the third step. No matter what kind of water pressure the sample is subjected to, the AE cumulative quantity curve and the AE cumulative energy curve are relatively smooth, and there is no obvious jump phenomenon. It can be seen from the above analysis that with the increase of water pressure at the lower boundary, the times when the maximum value of AE quantity and energy occurs are earlier.
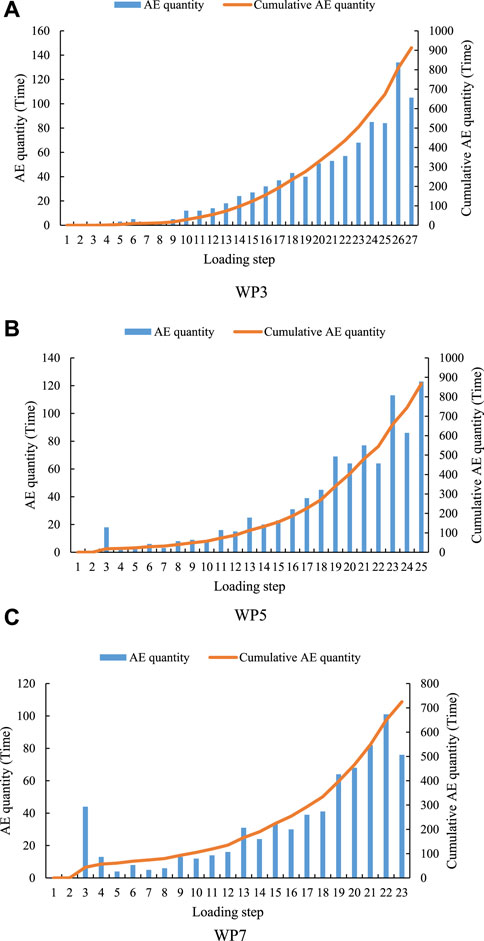
FIGURE 6. Variation trend of AE quantity of water pressure samples with the same strength and different lower boundary.
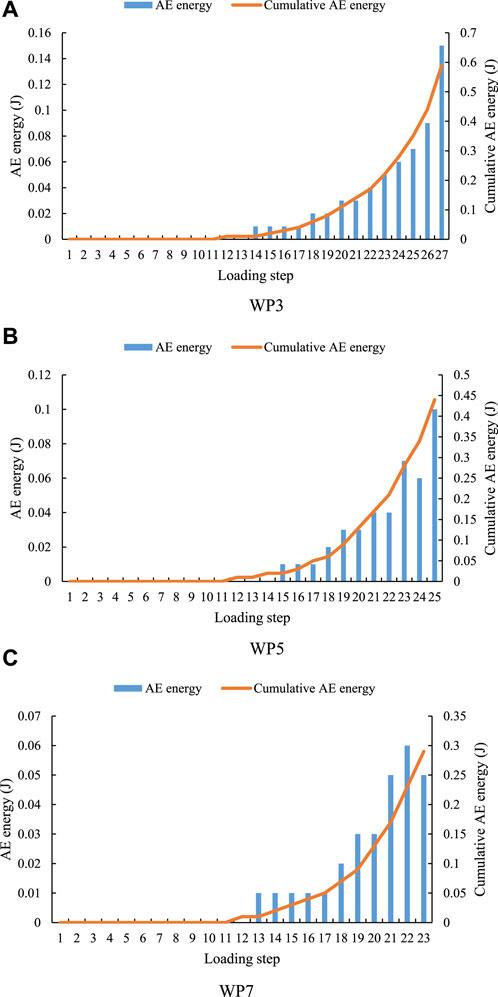
FIGURE 7. AE energy variation trend of water pressure samples with the same strength and different lower boundaries.
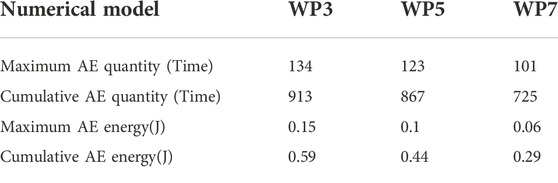
TABLE 2. AE values of different lower boundaries water pressure samples with the same strength.
As shown in Figures 8, 9, when the compressive strength of the sample is 7.55 MPa, the AE quantity of the sample reaches the maximum of 115 at step 13 (see Table 3), and the AE quantity shows a sudden rise and fall phenomenon at step 3. The AE energy of the sample appears in step 10. Continue loading, and the AE energy reaches the maximum value of 0.04 J in step 14. When the compressive strength of the sample is 17.55 MPa, the AE quantity of the sample reaches the maximum of 132 in step 36, and the AE energy also reaches the maximum of 0.23 J in step 36. Since CS12 and WP5 are the same sample, the variation trend of AE quantity and energy of CS12 sample is shown in sample WP5. It can be seen from the above analysis that with the increase of the compressive strength of the sample, the time when the maximum value of AE quantity and energy occurs is later. This experimental phenomenon shows that the greater the compressive strength of the sample, the stronger the failure resistance of the sample. Under the same external conditions, increasing the water cement ratio of the sample can improve the service time of the sample.
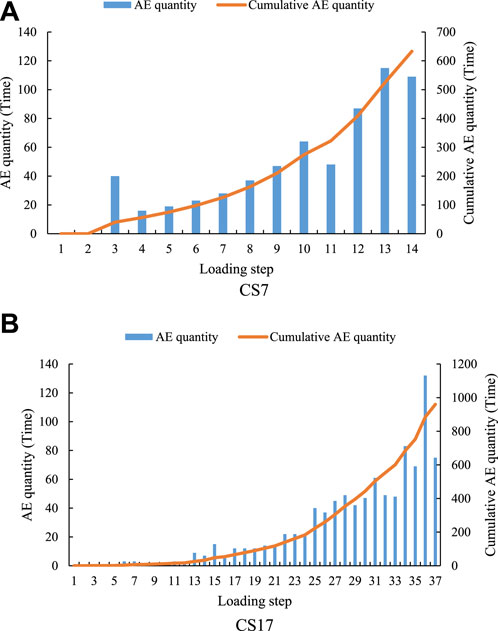
FIGURE 8. Variation trend of AE quantity of samples with different strength under the same lower boundary water pressure.
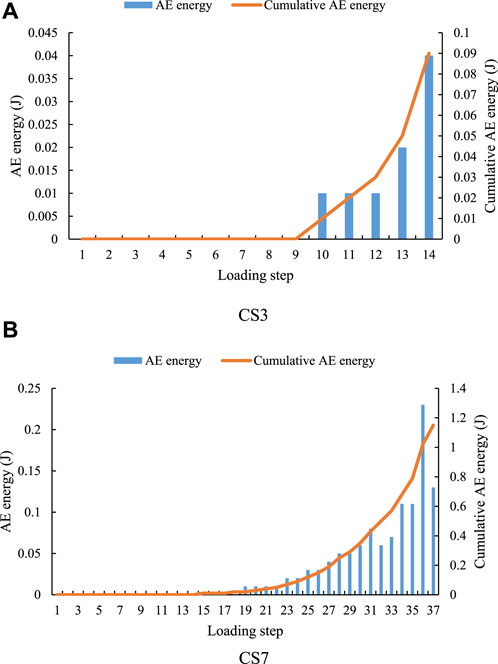
FIGURE 9. Variation trend of AE energy of samples with different strength under the same lower boundary water pressure.
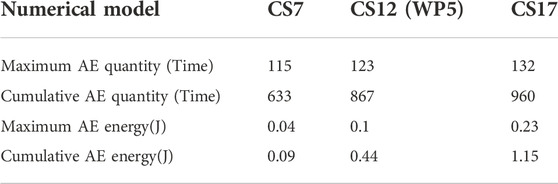
TABLE 3. AE values of samples with different strength under the same lower boundary water pressure.
As shown in Figure 10, when the water pressure at the lower boundary is 3 MPa, the maximum AE quantity, cumulative AE quantity, maximum AE energy, and cumulative AE energy are all the largest. When the water pressure at the lower boundary is 7 MPa, the maximum AE quantity, cumulative AE quantity, maximum AE energy and cumulative AE energy are all the minimum. This numerical simulation phenomenon shows that the AE decreases gradually with the increase of the water pressure at the lower boundary. Moreover, the maximum AE energy and the accumulated AE energy obviously decrease linearly.
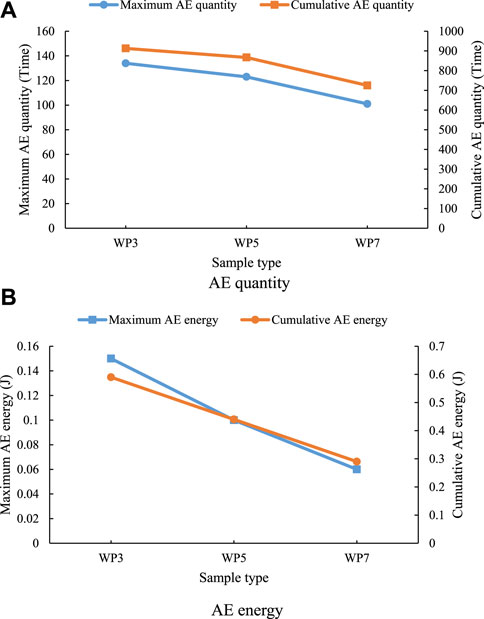
FIGURE 10. AE Comparison Curve of samples with the same compressive strength and different lower boundaries water pressure.
As shown in Figure 11, when the compressive strength is 7.55 MPa, the maximum AE quantity, cumulative AE quantity, maximum AE energy, and cumulative AE energy are all minimum. When the water pressure at the lower boundary is 17.55 MPa, the maximum AE quantity, the cumulative AE quantity, the maximum AE energy and the cumulative AE energy are all the largest. This numerical simulation phenomenon shows that the AE increases gradually with the increase of compressive strength. Moreover, the maximum AE energy and the accumulated AE energy show a significant increase.
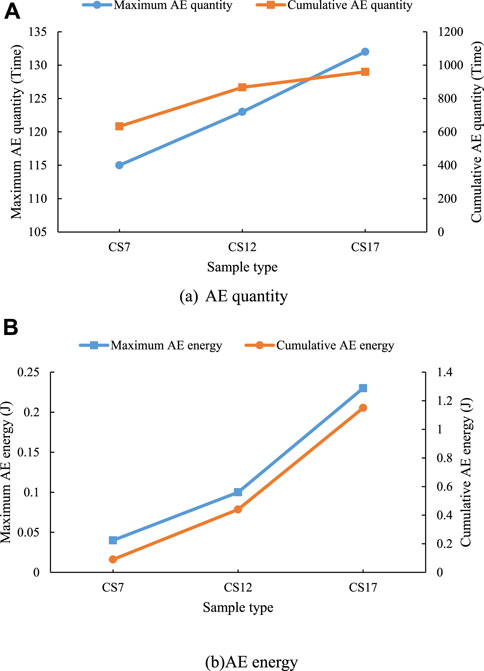
FIGURE 11. AE Comparison Curve of samples with the same lower boundaries water pressure and different compressive strength.
Comparative analysis of force
The force curves in the X direction of the three samples with the same compressive strength and different lower boundary water pressure basically do not change with the increase of external force, and the slope of the force curves in the Y direction of the growth stage is basically the same (see Figure 12). The maximum forces on the X direction of the three samples from large to small are WP3, WP5 and WP7 (see Figure 13), and their values are 13.89 N, 20.94 N and 28.13 N respectively (see Table 4). The maximum forces on the Y direction of the three samples from large to small are WP7, WP5 and WP3, and their values are 626.06 N, 565.11 N and 510.37 N respectively. Regardless of the water pressure at the lower boundary, the force in the Y direction is far greater than that in the X direction. The maximum force in X direction increases linearly with the increase of water pressure, while the maximum force in Y direction decreases linearly with the increase of water pressure.
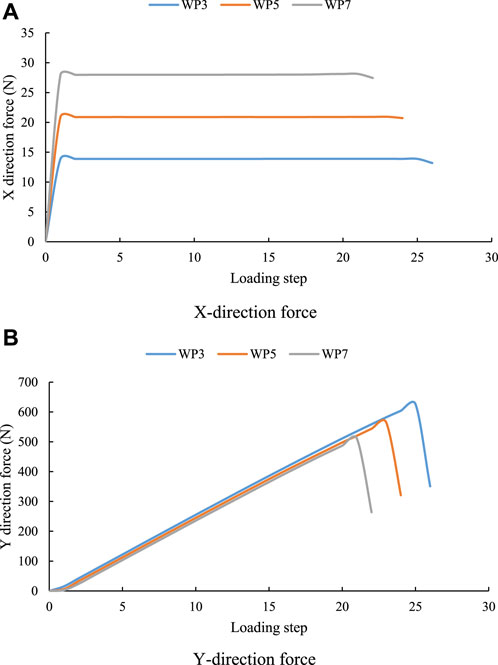
FIGURE 12. Force variation trend of samples with the same strength and different lower boundary water pressure.
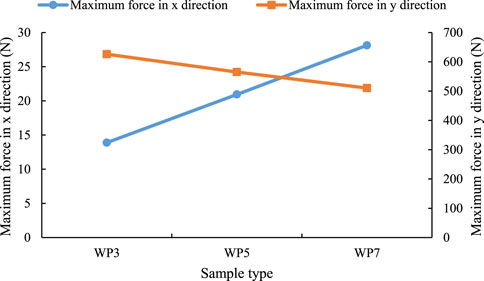
FIGURE 13. Force comparison curve of samples with the same strength and different lower boundary water pressure.
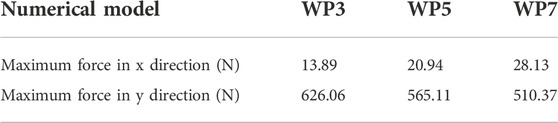
TABLE 4. Maximum force of lower boundary water pressure samples with the same strength.
The force curve in the X direction of the three samples with the same compressive strength and different lower boundary water pressure basically does not change with the increase of external force, and the slope of the force curve in the Y direction of the growth stage is basically the same (see Figure 14). The maximum forces in the X direction of the three samples are basically the same (see Figure 15), and their values are 21.02 N, 20.94 N and 20.95 N respectively (see Table 5). The maximum force values of the three samples in Y direction from small to large are CS7, CS12 and CS17, whose values are 287.59 N, 565.11 N and 864.54 N, respectively. Regardless of the compressive strength of the sample, the force in Y direction is much larger than that in X direction. The maximum force in the X direction has no obvious relationship with the compressive strength of the sample, while the maximum force in the Y direction increases linearly with the increase of compressive strength, and the increase amplitude is very large.
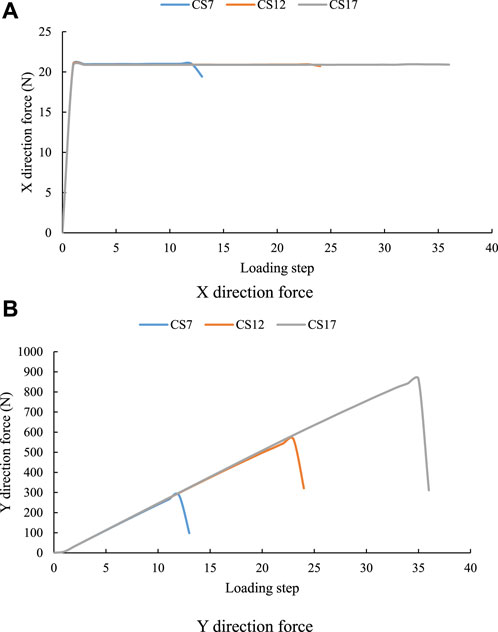
FIGURE 14. Force variation trend of samples with different strength under the same lower boundary water pressure.
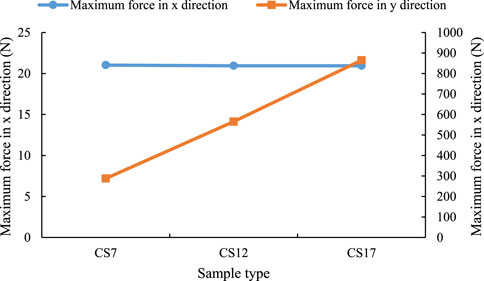
FIGURE 15. Force comparison curves of the samples with different strengths under the same lower boundary water pressure.
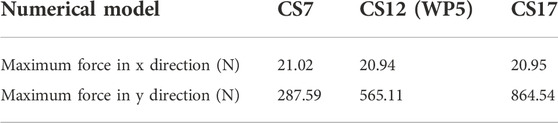
TABLE 5. Maximum force values of samples with different strength under the same lower boundary water pressure.
Conclusion
Different lower boundary water pressure and different compressive strength lead to different fracture forms of the samples. However, the force curves in the X direction all show elastic-plastic, and the force curves in the Y direction all show elastic-brittle. The greater the lower boundary water pressure is, the higher the softening degree of the sample is, and the sample is more likely to crack in a certain local area under the action of external load.
Under the same external conditions, increasing the compressive strength of the sample, that is, increasing the water-cement ratio of the sample, can improve the service life of the sample. However, the brittleness of the samples increases with the increase of the compressive strength, and the brittle fracture morphology of the samples becomes more serious.
The AE values and the maximum force in X direction of the samples with different lower boundary water pressure of the same compressive strength decrease inversely with the lower boundary water pressure. The maximum force in Y direction increases in direct proportion to the lower boundary water pressure.
The AE quantity and the maximum force in Y direction of the samples with different strength under the same lower boundary water pressure increase in positive proportion to the compressive strength of the samples. The maximum force in X direction has no correlation with the compressive strength of the sample, and the maximum force in X direction of the three samples is basically the same.
Data availability statement
The original contributions presented in the study are included in the article/supplementary material, further inquiries can be directed to the corresponding authors.
Author contributions
FT: Writing Original Draft and Data Curation; DD: Review; ZX: Conceptualization; ZG: Funding acquisition.
Funding
This study was supported by the National Natural Science Foundation of China (No. 41972255, 42207084).
Conflict of interest
The author ZG was employed by Power China Northwest Engineering Corporation Limited.
The remaining authors declare that the research was conducted in the absence of any commercial or financial relationships that could be construed as a potential conflict of interest.
Publisher’s note
All claims expressed in this article are solely those of the authors and do not necessarily represent those of their affiliated organizations, or those of the publisher, the editors and the reviewers. Any product that may be evaluated in this article, or claim that may be made by its manufacturer, is not guaranteed or endorsed by the publisher.
References
Cai, M. F. (2020). Key theories and technonogies for surrounding rock stability and ground control in deep mining[J]. J. Min. Strata Control Eng. 2 (3), 5–13. doi:10.13532/j.jmsce.cn10-1638/td.20200506.001
Chen, F., Du, Y-H., Sun, X-M., Ma, T-H., and Tang, C. (2021). Numerical experimental study on influence factors of anchoring force of constant resistance bolt. Geomat. Nat. Hazards Risk 12 (1), 424–442. doi:10.1080/19475705.2021.1880490
Chen, F., Wang, X-B., Du, Y-H., and Tang, C. (2021). Numerical analysis of the precursory information of slope instability process with constant resistance bolt. Sci. Rep. 11 (1), 21814–21910. doi:10.1038/s41598-021-01387-z
Chen, F., Wang, X-B., Du, Y-H., and Tang, C. (2022). Numerical experiment research on failure characteristics of anchored rock with negative Poisson’s ratio bolt[J]. Front. Earth Sci. 10, 1–10. doi:10.3389/feart.2022.89975
Evdokimov, P. D., Adamovich, A. N., Fradkin, L. P., and Denisov, V. N. (1970). Shear strengths of fissures in ledge rock before and after grouting. Hydrotech. Constr. 4 (3), 229–233. doi:10.1007/bf02376472
Fan, L., and Ma, X. (2018). A review on investigation of water-preserved coal mining in Western China. Int. J. Coal Sci. Technol. Technol. 5 (4), 411–416. doi:10.1007/s40789-018-0223-4
Gao, Y., Fan, Q. Z., and Wang, H. (2004). Grouting reinforcement test of rock after peak value of strength and roadway stability control[J]. Rock Soil Mech. 25 (1), 21–24. doi:10.16285/j.rsm.2004.s1.005
Han, L., Zong, Y., and Han, G. (2011). Study of shear properties of rock structural plane by grouting reinforcement[J]. Rock Soil Mech. 32 (9), 2570–2622. doi:10.16285/j.rsm.2011.09.011
He, M., Xie, H., and Peng, S. (2005). Study on rock mechanics in deep mining engineering[J]. Chin. J. Rock Mech. Eng. 24 (16), 2803–2813
Hyett, A. J., Ba Wden, W. F., and Reichert, R. D. (1992). The effect of rock mass confinement on the bond strength of fully grouted cable bolts. Int. J. Rock Mech. Min. Sci. Geomechanics Abstr. 29 (5), 503–524. doi:10.1016/0148-9062(92)92634-o
Lei, J. S., Liu, F., and Wang, Q. F. (2015). Diffusion characteristics and reinforcement mechanics of grouting in non-homogeneous soil strata[J]. Chin. J. Geotechnical Eng. 32 (12), 2245–2253. doi:10.11779/CJGE201512014
Liu, Q. S., Lei, G. F., Peng, X. X., Lu, C., and Wei, L. (2018). Rheological characteristics of cement grout and its effect on mechanical properties of a rock fracture. Rock Mech. Rock Eng. 51, 613–625. doi:10.1007/s00603-017-1340-x
Liu, Z. X., Dong, S., and Wang, H. (2021). Influences on the performance of cement-based grout used to reform the upper Middle Ordovician limestone in Hanxing mining area[J]. Arabian J. Geosciences 14 (13), 1–15. doi:10.1007/s12517-021-07512-6
Meng, B., Jing, H., Chen, K., and Su, H. (2013). Failure mechanism and stability control of a large section of very soft roadway surrounding rock shear slip. Int. J. Min. Sci. Technol. 23 (1), 127–134. doi:10.1016/j.ijmst.2013.03.002
Nikbakhtan, B., and Osanloo, M. (2009). Effect of grout pressure and grout flow on soil physical and mechanical properties in jet grouting operations. Int. J. Rock Mech. Min. Sci. (1997). 46 (3), 498–505. doi:10.1016/j.ijrmms.2008.10.005
Niu, X., Wang, H., and Liu, S. (2017). Application and development trends on grouting reconstruction technology for floor karst aquifers of lower group coal seam in Northern China coal field[J]. Mine Constr. Technol. 38 (3), 24–30. doi:10.19458/j.cnki.cn11-2456/td.2017.03.008
Pan, R., Cheng, H., and Wang, L. (2020). Experimental study on bearing characteristics of bolt grouting in shallow fractured surrounding rock of roadway[J]. Rock Soil Mech. 41 (6), 1887–1898. doi:10.16285/j.rsm.2019.6448
Tang, C. A. (2003). Numerical experiments of rock failure process[M]. Beijing: Science Press. (in Chinese).
Tang, C. A., Liu, H., Lee, P. K. K., Tsui, Y., and Tham, L. G. (2000). Numerical studies of the influence of microstructure on rock failure in uniaxial compression - Part I: Effect of heterogeneity. Int. J. Rock Mech. Min. Sci. (1997) 37 (4), 555–569. doi:10.1016/s1365-1609(99)00121-5
Tuerkmen, S., and Oezguezel, N. (2003). Grouting a tunnel cave-in from the surface: A case study on kurtkula irrigation tunnel, Turkey[J]. Tunn. Undergr. Space Technol. Incorporating Trenchless Technol. Res. 18 (4), 365–375. doi:10.1016/S0886-7798(03)00007-5
Wael, M., Ahmed Salih, M., and Parveen, S. (2021). Interpreting the experimental results of compressive strength of hand-mixed cement-grouted sands using various mathematical approaches[J]. Archives Civ. Mech. Eng. 22 (1), 1–25. doi:10.1007/s43452-021-00341-0
Wang, H., Gao, Y., and Li, S. (2007). Uniaxial experiment study on mechanical properties of reinforced broken rocks pre-and-post grouting[J]. Chin. J. Undergr. Space Eng. 3 (1), 27–39.
Wang, Q., Gao, H. K., Yu, H. C., Jiang, B., and Liu, B. (2019). Method for measuring rock mass characteristics and evaluating the grouting-reinforced effect based on digital drilling. Rock Mech. Rock Eng. 52, 841–851. doi:10.1007/s00603-018-1624-9
Wang, Q., He, M. C., Yang, J., Gao, H., Jiang, B., and Yu, H. (2018). Study of a no-pillar mining technique with automatically formed gob-side entry retaining for longwall mining in coal mines. Int. J. Rock Mech. Min. Sci. 110, 1–8. doi:10.1016/j.ijrmms.2018.07.005
Xie, H., Gao, F., and Yang, J. (2015). Research and development of rock mechanics in deep ground engineering[J]. Chin. J. Rock Mech. Eng. 34 (11), 2161–2178. doi:10.13722/j.cnki.jrme.2015.1369
Xiujun, W., Gao, M., and Lv, Y. C. (2012). Evolution of a mining induced fracture network in the overburden strata of an inclined coal seam[J]. Int. J. Min. Sci. Technol. 22 (6), 775–779. doi:10.1016/j.ijmst.2012.11.004
Yang, T. (2004). Seepage characteristic in rock failure: Theory, model and application[M]. Beijing: Science Press. (in Chinese).
Zhang, C., Chang, J., and Li, S. (2019). Experimental study comparing the microscopic properties of a new borehole sealing material with ordinary cement grout[J]. Environ. Earth Sci. 78 (5), 1–11. doi:10.1007/s12665-019-8165-8
Zhang, F., and Barry, L. (2019). A numerical study to assist assessment of the stability of shallow coal mine goafs. Geotech. Geol. Eng. (Dordr). 37 (4), 2837–2846. doi:10.1007/s10706-018-00799-5
Zhang, Q. S., Zhang, L. Z., and Liu, R. (2015b). Laboratory experimental study of cement-silicate slurry diffusion law of crack grouting with dynamic water[J]. Rock Soil Mech. 36 (8), 2159–2168. doi:10.16285/j.rsm.2015.08.005
Zhang, R., Dai, F., Gao, M. Z., Xu, N., and Zhang, C. (2015a). Fractal analysis of acoustic emission during uniaxial and triaxial loading of rock. Int. J. Rock Mech. Min. Sci. (1997). Min. Sci. 79, 241–249. doi:10.1016/j.ijrmms.2015.08.020
Zhao, K., Wang, H., and Xu, W. (2017). Experimental study on seepage characteristics of rock-like materials with consecutive and filling fractures[J]. Chin. J. Geotechnical Eng. 39 (6), 1130–1136. doi:10.11779/CJGE201706020
Zhou, D., Zhao, Z., Bo, L., Chen, Y., and Ding, W. (2020). Permeability evolution of grout infilled fractures subjected to triaxial compression with low confining pressure. Tunn. Undergr. Space Technol. 104, 103539. doi:10.1016/j.tust.2020.103539
Zhou, W., Yang, R., and Yan, G. (1993). Study on the efficacy of grouting reinforcement of slightly weathered rock masses at the Ertan arch dam abutments[J]. Chin. J. Rock Mech. Eng. 12 (2), 138–150.
Keywords: rock mechanics, water-force coupling, stress, acoustic emission, numerical simulation
Citation: Tang F, Dong D, Xiao Z and Guan Z (2023) Analysis of failure characteristics of grouting concretion body under the action of water-force coupling. Front. Earth Sci. 10:1084117. doi: 10.3389/feart.2022.1084117
Received: 30 October 2022; Accepted: 21 November 2022;
Published: 20 January 2023.
Edited by:
Long Fan, University of Alaska Fairbanks, United StatesReviewed by:
Kun Zhang, Henan Polytechnic University, ChinaXingzong Liu, Ludong University, China
Yu Zhang, Tsinghua University, China
Copyright © 2023 Tang, Dong, Xiao and Guan. This is an open-access article distributed under the terms of the Creative Commons Attribution License (CC BY). The use, distribution or reproduction in other forums is permitted, provided the original author(s) and the copyright owner(s) are credited and that the original publication in this journal is cited, in accordance with accepted academic practice. No use, distribution or reproduction is permitted which does not comply with these terms.
*Correspondence: Donglin Dong, ZGRsQGN1bXRiLmVkdS5jbg==; Zilong Guan, MjAxNzAyOTAwN0BjaGQuZWR1LmNu