 Ning Jiang1,2,3*
 Ke Lv
Ke Lv- 1State Key Laboratory of Mine Disaster Prevention and Control, Shandong University of Science and Technology, Qingdao, China
- 2College of Energy and Mining Engineering, Ministry of Education, Shandong University of Science and Technology, Qingdao, China
- 3General Institute of Exploration and Research of China National Administration of Coal Geology, Beijing, China
- 4Shandong Geology and Mineral Resources Engineering Group Co., Ltd., Jinan, China
- 5Department of Mining Engineering, Lvliang College, Lvliang, China
Various fractures and holes in the natural rock mass affected the mechanical properties of the rock mass and the safety construction of engineering. In this study, we investigated the mechanical properties of a single fracture-hole rock specimen using particle flow code 2D (PFC2D) numerical simulation software and through laboratory tests. We analysed the failure behaviours and mechanical properties of the rock specimen with a single fracture-hole specimen under different fracture angles. The failure modes of single fractured rock samples with different fracture angles were revealed. The fracture propagation and stress evolution of the rock specimen with a single fracture-hole under different fracture angles were investigated. The experimental results shown that the peak strength, peak strain, elastic modulus, initial fracture stress, and damage stress of the single fracture-hole rock specimen with different fracture angles were significantly less than those of the intact rock specimen. Moreover, fracture hole defects accelerated the generation of fractures and promote the failure of the rock specimen. The failure modes were divided into Y, inverted Y, and V types. Before the rock specimen fractures, the stress concentration area was mainly distributed at both ends of the fracture. The stress concentration area at both ends of the fracture gradually decreased, and the stress concentration area near the hole gradually increased as the fracture angle increased. By experiments, the acoustic emission of the model had gone through three stages: initial, steady growth, and rapid decline. The size of the inclination angle affected the number of acoustic emission hits and the generation of acoustic emission signals. Failure behaviours of the rock specimen with a single fracture-hole were systematically investigated, which could promoted the development of fracture rock mechanics and improved the understanding of instability failure mechanism in rock engineering, such as nuclear wasted treatment engineering and deep underground engineering.
1 Introduction
Rocks were affected by a series of geological actions due to long-term geological movement, resulted in the occurrence of various types of defects inside and on the surface of rocks (Wang et al., 2018; Pan et al., 2019; Zhao et al., 2019; Yin et al., 2021; Qi XH, 2022). The mechanical properties of rocks with different types of defects vary greatly compared with intact rocks (Zhang and Wong, 2012; Wu et al., 2016; Yang et al., 2016; Zhang et al., 2019; Zhou et al., 2019; Chen et al., 2021). In recent years, with the development of various underground projects, such as water conservancy projects, bridge and tunnel projects, and mining projects, several fractures and holes were generated in rocks, leading to changes in the mechanical properties of rock mass (Brantut et al., 2013; Zhang et al., 2016; Sqy et al., 2017; Zhang et al., 2020). Therefore, it was of great significance to study the failure characteristics and mechanical properties of rock with a single fracture-hole for effective operations of various underground projects.
At present, there were increasingly the experimental studies and numerical simulations reported on defective rock. Specifically, the failure characteristics and mechanical properties of rocks with different types of defects were analysed in terms of pore morphology and fracture length. Based on the existing literature, many researchers obtained successful results regarding conventional holes, fractures, and pore-fracture combinations. Lin et al. (2020a) (Zhang and Yin, 2014) used acoustic emission (AE) and digital image correlation (DIC) techniques to analyse the results of a series of uniaxial compression tests on defective rocks with double circular holes, and fully realized the mechanical properties and fracture mechanism of holes in defective rocks. Yang et al. (2016) (Lin et al., 2020a) conducted uniaxial compression tests of brittle sandstone samples with a single fracture using rock mechanics servo control test system, and the influence of fracture penetration on strength and deformation failure behaviour of brittle sandstone samples with single fracture was analysed. Ma et al. (2021) (Yang and Jing, 2011) studied the experimental results of a square rock containing two parallel discontinuous rough fractures under uniaxial compression load. The results shown that the initiation and propagation of this type of fracture reduced the mechanical properties of the specimen before reaching its peak strength. The interaction of fracture parameters had a significant indigenous effect on the compressive strength and deformation modulus. Lin et al. (2020b) (Asadizadeh et al., 2018) studied the mechanical properties of a double circular fracture-hole rock under uniaxial compression using the discrete element method. The experimental results shown that the existence of holes and fractures would reduce the mechanical properties of rock. Chen et al. (2020a) (Lin et al., 2020b) performed uniaxial compression tests of rock with 10 different types of hole defects using PFC2D, and the failure behaviour and mechanical properties were analysed. The results shown that the hole shape had an influence on the stress distribution around the hole, and the hole defects reduce the damage degree of the rock. Ma et al. (2021) (Chen et al., 2020a) conducted uniaxial compression tests using PFC2D to study the failure mechanism of sandstone samples with double-hole and double-fracture combination defects. Wu et al. (2019)) studied the effect of the interaction between holes and fractures on the coalescence behaviour of fractures around holes based on the uniaxial compression test and particle flow code (PFC).
For other types of defective rocks, various relevant studies had also been conducted. Lu et al. (2021) proposed that the dip angle had a significant influence on the strength anisotropy of the columnar jointed rock by analysing the failure mode and failure mechanism of the columnar jointed rock under different load conditions. Liu et al. (2017) (Lu et al., 2021) studied the influence of the number of cross-fractures, fracture angle, and fracture spacing on the defective rock by PFC3D and revealed the damage and fracture mechanism of the fractured rock under uniaxial compression. Asadizadeh et al. (2019) (Liu et al., 2017) conducted experiments on artificial fractured rocks with several discontinuous rough fractures under uniaxial compression. Through the multivariate statistical analysis, the effects of the four parameters, such as fracture roughness coefficient, bridge length, bridge angle, and fracture angle, on uniaxial compressive strength, deformation modulus, and fracture coalescence stress of fractured rocks were studied. Bahaaddini et al. (2013) (Asadizadeh et al., 2019) modelled SRM using the discrete element software PFC3D and studied the influence of fracture geometry parameters on the rock failure mechanism, unconfined compressive strength, and deformation modulus. The results shown that the fracture direction and step angle were the main factors that determine the failure mode of rock, and the fracture direction relative to the principal stress direction was the most important parameter that affects rock properties. Huang and Yang (2016) (Bahaaddini et al., 2013) carried out a series of PFC2D numerical simulations on sandstone samples with three parallel fractures under uniaxial compression. The influence of fracture dip angle on stress-strain curve, strength and deformation parameters, and fracture evolution characteristics in sandstone with three fractures were analysed in detail. Dai et al. (2019) (Huang and Yang, 2016) conducted a numerical simulation by using the parallel bond particle model containing two intersecting fractures. The intersection angle of the two fractures was used to perform the numerical simulation. Moreover, they studied the effects of the intersection and inclination angles on the peak stress, fracture initiation stress and fracture coalescence stress. Cheng et al. (2019) (Dai et al., 2019) numerically simulated the plate fracture model and performed laboratory tests on specimens with various shape echelon defects, compared the variation trend of fracture initiation stress and peak stress in the simulation and experiment, and explained the influence of the fracture array angle on fracture initiation stress and peak stress.
The research materials of the aforementioned studies were specimens with only simple defects or those with simple superposition of different defects. There were few studies on the mechanical properties and failure process of some rocks with complex defect, while the rock defects in the actual geotechnical engineering were mostly complex combined defects. With the above problems of pre-fabricated rock defects, in this study, we used the single fracture-hole composite defect specimen with a more complex defect combination as the research object. We conducted uniaxial compression tests on a single fracture-hole rock specimen in the laboratory.
2 Methodology
Due to the complex operation and large workload, it was difficult to analyse the influence of different fracture angles on the mechanical properties and failure characteristics of a single fracture-hole rock specimen via experiments. Compared with physical tests, numerical analysis was simple, convenient, and cheap, had high repeatability, and could address the problem of an insufficient number of experiments. Therefore, in this study, we used the particle flow numerical simulation software to analyse the mechanical properties and failure characteristics of a single fracture-hole rock specimen.
2.1 Overview of particle flow code
The PFC was based on the discrete element method proposed by Cundall in 1979 (Cheng et al., 2019), which simulates the motion and interaction of circular granular media through the discrete element method. The composite material of the PFC model consisted of solid particles, which interacted with each other to illustrate their behaviour. The PFC model represents the independent motion and interaction between different particles in internal force contact. In the PFC software, the particle shape could be described in the form of a two-dimensional disk or three-dimensional sphere, and the characteristics and particle parameters of particles in a discontinuous environment could be analysed.
In PFC2D, contact and parallel connections could be used to simulate the connection between rock particles. A contact connection could only transfer force between units, while a parallel connection could transfer both force and torque. Parallel keys in parallel links could be regarded as a set of elastic springs with constant normal and shear stiffness, uniformly distributed on the cross-section of the contact plane (two-dimensional rectangular and three-dimensional disc) and centred on the contact point. These springs act parallel to the springs of the linear component. The relative motion occured at the contact after the parallel bond was formed, resulting in both force and torque in the bonding material. This force and torque acted on two contact blocks was related to the maximum normal and shear stresses of the bonding material around the bonding. If any of these maximum stresses exceed the corresponding bond strength, the bond material, along with its associated force, moment, and stiffness, was removed from the model. In this study, the uniaxial compression test of rock specimen was simulated using parallel keys (Figure 1).
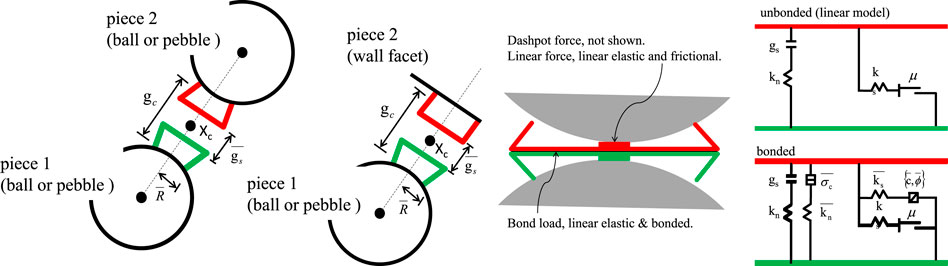
FIGURE 1. Parallel bond model (Cundall and Strack, 1979).
2.2 Model and boundary condition
It was necessary to determine the mechanical parameters and bond properties of microscopic particles in rock when simulating the rock specimen with PFC2D. However, these parameters could not be obtained directly through laboratory tests. Therefore, it was necessary to select and validate microscopic parameters before performing numerical simulations. Many numerical simulations were conducted to ensure that the simulation test conditions were consistent with the laboratory test. Then, the numerical simulation results were compared with the laboratory test results, and the microscopic mechanical parameters of the particles were adjusted repeatedly through trial and error (Holt et al., 2005) until the simulation test requirements were met.
Figure 2 shown the comparison of the final calibration results between the laboratory and numerical tests. Based on the figure, the stress-strain curve was similar in shape and the failure mode was in good agreement. Table 1 shown that the determined final microscopic parameters.
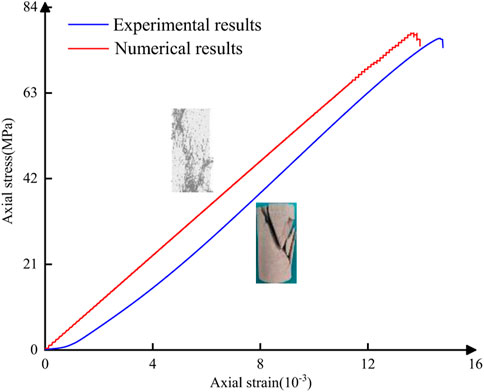
FIGURE 2. Comparison of calibration numerical and experimental results.
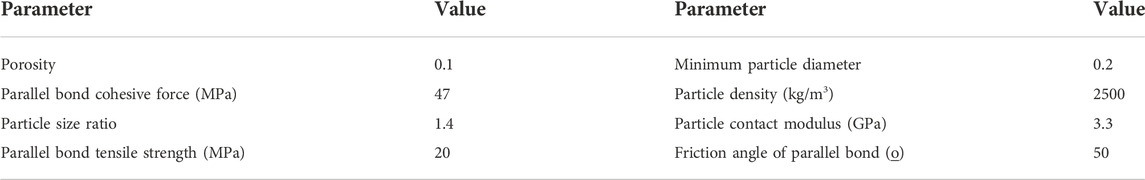
TABLE 1. Micro-parameters of the model in the numerical simulation.
The mechanical properties and failure characteristics of single fracture-hole rock specimen with different fracture angles were studied using PFC2D, and the numerical models of a single fracture-hole rock specimen with different fracture angles were established. The width and height of the model specimen were 50 and 100 mm, respectively. The circular hole had a radius of 5 mm. The lower and right boundaries of the circular distance were 20 and 20 mm, which were located in the centre below the model. The fracture width and length were 0.5 and 10 mm, respectively. The angles between the fracture centre and the horizontal direction of the rock specimen were set to 0°, 15°, 30°, 45°, 60°, 75°, and 90°. The geometric parameters and numerical model of the specimen were shown in Figure 3. The plane stress model was adopted, which was loaded by the displacement loading at a rate of 0.01 mm/s.
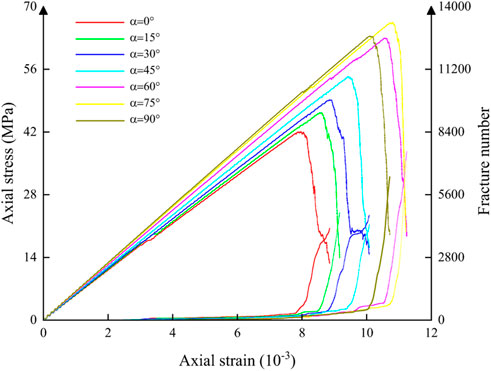
FIGURE 3. Stress-strain curve and fracture number-strain curve of a single fracture-hole rock specimen.
2.3 Analysis of the numerical simulation results
2.3.1 Stress evolution law
To increase the efficiency of the experimental data, the subsequent data changes would had no significant effect on this simulation when the stress decreased to 30% of the peak stress. Thus, we did not calculate it. Compared with the stress-strain law of the intact rock, the fracture angle had no significant effect on the stress-strain law of a single fracture-hole rock specimen. In addition, they had experienced the initial fracture compaction stage, linear elastic deformation stage, non-linear deformation stage, and post-peak softening stage.
The strain-stress curves of the intact rock and single fracture-hole rock specimen with different fracture angles were shown in Figures 3, 4, and the stress-strain curve and the number of the fractures-strain curve with the same fracture angle were in the same colour.
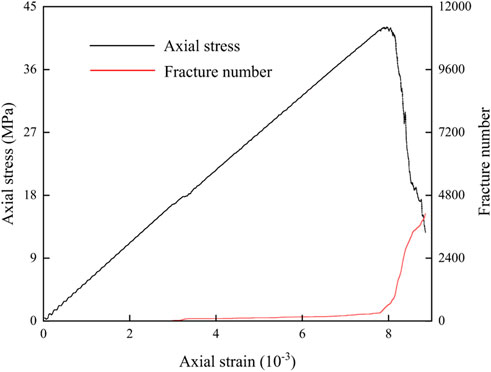
FIGURE 4. Complete rock stress-strain curve and fracture number-strain curve.
In Figure 3, the peak strength of the single fracture-hole rock model and the time to reach the peak strength gradually increase as the fracture angle increases. This was because the hole and fracture defects weaken the brittleness of the rock and increase its ductility, verifying the accuracy of the laboratory test. In Figure 3, the stress-strain curve divided the deformation of the single fracture-hole rock model into four stages: pore fracture compaction, elastic deformation, plastic deformation, and post-fracture. The stress decreased rapidly when the stress exceeded the peak stress.
In Figure 4, the strain-stress curve of the intact rock model was similar to that of the single fracture-hole rock model. Before reaching the peak, the rock model shown plastic deformation, and the image shown linear growth at this stage. After reaching the peak strength, the stress decreased rapidly, indicated that the rock had a typical brittle failure, which was related to the laboratory test material of red sandstone. The above conclusions were consistent with the numerical simulation results of other scholars (Chen et al., 2020b).
2.3.2 Elastic modulus and number of fractures
The relationship between elastic modulus and fracture number of the intact rock model and single fracture-hole rock model with different fracture angles was shown in Figure 5. Based on the figure, with the increasing fracture angle of the single fracture-hole rock model, the elastic modulus gradually increases, and there was no huge fluctuation. When fracture angle changed from 0° to 90°, the growth rate at each stage was small, and the maximum was not more than 1.5 GPa. In addition, the number of fractures increased and decreased in stages as the fracture angle of the single fracture-hole rock model increased. When the fracture angle was 0°–45°, the number of fractures was significantly lower than that when the fracture angle was 60°–90°. With the increase of the fracture angle, the number of fractures increases periodically, the elastic modulus increases, and the bearing capacity of the single fracture-hole rock model decreases. The number of fractures in the intact rock model was much larger than that in the single fracture-hole rock model with different fracture angles. In addition, the total number of fractures in the rock model decreased as the fracture angle decreases. In practical geotechnical engineering, pre-fabricated horizontal fractures and holes could was considered to reduce the number of fractures generated during rock failure to control the degree of rock failure.
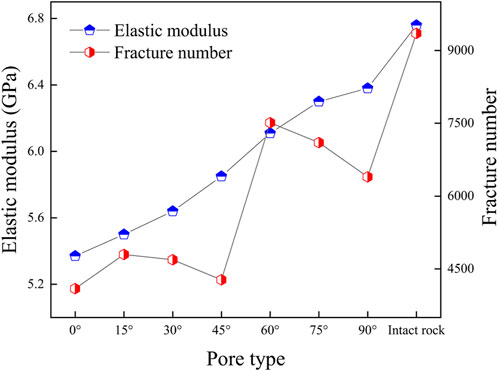
FIGURE 5. Relationship between elastic modulus and fracture number of single fracture-hole rock model with different fracture angles.
2.3.3 Peak stress and peak strain
Peak stress was the maximum stress value of rock during uniaxial compression. It represented the maximum strength and beared capacity of rock and was an important parameter to study the mechanical properties of rock. In Figure 6, the peak stress values of the intact rock model and single fracture-hole rock model shown an increasing trend, and the growth trend of peak stress was consistent with the growing trend of peak strain. With the increase of fracture angle, the values of peak stress and peak strain of single fracture-hole rock model gradually increased. Based on Figure 6, the peak stress and peak strain values of the single fracture-hole rock model and the complete rock model were different.
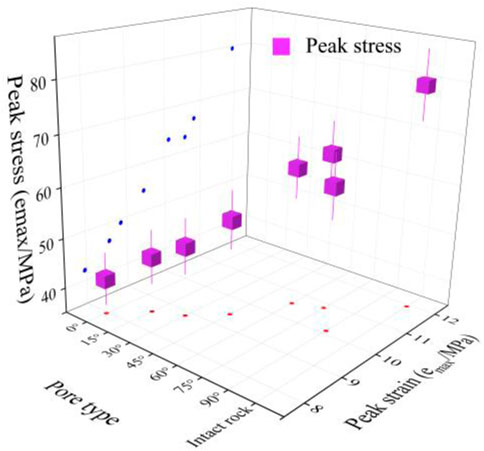
FIGURE 6. Peak stress and peak strain model diagram of the single fracture-hole rock model with different angles of the intact rock and fracture.
2.4 Failure analysis of the rock model
2.4.1 Initiation stress and damage stress of the rock model
In the uniaxial compression test of the rock model, the rock model bore the axial loading stress. Under its action, the contact force between the particles of the rock model was greater than the cohesive force such that the stress concentration occurs in a certain area of the rock model, and local damage occurred, resulted in micro-fractures. The axial stress corresponding to the first occurrence of micro-fractures was the initiation stress. The fracture gradually extended, and the number of fractures increased as the axial stress of the rock model increased. When the axial stress increases to a peak value, the growth rate of the fracture reaches the peak value, and the axial stress of the rock model was called the damage stress.
Fracture initiation stress
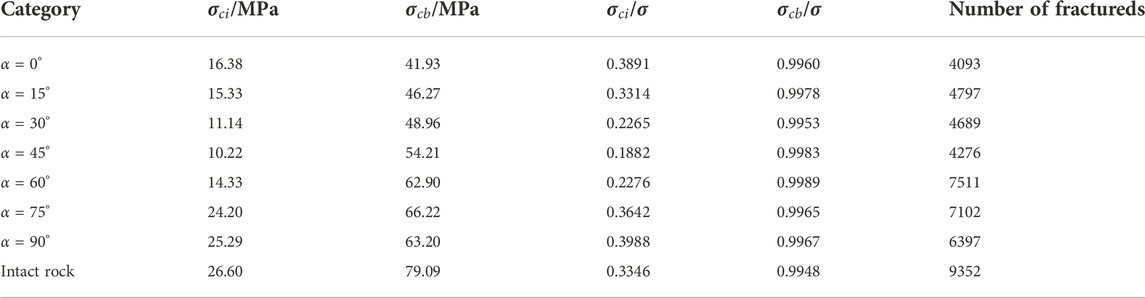
TABLE 2. Relationship between initiation stress, damage stress, fracture number, and uniaxial compressive strength of the rock model.
The fracture initiation stress and damage stress of the intact rock model and single fracture-hole rock model with different fracture angles were shown in Figure 7. Based on the figure, the initiation and damage stresses of the single fracture-hole rock model with different fracture angles were smaller than those of the intact rock model, and their values were 26.60 and 79.09 MPa, respectively. The fracture initiation stress of the single fracture-hole rock model shown a decreasing trend at 0°–45° and an increasing trend in 60°–90°. The damage stress of a single fracture-hole rock model shown an increasing trend, and the growth rate was close. The above phenomena shown that the change of the fracture angle of a single fracture-hole rock model intensifies the failure process of rock model.
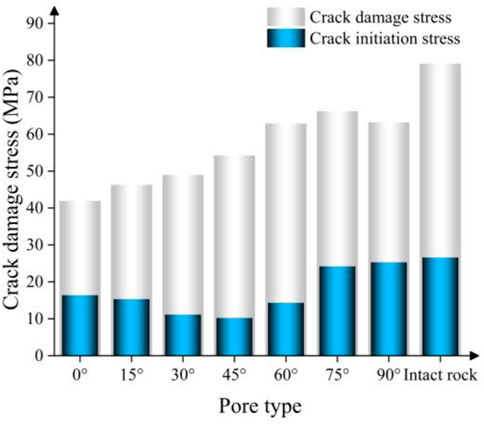
FIGURE 7. Relationship between initiation stress and damage stress of the intact rock model and single fracture-hole rock with different fracture angles.
2.4.2 Failure characteristics and stress evolution of the rock model
The initiation, damage, peak value, and final failure time of the rock model were used as the characteristic moments for comparison to study the failure characteristics of the rock model and the development process of fractures in the uniaxial compression process of the single fracture-hole rock model and intact rock model with different fracture angles. Figure 8 shown the macroscopic failure process of the single fracture-hole rock model and intact rock model with different fracture angles. It was apparent that the complete rock model and the single fracture-hole rock model with different fracture angles were mainly tensile fractures. The shear fractures were relatively small (red was tensile fractures, blue was compressive shear fractures, and green was tensile shear fractures) compared than that in the single fracture-hole rock model.
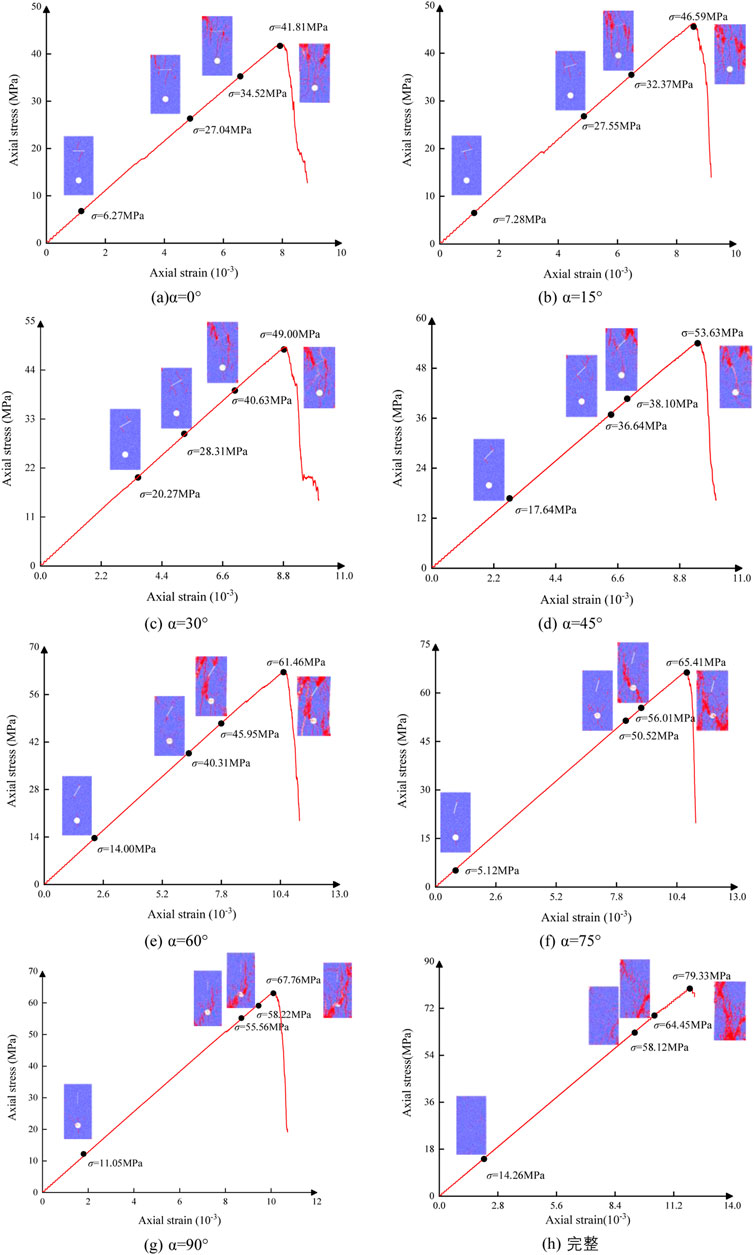
FIGURE 8. Complete rock model and failure mode of single fracture-hole rock model with different fracture angles. (A–H), the damage mode images of the fracture at 0-90° and intact are indicated.
Based on Figure 8A, when the uniaxial compressive stress of the rock model with a fracture angle of 0° increases to 27.04 MPa, it did not fracture at the tip of the fracture but produces a tensile fracture in the upper and lower parts of the pre-fabricated fracture along the direction of the axial stress. Then, it broken at the upper right corner of the rock model as the axial stress gradually increases. The propagation path of the fracture extended from the initial to the unilateral, and then to the bilateral. When the fracture runs from the bottom to the upper left corner, a short slip deformation occurs, forming many tensile-shear fractures and a V-shaped fracture morphology. The failure mode was a tensile-main shear failure. In Figures 8B,C, the fracture propagation of the rock model with fracture angles of 15° and 30° was consistent with that of the model.
It could be easily obtained from Figures 8D,E that, when the fracture angles of the single fracture-hole rock model were 45° and 60°, a tensile fracture was generated on both sides of the fracture in the fracturing stage, and the fracture in the failure process was mainly concentrated in the upper left end of the rock model. The fracture propagation path changed from a fracture at one end to a fracture at both ends, and gradually concentrated in the hole direction as the axial loading stress increases. Finally, the fracture ran through the rock model, and the failure model was a tension-dominated local shear failure.
As shown in Figure 8F, the length of the tensile fractures generated on both sides of the fracture in the single fracture-hole rock model at the fracturing stage was significantly shorter than that of the rock model at other angles when the fracture angles
Based on Figure 8H, the failure of the intact rock model in the failure process was mainly concentrated in the lower end of the rock model. The propagation path of the fracture extended from the initial to the unilateral, and then to the bilateral as the axial loading stress increased. When the fracture ran from the bottom to the upper left corner, a short slip deformation occurs, formed many tensile-shear fractures and a V-shaped fracture morphology. The failure mode was a tensile-main shear failure.
2.5 Fracture propagation and stress evolution of the rock model
The contact force chain and stress evolution results of the four stages of initiation, damage, peak, and failure of each model were selected to investigate the stress distribution and evolution results of the intact rock model and single fracture-hole rock model with different fracture angles. In the contact force chain diagram, the red and blue regions represented the compressive stress region and tensile stress region, respectively. In the stress evolution results, the tensile stress was positive and the compressive stress was negative. The contact force chain and stress evolution results of the single fracture-hole rock model with different fracture angles were shown in Figure 8.
Based on Figure 9, the complete rock model and the single fracture-hole rock model with different fracture angles were dominated by compressive stress in the failure process. In addition, the failure of the complete rock model and the single fracture-hole rock model was due to the loss of the bearing capacity in the middle of the rock model, which was because the fracture was in the middle position of the upper part of the rock model. The rock model begins to fracture when the axial stress was 27.04 MPa and the fracture angle
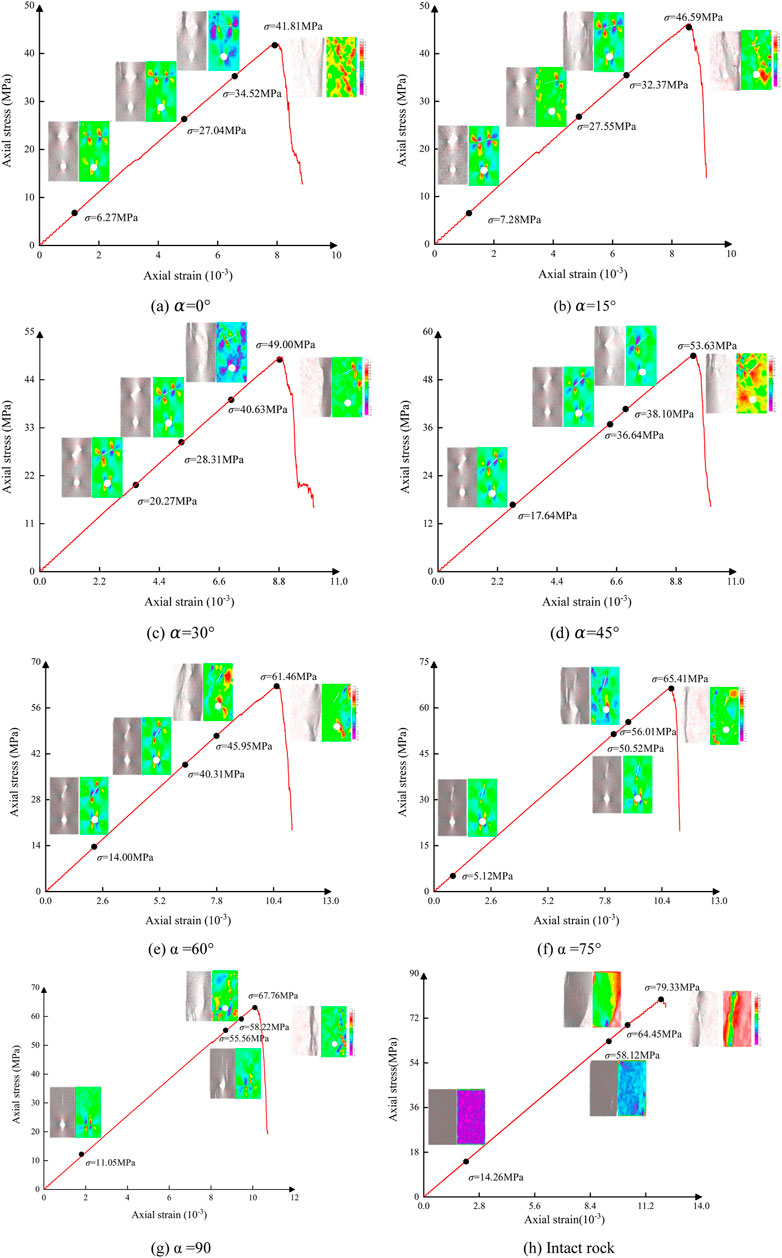
FIGURE 9. Contact force chain and stress evolution results of intact rock model and fractured rock model with different angles. (A)
3 Experimental study on the mechanical properties of single fracture-hole rock specimen
Field sampling was difficult and costly due to the uncertainty and complexity of the natural rock internal structure. However, artificial specimen preparation was convenient, low cost, and could accurately determined the fracture angle and hole size of a single fracture-hole rock specimen. Therefore, artificial specimens were selected in this experiment, and acoustic emission and DIC were used to study the fracture propagation and stress evolution characteristics of a single fracture-hole rock specimen.
3.1 Specimen preparation
The specimen material used in this test was red sandstone from a quarry in Hubei. Red sandstone was composed of granular clastic structure and argillaceous cementation structure. The strength of red sandstone varied greatly due to the difference in the cementing material and weathering degree, made the sample preparation difficult. Therefore, only single fracture-hole rock specimen with fracture angles of 30° and 45° were prepared for experiments, and the relationship between acoustic emission characteristics, rock fracture propagation and digital speckle and different fracture angles were studied. Specimens were taken from the same intact rock specimen and cut into a length of 100 mm, width of 50 mm, and thickness of 20 mm to reduce the difference between specimens. The high-pressure water jet cutting machine was used to cut the sample, as shown in Figure 10.
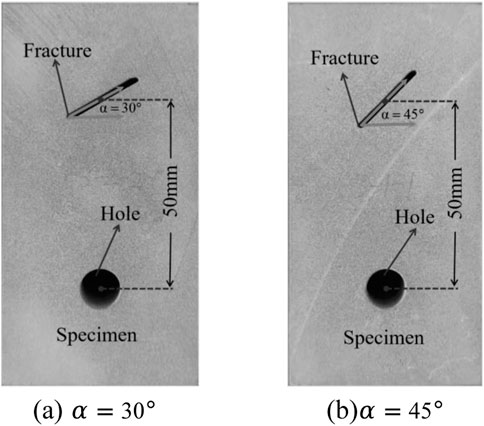
FIGURE 10. Geometric shape of single fracture-hole rock specimen in laboratory test. (A)
3.2 Test scheme
The specimens were placed on the AG-X rock mechanics electronic universal testing machine, and uniaxial compression tests were conducted on each specimen. The axial stress was applied on the surface of the rock specimen until it was damaged. In the displacement control test, the uniaxial compression test was carried out on the red sandstone specimens prepared at a fixed displacement speed of 0.01 mm/s. During the test, AE signals and DIC digital characteristics in the deformation process of the red sandstone were monitored in real-time by acoustic emission and digital speckle (Figure 11).
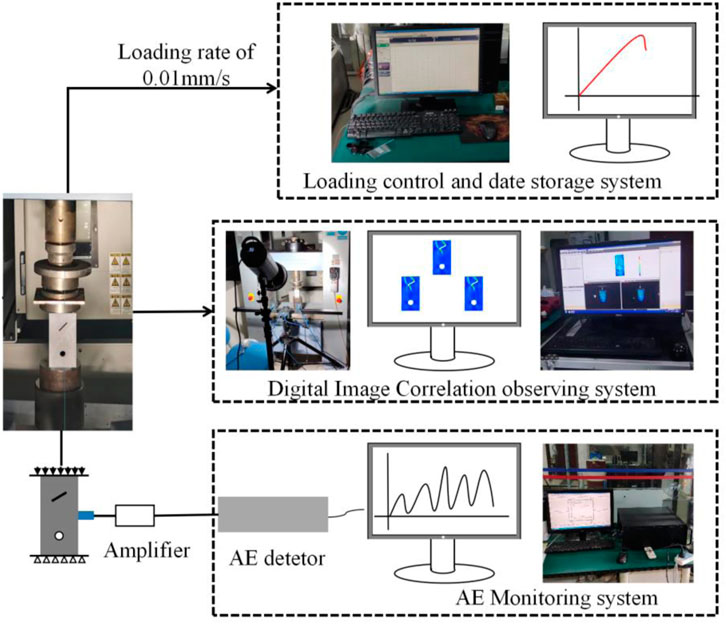
FIGURE 11. Test control and monitoring system.
3.3 Test result analysis
3.3.1 Stress-strain image analysis
As shown in Figure 12A, the OA section was the internal pore compaction stage of the rock specimen when the fracture angle was 30°. Due to the existence of small fractures in natural rock, the early stage of uniaxial compression was a process of compaction of small fractures, formed early non-linear deformation. In this stage, the lateral expansion of the specimen was small, and the volume of the rock specimen decreases as the load increases. The AC section was the stage from the elastic deformation of rock specimen to the stable development of micro-elastic fractures, and the stress-strain curve at this stage was approximately linear. The rock specimen in the AB and BC sections was in the elastic deformation stage and the stable development stage of micro-fracture, respectively. At this stage, the acoustic emission energy value changed slightly due to the high brittleness of sandstone. CD section was the unstable fracture development stage of rock specimen. The rock specimen changed from elastic deformation to plastic deformation at point C with the continuous loading of axial stress. In this stage, the internal fracture condition of the rock specimen had undergone a qualitative change, and the internal fractures of rock specimen gradually increased. The stress-strain curve reach the peak at this stage, and the acoustic emission energy value also reached the peak. In the stage after point D, although the bearing capacity of the rock specimen reached its peak strength, and its internal structure was also destroyed, the entire rock specimen remains, and the stress-strain curve shown a rapid decline.

FIGURE 12. Relationship between axial stress-strain curve, acoustic emission times and time of a single fracture-hole rock specimen. (A) α = 30°, (B) α = 45°.
As shown in Figure 12B, when the fracture angle
3.3.2 Digital image correlation image analysis
When the fracture angle of single fracture-hole rock specimen was 30°, the DIC characteristic diagram of the laboratory test was shown in Figure 13. Combined with Figure 12, the failure characteristics of the rock specimen with fracture angles were as follows.
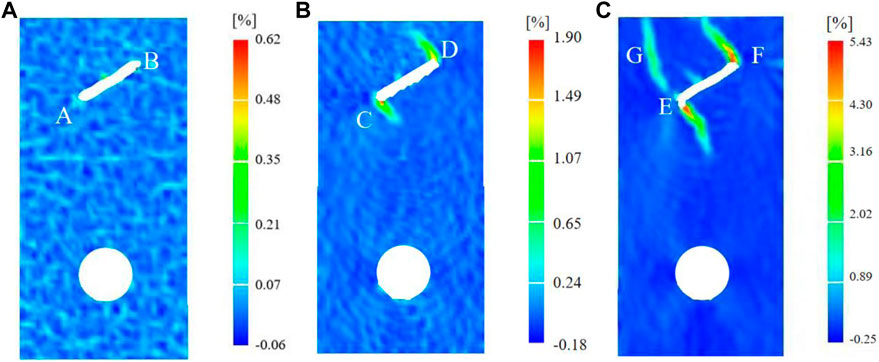
FIGURE 13. α = 30° DIC feature map. (A-C), the three stages of compression and densification, crack initiation, and damage are indicated, respectively.
As shown in Figure 13A, the stress concentration occurred at the fracture tip AB at the initial loading stage of the rock specimen, and the microfracture first occurs here, accompanied by a small amount of acoustic emission energy. With the continuous loaded of axial stress, as shown in Figure 13B, the fractures at both ends of the fracture extended in the opposite direction, the fractures at CD shown a trend of penetrating through the rock specimen, and the stress at both ends of the fracture was significantly increased compared with Figure 13A. With the continuous loading of the axial stress of the rock specimen, as shown in Figure 13C, the fractures at EF at both ends of the fracture gradually developed, and the trend of penetrating the rock specimen was more apparent. In addition, the fractures that penetrate rock specimen occurred at G, and the stress increases significantly. Based on the uniaxial compression test, the internal microfracture expanded rapidly and penetrated each other, and the energy value rose to about 2,500 in an instant.
When the fracture angle of a single fracture-hole rock specimen was 45°, the DIC characteristic diagram of the laboratory test was shown in Figure 14. As shown in Figure 14A, the stress concentration occurred at the fracture tip AB at the initial loading stage of the rock specimen, and the microfracture occurred here first, accompanied by a small amount of acoustic emission energy. With the continuous loading of axial stress, as shown in Figure 14B, the fractures at both ends of the fracture extended in the opposite direction, the fractures at CD shown a trend of the penetration through the rock specimen, and the stress at both ends of the fracture was significantly increased compared to that in Figure 14A. On the other hand, with the continuous loaded of the axial stress of the rock specimen, as shown in Figure 14C, the fractures at EF at both ends of the fracture gradually developed and increased, the trend of penetrating the rock specimen became more apparent, and the stress increased significantly. With the uniaxial compression test, the internal microfracture expanded rapidly and penetrated each other, and the energy value increased to approximately 1,300 in an instant.
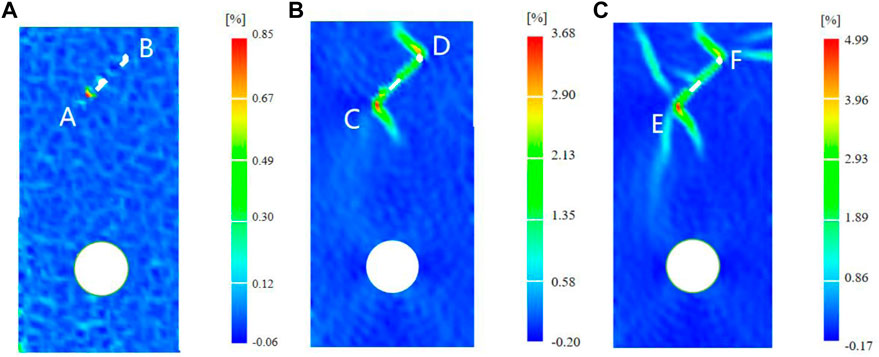
FIGURE 14. α = 45° DIC feature diagram. (A-C), the three stages of compression and densification, crack initiation, and damage are indicated, respectively.
3.4 Comparison between the numerical simulation and laboratory tests
Combined with the results of the numerical simulation analysis in Section 2 and the laboratory test analysis in Section 3, the fracture angles of 30° and 45° in the numerical simulation were selected for the analysis. Figure 15 shown the comparison of the failure diagram of the laboratory test and the numerical model when the fracture angles were 30° and 45°. Based on Figure 15, the fracture development in the laboratory test and numerical simulation test started from the vicinity of the fracture. Then, the fracture gradually extended to both sides of the rock specimen as the axial loading pressure increases. The macroscopic failure characteristics of the laboratory test specimens with fracture angles of 30° and 45° were similar to those of the numerical simulation of the single fracture-hole rock model, as shown Figure 15.
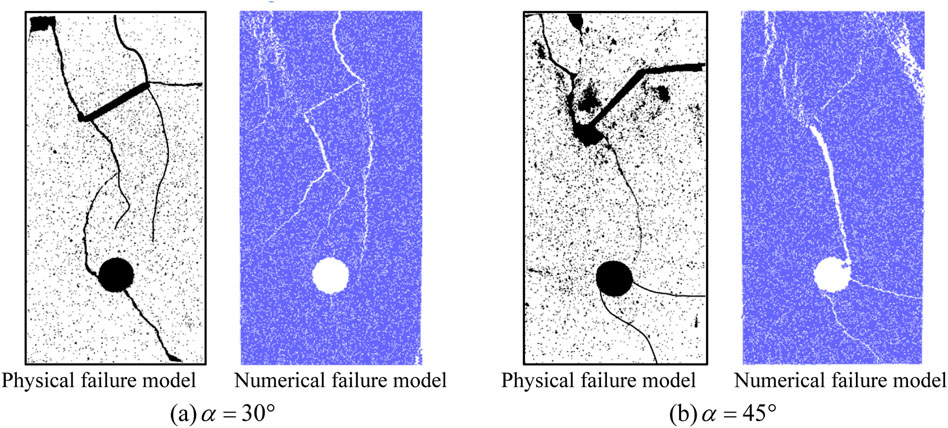
FIGURE 15. Failure diagram of a test and numerical model with fracture angles of 30° and 45°. (A)
4 Conclusion
In this study, we performed the uniaxial compression test of a single fracture-hole rock specimen with different fracture angles. Laboratory tests were analysed using acoustic emission and digital speckle. Simultaneously, PFC2D was used to establish a numerical model to analyse the mechanical properties, fracture propagation, and stress field evolution of a single fracture-hole rock specimen with different fracture angles. The major conclusion were as follows:
(1) In the laboratory test, a single fracture-hole rock specimen with fracture angles of 30° and 45° was selected for the test. The rock specimen experienced the compaction, elastic deformation, and plastic deformation stages after the auxiliary analysis of the acoustic emission and DIC until complete failure.
(2) Fractures with different angles had a great influence on the mechanical properties of the rock specimen. The peak strength, peak strain, elastic modulus, fracture initiation stress, and damage stress of the single fracture-hole rock specimen with different fracture angles were significantly smaller compared to those of the intact rock specimen.
(3) The results of the laboratory test and numerical simulations were good, and the macroscopic failure characteristics of the rock specimen were similar.
(4) The research on defect combination of different fracture angles around the hole could provided theoretical guidance for practical geotechnical engineering, such as prefabricated fractures in geotechnical engineering and pressure relief in coal mine drilling.
Data availability statement
The original contributions presented in the study are included in the article/Supplementary Material, further inquiries can be directed to the corresponding author.
Author contributions
NJ: conceptualization, methodology, investigation, formal Analysis, writing—original draft, laboratory test; KL: conceptualization, funding acquisition, resources, supervision, writing—review and editing, numerical simulation; ZG: resources, supervision; CJ: visualization, investigation; LY: visualization, writing—review and editing; SM: visualization; QS: writing—review and editing.
Funding
This work was supported by the Natural Science Foundation of China (Nos. 52004146, 52074169 and 52174159), the Shandong Provincial Natural Science Foundation (Nos. ZR2020QE102), the China Postdoctoral Science Foundation (2022M713386).
Conflict of interest
Author ZG was employed by Shandong Geology and Mineral Resources Engineering Group Co., Ltd.
The remaining authors declare that the research was conducted in the absence of any commercial or financial relationships that could be construed as a potential conflict of interest.
Publisher’s note
All claims expressed in this article are solely those of the authors and do not necessarily represent those of their affiliated organizations, or those of the publisher, the editors and the reviewers. Any product that may be evaluated in this article, or claim that may be made by its manufacturer, is not guaranteed or endorsed by the publisher.
References
Asadizadeh, M., Hossaini, M. F., Moosavi, M., Masoumi, H., and Ranjith, P. G. Mechanical characterisation of jointed rock-like material with non-persistent rough joints subjected to uniaxial compression. Eng. Geol., 2019; 260:105224–105224. doi:10.1016/j.enggeo.2019.105224
Asadizadeh, M., Moosavi, M., and Hossaini, M. F. Investigation of mechanical behaviour of non-persistent jointed blocks under uniaxial compression. Geomechanics Eng., 2018; 14(1):29–42. doi:10.12989/gae.2018.14.1.029
Bahaaddini, M., Sharrock, G., and Hebblewhite, B. K. Numerical investigation of the effect of joint geometrical parameters on the mechanical properties of a non-persistent jointed rock mass under uniaxial compression. Comput. Geotechnics, 2013; 49(20):206–225. doi:10.1016/j.compgeo.2012.10.012
Brantut, N., Heap, M. J., Meredith, P. G., and Baud, P. Time-dependent cracking and brittle creep in crustal rocks: A review. J. Struct. Geol., 2013; 52(5):17–43. doi:10.1016/j.jsg.2013.03.007
Chen, M., Liu, J., Xie, Z., Liu, J., Cen, Y., Li, B., et al. Discrete element modeling on mechanical behavior of heterogeneous rock containing x-shaped fissure under uniaxial compression. Geofluids, 2020b; 2020(4):1–14. doi:10.1155/2020/8828199
Chen, S. J., Xia, Z. G., Feng, F., and Yin, D. W. Numerical study on strength and failure characteristics of rock samples with different hole defects. Bull. Eng. Geol. Environ., 2020a; 80(7):1523–1540. doi:10.1007/s10064-020-01964-y
Chen, S. J., Zhang, J. C., Yin, D. W., Cheng, X. Z., and Ning, J. Relative permeability measurement of coal microchannels using advanced microchip technology. Fuel, 2021; 312:122633–633. doi:10.1016/j.fuel.2021.122633
Cheng, Y., Jiao, Y. Y., and Tan, F. Numerical and experimental study on the cracking behavior of marble with en-echelon flaws. Rock Mech. Rock Eng., 2019; 52(11):4319–4338, doi:10.1007/s00603-019-01849-x
Cundall, P. A., and Strack, O. D. Discussion: A discrete numerical model for granular assemblies. Geotechnique, 1979; 29(1):331–336. doi:10.1680/geot.1980.30.3.331
Dai, B., Chen, Y., Zhao, G. Y., Liang, W. Z., and Wu, H. A numerical study on the crack development behavior of rock-like material containing two intersecting flaws. Mathematics, 2019; 7(12):1223. doi:10.3390/math7121223
Holt, R. M., Laas, J., Larsen, I., Li, L., Pillitteri, A. G., and Snsteb, E. F. Comparison between controlled laboratory experiments and discrete particle simulations of the mechanical behaviour of rock. Int. J. Rock Mech. Min. Sci., 2005; 42(7-8):985–995. doi:10.1016/j.ijrmms.2005.05.006
Huang, Y., and Yang, S. Particle flow analysis on crack coalescence behavior of sandstone specimen containing three pre-existing fissures under uniaxial compression. J. Basic Sci. Eng., 2016; 24(6):1232–1247. doi:10.16058/j.issn.1005-0930.2016.06.014
Lin, Q., Cao, P., Cao, R., Lin, H., and Meng, J. J. Mechanical behavior around double circular openings in a jointed rock mass under uniaxial compression. Arch. Civ. Mech. Eng., 2020; 20(1):19–18. doi:10.1007/s43452-020-00027-z
Lin, Q., Cao, P., Meng, J. J., Cao, R. H., and Zhao, Z. Y. Strength and failure characteristics of jointed rock mass with double circular holes under uniaxial compression: Insights from discrete element method modelling. Theor. Appl. Fract. Mech., 2020; 109:102692. doi:10.1016/j.tafmec.2020.102692
Lisjak, A., and Grasselli, G. A review of discrete modeling techniques for fracturing processes in discontinuous rock masses. J. Rock Mech. Geotechnical Eng., 2014; 6(4):301–314. doi:10.1016/j.jrmge.2013.12.007
Liu, J. M., Sun, S. R., Yue, L., Wei, J. H., and Wu, J. M. Mechanical and failure characteristics of rock-like material with multiple crossed joint sets under uniaxial compression. Adv. Mech. Eng., 2017; 9(7):168781401770871. doi:10.1177/1687814017708710
Lu, W. B., Zhu, Z. D., He, Y. X., and Que, X. C. Strength characteristics and failure mechanism of a columnar jointed rock mass under uniaxial, triaxial, and true triaxial confinement. Rock Mech. Rock Eng., 2021; 54, 2425, 2439(3). doi:10.1007/s00603-021-02400-7
Ma, J. B., Jiang, N., Wang, X., Wang, X. J., Jia, X. D., and Yao, D. H. Numerical study of the strength and characteristics of sandstone samples with combined double hole and double fissure defects. Sustainability, 2021; 13, 7090(13). doi:10.3390/su13137090
Pan, X., Guo, W., Wu, S., and Chu, J. An experimental approach for determination of the weibull homogeneity index of rock or rock-like materials. Acta Geotech., 2019; 15(2):375–391. doi:10.1007/s11440-019-00803-z
Qi, X. H., Wang, H., Chu, J, and Chiam, K. Two-dimensional prediction of the interface of geological formations: A comparative study. Tunnelling And Underground Space Technology, 2022;104329 121. doi:10.1016/j.tust.2021.104329
Sqy, A., Pgra, B., Hwj, A., Wlt, A., and Yang, J. A. An experimental investigation on thermal damage and failure mechanical behavior of granite after exposure to different high temperature treatments. Geothermics, 2017; 65:180–197. doi:10.1016/j.geothermics.2016.09.008
Wang, Y. T., Zhou, X. P., and Kou, M. M. Three-dimensional numerical study on the failure characteristics of intermittent fissures under compressive-shear loads. Acta Geotech., 2018; 101:1161–1193. doi:10.1007/s11440-018-0709-7
Wu, H., Chen, Y., Zhao, G., and Liang, W. A numerical study on the crack development behavior of rock-like material containing two intersecting flaws. Mathematics, 2019; 7(12):1223. doi:10.3390/math7121223
Wu, Z., Fan, L., Liu, Q., and Ma, G. Micro-mechanical modeling of the macro-mechanical response and fracture behavior of rock using the numerical manifold method. Eng. Geol., 2016; 225. 49, 60, doi:10.1016/j.enggeo.2016.08.018
Yang, S. Q., and Jing, H. W. Strength failure and crack coalescence behavior of brittle sandstone samples containing a single fissure under uniaxial compression. Int. J. Fract., 2011; 168(2):227–250. doi:10.1007/s10704-010-9576-4
Yang, Y. T., Tang, X. H., Zheng, H., Liu, Q. S., and He, L. Three-dimensional fracture propagation with numerical manifold method. Eng. Analysis Bound. Elem., 2016; 72:65–77. doi:10.1016/j.enganabound.2016.08.008
Yin, D. W., Wang, F., Zhang, J. C., Li, F. X., Zhu, C., and Feng, F. Experimental study on the short-term uniaxial creep characteristics of sandstone-coal composite samples. Minerals, 2021; 11, 1398(12). doi:10.3390/min11121398
Zhang, D., Ranjith, P. G., and Perera, M. The brittleness indices used in rock mechanics and their application in shale hydraulic fracturing: A review. J. Petroleum Sci. Eng., 2016; 143:158–170. doi:10.1016/j.petrol.2016.02.011
Zhang, J. C., Si, L. L., Chen, J. G., Kizil, M. S., Wang, C. G., and Chen, Z. W. Stimulation techniques of coalbed methane reservoirs. Geofluids, 2020, 2020; (3):1–23. doi:10.1155/2020/5152646
Zhang, J. C., and Yin, S. X. Some technologies of rock mechanics applications and hydraulic fracturing in shale oilshale gas and coalbed methane. Meitan Xuebao/Journal China Coal Soc., 2014; 39(8):1691–1699(9). doi:10.13225/j.cnki.jccs.2014.9004
Zhang, S., Li, Y., Shen, B., Sun, X., and Gao, L. Effective evaluation of pressure relief drilling for reducing rock bursts and its application in underground coal mines. Int. J. Rock Mech. Min. Sci., 2019; 114:7–16. doi:10.1016/j.ijrmms.2018.12.010
Zhang, X. P., and Wong, L. N. Y. Cracking processes in rock-like material containing a single flaw under uniaxial compression: A numerical study based on parallel bonded-particle model approach. Rock Mech. Rock Eng., 2012; 45(5):711–737. doi:10.1007/s00603-011-0176-z
Zhao, Y. L., Wang, Y. X., Wang, W. J., Tang, L. M., Liu, Q., and Cheng, G. M. Modeling of rheological fracture behavior of rock cracks subjected to hydraulic pressure and far field stresses. Theor. Appl. Fract. Mech., 2019; 101:59–66. doi:10.1016/j.tafmec.2019.01.026
Keywords: uniaxial compression, mode of failure, laboratory test, mechanical property, PFC 2D
Citation: Jiang N, Lv K, Gao Z, Jia C, Ye L, Meng S and Su Q (2023) Experimental study on mechanical properties of single fracture-hole red sandstone. Front. Earth Sci. 10:1083689. doi: 10.3389/feart.2022.1083689
Received: 29 October 2022; Accepted: 28 November 2022;
Published: 16 January 2023.
Edited by:
Leilei Si, Henan Polytechnic University, ChinaReviewed by:
Geng Jiabo, Jiangxi University of Science and Technology, ChinaGuofa Ji, Yangtze University, China
Copyright © 2023 Jiang, Lv, Gao, Jia, Ye, Meng and Su. This is an open-access article distributed under the terms of the Creative Commons Attribution License (CC BY). The use, distribution or reproduction in other forums is permitted, provided the original author(s) and the copyright owner(s) are credited and that the original publication in this journal is cited, in accordance with accepted academic practice. No use, distribution or reproduction is permitted which does not comply with these terms.
*Correspondence: Ning Jiang, amlhbmduaW5nQHNkdXN0LmVkdS5jbg==; Ke Lv, bGs5NzAzMTNAMTYzLmNvbQ==
†ORCID:Ke Lv, orcid.org/0000-0003-0206-7324