 Junhui Che1,2,3
 Ping Zhao2*
- 1Collaborative Innovation Center on Forecast and Evaluation of Meteorological Disasters, Nanjing University of Information Science and Technology, Nanjing, China
- 2State Key Laboratory of Severe Weather, Chinese Academy of Meteorological Sciences, Beijing, China
- 3Shandong Meteorological Service Center, Jinan, China
The lack of sounding observations in the western Tibetan Plateau (TP), the highest terrain in the world, has resulted in few efforts to evaluate the quality of the atmospheric reanalysis results in this region. Using the sounding observations from the Third Tibetan Plateau Atmospheric Scientific Experiment during 2013–2015, the NCEP and ERA-Interim reanalysis temperature and humidity fields in the TP are evaluated and the characteristics of the reanalysis Atmospheric Boundary Layer (ABL) height are utilized to explain the reasons for the differences in temperature and humidity between the western and eastern TP. The results show that the NCEP and ERA-Interim reanalysis temperature and humidity products generally have larger errors at low level (such as 500 hPa) in the western TP (WTP) than in the eastern one (ETP) at 12:00 UTC. However, this difference is small at 00:00 UTC. Further analysis reveals that the temporal and spatial variations of temperature and humidity errors at low level are closely associated with the differences in the terrain and ABL between the western and eastern TP. In the early morning when the ABL height is low over the TP, the 500 hPa pressure level in both the WTP and ETP is significantly above the top of ABL, with weak spatial variations of temperature and humidity errors. However, in the late afternoon when there is a larger increase in ABL height over the WTP than over the ETP, the 500 hPa pressure level is located inside the ABL in the WTP and is still above the ABL in the ETP, which causes significant regional differences in these errors.
1 Introduction
The atmospheric boundary layer (ABL), as the interface for the exchanges of momentum, heat, water vapor, and matter between the surface and the free atmosphere, plays important roles in weather, climate, and practical applications such as the dispersion and transport of air pollution (Stull 1988; Garratt 1994; Wang and Wang, 2004; Bao et al., 2013; Miao et al., 2015). The Tibetan Plateau (TP), with an average elevation exceeding 4,500 m and an extensive area of 2.5 million square kilometers, also significantly influences the East Asian and global weather and climate through its thermodynamic effects (Ye et al., 1958; Yanai and Li 1994; Wu et al., 2007; Zhou et al., 2009; Duan et al., 2012; Zhao et al., 2018,2019b). Because of the unique atmospheric conditions in the high-elevation region, the local ABL processes over the TP are far more complicated than those in the lower-elevation areas at the same latitude (Tao and Ding 1981; Xu et al., 2002; Yang et al., 2004).
Due to harsh climatic and environmental conditions in the TP, the availability of observational data is greatly limited since there are few sounding stations in the western TP (Figure 1). Thus several reanalysis products have been widely used in this region, including the National Centers for Environmental Prediction (NCEP)-National Center for Atmospheric Research (NCAR) Reanalysis and the European Centre for Medium-Range Weather Forecasts (ECWMF) 40-year Reanalysis (ERA-40) and interim Reanalysis (ERA-Interim). However, these reanalysis datasets potentially contain uncertainties from various sources that are inherent in the assimilation processes and in the model physic processes. Thus numerous studies have assessed the accuracy of the reanalysis datasets at specific stations and regions worldwide, which is helpful to identify errors in the reanalysis products and to improve the model parameterization schemes (Ma et al., 2008; Betts et al., 2009; Brunke et al., 2011; Decker et al., 2012; Zhao et al., 2015).
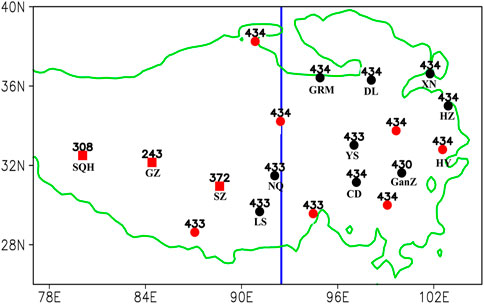
FIGURE 1. Distributions of sounding stations in the TP. The black (red) color indicates that the station data were (were not) assimilated in the NCEP and ERA-Interim reanalysis datasets, and the squares (circles) represent the experimental (operational) observations. The letters indicate the abbreviations of station names. The green line represents the terrain height of 3,000 m above the sea level and the blue line denotes a separation of the western and eastern TP along 92.5°E.
Previous studies have revealed the adequacy of land–atmosphere interaction processes in numerical models that may cause large errors in the reanalysis data, specifically in the lower troposphere. Betts et al. (1998) pointed out that the misrepresentation of the coupling between the land surface and the ABL at night in the ECMWF model resulted in a low bias in the minimum temperature at the ground level. Liu et al. (2012) found that in the NCEP-NCAR reanalysis an inappropriate correction for the observational data after 1992 led to a systematic underestimation of the tropospheric temperature and geopotential height in eastern China. Moreover, the existing numerical models have serious issues in representing the TP land–atmosphere coupling processes, particularly for the ABL and cloud-precipitation processes (Wu and Zhou 2011; Hu et al., 2014; Zhuo et al., 2016; Zhao et al., 2019a). These might cause the poor performance of numerical weather and climate prediction models in the TP and the surrounding areas. For example, Frauenfeld et al. (2005) found that the ERA-40 reanalysis underestimates the annual mean air temperature by about 7 °C in the TP. Wang and Zeng (2012) pointed out that the reanalysis datasets mostly underestimates the daily average temperature in the TP, with a deviation ranging from –14°C to 6°C. Using the dataset from the Second Tibetan Plateau Atmospheric Scientific Experiment, Bao and Zhang (2013) revealed significant diurnal and spatial variations of low-level atmospheric temperature and humidity errors of four reanalysis datasets (the NCEP-NCAR, the NCEP Climate Forecast System Reanalysis, ERA-40, and ERA-Interim). However, they did not give the explanations for these discrepancies.
The lack of the observational data in the TP region has resulted in few efforts to evaluate the quality of the reanalysis datasets. To obtain a long observational data in the western TP, the Third Tibetan Plateau Atmospheric Scientific Experiment (TIPEX-III) has made routine sounding launches at Shiquanhe (SQH), Gaize (GZ), and Shenzha (SZ) stations of the western TP (Figure 1) since 2013, which fills the data gaps in the operational sounding network over the western TP (Zhao et al., 2018; Li et al., 2020). Using the TIPEX-III sounding observational data, Che and Zhao (2021) recently exhibited the west-east differences in the TP ABL height during summer, indicating a deeper ABL in the western TP (up to 4,000 m above ground level) compared to the eastern TP. However, it remains a question as how this west-east difference of the ABL height affects the quality of reanalysis data in the TP. For example, are the diurnal and spatial variations of the low-level reanalysis atmospheric temperature and humidity errors revealed by Bao and Zhang (2013) related to the TP ABL process? To answer this question, this work aims to examine the temporal and spatial characteristics of errors in both the NCEP-NCAR (the earliest generation) and ERA-Interim (the newer generation) reanalysis datasets in the TP and the relationships between these errors and the ABL process.
The remainder of this paper is organized as follows. Data and methodology are described in Section 2. Spatial and diurnal variations of the reanalysis temperature and humidity errors over the TP are examined in Section 3. The characteristics of the ABL height and its link to errors in the reanalysis dataset are analyzed in Section 4. Conclusion and discussion are given in Section 5.
2 Data and methodology
This study utilizes radiosonde observational data from 19 stations over the TP region (Figure 1). Among them, 16 meteorological operational radiosonde stations using L-band sounding system with the GTS1 digital electronic radiosonde are mostly located in the eastern TP (hereafter the operational stations; black and red dots). The TIPEX-III carried out intensive radiosonde launches at SQH, GZ, and SZ of the western TP (hereafter the experimental stations; red squares) using the Vaisala GPS RS92 or XGP-3 sondes twice daily at 0000 UTC and 1200 UTC for the periods 15 June - 31 July 2013, 15 June - 31 August 2014, and 1 January - 31 December 2015 (Zhao et al., 2018). After the data quality control, there were more than 400 sounding samples in each operational station and 240–380 sounding samples from each experimental station (Figure 1). These intensive observations have been used to analyze the ABL characteristics in the TP with their data quality being discussed (Che and Zhao, 2021).
The NCEP-NCAR (referred as NCEP) and ERA-Interim reanalysis datasets have been most extensively applied respectively since the 1990s and this century. The NCEP reanalysis has a horizontal resolution of T62 (∼209 km) Gauss grid with 28 sigma levels in the vertical and is available every 6 hours, utilizing the three-dimensional variational assimilation technique (Kalnay et al., 1996). The ERA-Interim reanalysis with a horizontal resolution of T255 (∼80 km) Gauss grid and 60 hybrid vertical levels is the precursor of the next-generation extended reanalysis system using an updated version of the ECMWF forecast model and the most advanced four-dimensional variational data assimilation technique (Dee et al., 2011). Here, we use the reanalysis and observational data at standard pressure levels over the TP. To compare the gridded reanalysis with the sounding station data, the reanalysis products were interpolated to the location of each station using a bilinear interpolation method (Mooney et al., 2010; Bao and Zhang, 2013). Since the soundings at Naqu (NQ), Lasha (LS), Yushu (YS), Ganzi (GanZ), Changdu (CD), Hezuo (HZ), Geermu (GRM), Dulan (DL), and Xining (XN) stations (black dots) are internationally exchanged by the global telecommunication system (GTS), these data may have been assimilated in both the NCEP and ERA-Interim reanalysis datasets. The observations at other stations (red dots and squares) were not assimilated in the reanalysis datasets and thus provide an independent evaluation of the reanalysis results.
Following previous studies (e.g., Vogelezang and Holtslag, 1996; Seidel et al., 2012; Guo et al., 2016), the ABL height is calculated based on the bulk Richardson number which is defined as the ratio between the buoyancy and shear production/consumption for turbulent kinetic energy as follows.
where z is the height from the surface, the subscript “s” represents the surface value, g is the gravitational acceleration,
3 Evaluation of the reanalysis atmospheric temperature and humidity in the TP
In this section, the quality of the NCEP and ERA-Interim reanalysis products over the entire TP is evaluated using all sounding observations (Figure 1). Figures 2A–D show the vertical profiles of the regional mean temperature (T) of the observation and NCEP and ERA-Interim reanalysis datasets over the entire TP and their standard deviation (SD), mean bias (MB), and root-mean-square error (RMSE). In the vertical direction, the reanalysis mean and SD exhibit consistent deviations with the observed ones, with all the differences within 1 °C throughout the vertical column (Figures 2A,B), which suggests that both these two reanalysis datasets can capture the basic features of the observational temperature over the entire TP. Nevertheless, some differences between the observation and reanalysis are also noted. The MB values of both the ERA-Interim and NCEP temperatures are generally negative (between 0 and -1°C) in the troposphere (Figure 2C), which indicates an underestimation of the reanalysis temperatures in the troposphere. The RMSE value between the observation and the ERA-Interim reanalysis ranges from 0.8 °C to 1.3 °C at all levels (Figure 2D), and it falls in the range of 1.0°C–1.6°C for the NCEP reanalysis. The quality of the ERA-Interim reanalysis T is slightly better than that of the NCEP one in most layers. In addition, the NCEP and ERA-Interim RMSE values are larger at both 500 hPa (bottom) and 100 hPa (top) than in the middle troposphere between 400 hPa and 150 hPa.
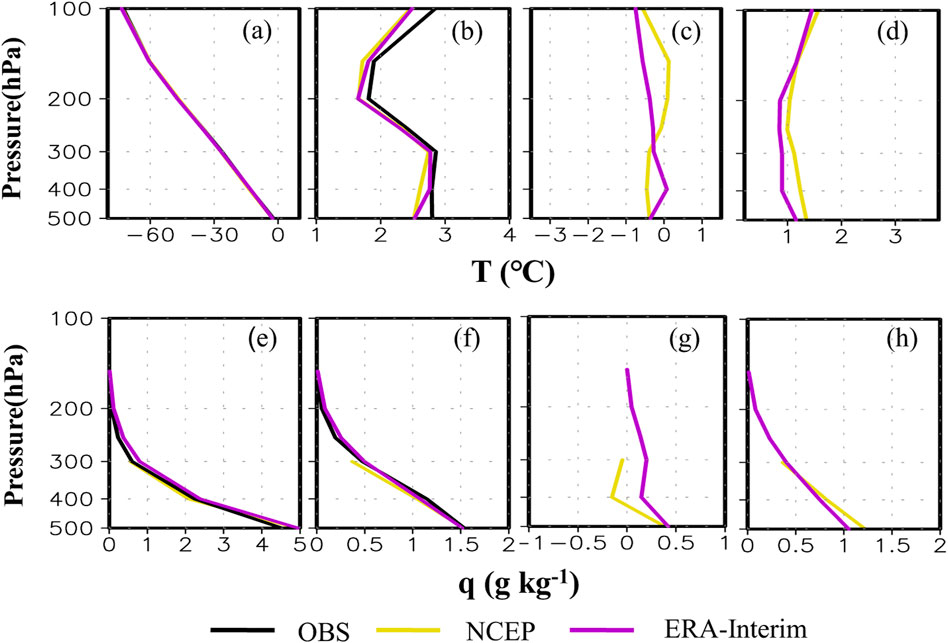
FIGURE 2. The vertical profiles of the regional mean (A,E) and standard deviation (B,F) from radiosonde observation and NCEP and ERA-Interim reanalysis datasets and the regional mean bias (C,G) and root-mean-square error (RMSE) (D,H) between the reanalysis and observation datasets from nineteen stations. The (A–D) and (E–H) rows are for temperature (T) and specific humidity (q), respectively.
Figures 2E–H displays the corresponding results for specific humidity (q). Similar to temperature, the mean value and SD of the reanalysis q also exhibit the consistent vertical profiles with the observational ones (Figures 2E,F). The NCEP has the positive MB of 0.5 g kg−1 at 500 hPa, but with negative biases between 0 and -0.2 g kg−1 at the other levels (Figure 2G). This result indicates that compared to the sounding data, the model atmosphere in the NCEP reanalysis is wetter in the lower layer and is drier elsewhere. Different from the NCEP results, the modeled atmosphere in the ERA-Interim reanalysis has more water vapor throughout the entire vertical volume compared to the observation, with the positive MB decreasing from the maximum value of 0.4 g kg−1 at 500 hPa to 0.2 g kg−1 at 300–400 hPa. The RMSE of q for both the reanalysis data sharply decreases with an increase of height, and is larger than 0.5 g kg−1 below 350 hPa, with the maximum value of 1.3 g kg−1 (1.0 g kg−1) for the NCEP (ERA-Interim) reanalysis at 500 hPa (Figure 2H).
To reveal the regional differences of the errors between the reanalysis products and the observation, the reanalysis T and q between the western TP (WTP) and the eastern TP (ETP) are compared, in which the separation of the western (eight stations) and eastern (11 stations) regions of TP is set at 92.5°E. Figure 3 presents the RMSE profiles of the NCEP and ERA-Interim T and q averaged over the WTP and the ETP. It is seen that in the ETP, the RMSE of the NCEP T is near 1 °C below 200 hPa and 1.5°C at 100 hPa (Figure 3A). In the WTP, it is remarkably larger below 300 hPa, with a value of 1.8 °C at 500 hPa. This result indicates a larger error of T in the lower layer in the WTP than in the ETP. The ERA-Interim T (Figure 3B) shows the similar trend. At 500 hPa, the ERA-interim RMSE is 1.5 °C in the WTP and is 0.9°C in the ETP. For q of both the ERA-Interim and NCEP reanalysis datasets (Figure 3D), the RMSE is larger below 300 hPa in the WTP (with the maximum of 1.6 g kg−1 for the NCEP and 1.2 g kg−1 for the ERA-Interim at 500 hPa) than in the ETP (with the maximum of 0.9 g kg−1 for the NCEP and 0.8 g kg−1 for the ERA-Interim at 500 hPa). The above results indicate that the reanalysis T and q in the lower layer have larger errors in the WTP than in the ETP.
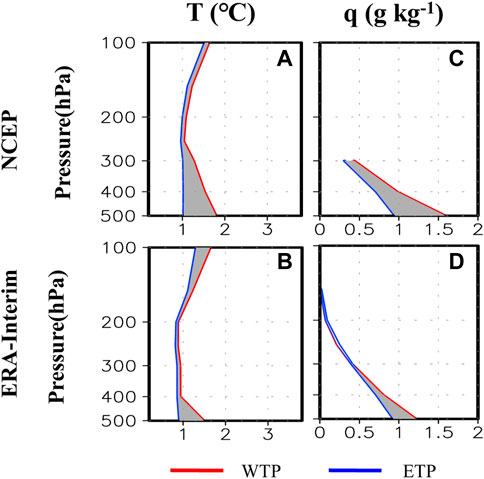
FIGURE 3. The vertical profiles of RMSE of the NCEP (A,C) and ERA-Interim (B,D) reanalysis temperature and specific humidity over the western TP and eastern TP. The gray shaded area indicates a difference between the WTP and the ETP.
The diurnal variations in error between the observation and the reanalysis datasets are further examined in the WTP and the ETP. 00:00 UTC and 12:00 UTC in the TP approximately correspond to 06:00 local standard time (LST) (the early morning) and 18:00 LST (the late afternoon), respectively. Generally speaking, the RMSE of the NCEP T in the lower layer has a remarkable difference between the early morning and the late afternoon in the WTP (Figure 4A). The RMSE at 500 hPa is 1.2°C and 2.2°C in the early morning and the late afternoon, respectively, with a difference of 1.0°C between these two times. In the ETP (Figure 4C), however, the RMSE below 200 hPa is about 1°C at both 00:00 UTC and 12:00 UTC and has a small difference between the early morning and the late afternoon. For the NCEP q, the 500-hPa RMSE is nearly 1.2 g kg−1 at 00:00 UTC and 1.8 g kg−1 at 12:00 UTC in the WTP (Figure 4E), with a difference of 0.6 g kg−1 in RMSE between the early morning and the late afternoon. In the ETP, this difference is near 0.1 g kg−1 (Figure 4G), remarkably smaller compared to that in the WTP. The similar differences are also seen in the ERA-Interim reanalysis datasets. The RMSE of the ERA-interim T at 500 hPa has a difference of 0.8 °C between the late afternoon and the early morning in the WTP (Figure 4B) and has a small difference of 0.1°C in the ETP (Figure 4D). The RMSE of the 500-hPa ERA-Interim q in the WTP is 1.5 g kg−1 and 0.8 g kg-1 at 12:00 UTC and 00:00 UTC, respectively (Figure 4F), with a difference of 0.7 g kg−1 between the early morning and the late afternoon. Relative to the WTP, the RMSE of the ERA-Interim q has a small difference of 0.1 g kg−1 in the ETP (Figure 4H). Clearly, the RMSE values of the NCEP and ERA-Interim reanalysis T and q exhibit the similar diurnal variations and they have a larger difference in the lower layer in the late afternoon than in the early morning in the WTP. But this difference is smaller in the ETP.
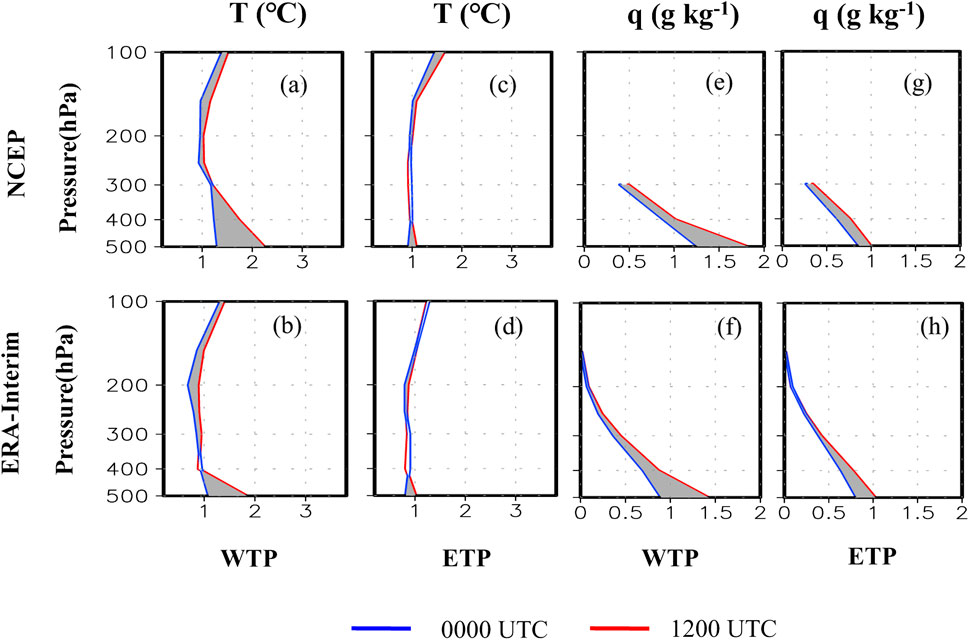
FIGURE 4. The RMSE profiles of the regional mean NCEP (A,C,E,G) and ERA-Interim (B,D,F,H) temperature (T) and specific humidity (q) over the ETP and the WTP at 00:00 UTC and 12:00 UTC. The gray shaded area indicates a difference between 12:00 UTC and 00:00 UTC.
It is worth mentioning that the sounding data at some stations in the TP shown in Figure 1 were not assimilated in the NCEP and ERA-Interim reanalysis datasets. This retains an independent dataset which can be used to evaluate the reanalysis data for excluding a potential effect of the data assimilation. To demonstrate the robustness of the results, we select the ten stations that are not in the GTS dataset and hence were not assimilated in the NCEP and ERA-Interim reanalysis datasets (red squares and dots shown in Figure 1). For convenience, these stations are called the unassimilated stations. Figure 5 displays the diurnal variations of T and q RMSE values at these unassimilated stations. In this figure, the temporal and spatial variations of the reanalysis T and q RMSEs are similar to those in Figure 4. In the WTP, the RMSEs of the NCEP 500-hPa T and q are 3.2°C and 2.3 g kg−1 at 12:00 UTC (Figures 5A,E), respectively, and have differences of 1.6°C and 0.8 g kg−1 from those at 00:00 UTC. The RMSEs of the ERA-Interim 500-hPa T and q are 2.2°C and 1.6 g kg−1 at 12:00 UTC (Figures 5B,F), respectively, with differences of 1.2°C and 0.6 g kg−1 from those at 00:00 UTC. Relative to the WTP, these differences are small in the ETP, with the RMSE differences of T and q around 0.1°C and 0.1 g kg−1 between the late afternoon and the early morning, respectively (Figures 5C,D and Figures 5g,h). The results at the unassimilated stations are similar to those from all stations (shown in Figure 4), which demonstrates the robustness of the diurnal variations of the reanalysis T and q RMSEs in the WTP and ETP. In the following section, we give a plausible physical explanation for the diurnal variations in RMSEs in the lower troposphere.
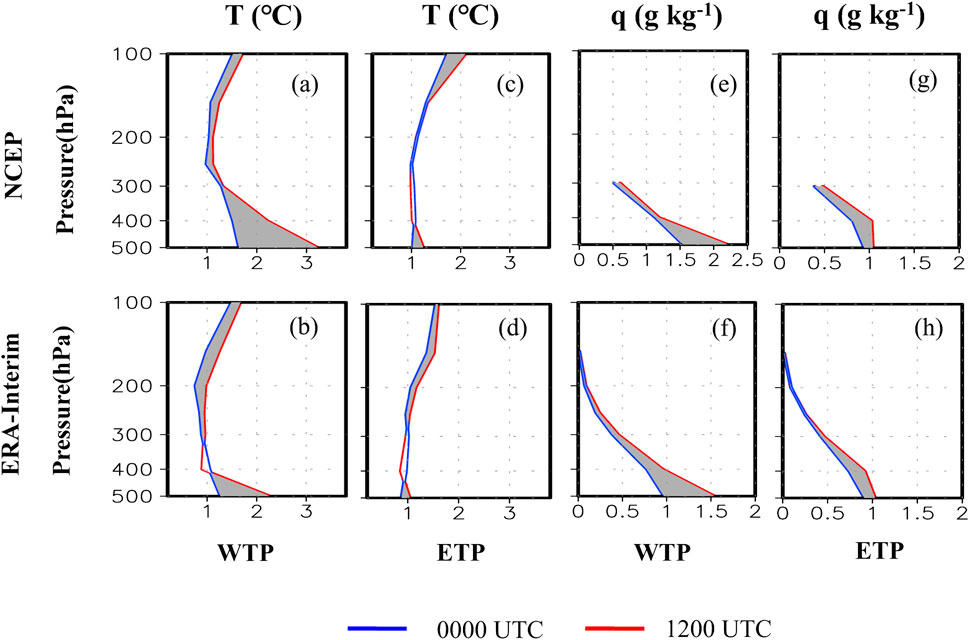
FIGURE 5. Same as in Figure 4 but at the unassimilated stations.
4 The effects of the atmospheric boundary layer height
As mentioned above, the large errors in the NCEP and ERA-Interim reanalysis T and q are mostly identified at 500 hPa. The TP has an average elevation higher than 4.0 km. Some studies have shown that the TP ABL can be as high as 2–3 km and the ABL processes significantly modify the weather systems over the TP (Ye and Gao 1979; Xu et al., 2002). Thus, we examine the characteristics of the TP ABL and its potential influences on the errors of the reanalysis T and q in the lower layers.
We first analyze the characteristics of the actual and model input terrain elevations over the TP (Figures 6A,B). The regional terrain elevation over the WTP/ETP is 4.4/3.2 km, 4.9/4.0 km, and 4.9/3.9 km for the observation, NCEP, and ERA-Interim datasets, respectively. Both the NCEP and ERA-Interim terrain elevations are generally higher compared to the observation in the TP. Figures 6C–F show the observed and reanalysis ABL heights over the TP at 00:00 UTC and 12:00 UTC. In this figure, both the observed and modeled ABL heights are low at 00:00 UTC, generally below 400 m (Figures 6C,D), and are high at 12:00 UTC, generally exceeding 1,000 m (Figures 6E,F). This feature supports the previous result that the continental ABL exhibits a diurnal variation with a shallow stable ABL from night to the early morning and a deep convective ABL in the daytime (Garratt, 1992). In addition, it is seen from Figures 6E,F that the spatial variation in the ABL height is more significant at 12:00 UTC than at 00:00 UTC, with a large difference between the WTP and ETP. The observed and modeled ABL heights are generally 1,500–1,600 m in the WTP and 600–800 m in the ETP, with a difference of 700 m–1,000 m between the WTP and the ETP, which is consistent with the previous results (Zhou et al., 2018; Che and Zhao, 2021).
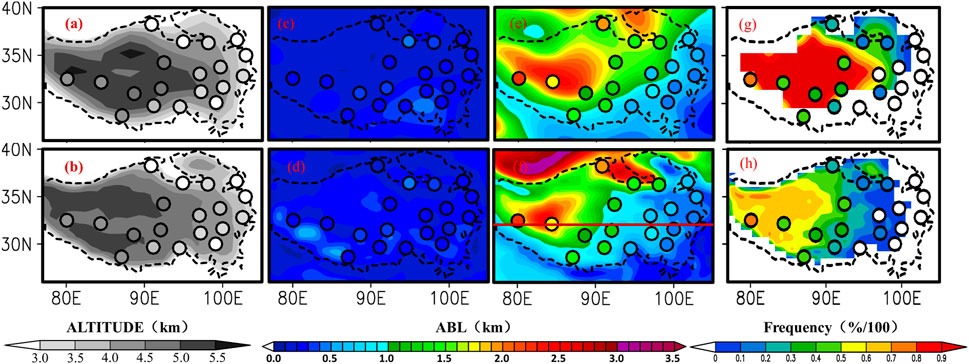
FIGURE 6. Spatial distributions of (A,B) terrain height and atmospheric boundary layer (ABL) height at (C,D) 00:00UTC and (E,F) 12:00UTC, and (G,H) occurrence frequency of the ABL height above the 500-hPa level at 12:00UTC in the TP. The top and bottom rows are for the NCEP and ERA-Interim reanalysis datasets, respectively. The filled colors in the circles are for observation and the shaded areas are for the reanalysis data. The red line in (f) represents the latitude 32.5°N.
Figure 7 presents the vertical cross sections of the terrain and ABL heights along the latitude of ∼32.5°N (shown in Figure 6F). There are seven sounding stations along this latitude including SQH, GZ, SZ, NQ, CD, GanZ, and Hongyuan (HY) (Figure 1 and Figure 6F). It is obvious that the observation and reanalysis terrain and ABL heights generally decrease from west to east at 12:00 UTC. There are large differences in terrain height between the two models and the observation, especially in the NCEP with the largest difference at station CD. At 00:00 UTC, the NCEP and ERA-Interim reanalysis ABL depths are generally thin above their model surface, which is consistent with the observed. The 500-hPa pressure level in both the WTP and ETP is much above the top of ABL and thus is mainly affected by the free atmospheric processes. At 12:00 UTC, however, the observed ABL height displays a larger increase in the WTP than in the ETP, which leads to a significant contrast in ABL height between the WTP and the ETP. At this moment, the 500-hPa pressure level is located within the ABL or near the top of ABL in the WTP, and is much higher above the top of ABL in the ETP. The NCEP and ERA-Interim reanalysis are able to capture this west-east difference in ABL height.
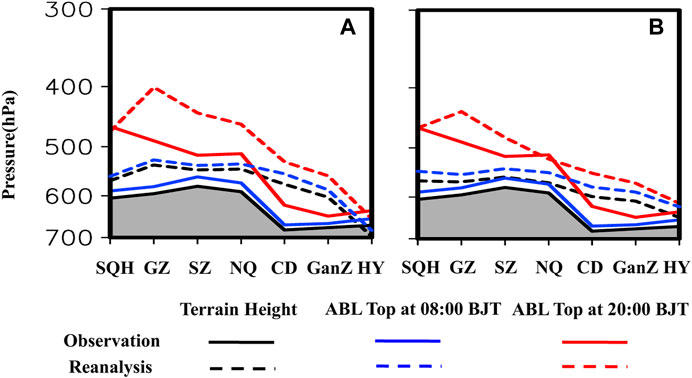
FIGURE 7. The vertical cross sections of the observational and reanalysis ABL heights along the latitude around 32.5°N (indicated by red line in Figure 6F), in which (A) is for the observation and the NCEP reanalysis and (B) is for the observation and the ERA-Interim reanalysis.
Figures 6G,H show the occurrence frequency of the observed and reanalysis ABL heights above the 500-hPa pressure level at 12:00 UTC. For convenience, we refer to the ABL above 500-hPa pressure level as the penetrating ABL. It is found that for observation, the frequency of the penetrating ABL is generally between 20% and 80% in the WTP (Figures 6G,H), with a regional mean of 43%. But in the ETP, the frequency of the penetrating ABL is rare. Compared to the observation, however, the occurrence frequency of the penetrating ABL in the NCEP reanalysis is greater than 50% in the WTP (Figure 6G), with a regional mean value of 73%. The similar phenomenon is also seen in the ERA-Interim reanalysis, with a regional mean value of 64% for the occurrence frequency of the penetrating ABL in the WTP (Figure 6H). It is evident that the occurrence frequency of the reanalysis penetrating ABL is larger by 20%–30% than the observation. In the ETP, the occurrence frequency of the NCEP and ERA-Interim reanalysis high ABL is low, with the regional mean values of 12% and 6%, compared to the observation (3%). In addition, the occurrence frequency of the penetrating ABL over the TP at 00:00 UTC is also calculated, which indicates the 500-hPa level is generally above the ABL over the TP because of a low ABL height at this moment (Figures 6C,D). These results imply a larger effect of the ABL physical processes in the models used in the NCEP and ERA-Interim reanalysis products on the 500-hPa meteorological conditions in the WTP than in the ETP and at 12:00 UTC than at 00:00 UTC.
Surface fluxes and turbulent transports directly affect the thermodynamics and winds in the ABL (Garratt 1994; Wang et al., 1999) that may lead to significantly differences in ABL temperature and water vapor compared to the free atmosphere. Overland, the boundary layer properties are characterized by substantial diurnal variations. Previous studies also identified larger errors in modeling temperature and humidity within the ABL than those in the free atmosphere (Betts et al., 1998; Dee et al., 2011) due to various issues of surface flux and/or turbulent mixing parameterizations in the forecast models. As such, there are large errors in the modeled temperature and humidity at the altitude ranges where there are mismatches of the ABL heights between the observations and the models. Figure 8 presents the distributions of the RMSE of the 500-hPa temperature and humidity and the occurrence frequency of the ABL top exceeding the 500-hPa pressure level. As illustrated in this figure, the RMSEs of both the reanalysis T and q gradually increase from east to west. The enhanced RMSEs of both T and q are consistent with the consequence of the modeled ABL height frequently penetrating through the 500-hPa pressure level. Specifically, at 12:00 UTC, the RMSEs of the reanalysis T and q are larger in the WTP, with regional averages of 2.2°C (NCEP) and 1.9°C (ERA-Interim) for T and 1.8 g kg−1 (NCEP) and 1.5 g kg−1 (ERA-Interim) for q. At 00:00 UTC when the 500 hPa level is persistently above the boundary layer, however, these errors in the WTP are generally smaller (1.0°C and 1.0 g kg−1), which is similar to those in the ETP where the diurnal variations of the errors are very weak for the low occurrence frequency of the ABL top exceeding the 500-hPa level.
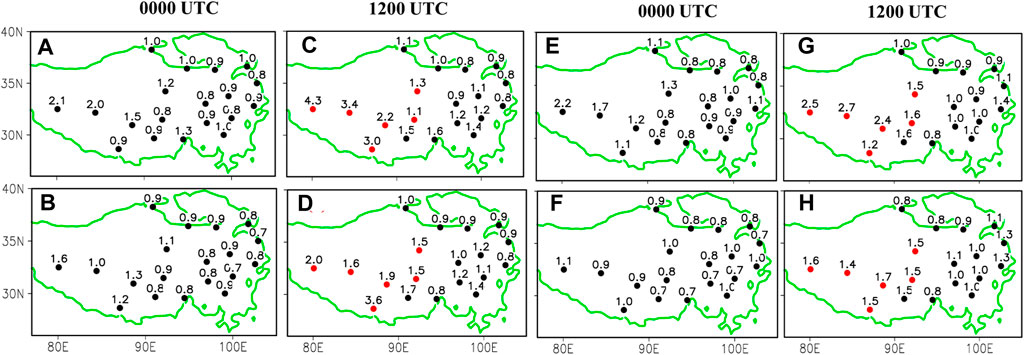
FIGURE 8. Distributions of RMSE of 500-hPa temperature (°C) at 0000 UTC (A,B) and 1200 UTC (C,D). The red dot indicates the observation stations with the occurrence frequency of the ABL height above the 500-hPa level at 12:00UTC exceeding 30%. Maps on top and bottom correspond to the NCEP and ERA-Interim reanalysis datasets, respectively. (E–H) are same as (A–D) except for specific humidity (g kg−1).
To verify the connection between the model temperature/humidity and ABL height errors, Figure 9 separates the observed high and low ABL cases. In the WTP, the 500-hPa pressure level is located inside the ABL when the observed ABL height is >1,500 m. In this case, the absolute value of 500-hPa temperature bias is positively correlated with that of the ABL height bias, with the correlation coefficients of 0.46 (significant at the 99.9% level) and 0.21 (significant at the 95% level) for the NCEP (Figure 9A, in blue) and ERA-Interim (Figure 9B, in blue) reanalysis datasets, respectively. Similarly, the 500-hPa specific humidity bias (Figures 9E,F, in blue) also has significantly positive correlations with the ABL height bias, with the correlation coefficients of 0.26 (significant at the 98% level) and 0.30 (significant at the 99% level), respectively. However, when the observed ABL height is less than 1,500 m, the 500-hPa pressure level is usually above the ABL. There are very weak correlations between the 500-hPa temperature (Figures 9A,B, in red) or specific humidity bias (Figures 9E,F, in red) and the ABL height one, with the correlation coefficients of 0.06–0.11. The above results further demonstrate that when the 500-hPa pressure level is within the ABL, the reanalysis ABL height bias contributes to the biases of 500-hPa temperature and specific humidity. In the ETP, this phenomenon is not observed. For both the high and low ABL cases, the 500-hPa temperature (Figures 9C,D) and specific humidity (Figures 9G,H) biases have no significant correlations with the ABL height bias, with the very low correlation coefficients of 0.01–0.09 in the NCEP and ERA-Interim reanalysis datasets, which implies a weak effect of the ABL processes in the reanalysis models on the 500-hPa temperature and specific humidity in the ETP.
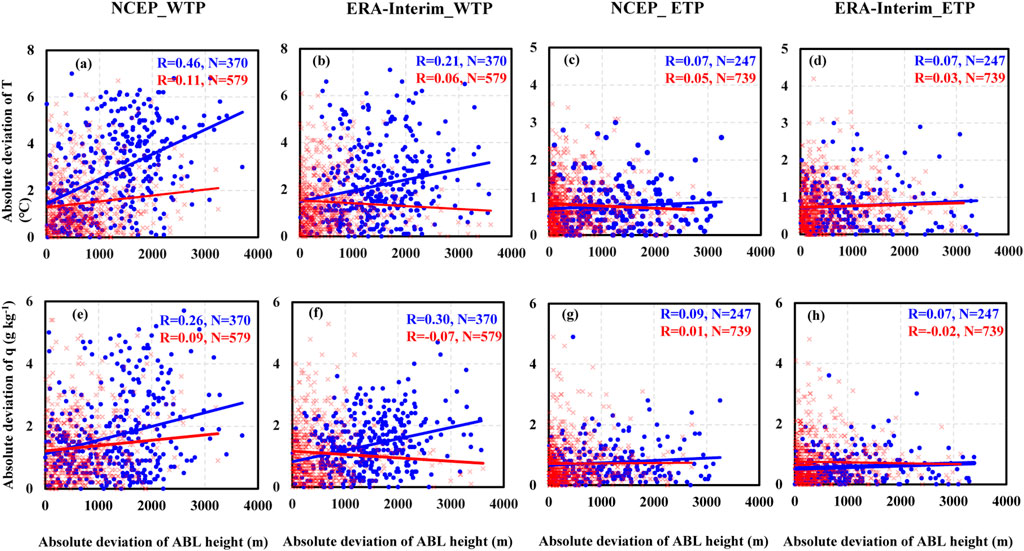
FIGURE 9. Top row: the correlations between the absolute values of the 500-hPa temperature bias and the ABL height bias at 12:00 UTC in the high (blue) and low (red) ABL cases in the WTP (A,B) and ETP (C,D). The (E–H) row is same as the top row, except for the absolute values of the 500-hPa humidity bias and the ABL height bias. The correlation coefficient (R) and the sample number (N) are given in each panel.
5 Conclusion and discussion
Using the TIPEX-III intensive and operational sounding observations in the TP during the 2013–2015 summers, temperature and humidity from the NCEP and ERA-Interim reanalysis data are evaluated. The results reveal that the vertical profiles of the summer reanalysis temperature and specific humidity and their standard deviations are generally consistent with the observed ones. However, the NCEP and ERA-Interim reanalysis temperatures are underestimated by 0 to -1°C compared to the observation. The NCEP specific humidity is higher at the low levels but is lower in the upper levels relative to the observation, while the ERA-Interim specific humidity is lager through the whole column. The errors of the reanalysis temperature and humidity at the low level, particularly at 500 hPa, display a large difference between the WTP and the ETP. These errors in the WTP are greater in the late afternoon than in the early morning, which does not appear in the ETP.
The temporal and spatial differences of temperature and humidity errors at 500 hPa are closely associated with the ABL processes used in the reanalysis models. In the early morning, the 500-hPa pressure level is above the top of the ABL in both the WTP and ETP, indicating that a large effect of physical processes in the free atmosphere rather than within the ABL. At this moment, the 500-hPa temperature and humidity biases have no significant correlations with the ABL height bias. In the late afternoon, however, with a greater growth of the observed ABL height over the WTP than over the ETP, the 500-hPa pressure level is located inside the ABL or near the top of ABL in the WTP, and is still above the ABL in the ETP. In this case, the ABL processes may remarkably affect the 500-hPa temperature and humidity in the WTP, with significantly positive correlation between the ABL bias and the 500-hPa temperature and humidity biases. In the ETP, however, the 500-hPa pressure level is still mainly affected by the physical processes in the free atmosphere, and the 500-hPa temperature and humidity biases have no significant correlations with the ABL bias.
The development of ABL is closely associated with surface sensible heat flux (Stull, 1988; Brooks and Rogers, 2000; Zhang et al., 2017; Che and Zhao, 2021). The ERA-Interim and NCEP reanalysis surface sensible heat fluxes have much larger errors in the WTP than in the ETP (Zhao et al., 2019a), which may lead to a larger bias in the ABL processes in the WTP. Thus reducing surface heat flux errors in the WTP is helpful to improve the ABL processes. Some studies have indicated that applying the maximum entropy model in calculating surface heat flux may remarkably reduce surface heat flux errors (Li et al., 2020). Moreover, the coupling error among land evaporation, boundary layer, and convective processes in the reanalysis model would have a significant impact on water vapor and temperature evolutions in the ABL (Betts et al., 1998) and the local atmospheric circulations such as the mountain-valley breezes induced by the combined effects of the complicated TP topography (Yu et al., 2020). These should also be addressed in future work.
Data availability statement
The raw data supporting the conclusion of this article will be made available by the authors, without undue reservation.
Author contributions
JC: Conceptualization, Methodology, Software, Validation, Formal analysis, Investigation, Data curation, Writing-original draft. PZ: Conceptualization, Methodology, Formal analysis, Writing-review and editing, Supervision.
Funding
This research was funded by the Strategic Priority Research Program of Chinese Academy of Sciences (XDA20100300), the Second Scientific Expedition to Qinghai-Tibet Plateau (2019QZKK020803), and the Natural Science Foundation of Shandong Province of China (ZR2021MD032).
Acknowledgments
We thank the European Center for Medium-Range Weather Forecast and the NCEP for providing their reanalysis data available on their homepages.
Conflict of interest
The authors declare that the research was conducted in the absence of any commercial or financial relationships that could be construed as a potential conflict of interest.
Publisher’s note
All claims expressed in this article are solely those of the authors and do not necessarily represent those of their affiliated organizations, or those of the publisher, the editors and the reviewers. Any product that may be evaluated in this article, or claim that may be made by its manufacturer, is not guaranteed or endorsed by the publisher.
References
Bao, Q., Lin, P., Zhou, T., Liu, Y., Yu, Y., Wu, G., et al. (2013). The flexible global ocean-atmosphere-land system model, spectral version 2: FGOALS-s2. Adv. Atmos. Sci. 30, 561–576. doi:10.1007/s00376-012-2113-9
Bao, X., and Zhang, F. (2013). Evaluation of NCEP–CFSR, NCEP–NCAR, ERA-interim, and ERA-40 reanalysis datasets against independent sounding observations over the Tibetan plateau. J. Clim. 26, 206–214. doi:10.1175/JCLI-D-12-00056.1
Betts, A. K., Kã¶hler, M., and Zhang, Y. (2009). Comparison of river basin hydrometeorology in ERA-Interim and ERA-40 reanalyses with observations. J. Geophys. Res. 114, D02101. doi:10.1029/2008JD010761
Betts, A. K., Viterbo, P., Beljaars, A., Pan, H. L., Hong, S. Y., Goulden, M., et al. (1998). Evaluation of land-surface interaction in ECMWF and NCEP/NCAR reanalysis models over grassland (FIFE) and boreal forest (BOREAS). J. Geophys. Res. 103, 23079–23085. doi:10.1029/98jd02023
Brooks, I. M., and Rogers, D. P. (2000). Aircraft observations of the mean and turbulent structure of a shallow boundary layer over the Persian Gulf. Bound. Layer. Meteorol. 95, 189–210. doi:10.1023/A:1002623712237
Brunke, M. A., Wang, Z., Zeng, X., Bosilovich, M., and Shi, C. (2011). An assessment of the uncertainties in ocean surface turbulent fluxes in 11 reanalysis, satellite-derived, and combined global datasets. J. Clim. 24, 5469–5493. doi:10.1175/2011jcli4223.1
Che, J. H., and Zhao, P. (2021). Characteristics of the summer atmospheric boundary layer height over the Tibetan Plateau and influential factors. Atmos. Chem. Phys. 21, 5253–5268. doi:10.5194/acp-21-5253-2021
Dee, D. P., Uppala, S. M., Simmons, A. J., Berrisford, P., Poli, P., Kobayashi, S., et al. (2011). The ERA-Interim reanalysis: Configuration and performance of the data assimilation system. Q. J. R. Meteorol. Soc. 137, 553–597. doi:10.1002/qj.828
Decker, M., Brunke, M. A., Wang, Z., Sakaguchi, K., Zeng, X., and Bosilovich, M. G. (2012). Evaluation of the reanalysis products from GSFC, NCEP, and ECMWF using flux tower observations. J. Clim. 25, 1916–1944. doi:10.1175/jcli-d-11-00004.1
Duan, A., Wu, G., Liu, Y., Ma, Y., and Zhao, P. (2012). Weather and climate effects of the Tibetan Plateau. Adv. Atmos. Sci. 29, 978–992. doi:10.1007/s00376-012-1220-y
Frauenfeld, O. W., Zhang, T., and Serreze, M. C. (2005). Climate change and variability using European centre for medium-range weather forecasts reanalysis (ERA-40) temperatures on the Tibetan Plateau. J. Geophys. Res. 110, D02101. doi:10.1029/2004jd005230
Garratt, J. R. (1994). Review: The atmospheric boundary layer. Earth. Sci. Rev. 37, 89–134. doi:10.1016/0012-8252(94)90026-4
Guo, J., Miao, Y., Zhang, Y., Liu, H., Li, Z., Zhang, W., et al. (2016). The climatology of planetary boundary layer height in China derived from radiosonde and reanalysis data. Atmos. Chem. Phys. 16, 13309–13319. doi:10.5194/acp-16-13309-2016
Hu, Q., Jiang, D., and Fan, G. (2014). Evaluation of CMIP5 models over the Qinghai-Tibetan plateau. Chin. J. Atmos. Sci. 38, 924–938. doi:10.3878/j.issn.1006-9895.2013.13197
Kalnay, E., Kanamitsu, M., Kistler, R., Collins, W., Deaven, D., Gandin, L., et al. (1996). The NCEP/NCAR 40-year reanalysis project. Bull. Amer. Meteor. Soc. 77, 437–471. doi:10.1175/1520-0477(1996)077<0437:tnyrp>2.0.co;2
Li, N., Zhao, P., Wang, J. F., and Deng, Y. (2020). The long-term change of latent heat flux over the western Tibetan plateau. Atmosphere 11, 262. doi:10.3390/atmos11030262
Liu, G., Zhao, P., Wu, R., and Chen, J. (2012). Potential flaws of interdecadal changes over eastern China around the early 1990s in the national Centers for environmental prediction-national center for atmospheric research reanalyses. J. Geophys. Res. 117. doi:10.1029/2011jd016327
Ma, L., Zhang, T., Li, Q., Frauenfeld, O. W., and Qin, D. (2008). Evaluation of ERA-40, NCEP-1, and NCEP-2 reanalysis air temperatures with ground-based measurements in China. J. Geophys. Res. 113, D15115. doi:10.1029/2007JD009549
Miao, Y., Hu, X., Liu, S., Qian, T., Xue, M., Zheng, Y., et al. (2015). Seasonal variation of local atmospheric circulations and boundary layer structure in the Beijing-Tianjin-Hebei region and implications for air quality. J. Adv. Model. Earth Syst. 7, 1602–1626. doi:10.1002/2015MS000522
Mooney, P. A., Mulligan, F. J., and Fealy, R. (2010). Comparison of ERA-40, ERA-Interim and NCEP/NCAR reanalysis data with observed surface air temperatures over Ireland. Int. J. Climatol. 31, 545–557. doi:10.1002/joc.2098
Seidel, D. J., Zhang, Y., Beljaars, A., Golaz, J. C., Jacobson, A. R., and Medeiros, B. (2012). Climatology of the planetary boundary layer over the continental United States and Europe. J. Geophys. Res. 117. doi:10.1029/2012jd018143
Tao, S., and Ding, Y. (1981). Observational evidence of the influence of the Qinghai-Xizang (Tibet) Plateau on the occurrence of heavy rain and severe convective storms in China. Bull. Am. Meteorological Soc. 62, 23–30. doi:10.1175/1520-0477(1981)062h0023:OEOTIOi2.0.CO,2
Vogelezang, D. H. P., and Holtslag, A. A. M. (1996). Evaluation and model impacts of alternative boundary-layer height formulations. Bound. Layer. Meteorol. 81, 245–269. doi:10.1007/bf02430331
Wang, A., and Zeng, X. (2012). Evaluation of multireanalysis products with in situ observations over the Tibetan Plateau. J. Geophys. Res. 117. doi:10.1029/2011jd016553
Wang, Q., Lenschow, D. H., Pan, L., Schillawski, R. D., Kok, G. L., Prevot, A. S. H., et al. (1999). Characteristics of the marine boundary layers during two Lagrangian measurement periods. 2. Turbulence structure. J. Geophys. Res. 104, 21767–21784. doi:10.1029/1998JD100100
Wang, Q., and Wang, S. (2004). Turbulent and thermodynamic structure of the autumnal arctic boundary layer due to embedded clouds. Boundary-Layer Meteorol. 113, 225–247. doi:10.1023/b:boun.0000039375.41823.22
Wu, C., and Zhou, T. (2011). Characteristics of cloud radiative forcings over East Asia as simulated by the AGCMs in the CFMIP. Acta Meteor Sin. 69, 381–399. doi:10.1016/B978-0-444-53599-3.10005-8
Wu, G., Liu, Y., Zhang, Q., Duan, A., Wang, T., Wan, R., et al. (2007). The influence of mechanical and thermal forcing by the Tibetan Plateau on Asian climate. J. Hydrometeorol. 8, 770–789. doi:10.1175/jhm609.1
Xu, X., Zhou, M., Chen, J., Bian, L., Zhang, G., et al. (2002). A comprehensive physical pattern of land-air dynamic and thermal structure on the Qinghai-Xizang Plateau. Sci. China Ser. D-Earth. Sci. 45, 577–594. doi:10.1360/02yd9060
Yanai, M., and Li, C. (1994). Mechanism of heating and the boundary layer over the Tibetan Plateau. Mon. Wea. Rev. 1222, 305–323. doi:10.1175/1520-0493(1994)122<0305:mohatb>2.0.co;2
Yang, K., Koike, T., Fujii, H., Tamura, T., Xu, X., Bian, L., et al. (2004). The daytime evolution of the atmospheric boundary layer and convection over the Tibetan plateau: Observations and simulations. J. Meteorological Soc. Jpn. 82, 1777–1792. doi:10.2151/jmsj.82.1777
Ye, D., and Gao, Y. (1979). The meteorology of the qinghai-xizang plateau. Beijing: Science Press, 89–101.
Ye, D., Tao, S., and Li, M. (1958). The abrupt change of atmospheric circulation over the northern hemisphere during June and October. Acta Meteor Sin. 29, 249–263.
Yu, L., Fu, Y. F., Yang, Y., Pan, X., and Tan, R. (2020). Trumpet-shaped topography modulation of the frequency, vertical structures, and water path of cloud systems in the summertime over the southeastern Tibetan plateau: A perspective of daytime–nighttime differences. J. Geophys. Res. Atmos. 125, e2019JD031803. doi:10.1029/2019JD031803
Zhang, W., Guo, J., Miao, Y., Liu, H., Yang, S., Fang, Z., et al. (2017). On the summertime planetary boundary layer with different thermodynamic stability in China: A radiosonde perspective. J. Clim. 31, 1451–1465. doi:10.1175/jcli-d-17-0231.1
Zhao, P., Li, Y. Q., Guo, X. L., Xu, X., Liu, Y., Tang, S., et al. (2019a). The Tibetan plateau surface–atmosphere coupling system and its weather and climate effects: The third Tibetan Plateau Atmospheric science experiment. J. Meteorol. Res. 33, 375–399. doi:10.1007/s13351-019-8602-3
Zhao, P., Xu, X., Chen, F., Guo, X., Zheng, X., Liu, L., et al. (2018). The Third Atmospheric Scientific Experiment for understanding the Earth–atmosphere coupled system over the Tibetan Plateau and its effects. Bull. Am. Meteorol. Soc. 99, 757–776. doi:10.1175/BAMS-D-16-0050.1
Zhao, P., Zhou, X., Chen, J., Liu, G., and Nan, S. (2019b). Global climate effects of summer Tibetan Plateau. Sci. Bull. 64, 1–3. doi:10.1016/j.scib.2018.11.019
Zhao, T., Wang, J., and Dai, A. (2015). Evaluation of atmospheric precipitable water from reanalysis products using homogenized radiosonde observations over China. J. Geophys. Res. Atmos. 120. doi:10.1002/2015JD023906
Zhou, W., Yang, S., Jiang, X., Guo, Q., et al. (2018). Estimating planetary boundary layer height over the Tibetan Plateau using COSMIC radio occultation data. Acta Meteor. Sin. 76, 117–133. doi:10.11676/qxxb2017.069
Zhou, X., Zhao, P., Chen, J., Chen, L., and Li, W. (2009). Impacts of thermodynamic processes over the Tibetan plateau on the northern hemispheric climate. Sci. China Ser. D-Earth. Sci. 52, 1679–1693. doi:10.1007/s11430-009-0194-9
Keywords: Tibetan Plateau, reanalysis evaluation, radiosonde data, boundary layer height, diurnal variation
Citation: Che J and Zhao P (2023) The NCEP and ERA-Interim reanalysis temperature and humidity errors and their relationships with atmospheric boundary layer in the Tibetan Plateau. Front. Earth Sci. 10:1083006. doi: 10.3389/feart.2022.1083006
Received: 28 October 2022; Accepted: 25 November 2022;
Published: 19 January 2023.
Edited by:
Bin Yu, Environment and Climate Change Canada (ECCC), CanadaReviewed by:
Yuanjian Yang, Nanjing University of Information Science and Technology, ChinaKe Wei, Institute of Atmospheric Physics (CAS), China
Copyright © 2023 Che and Zhao. This is an open-access article distributed under the terms of the Creative Commons Attribution License (CC BY). The use, distribution or reproduction in other forums is permitted, provided the original author(s) and the copyright owner(s) are credited and that the original publication in this journal is cited, in accordance with accepted academic practice. No use, distribution or reproduction is permitted which does not comply with these terms.
*Correspondence: Ping Zhao, emhhb3BAY21hLmdvdi5jbg==