 Rui Liu
 Hongmei Li1*
- 1Hydrogeology and Engineering Geology Institute of Hubei Geological Bureau, Jingzhou, China
- 2Sinopec Petroleum Exploration and Production Research Institute, Beijing, China
Over the years, scholars both at home and abroad have been committed to the research of geothermal fluid chemistry and genetic model, and geochemical and isotopic methods are usually the first choice for evaluation. In this paper, the characteristics of geothermal fluids and their genesis patterns in the Jingmen urban area are analyzed and studied by comprehensive utilization of techniques such as hydrochemistry, trace elements, and isotope analysis. The results show that the water chemical type of surface water and groundwater is Ca-HCO3 type, while the geothermal fluid belongs to the Ca-SO4 type. The recharge source of the geothermal fluid is the infiltration recharge of meteoric precipitation, and the recharge altitude is 395–435 m, and the geothermal fluid is modern water (less than 5–10 years old). The water-rock reaction has not reached equilibrium, and the dissolution is still in progress. The estimated mixing ratio of cold-water ranges from 30%–40%. The thermal reservoirs are mainly calcareous dolomite and dolomite of the Lower Triassic Jialingjiang Formation (T1j). The red sandstone and mudstone of the Upper Cretaceous Paomagang Formation (K2p) distributed in the area are good caprocks of the geothermal field. The geothermal energy in the urban area of Jingmen is a system of lateral “seepage.” Thermal water surges up along the Jingmen fracture and fracture zone, forming a relatively high-temperature center, and a part of its “seeps” laterally into the shallow pore aquifer or pore-fracture aquifer, which mixed with the cold water in it to form medium and low-temperature hot water around the center of the geothermal area.
1 Introduction
Energy and environmental issues have become two urgent issues for human beings today. As a new type of renewable energy that is eco-friendly, low-carbon, and recyclable, geothermal resources are the product of the interaction between geothermal energy, groundwater, and rock minerals. Thanks to the characteristics of large reserves, shallow burial, easy development, and low operating cost, it can be used as a heat source, water source, and mineral resource (Chen et al., 2016). Therefore, it is of great significance to speed up the exploration and research of geothermal resources. Previous studies on the chemical characteristics and genetic models of geothermal fluids mainly include: Craig (1961) first studied the D and 18O composition of more than 400 river water, lake water, and meteoric precipitation samples around the world, and obtained the linear relationship between the global meteoric precipitation δD and δ18O values. The famous Global Meteoric Water line (GMWL) provided an important theoretical basis for the study of groundwater origin and hydrogen and oxygen isotopes. Bowers and Fox, 1967 studied the thermodynamic parameters of minerals, gases, and dissolved components under a series of temperature and pressure conditions, as well as their chemical reaction equations, and established more than 600 corresponding phase diagrams. White (1968) proposed a classic medium and low temperature convective geothermal system, model. He pointed out that the normal or high regional heat flow provided heat from the bottom, and the meteoric precipitation penetrated downward through faults or fractured zones at the topographical high point of the recharge area and underwent a deep circulation. In the process of runoff, the groundwater continuously absorbed the heat of the surrounding rock and became hot water with different temperatures, which was exposed to the surface at appropriate structural parts, that is, hot springs. Reed (1983) proposed three different types of medium and low temperature convective geothermal systems based on the data obtained, which allowed the subsequent studies of geothermal systems to have rules to follow. Giggenbach (1988) proposed the classic triangular diagram method, thus making it easy to study the origin, equilibrium state, and formation mechanism of geothermal fluids, and he also proposed a modified calculation method of the geochemical thermometer. The World Meteorological Organization (WMO) and International Atomic Energy Agency (IAEA) jointly established “Global Network of Isotopes in Precipitation (GNIP)”, which laid a solid foundation for global isotope research. Cloutier et al. (2008) collected 153 groundwater samples in Canada. They used Hierarchical Cluster Analysis (HCA) and Principal Component Analysis (PCA) to assess the validity of the classification of groundwater samples and analyzed their hydrogeochemical processes. Kouadra et al. (2019) combined geochemical and statistical methods to conduct a hydrogeochemical study of geothermal water in the Constantine region of northeastern Algeria. Apollaro et al. (2019) used a multidisciplinary approach with new geological, hydrogeochemical, and isotopic data to study the origin of hot and cold water in the Galatero and Antoni Mina geothermal areas in Italy.
Previous studies have mostly separated the chemical characteristics of geothermal fluid from the geological characteristics of geothermal fluid. In this paper, based on the previous studies and in combination with the characteristics of geothermal resources of the Lower Triassic Jialingjiang Formation in the urban area of Jingmen, this paper makes full use of the techniques of hydrochemistry, micronutrient and isotope analysis, the geothermal fluid chemical types are systematically described, based on the analysis of the hydrochemical characteristics of geothermal fluid, geothermal cycle characteristics and the problems of heat source circulation and storage, the genetic model of geothermal system in this area is established, the deep understanding of the formation and evolution of geothermal fluid system in the urban area of Jingmen is of great theoretical significance, and provides a scientific basis for the later evaluation of the potential of geothermal resources.
2 Geological setting
Jingmen City is situated in the Hubei Province, central China. Tectonically, it is located at the junction of the Yunnan platform fold bundle and Zhongxiang platform fold bundle on the upper Yangtze platform of the Yangtze quasi-platform. In terms of the tectonic system, it belongs to the intersection zone of the northwestern margin of Jianghan Basin and the west wing of the Huaiyangshan-shaped structural fore-arc, the second subsidence belt of the Neocathaysian. Jingmen Fault is the main fault in the region, which controls the distribution of the Mesozoic-Cenozoic basins and troughs. Taking Jingmen Fault as the boundary, the east side is the Jingmen fault depression, the west side is the Jingdang syncline basin, and the central part of the north is the Jingshan arc fold belt.
The groundwater in this area is controlled by topography, stratigraphic lithology and structure. Along the strike of Jingmen fracture, the NNW-trending boundary runs through the middle of the survey area and divides the study area into two independent hydrogeological units. The Cretaceous-Paleogene argillaceous siltstone with mudstone, widely distributed east of Jingmen fracture, has very poor permeability and very little precipitation infiltration. It contains trace amounts of weathered fracture water and pore water and is regarded as a relative water-resisting layer. The main aquifers are composed of carbonate rocks in the middle of the north and the hidden carbonate rocks in the south. The marl and Jurassic sandstone in the west and south are secondary aquifers. The siltstone intercalated with mudstone and the Quaternary clay in the eastern part of the Cretaceous K2p formation are relative water-resisting layers.
The terrain of the Jingmen urban area is high in the northwest and low in the southeast, with significant topographic differences. The north and west side of the study area is the southeast extension of the Jingshan Mountains, which is a low-mountain hilly terrain. The mountain topography is the same as the structural line. The elevation is range from 200 to 660 m, and there are cliffs. Due to the control of the valley, the direction of the mountain range is the same as the direction of the structure line.
Based on the local meteorological data, the annual average precipitation is 978.8 mm, mainly concentrated in summer, accounting for 46.1% of the total annual water volume. This seasonal change in rainfall controls the changes in groundwater dynamics and thermal water inflow. Annual temperature ranges from −3.2–39°C (mean=15.9°C).
The study is carried out in the urban area of Jingmen, with the third ring line as the boundary line (Figure 1). Jingmen Fault runs through it from north to south, which is extensively distributed in the thermal reservoirs. The thermal reservoirs are mainly calcareous dolomite and dolomite of the Lower Triassic Jialingjiang Formation (T1j), representing a high permeability aquifer.
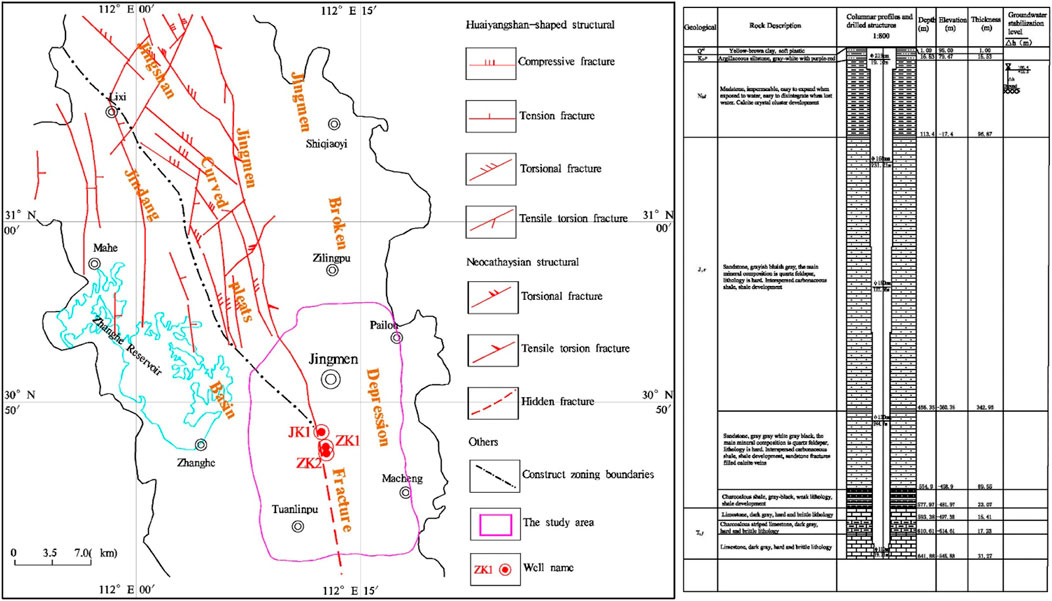
FIGURE 1. Location map of the study area.
3 Sample collection and experimental testing
3.1 Sample collection
Sampling work was conducted in December and January 2020, these months are regarded as the dry and cold seasons based on local meteorological records. The experimental samples of the three geothermal fluids (Well ZK1, ZK2, and JK1) studied in this paper were all from the carbonate karst water of the Lower Triassic Jialingjiang Formation (T1j) in the urban area of Jingmen. The remaining experimental samples were collected from surface water (lake), groundwater (cold spring, pore-fractured water), local rain, and snow in the field. The sampling information of the three geothermal wells is shown in Table 1.
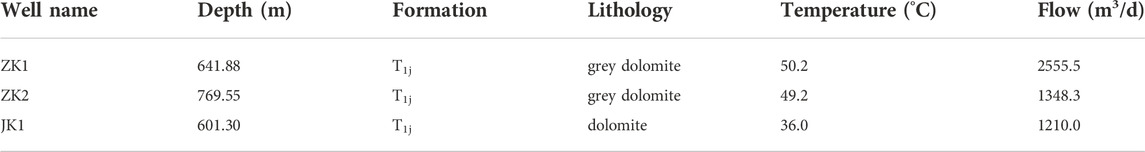
TABLE 1. Experimental sample information of Well ZK1, ZK2, and JK1.
3.2 Experimental testing
3.2.1 Hydrochemistry analysis and trace element experiment
The hydrochemistry analysis and trace element test of water samples were based on the method of (DZ/T 0063-93). The samples were tested in the Laboratory of Hubei Institute of Geosciences. The main test instruments and principles were as follows:
F−, Cl−, Br−, NO3−, and SO42- were detected using ion chromatograph ICS-900, an imported instrument boasting high sensitivity and high stability, which was produced by DIONEX, thus making the results more accurate. Working principle: according to the principle of ion exchange, the ions were retained on the column at their fixed positions after injection. Through the elution of the eluent, the carbonate ions were exchanged with the measured ions, and the measured ions were eluted. According to the affinity of the measured ions to the resin, the eluted elements had different peak times to achieve the purpose of detection. The eluate passed through the suppressor, and the suppressor guided the effluent into the conductivity detection cell, and then the signal was sent to the data processing system to obtain data.
K+, Na+, Fe2+, and Mn2+ were detected by atomic absorption spectrophotometer A3F-12. The instrument adopted the acetylene-air flame atomization mode to measure, which had a high degree of automation, good stability, and low detection limit. Working principle: Under normal circumstances, the atoms are in the ground state, and the hollow cathode lamp emits characteristic light. When passing through the atomic vapor, the ground state atoms absorb energy from the characteristic light and transition to the excited state, and the content of the element can be determined according to the weakening degree of light absorption. The degree of absorption conforms to Lambert Beer’s Law, by which the measured element content can be obtained.
NO2−, SiO2, and NH4+ were detected using 7230G spectrophotometry. This instrument was a traditional and reliable detection method, which could determine the content of substances through the selective absorption of light by substances and then through Lambert Beer’s Law. The principle is the same as that of atomic absorption, except that the light generated by the spectrophotometer is in the form of a band, which is absorbed by compounds or ions, while the linear light generated by atomic absorption is absorbed by ground-state atoms.
B was detected using an inductively coupled plasma mass spectrometer X2, which consisted of a plasma generator, spray chamber, torch, quadrupole mass spectrometer, and a fast-channel electron multiplier. Working principle: The atomizer sends the solution sample into the plasma light source, vaporizes at high temperature, dissociates the ionized gas, and the ions collected by the copper or nickel sampling cone form a molecular beam under the pressure of about 133.322 Pa in low vacuum, and then it enters the quadrupole mass spectrometer through a 1–2 mm diameter intercepting plate, and after mass separation by the mass filter, reaches the ion detector. According to the proportional relationship between the detector’s count and concentration, the element content can be measured.
3.2.2 Isotope experiment
The hydrogen and oxygen stable isotope testing instrument were the L2130i isotope analyzer, and the testing method was wavelength scanning-optical cavity ring-down spectroscopy. The detection accuracy was δ18O and δD is ±0.1‰ and ±1‰, respectively. Tritium (T) was tested on a 1,220 Quant ulus ultra-low background liquid scintillation spectrometer with a test accuracy of σ ≤ 0.6 TU, and one TU was equivalent to 0.11919 ± 0.00021 Bq/kg.
4 Experimental results and analysis
4.1 Hydrochemistry characteristics
The results of the water chemical analysis of the three geothermal wells, the ZK1, ZK2, and JK1, surface water (lake), and groundwater (cold spring, pore-fractured water) are shown in Table 2. According to the Piper three-line diagram (Figure 2), it can be seen that geothermal fluid is very different from surface water and groundwater. The water chemical type of geothermal fluid is Ca-SO4 type. The cation is mainly Ca2+, accounting for more than 70% of the milliequivalent percentage of cations, followed by Mg2+, accounting for about 20%. The anion is dominated by SO42-, accounting for about 80% of the milliequivalent percentage of anions, followed by HCO3−, accounting for about 15%. The total dissolved solid (TDS) is greater than 1,500 mg/L. The water chemical type of surface water (lake) and groundwater (cold spring, pore-fractured water) is Ca-HCO3 type. Like geothermal fluid, the cation is mainly Ca2+. The anion is dominated by HCO3−, followed by SO42-. The maximum TDS is 622.96 mg/L, which is significantly lower than that of geothermal fluid. Whether it is geothermal water, surface water, or groundwater, the pH value is basically greater than 7.0, which is weakly alkaline.
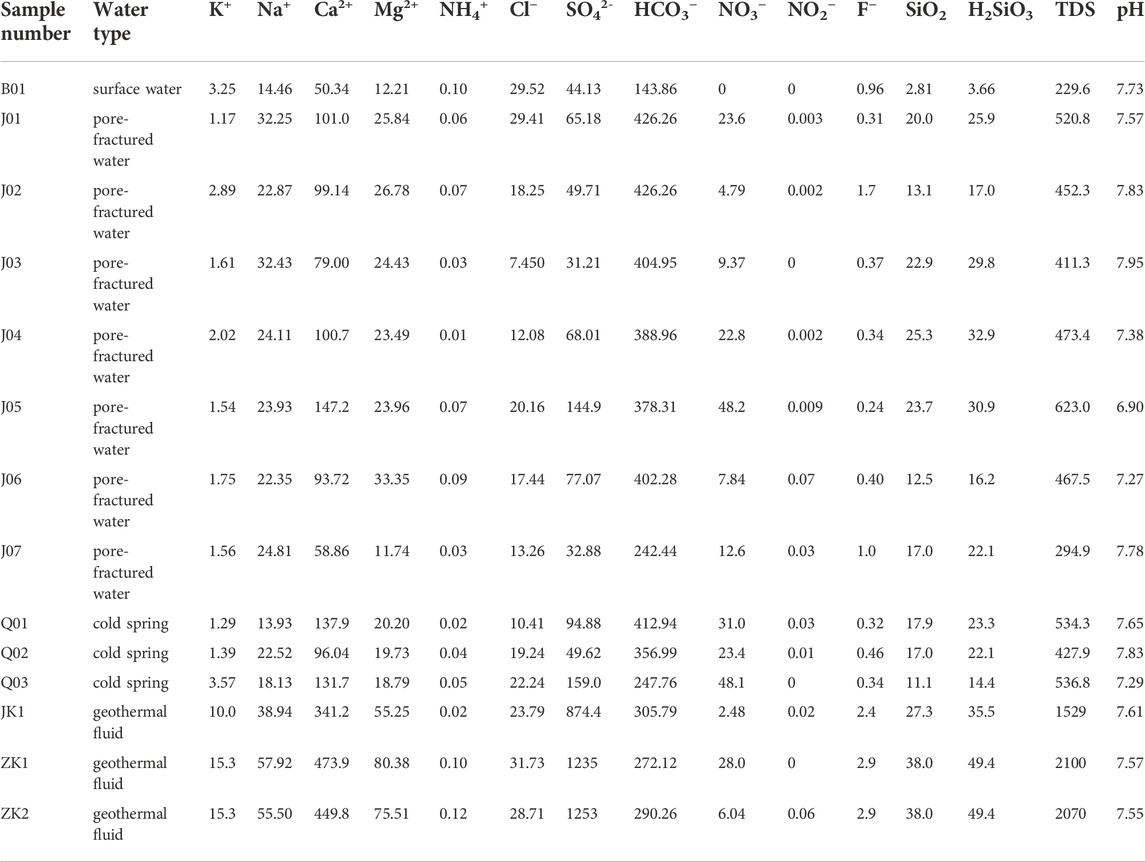
TABLE 2. Chemical composition analysis experiment data (Unit: mg/L).
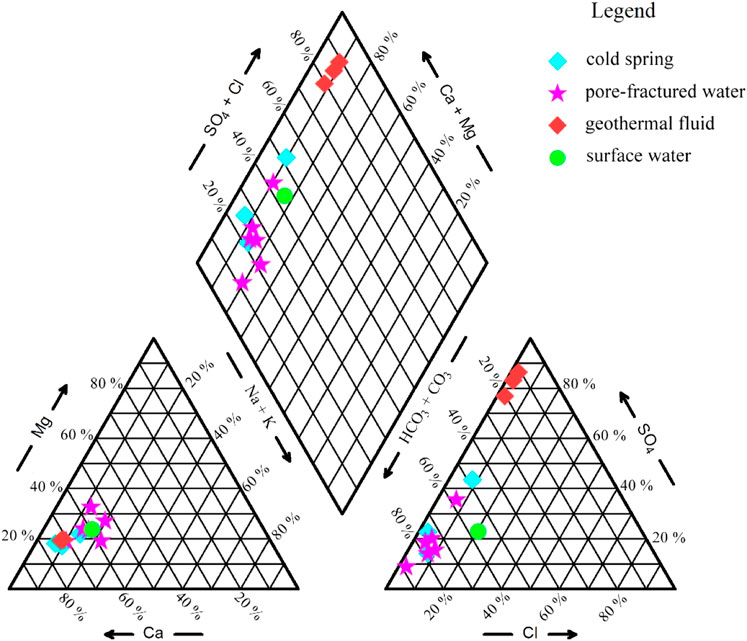
FIGURE 2. Piper three-line diagram of water chemical types.
The Upper Cretaceous Paomagang Formation (K2p) contains abundant gypsum, and SO42- is dissolved in gypsum. The fault zone provides the space and passage for the groundwater deep circulation, and the leaching of groundwater creates a hydrologic geochemistry environment conducive to fluorine migration and accumulation. In addition, when the water contains a lot of sodium, it forms soluble sodium fluoride, which ensures the high stability of fluorine in solution and creates favorable conditions for the enrichment of fluorine in the geothermal fluid.
The soluble ions (Na+, Ca2+, Cl−, and HCO3−) of groundwater can be sourced from a variety of natural processes, such as precipitation, water-rock interaction, and evaporation. The TDS versus Na+/(Na+ + Ca2+)and Cl−/(Cl− + HCO3−)diagrams can be used to evaluate the effects of these three different processes (Gibbs, 1970). The majority of the samples plotted in the field of rock weathering (Figures 3A,B), indicating water-rock interaction is the main factor controlling dissolved hydro chemical components of water samples.
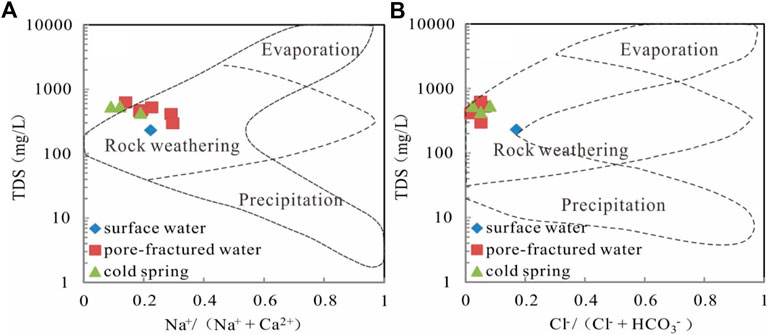
FIGURE 3. TDS versus (A) Na+/(Na+ + Ca2+) and (B) Cl−/(cl− + HCO3−).
4.2 Trace element characteristics
From the experimental results of the trace element content in the geothermal fluids of the wells ZK1, ZK2, and JK1 (Table 3), there are as many as 18 trace elements in the geothermal fluids. In addition to the common Sr and F with high content, they also contain Fe, B, Ba, Li, Br, I, and As, and other elements. In accordance with the classification standard of Specification for Estimation and Evaluation of Geothermal Resources, the geothermal fluids of the three geothermal wells, the ZK1, ZK2, and JK1 are divided according to the content of trace elements, which can be named for “fluorine water” and “strontium water".
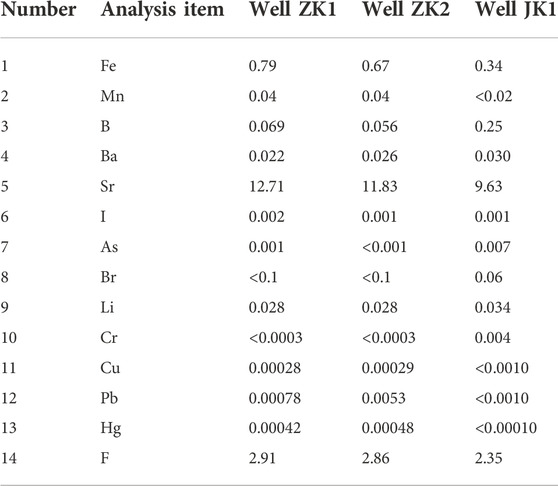
TABLE 3. Trace element content experiment data of geothermal fluids (Unit: mg/L).
4.3 Isotope analysis
4.3.1 The recharge source
Craig studied the global meteoric precipitation and obtained the linear relationship curve: δD = 8 δ18O+ 10, which was called the Craig equation (Craig, 1961). The straight line on the relationship diagram between δD and δ18O values was also called Global Meteoric Water Line (GMWL). Zheng et al. (1983) studied the meteoric precipitation in Beijing, Nanjing, Guangzhou, Kunming, Wuhan, Xi’an, Lhasa, Urumqi, etc. And concluded that the linear relationship between the δD and δ18O values of China’s meteoric precipitation was: δD = 7.9 δ18O+ 8.2. The straight line on the relationship diagram between the δD and δ18O values was called National Meteoric Water Line (NMWL). The composition of δD and δ18 O values of the meteoric precipitation has the following characteristics: ① the δD and δ18O values have a linear relationship; ② the δD and δ18O values of meteoric precipitation in most areas are negative values; ③ the δD and δ18O values are related to geographical location, and decreases with the increase of the distance from the steam source. Because ocean water is the evaporation source, its δD and δ18O values are 0. The stronger the evaporation is, the poorer the heavy isotopes are; ④ Most of the water samples near the equator fall on the upper right of the GMWL or NMWL, and the water samples near the North Pole and the Antarctic fall on the lower left (Zhou et al., 2017).
According to the hydrogen and oxygen isotope detection results of the geothermal fluids of the three geothermal Well ZK1, ZK2, and JK1, cold spring water, rainwater, and snow water in the field (Table 4), the detection results of hydrogen and oxygen isotope of all samples were projected to the GMWL and NMWL. It could be seen from the δD–δ18O relationship curve that the scatter points of the δD and δ18O values in the geothermal fluid are located near the GMWL and NMWL (Figure 4), indicating that the recharge of the geothermal fluid in the region comes from meteoric precipitation, and the degree of evaporation before meteoric precipitation infiltration is relatively weak.

TABLE 4. Detection results of hydrogen and oxygen isotope.
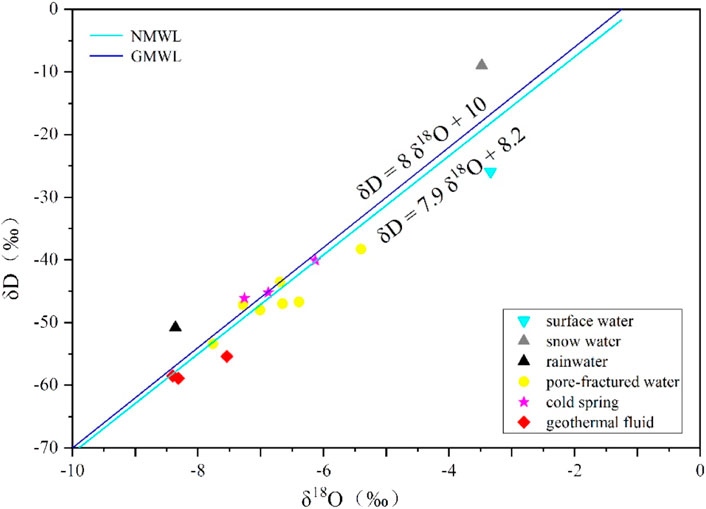
FIGURE 4. Relationship between δD and δ18O content.
4.3.2 The recharge altitude
The phenomenon that the hydrogen and oxygen isotopic composition of meteoric precipitation decreases gradually with the increase of altitude is called as elevation effect. According to this, the recharge altitude of the geothermal fluid recharge area can be determined, and the calculation formula is:
Where H is the elevation of the recharge area, m; h is the elevation of the sampling point, m; δG is the δD value of the water sample at the sampling point, ‰; δP is the δD value of meteoric precipitation near the sampling point, ‰; K is the isotopic elevation gradient of meteoric precipitation, δ/100 m.
The gradient K value of δD value of the meteoric precipitation is selected as -2.7‰/100 m, and the recharge altitude of the geothermal fluid in the study area can be obtained by using hydrogen isotope calculation to be 395–435 m. This is consistent with the height of the Xiaoyan-Lixi mountain area on the north and west side of the Jingmen Fault. Most of the area is 400–500 m in the middle and low mountains with exposed carbonate rock. After receiving the infiltration and recharge of meteoric precipitation, as the depth increases, the groundwater obtains heat from the rock to form hot water. As a result, the recharge source of the geothermal fluid in the study area is meteoric precipitation in the Xiaoyan-Lixi mountain area on the north and west side of the Jingmen Fault.
4.3.3 Analysis of geothermal fluid
T is an ideal tracer for studying groundwater at the origin of modern infiltration. T content in meteoric precipitation has the following characteristics: latitude effect, continental effect, elevation effect, seasonal effect, and rainfall effect. Depending on whether T content in groundwater is affected by the nuclear explosion, empirical methods can be used to estimate the age of the water after the nuclear explosion: ① T content <0.7 TU, which was replenished before 1953. ② T content between 0.7 and four TU, which is a mixture of pre-1953 recharge water and modern recharge water. ③ T content is between 5 and 15 TU, which is modern water (less than 5–10 years). ④ T content is between 15 and 30 TU, and a small part of the water was supplied in the 1960s–1970s ⑤ T content is more than 30 TU, quite a part of which might be supplied in the 1960s–1970s ⑥ T content >50 TU, mainly supplied in the 1960s–1970s (Zhou et al., 2015; Ta et al., 2018).
According to the T isotope detection results of geothermal fluid of the three geothermal wells, the ZK1, ZK2, and JK1, cold spring water, rainwater, and snow water (Table 5), T content in the geothermal water is mainly concentrated in the range of 5–10 TU, which is similar to the T content of cold spring water and rainwater samples. According to the empirical classification standard, the geothermal water in the study area is modern water (less than 5–10 years).
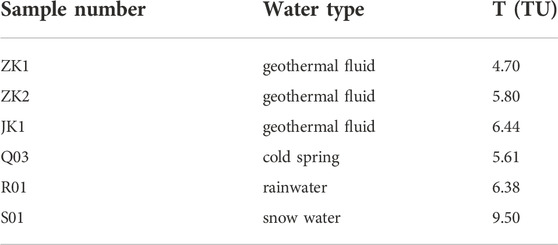
TABLE 5. T isotope test results.
5 Discussion
5.1 Mineral-fluid equilibrium judgment
The quantitative judgment of the chemical equilibrium state between minerals and thermal fluids in geothermal systems is not only the basic premise for evaluating the applicability of the conventional chemical temperature scale methods but also an important basis and means for studying many hydrothermal-chemical processes (Wang et al., 1993). The Na-K-Mg triangular diagram method was proposed by Giggenbach and Goguel (1989) to study the equilibrium state and type division of underground thermal fluids. The coordinate formulas in the Na-K-Mg triangular diagram are as follows:
Where CNa, CK, and CMg are the concentration of Na, K, and Mg ions in the water, respectively, mg/L.
The three vertices of the triangular diagram represent the maximum value of Na/1,000, K/100, and
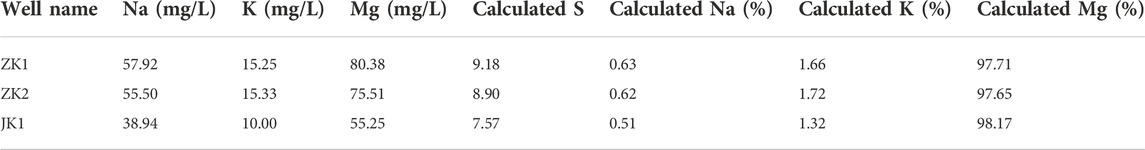
TABLE 6. Conversion of Na, K, and Mg ion concentrations to percentage in the geothermal fluids.
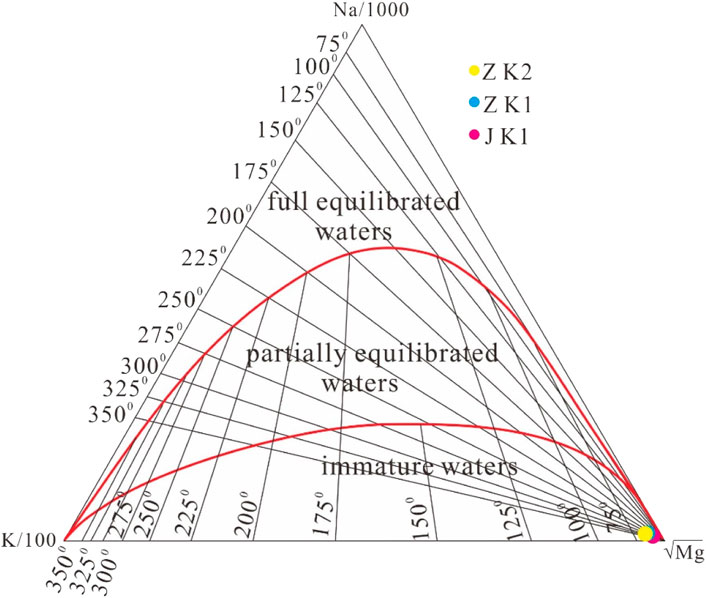
FIGURE 5. Triangular diagram for Na-K-Mg.
5.2 Mixing of hot and cold water
The mixing effect among different fluids in geothermal systems exists extensively. Geothermal water is often mixed water, and deep hot water or steam mixes with other water on its way to the surface or to a geothermal well (Yin, 1988). This situation generally occurs in the upper part of geothermal systems. Cold water is somewhat denser than hot water and may submerge under sufficient pressure into shallow thermal aquifers.
The Schoeller plot method is used to illustrate changes in water chemistry over time for water samples at different locations and is often used to evaluate the mixing of hot and cold water. The method is to connect the logarithm of the component concentrations of many water samples into a curve. Since the logarithmic coordinates are used for the concentrations, the concentrations in a large range can be represented in the figure. The effect of mixing with dilution water has the effect of shifting the curve vertically without changing its shape. By virtue of the experimental data of water chemistry analysis, it can be seen in the semi-logarithmic Schoeller plot that most of the components of the geothermal water (such as K+, Mg2+, Ca2+, SiO42-, Cl−, and F−) follow the same trend as the bedrock underground cold water samples except for some minor differences (Figure 6), which indicates that subsurface hot water mixes with cold water.
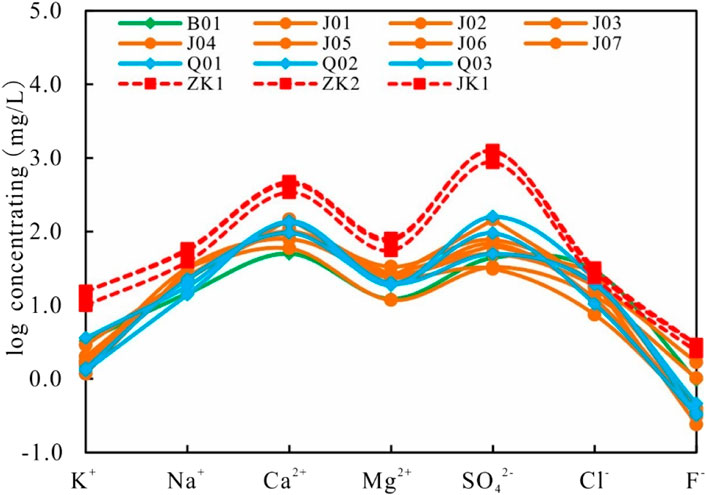
FIGURE 6. Schoeller plot.
Meanwhile, according to the T isotope detection results of the three geothermal wells, the ZK1, ZK2, and JK1, cold spring water, rainwater, and snow water, the T content of the geothermal fluid is relatively close to that of cold spring water and rainwater samples. Combined with the results of the field hydrogeological survey, the possible reason is the mixing of shallow cold water. After the 1990s, due to the frequent activities of urban construction and mountain quarrying in the recharge area of the northern part of the geothermal field, the infiltration intensity and infiltration volume of surface water increased, and geothermal water was mixed with shallow cold water in the process of rising along the Jingmen fracture and its fracture zone, and the low T value in hot water (T value in ancient hot water is 0) mixed with the high T value in the shallow cold water, resulting in a significant increase of T content in hot water. Based on the analysis of the Na-K-Mg triangle diagram, the experimental data of the geothermal fluid in the urban area of Jingmen area all fall in the “immature waters” area, and they are all located near the apex of the lower right corner of the Mg ion, which indicates that the geothermal water in this area is in the primary stage of the water-rock reaction. It is mainly caused by the mixing of a large amount of shallow cold water.
Based on the analysis results of the Schoeller diagram method, T isotope and Na-K-Mg triangle diagram, it is jointly defined that there is a mixing of underground hot water and shallow cold water in the urban area of Jingmen.
To evaluate the mixing ratios of cold water, the field temperature and silica concentration of geothermal fluid and shallow cold water has been carried out, based on silicon and enthalpy content. Fournier and Truesdell (1974), Fournier (1977) proposed a graphical way. The intersection of silica and enthalpy content represents the maxing portion of the geothermal fluid and shallow cold water and can estimate the reservoir temperature (Zhang et al., 2017) (Figure 7) We can infer the mixing ratio and reservoir temperature are 0.56–0.78 and 112–175°C, respectively.
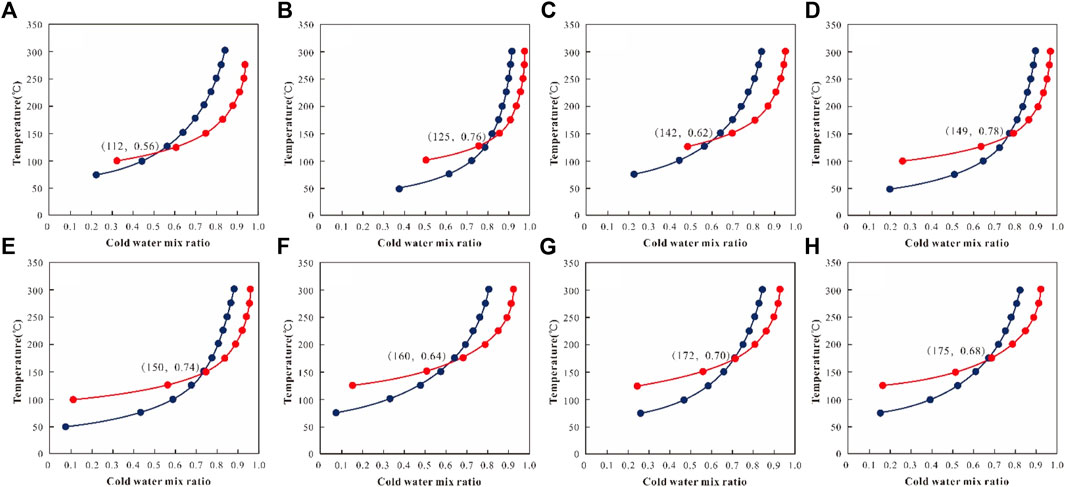
FIGURE 7. Relationship between temperature and cold-water mix ratio (A-H).
A silica-enthalpy graphic method can be used to estimate the reservoir temperature of the mixing water (Giggenbach, 1988; Gupta and Roy, 2007; Sun, 2015), and the relationship between geothermal fluid temperature and silica and enthalpy content (Table 7) (Fournier and Truesdell, 1974; Gupta and Roy, 2007; Maria et al., 2012). This method has two assumptions: ① No further solutions or deposition of silica exist before or after mixing. ② The mineral that controls the silica concentration is quartz. Using a straight line to connect the silica-enthalpy points of cold water and thermal water, and make an extension line to intersect the quartz solubility curve (No steam loss) (Figure 8) (Fournier and Truesdell, 1974). The mixing ratio of cold water is calculated by dividing the distance between the silicon-enthalpy points of cold water and the geothermal fluid by the distance between the silicon-enthalpy points of cold water and the intersection of the above extension line. When no steam loss occurs, the mixing ratio of cold-water ranges from 30%–40%, while the reservoir temperature is about 105–154°C, suggesting that a large supply of cold water is in a surficial place.
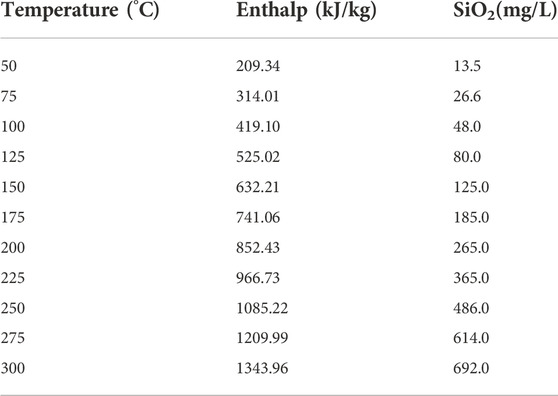
TABLE 7. The relationship between geothermal fluid temperature and silica and enthalpy content.
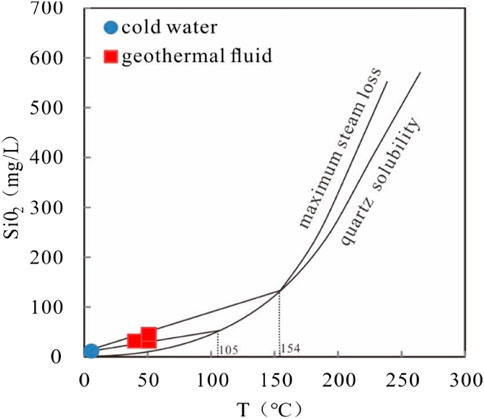
FIGURE 8. The mixing model.
5.3 Genetic model of geothermal system
The preliminary analysis of the genetic model of the underground hot water in the geothermal field is as follows: the groundwater is recharged by meteoric precipitation in the exposed carbonate rock area of the middle and low mountains in the Xiaoyan-Lixi area in northwest Jingmen, and recharge altitude is 395–435 m. Geothermal water is modern water (less than 5–10 years). The red sandstone and mudstone of the Upper Cretaceous Paomagang Formation (K2p) distributed in the area are good caprocks of the geothermal field. Such rocks, with high mud content, extremely weak water permeability, and poor conductivity, are good thermal insulation materials, and heat energy is not easily dissipated from them. The thermal reservoirs are mainly calcareous dolomite and dolomite of the Lower Triassic Jialingjiang Formation (T1j). Jingmen Fault is the thermal and water-conducting structure of the geothermal field. According to the drilling exposure, the carbonate core near the fracture zone is more broken, dense with small fissures generally 2–5 mm wide, and some measuring 1–3 cm wide. Generally speaking, there are several and sometimes even 10 to 18 fissures distributed per 10 cm. The fissures are open, mostly filled with calcite veins, and obvious water erosion traces can be found on the fracture surface, indicating obvious groundwater activity. Jingmen Fault has an extension of 170 km and a cutting depth of more than 1,000 m. Some studies believe that the fracture is a fracture of the silicon-magnesium layer, which has cut through the Moho surface. Jingmen Fault enables the exchange of heat between groundwater and the deep part of the Earth’s crust, and the groundwater migrates to the site with favorable geological conditions, upwelling along the fractured zone, forming a relatively high-temperature center, and a part of thermal water laterally “seeps” to the shallow pores in the aquifer or pore and fissure aquifer to mix with the cold water in it and form medium and low temperature underground hot water around the center of the geothermal area. During the Cretaceous-Paleogene period, Jingmen fault depression sag on the east side of Jingmen Fault subsided significantly and received thicker Cretaceous-Paleogene deposits, while the west side of Jingmen Fault was relatively uplifted, so the thermal reservoir was buried relatively shallowly. According to the above genetic conditions, the genetic model diagram of the geothermal system in the urban area of Jingmen has been initially constructed (Figure 9).
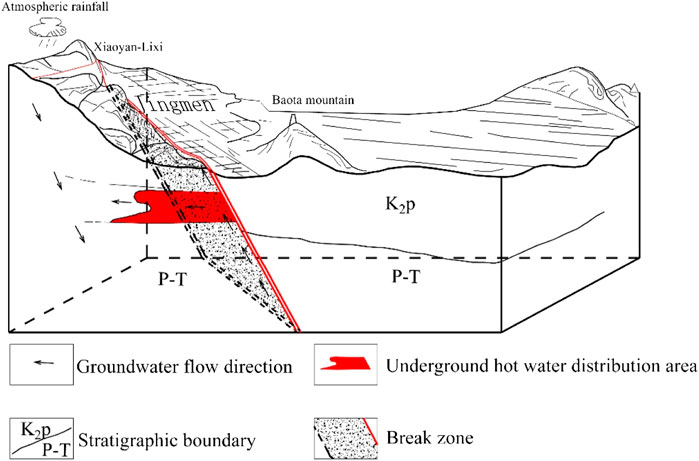
FIGURE 9. Genetic model of a geothermal system in the urban area of Jingmen. (K2p: The upper cretaceous paomagang Formation; P: Permian; T: Triassic).
6 Conclusion
The surface water (lake) and groundwater (cold spring, pore-fractured water) in the study area are dominated by the Ca-HCO3 type, while the geothermal fluid belongs to the Ca-SO4 type.
By using the Na-K-Mg triangle method, it can be found that all the experimental data of the geothermal fluid in the urban area of Jingmen fall in the “immature waters” area, which indicates that the water-rock reaction of geothermal fluid in this area has not yet reached equilibrium, and the dissolution is still in progress. The estimated mixing ratio of cold-water ranges from 30%–40%. According to the isotopic data analysis, the recharge source of the geothermal fluid is the infiltration recharge of meteoric precipitation, recharge altitude is 395–435 m, and geothermal fluid is modern water (less than 5–10 years old).
The geothermal energy in the urban area of Jingmen is a system of lateral “seepage.” Thermal water surges up along the Jingmen fracture and fracture zone, forming a relatively high-temperature center, and a part of it “seeps” laterally into the shallow pore aquifer or pore-fracture aquifer, which mixes with the cold water in it to form medium and low-temperature hot water around the center of the geothermal area (Bowers and Fox, 1967).
Data availability statement
The raw data supporting the conclusion of this article will be made available by the authors, without undue reservation.
Author contributions
RL and HL wrote the main manuscript text. ZHZ conducted field work. ZEZ conducted laboratory analysis. All authors reviewed and edited the manuscript. All authors have read and agreed to the published version of the manuscript.
Funding
This study was funded by the Geological Exploration Fund of Hubei Geological Bureau of the People’s Republic of China: Special Investigation of Geothermal Resources from the Urban Area of Jingmen (P62201600033).
Acknowledgments
The authors gratefully acknowledge Zhimin Li and Tianping Lu of Hubei Geological Bureau for their kind guidance and valuable suggestions in this study. We are also grateful to the reviewers, whose comments improved the quality of this manuscript.
Conflict of interest
The authors declare that the research was conducted in the absence of any commercial or financial relationships that could be construed as a potential conflict of interest.
Publisher’s note
All claims expressed in this article are solely those of the authors and do not necessarily represent those of their affiliated organizations, or those of the publisher, the editors and the reviewers. Any product that may be evaluated in this article, or claim that may be made by its manufacturer, is not guaranteed or endorsed by the publisher.
References
Apollaro, C., Tripodi, V., Vespasiano, G., De Rosa, R., Dotsika, E., Fuoco, I., et al. (2019). Chemical, isotopic and geotectonic relations of the warm and cold waters of the Galatro and Antonimina thermal areas, southern Calabria, Italy. Mar. Petroleum Geol. 109, 469–483. doi:10.1016/j.marpetgeo.2019.06.020
Bowers, R. W., and Fox, E. L. (1967). Metabolic and thermal responses of man in various He-O-2 and air environments. J. Appl. Physiology 23 (4), 561–565. doi:10.1152/jappl.1967.23.4.561
Chen, L. Z., Ma, T., Du, Y., Xiao, C., Chen, X., Liu, C., et al. (2016). Hydrochemical and isotopic (2H, 18O and 37Cl) constraints on evolution of geothermal water in coastal plain of Southwestern Guangdong Province, China(2H, 18O and 37Cl)constraints on evolution of geothermal water in coastal plain of southwestern Guangdong Province, China. J. Volcanol. Geotherm. Res. 318, 45–54. doi:10.1016/j.jvolgeores.2016.03.003
Cloutier, V., Lefebvre, R., Therrien, R., and Savard, M. M. (2008). Multivariate statistical analysis of geochemical data as indicative of the hydrogeochemical evolution of groundwater in a sedimentary rock aquifer system. J. Hydrology 353 (3-4), 294–313. doi:10.1016/j.jhydrol.2008.02.015
Craig, H. (1961). Isotopic variations in meteoric waters. Science 133 (3465), 1702–1703. doi:10.1126/science.133.3465.1702
Fournier, R. O. (1977). Chemical geothermometers and mixing models for geothermal systems. Geothermics 5 (1-4), 41–50. doi:10.1016/0375-6505(77)90007-4
Fournier, R. O., and Truesdell, A. H. (1974). Geochemical indicators of subsurface temperature. Part II. Estimation of temperature and fraction of hot water mixed with cold water. J. Res. U.S. Geol. Surv. 2 (3), 263–270.
Gibbs, R. J. (1970). Mechanisms controlling world water chemistry. Science 170, 1088–1090. doi:10.1126/science.170.3962.1088
Giggenbach, W. F. (1988). Geothermal solute equilibria. Derivation of Na-K-Mg-Ca geoindicatorsDerivation of Na-K-Mg-Ca geoindicators. Geochimica Cosmochimica Acta 52, 2749–2765. doi:10.1016/0016-7037(88)90143-3
Giggenbach, W. F., and Goguel, R. L. (1989). “Collection and analysis of geothermal and volcanic water and gas discharges,” in DSIR Report CD 2401, 4th ed. (Carlstadt, NJ, USA: Pentone), Vol 81.
Gupta, H. K., and Roy, S. (2007). Geothermal energy: An alternative resource for the 21st century. Amsterdam: Elsevier Scientific Publishing Company.
Kouadra, R., Demdoum, A., Chabour, N., and Benchikh, R. (2019). The use of hydrogeochemical analyses and multivariate statistics for the characterization of thermal springs in the Constantine area, Northeastern Algeria. Acta Geochim. 38 (2), 292–306. doi:10.1007/s11631-018-0298-z
Maria, P., Gimeno, M. J., Luis, F., Gomez, J., Acero, P., and Lapuente, P. (2012). Hydrochemistry and geothermometrical modeling of low-temperature Panticosa geothermal system (Spain). J. Volcanol. Geotherm. Res. 235-236, 84–95. doi:10.1016/j.jvolgeores.2012.05.007
Reed, M. S. (1983). Assessment of low-temperature geothermal resources of the United States -1982. Geol. Surv. Circ. 458-C, 19–21. doi:10.1002/0470014148.ch11
Sun, H. L. (2015). The bearing features and genetic model for geothermal resources in Guanzhoug basin. Beijing): China University of Geosciences, 109–111.
Ta, M. M., Zhou, X., Xu, Z., Wang, Y., and Guo, J. (2018). Occurrence and formation of the hot springs and thermal groundwater in Chongqing. Hydrogeology Eng. Geol. 45 (1), 165–172. doi:10.16030/j.cnki.issn.1000-3665.2018.01.24
Wang, J. Y., Xiong, L. P., and Pang, Z. H. (1993). Medium and low temperature convection geothermal system. Beijing: Science Press, 67–82.
White, D. E. (1968). Hydrology, activity and heat flow of the steamboat springs thermal system, washoe county, Nevada. Washington: Geological Survey Professional Paper, 458-C, 9–10.
Zhang, Y. H., Xu, M., Xiao, L., Qi, J., Zhang, Q., Guo, J., et al. (2017). Hydrochemical characteristics and multivariate statistical analysis of natural water system: A case study in kangding county, southwestern China. Water 10, 2–17. doi:10.3390/w10010080
Zheng, S. H., Hou, F. G., and Ni, B. L. (1983). Chabour, N. Study on hydrogen and oxygen isotopes of atmospheric precipitation in my country. Sci. Bull. 13, 801–806.
Zhou, X., Cao, Q., Yin, F., Guo, J., Wang, X. C., Z, Y. S., et al. (2015). Characteristics of the brines and hot springs in the triassic carbonates in the high and steep fold zone of the eastern sichuan basin. Acta Geol. Sin. 89, 1908–1920.
Keywords: geothermal, fluid chemical characteristics, genetic model, the urban area of Jingmen, geothermal fluid
Citation: Liu R, Li H, Zhao Z and Zhang Z (2023) Analysis of geothermal fluid chemical characteristics and genetic model—A case study from the urban area of Jingmen China. Front. Earth Sci. 10:1081781. doi: 10.3389/feart.2022.1081781
Received: 27 October 2022; Accepted: 23 November 2022;
Published: 23 January 2023.
Edited by:
Nagarajan Ramasamy, Curtin University Sarawak, MalaysiaReviewed by:
Jian Kuang, China University of Geosciences Wuhan, ChinaHemant Kumar Singh, Jawaharlal Nehru University, India
Copyright © 2023 Liu, Li, Zhao and Zhang. This is an open-access article distributed under the terms of the Creative Commons Attribution License (CC BY). The use, distribution or reproduction in other forums is permitted, provided the original author(s) and the copyright owner(s) are credited and that the original publication in this journal is cited, in accordance with accepted academic practice. No use, distribution or reproduction is permitted which does not comply with these terms.
*Correspondence: Rui Liu, MzA4NjAxOTg3QHFxLmNvbQ==; Hongmei Li, Y3VnbGhtQDE2My5jb20=