 Jiamin Hu
 Weijia Sun
 Congcong Liu
 Qingya Tang
 Li-Yun Fu
- 1Key Laboratory of Earth and Planetary Physics, Institute of Geology and Geophysics, Chinese Academy of Sciences, Beijing, China
- 2College of Earth and Planetary Sciences, University of Chinese Academy of Sciences, Beijing, China
- 3Shandong Provincial Key Laboratory of Deep Oil and Gas, China University of Petroleum (East China), Qingdao, China
- 4Laboratory for Marine Mineral Resources, Qingdao National Laboratory for Marine Science and Technology, Qingdao, China
The South China Block is located on the eastern margin of the Eurasian Plate and the western margin of the Pacific Plate. The South China Block is currently in a tectonically compressed environment, while the Tibetan Plateau is moving eastward and the Philippine Sea Plate is moving westward from geodetic observations. The South China Block is an ideal place to revisit tectonic history from the Archean to Cenozoic, where its information could be well preserved in the crust. In this study, we aim to build the crustal and uppermost mantle component of the Seismological Reference Earth Model in South China (SREM-SC) to provide a background velocity model for geological interpretations and fine-scale velocity inversion. The S-wave velocity model comes from combining models inverted by ambient noise tomography and surface wave tomography. The P-wave velocity model is obtained from converted S-wave velocity and joint inversion tomography. The density model is inferred from an empirical relationship with P-wave velocity. The Moho depth is obtained by a weighted averaging scheme of previously published receiver function results. The P-wave and S-wave velocity models have a grid interval of
1 Introduction
The South China Block (SCB), located on the Eurasian Plate’s southeast margin and the Pacific Plate’s western margin, is an important tectonic unit in the east of the Chinese mainland. It is adjacent to the North China Craton (NCC), bounded by the Qinling-Dabie orogen (QDO) and Tanlu Fault (TLF) in the north, the Songpan-Gantze Block (SGB) and the Tibetan Plateau (TP) in the west (Figure 1). South China Block is composed of two major blocks, the Yangtze Craton and the Cathaysia Block. The Yangtze Craton is mainly composed of the Paleoproterozoic crystalline basement, and the Cathaysia Block is mainly composed of Neoproterozoic basement rocks (Cawood et al., 2013; Zheng et al., 2013). The long period of intense tectonic movements and multistage superposition shaped the present tectonic features of the South China Block. In Neoproterozoic, the Yangtze Craton collided with the Cathaysia Block along the Jiangnan orogenic belt to form the South China block (Zhang et al., 2013; Mao et al., 2014; Yan. et al., 2018a). The North China Craton and the South China block are thought to have collided after the closure of the paleo-Tethys Ocean during the Triassic, resulting in the formation of the Qinling-Dabie orogenic belt (Shu, 2012; He et al., 2013; Wang et al., 2013; Yan et al., 2018b). The South China Block transitioned from Tethysian to Pacific tectonic regimes during the Early-Middle Jurassic, and thus the tectonic environment changed from convergence to extension, which led to large-scale lithosphere thinning, widespread magmatism, and extensive mineralization (Li and Li, 2007; Shu, 2012; Wang et al., 2013; Lü et al., 2014; Qiu et al., 2016; Qiu et al., 2017; Qiu et al., 2022).
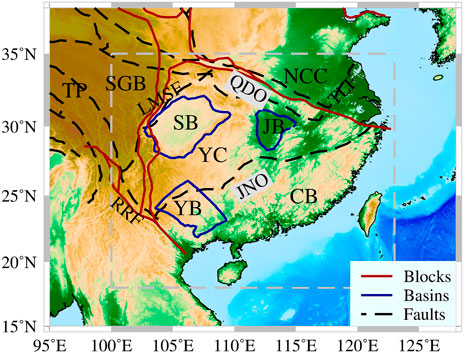
FIGURE 1. Tectonic background of South China Block. Thick red and blue lines indicate the boundaries of the major tectonic units and basins, after Zhang et al. (2003) and Su et al. (2018). Dash black lines indicate the major faults in the Chinese mainland (Deng et al., 2003). TP: Tibetan Plateau; SGB: Songpan-Gantze Block; QDO: Qinling-Dabie Orogen; NCC: North China Craton; TLF: Tanlu Fault; SB: Sichuan Basin; JB: Jianghan Basin; YB: Youjiang Basin; YC: Yangtze Craton; CB: Cathaysia Block; JNO: Jiangnan Orogen; RRF: Red River Fault; LMSF: LongMenShan Fault.
Understanding the crustal deformation and dynamic mechanism in South China requires detailed information about crustal structure and composition. In recent years, many geophysical studies have been conducted to image the crustal and uppermost mantle structure using various techniques, such as body wave tomography (He and Santosh, 2016; Sun and Kennett, 2016b; a; Qu et al., 2020), surface wave tomography (Zhou et al., 2012; Bao et al., 2015; Shan et al., 2016), receiver functions (He et al., 2013; He et al., 2014; Song et al., 2017; Zhang et al., 2018), joint inversion tomography (Guo et al., 2018; Guo et al., 2019; Gao et al., 2022), deep seismic reflection profiling (Deng et al., 2011; Lϋ et al., 2013), gravity analysis (Deng et al., 2014). Zhou et al. (2012) obtained the 3D S-wave velocity structure in South China through ambient noise and earthquake surface wave tomography and they found that the lithosphere is thick in the western Yangtze Craton but thin in the eastern Cathaysia Block. They hypothesized that the lithosphere of the Yangtze Craton and Cathaysia Block was eroded and thinned due to the flat slab subduction of the Pacific plate. He et al. (2013) obtained the distribution of crustal thickness and Vp/Vs in South China through the receiver function study, and inferred that the Jiujiang-Shitai fault defines a suture zone between the Yangtze Craton and Cathaysia Block. Guo et al. (2018) observed the lateral crustal structure variations beneath South China Block through the joint inversion of the surface wave and receiver functions, which supported the flat slab subduction model proposed by Li and Li (2007). Through joint inversion of body wave and surface wave, Gao et al. (2022) analyzed the thinning mechanism of the lithosphere in South China, and they preferred the flat slab subduction and its rollback model. In addition, a high-velocity belt was found in the middle crust, and they speculated that this high-velocity belt indicated the location of the Neoproterozoic Yangtze Craton and Cathaysia Block. There have been comprehensive geophysical studies in South China, but there are still some unresolved issues due to the complex tectonic events. For example, the location of the suture zone between the Yangtze Craton and the Cathaysia Block is still debated (Wang et al., 2010; He et al., 2013). Several competitive geological models such as the flat-slab subduction model (Li and Li, 2007), the underplating and delamination model (He et al., 2013), and the lateral asthenospheric flow model (Gong and John Chen, 2014) have been proposed for the formation of the Yangtze Craton and Cathaysia Block. Furthermore, different Mesozoic magmatic province formation mechanisms were also controversial (Zhou X. et al., 2006; Li and Li, 2007; Wang et al., 2013).
Kennett et al. (2013) and Salmon et al. (2013) proposed an Australian Seismological Reference Model (AuSREM) using a large amount of seismological information in the Australian region. This 3D seismological reference model not only shows the main structural features of the area but also provides a detailed basic reference model for the future study of the area. The AuSREM plays an important role in Australian research and has been cited more than 100 times so far. Some velocity models in South China have been obtained by different research methods, but there may be significant inconsistencies between various models. We propose a basic reference model for South China like the AuSREM. It is very helpful to solve the above-mentioned controversial issues. The purpose of establishing the crustal and uppermost mantle component of the SREM-SC is to summarize the extensive seismological information and methods in South China over the past decades and to provide 3D seismological reference models in South China and its surrounding areas.
The crustal and uppermost mantle component of the SREM-SC is grid-based, with 0.5-degree latitude and longitude sampling. The model grid ranges from 100°E to 121°E in longitude and from 18°N to 35°N in latitude. The properties of each grid point are defined by the sedimentary thickness of the basin, the Moho depth, P-wave velocity (Vp), S-wave velocity (Vs), and density. Using various types of seismic data, we created a database of well-constrained results. The Vs mainly comes from surface wave tomography. The Vp comes from converted Vs and body wave tomography. The density is obtained from the empirical relationship between the Vp and density.
The crustal structure has an important influence on the tomography of the lithospheric mantle and asthenosphere, so the establishment of this model is of great value to improve knowledge of the crustal structure and the seismic tomography work (Salmon et al., 2013). The crustal and uppermost mantle component of SREM-SC provides a reference model for other studies in this area, such as improving earthquake locations, seismic wave propagation modeling, and calculation of crustal corrections.
2 Data resources
We gathered various types of data and then combined them to construct the 3D seismological reference model for crustal and uppermost mantle structures in South China. The data resources for constructing the velocity model mainly come from various joint tomographic inversion results, while the data resources for constructing the Moho depth map are mainly from the receiver function studies.
We have collected five previously published S-wave velocity models for the lithosphere of the South China Block (Table 1). Previous studies have obtained 3D S-wave velocity models of the crust and upper mantle across the South China block by ambient noise and earthquake surface wave tomography (Zhou et al., 2012; Bao et al., 2015; Shen et al., 2016). The empirical Green’s functions (EGFs) estimated from the long-time cross-correlation of ambient noise provided shorter periods of dispersions (Shapiro et al., 2005). Therefore, combining both ambient noise and traditional surface wave tomography can get a more detailed lithospheric structure from the shallow crust to the upper mantle (Yao et al., 2006; Yao et al., 2010). Based on the algorithm of Zhang et al. (2014), some studies in South China combined body-wave arrival times and surface wave data to determine a high-resolution 3D S-wave velocity model of the lithosphere (Han et al., 2021; Gao et al., 2022).
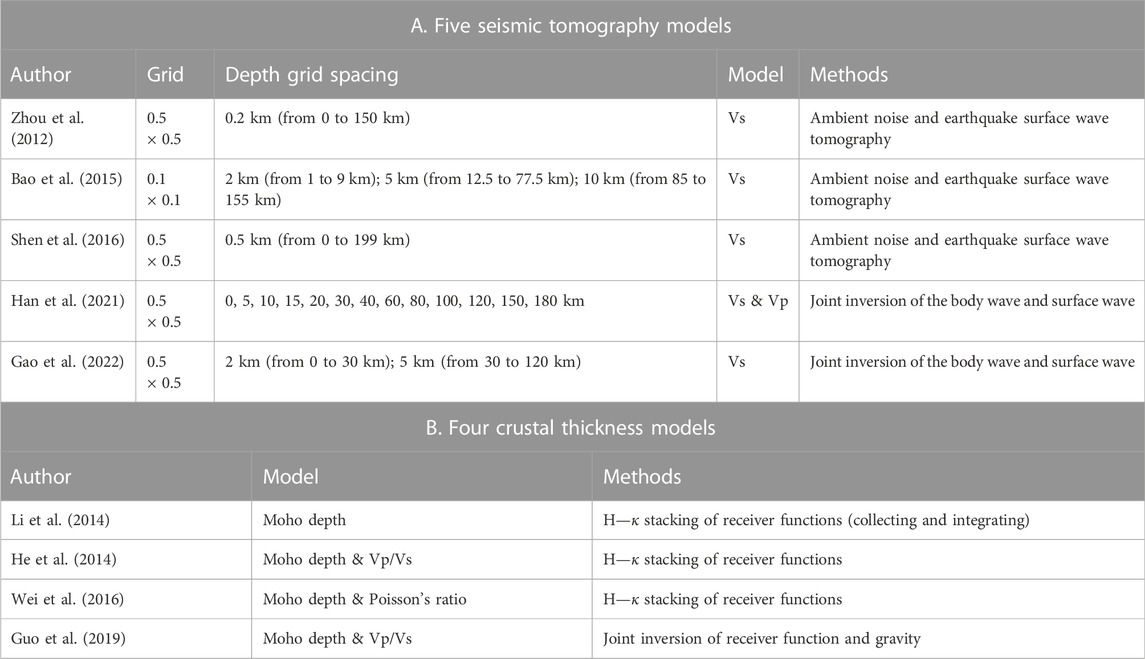
TABLE 1. Nine seismic models were used in this study. (A) Data resources of tomography inversion for the S-wave velocity model used in this study. (B) Data resources of receiver function for crustal thickness model used in this study.
We collected some estimations of crustal thickness, Poisson’s ratio, and Vp/Vs ratio in the South China Block from previously four published receiver function results (Table 1). The receiver function technique (Zhu and Kanamori, 2000) has become a general seismological method to investigate crustal thickness. It can extract P-to-S converted phases generated at seismic discontinuities effectively in the crust and upper mantle beneath seismic stations. Compared to the absolute velocities, receiver function methods provide better limits on the discontinuities. Li et al. (2014) summarized the crustal thickness of the Chinese mainland based on previous studies. He et al. (2014) integrated the three phases (converted Ps and multiple PpPs and PpSs + PsPs phases) of the Moho to estimate the crustal thickness and average Vp/Vs ratio of continental China using the H-k stacking method of receiver functions (Zhu and Kanamori, 2000). Wei et al. (2016) used the same method but more data to calculate the Moho depth and Poisson’s ratios beneath eastern China. Guo et al. (2019) enhanced the method for the joint inversion of gravity and receiver function and apply it to improve the estimates of crustal thickness and Vp/Vs ratio in South China.
3 Sediments thickness
Sediment thickness, seismic properties, and geometrical features of basins can be used to better understand the basin’s geological evolution (Zhou J. et al., 2006; Li et al., 2012). CRUST1.0 is the latest and widely used global model of the crust. Based on the existing seismic detection results of active and passive sources, combined with gravity inversion research, the model gives information on sediment thickness, crustal thickness, and velocity structure with 1.0-degree latitude and longitude sampling (Laske et al., 2013). Xiao et al. (2021) provided the thickness of sediments model beneath continental China by using the Rayleigh wave ellipticity, P polarization, and receiver function method.
Based on the model of CRUST1.0 and the study of Xiao et al. (2021), we establish a sedimentary thickness model in South China. We provide a comparison of the different weighting values for the sediment thickness model in the supplementary material (Supplementary Figure S6), evidencing that the weighting values have little effect on the final model. CRUST1.0 is a global model with less data coverage over South China than Xiao et al. (2021), so we think the weighting value 6:4 is an appropriate choice. The final weighting model for the sediment thickness
where
Figure 2 displays the thicknesses of sediment in the South China Block. The thickest deposits are concentrated in the Sichuan Basin and the thickness of sedimentary cover reaches 5–10 km. The deposits are mainly composed of the Palaeozoic and middle Mesozoic strata (Wang et al., 2016; Liu et al., 2021). It has the thickest shales (up to 300 m) and has become China’s primary region for shale gas exploration (Zou et al., 2019). The Jianghan and Youjiang basins have no obvious deposits, but they have rich mineral resources and play an important role in the tectonic evolution of the South China block. The Jianghan basin is a typical continental petroliferous basin with salt layers. It is a rifted basin of Cretaceous-Paleogene formed on the Yangtze platform, covering
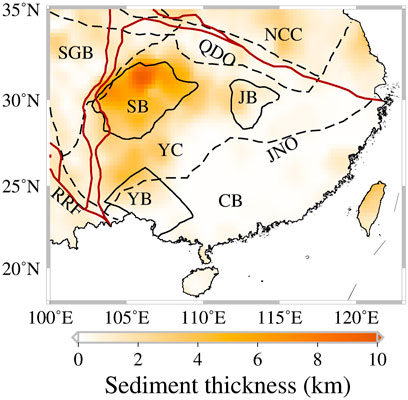
FIGURE 2. The thickness of sediments in the South China Block is based on the study of Laske et al. (2013) and Xiao et al. (2021).
4 Moho depth
The Moho provides an immediate connection between the crustal and mantle component of SREM-SC. We have collected many studies on the crustal thickness in South China using the receiver function method or joint inversion method (Table 1). The left column of Figure 3 shows that the distribution of stations in South China is relatively uniform, and some temporary arrays are added in the study of Li et al. (2014) and Wei et al. (2016). The Moho depth of these studies showed great consistency, except in some areas, which may be caused by the different data sets or the details of the method (filters, selection of events, and the parameters).
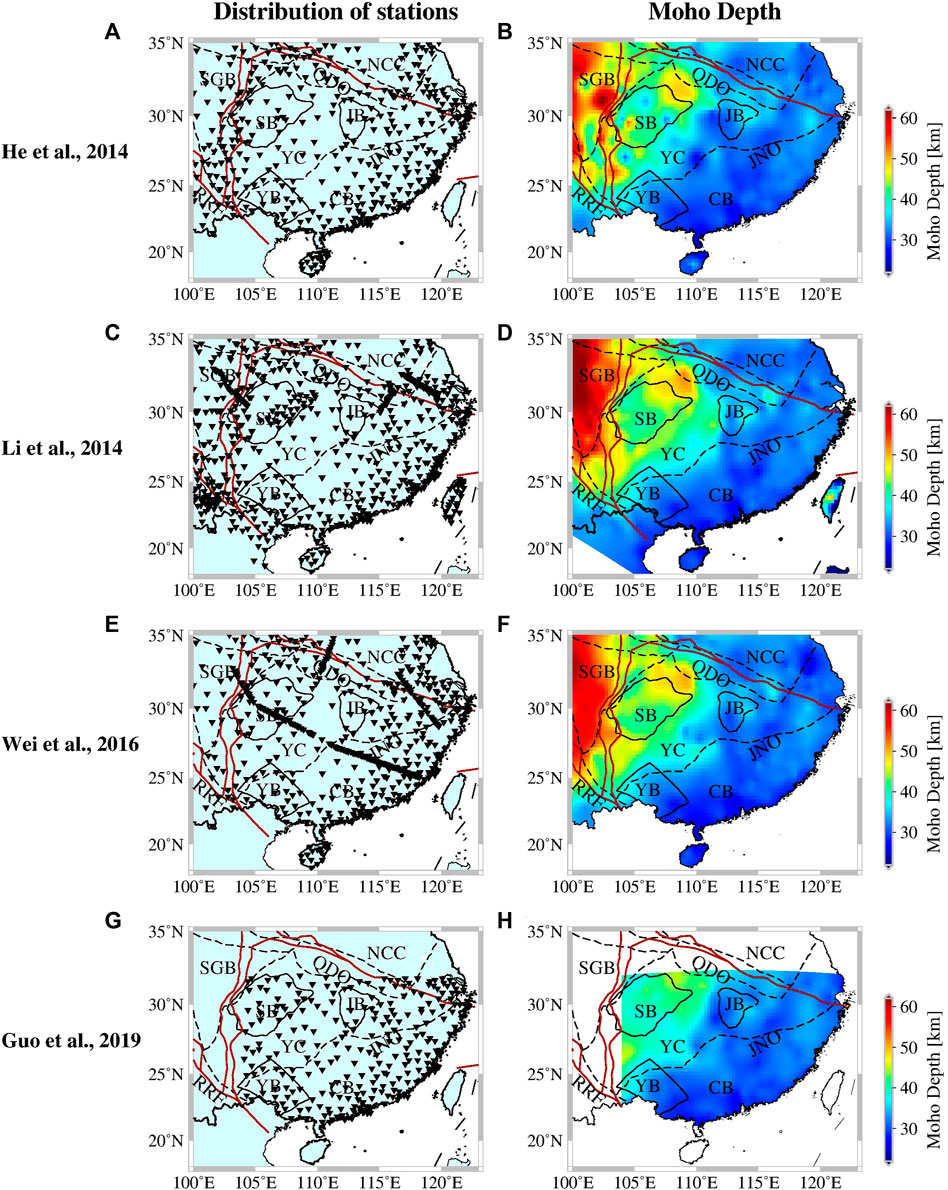
FIGURE 3. Distribution of stations and the Moho depth maps from different studies. (A,B) The He et al. (2014) model, (C,D) the Li et al. (2014) model, (E,F) the Wei et al. (2016) model, (G,H) the Guo et al. (2019) model.
For the same station, there may be some differences in longitude and latitude given by different studies. To ensure that the information of the same station can be compared in the statistical process, we regard the station spacing less than 7 km as the same station (If this criterion is smaller, it will lead to the actual same station but be counted many times; If this criterion becomes larger, then closely spaced linear arrays will be miscounted). Based on the above criteria, in our database 397 stations had more than one estimate (2 stations were estimated 6 times, 21 stations were estimated 5 times, 169 stations were estimated 4 times, 121 stations were estimated 3 times, and 84 stations were estimated 2 times) and 499 stations with only one estimation. The dataset used in our study has some redundancy because many stations had multiple estimates of crust thickness. We calculate the difference or standard deviation of stations for stations with multiple estimates to evaluate its uncertainty. Figure 4A shows the differences in crustal thickness for 84 stations with two different measurements. We also calculated the standard deviations for 313 stations with at least three different estimates of the crustal thickness (Figure 4B). The standard deviation/difference of most measurements is within 3 km, but a few of them reach 16 km. We list the specific estimates in Table 2 for each model with a standard deviation/difference greater than 6 km. There is no significant difference in crustal thickness in most study areas, but some areas with complex topography have huge differences, such as the southeastern Tibetan Plateau (Figure 4C). We do not consider the estimates of the crustal thickness with a standard deviation/difference greater than 6 km in the final model.
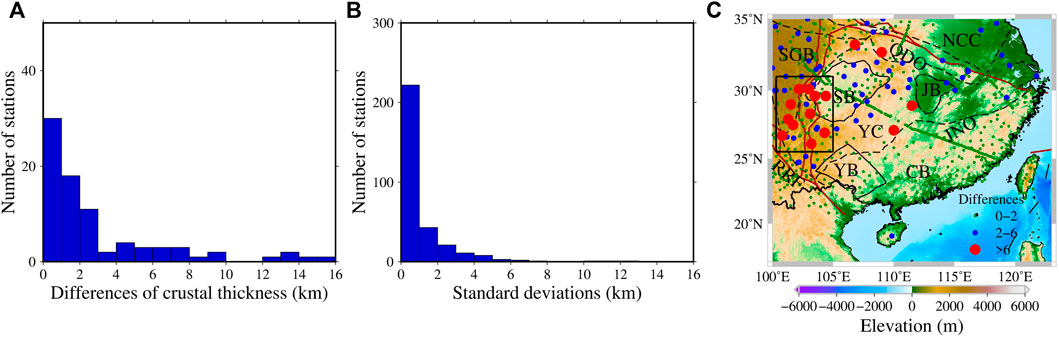
FIGURE 4. Uncertainties of crustal thicknesses determined from receiver function analysis. (A) Differences in crustal thickness for stations with two different estimates. (B) Standard deviations of crustal thickness for stations with three or more different estimates. (C) Distribution of estimates for those stations with large differences.
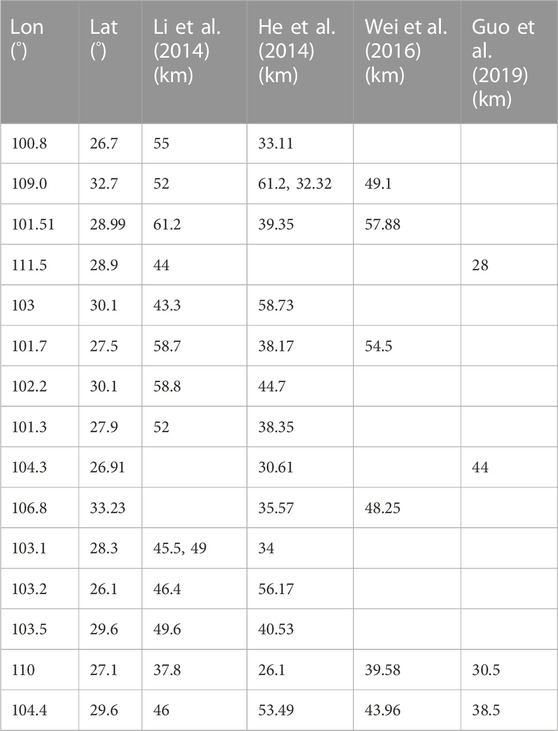
TABLE 2. Information about stations with standard deviation/difference estimates greater than 6 km.
We have collected more than 800 estimates of crustal thickness from receiver function studies (Figure 5A) in South China after removing poor thickness estimations and redundant data. With denser station distribution, we propose a crustal thickness map in South China. The large-scale features of the result (Figures 5B,C) are similar to those of previous results (Li et al., 2014; Wei et al., 2016). However, in some detail, we integrate the results of all models so that it can represent the general features of the region. The crustal thickness shows a large variation from east to west. The crustal thickness along the coastal region of the Cathaysia Block is about 25–35 km. The western Yangtze Craton is thicker, about 37–48 km. The Songpan-Gantze block has a crustal thickness of up to 60 km.
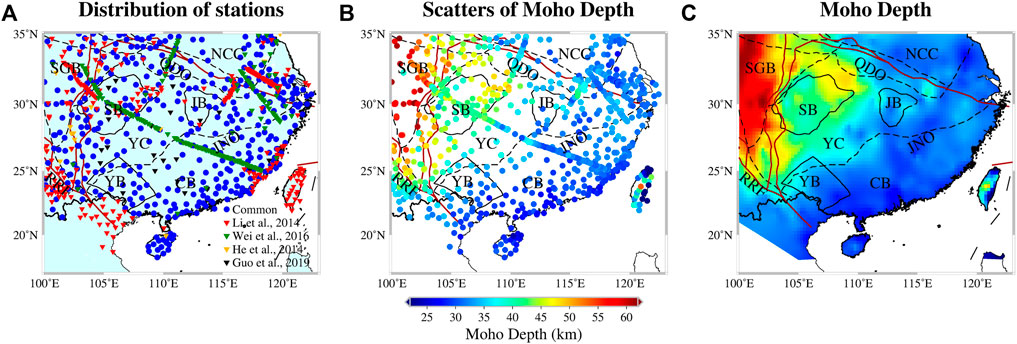
FIGURE 5. (A)Distribution of receiver function data used in this study. Blue circles: Multiple measurements of crustal thickness; red triangles: one measurement from Li et al. (2014); green triangles: one measurement from Wei et al. (2016); yellow triangles: one measurement from He et al. (2014); black triangles: one measurement from Guo et al. (2019). (B) Scatters of crustal thicknesses; (C) Interpolated results to crustal thicknesses.
5 Velocity model
5.1 Velocity model construction
With the development of China’s earthquake observation system, South China has good data coverage and these studies used the three-component seismogram records from permanent and temporary stations of the China National Seismic Network deployed in South China. The crustal and uppermost mantle component of the SREM-SC is controlled by the S-wave velocity (Vs). S-wave velocity is then used to construct the P-wave velocity (Vp) and density (ρ) fields, as discussed below.
5.1.1 Averaged model of Vs
Since the horizontal grids and vertical sampling intervals of the published velocity models are different, we re-interpolated each model in uniform grids at the same horizontal coordinates (0.5° step) and depth (5 km step), using an inverse distance weighted method (exponent in the inverse distance weighting function is 2). Figure 6 illustrates the selected models with absolute velocities at depth of 30 km. We also show the velocity structure comparison at different depths in the supplementary material (5 km, Supplementary Figure S1; 10 km, Supplementary Figure S2; 20 km, Supplementary Figure S3; 40 km, Supplementary Figure S4; 60 km, Supplementary Figure S5). The velocity anomalies of these models in most areas are consistent. The Sichuan Basin shows low-velocity anomalies in the shallow crust due to the thick sediments. In the middle-lower crust, the low-velocity anomalies are mainly distributed in the Songpan-Gantze Block and the southeastern Tibetan Plateau. And the coast of the Cathaysia Block shows high velocities. The general consistency between the various models from different methods means that the key features of the structure are comparable, which provides a basis for constructing the crustal and uppermost mantle component of SREM-SC. Nevertheless, we must recognize that there are some discrepancies between the models due to the different techniques and data sets, such as the distribution of the low-velocity anomalies in the Sichuan Basin at 5 and 10 km, the value of the velocity anomalies in the Songpan-Gantze Block and the Cathaysia Block at 20–60 km depth.
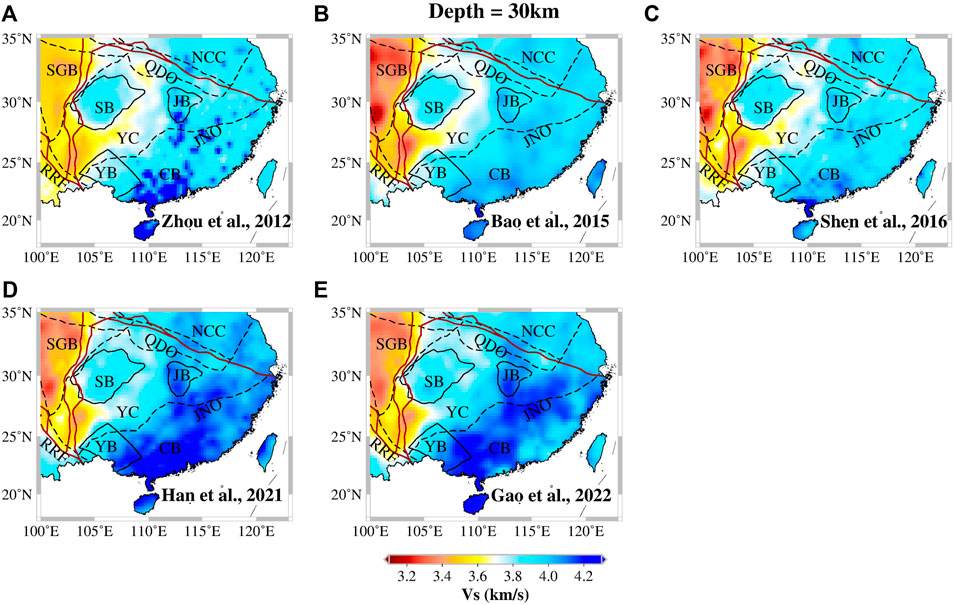
FIGURE 6. Five published S-wave velocity models at a depth of 30 km with the same color bar from (A) Zhou et al. (2012), (B) Bao et al. (2015), (C) Shen et al. (2016), (D) Han et al. (2021), (E) Gao et al. (2022). The velocity structure on Taiwan island is not reliable due to lacking data in (A).
In order to obtain the average reference model of the study region, we test the models with different weights according to data coverage, resolution, inversion method, and other factors (shown in Supplementary Figure S7 and Supplementary Table S1). By comparing the results of different weights, we find that there is little difference in velocity structure characteristics. It indicates that the velocity structure characteristics of the five models used in our study are very similar at various depths, and it is feasible for us to average the five models. We calculate the original five models (Table 1) with equal weight and obtain an average model that can represent the common characteristics of the study region. To evaluate the results of our average model, we also calculated the difference between each model and the average model at each grid point, as follows:
5.1.2 Conversion from Vs to Vp
At present, there are few publicly available 3D P-wave velocity models for the crust and uppermost mantle in South China Block, and the majority of P-wave velocity models come from body wave tomography or the full waveform seismic tomography in the mantle (Zhao et al., 2012; Tao et al., 2018). Therefore, we would like to obtain some other information to help construct the 3D P-wave velocity models. We can estimate the Vp by conversion of Vs using the Vp/Vs ratio. There are two different approaches to getting the Vp/Vs ratio. In the first method, the receiver function studies provide not only an estimate of Moho depth but also the average Vp/Vs ratio of the crust. The ratio obtained by this method is a 2D model, which is the same value at every depth (Figure 7A). In the second method, the USTClitho2.0 provided both the Vp and Vs, we can get the Vp/Vs ratio by dividing these two. The ratio obtained by this method is a 3D model, which is different at every depth (Figure 7C). By comparing the models estimated by the conversion of Vs using the two different approaches, we found that the Vp got from 3D Vp/Vs ratio (Figure 7D) was more consistent with the velocity characteristics than the 2D Vp/Vs ratio (Figure 7B).
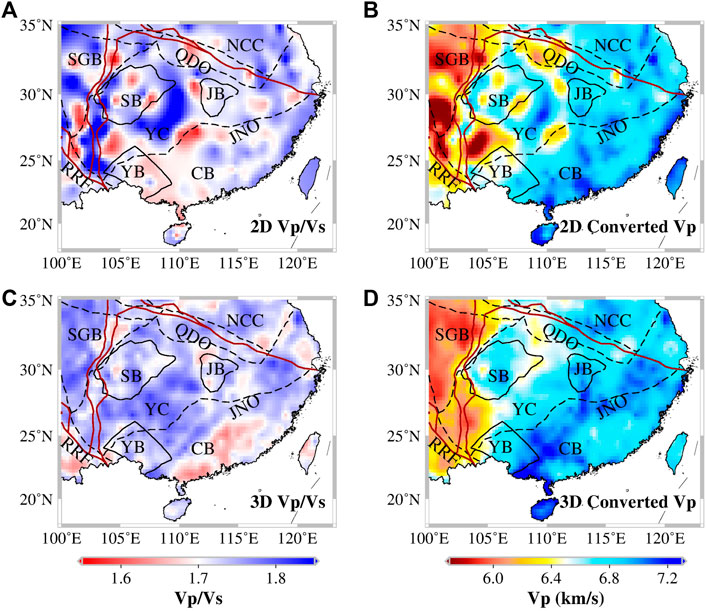
FIGURE 7. Comparison of the estimated values obtained from the conversion of Vs using the two different approaches. (A) 2D Vp/Vs ratio obtained by receiver function study (He et al., 2014) and (B) the resulting 2D converted Vp. (C) 3D Vp/Vs ratio obtained by tomographic study (Han et al., 2021) and (D) the resulting 3D converted Vp.
Figure 8 shows the construction process of the P-wave velocity of the crustal and uppermost mantle component of SREM-SC. The average Vs model (Figure 8A) combined with the 3D Vp/Vs ratio (Figure 8B) yields a converted Vp field (Figure 8C), and then its combination with the Vp estimates from the joint tomography inversion (Han et al., 2021) (Figure 8D) to produce a final Vp distribution (Figure 8E). Combining these two sets of results, we construct a smooth estimate of the Vp model, which provides a good representation of the velocity structure of the study region.
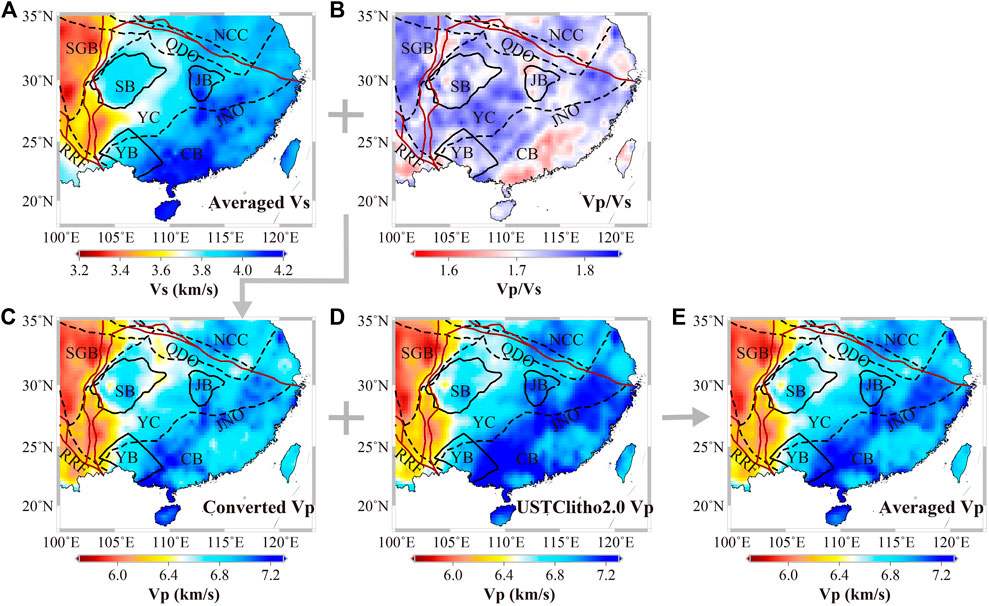
FIGURE 8. The construction process of P-wave velocity for the crustal and uppermost mantle component of SREM-SC keyed at a map view of 30 km depth. (C) The converted P-wave velocity model is obtained by combing (A) the averaged S-wave velocity model with (B) the Vp/Vs ratio obtained from the USTClitho2.0, and then averaged with (D) The P-wave velocity from USTClitho2.0 (Han et al., 2021) to build (E) the final averaged P-wave velocity for the crustal and uppermost mantle component of SREM-SC.
5.1.3 Relation of Vp and density
Velocity and density are two kinds of parameters with good correlation to rock’s physical properties. Feng et al. (1986) proposed a linear relationship between velocity and density suitable for local conditions by referring to the Nafe-Drake empirical relationship and combining it with plenty of seismic data in North China when inversing the 3D potential field of gravity and magnetic. We use the empirical relationship proposed by Feng et al. (1986):
5.2 Velocity structure
5.2.1 Horizontal slices
Ambient noise tomography, which is highly sensitive to the existence of sediments, is primarily responsible for determining the upper crust structure (Salmon et al., 2013). Figures 9A,B,G,H display the P-wave velocity and S-wave velocity in the crustal and uppermost mantle component of the SREM-SC at 5 and 10 km depth. At the depth of 5 km, both P-wave and S-wave velocities show low-velocity anomalies in sedimentary basins such as Sichuan Basin and Jianghan Basin, the southeastern North China Craton, and the eastern Tanlu Fault. The low-velocity anomalies of the S-wave correspond well to the Sichuan Basin, while the low-velocity anomalies of the P-wave are scattered, which can also be observed in the Songpan-Gantze Block and Red River Fault. The P-wave and S-wave velocities at 10 km are homogeneous in most regions, except for the Sichuan Basin, where there is still a bit of low velocity due to the thicker sediments. In comparison, the Qinling-Dabie Orogen and the coastal of the Cathaysia Block show high velocities, which could be caused by crystallized basement rocks (Li and Li, 2007).
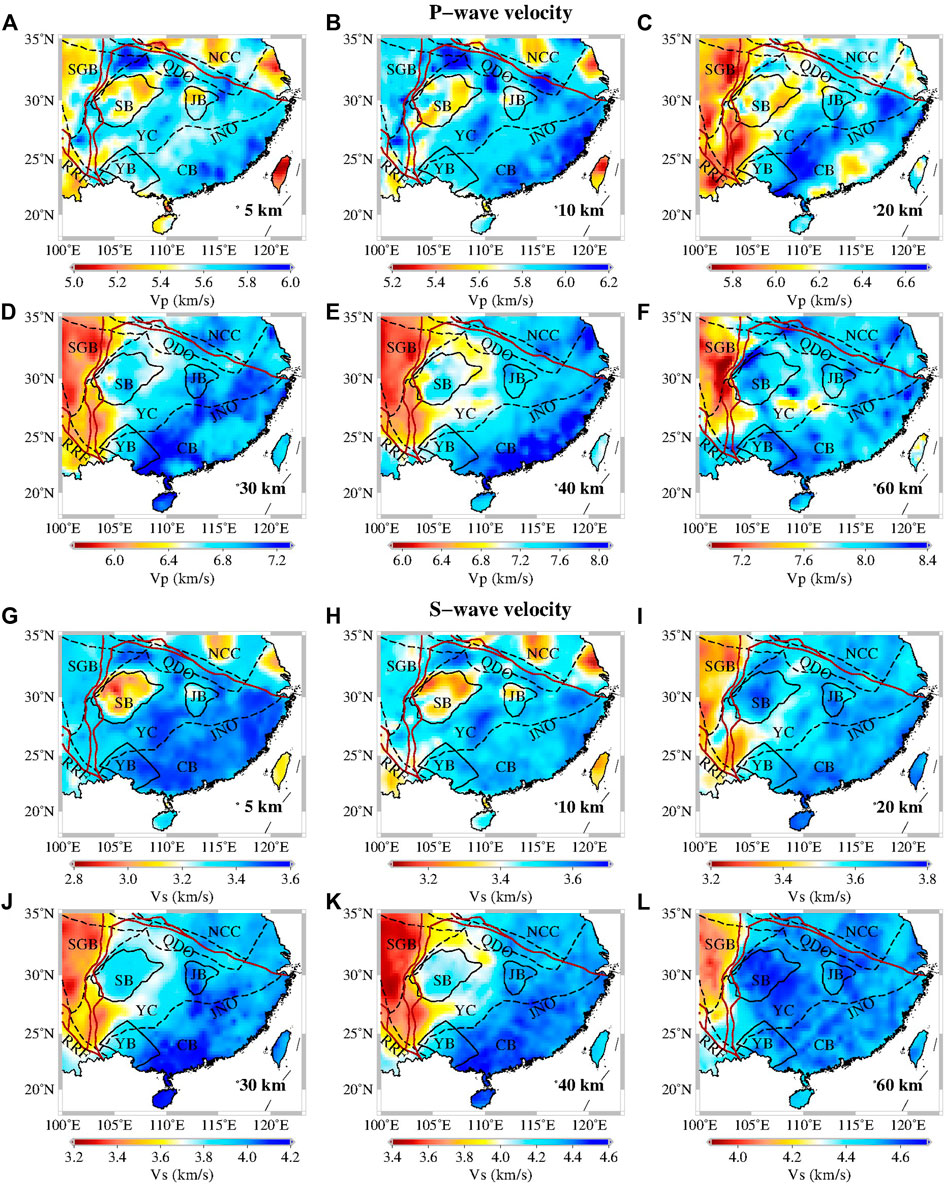
FIGURE 9. P-wave velocity distribution for the crustal and uppermost mantle component of SREM-SC at depths of (A) 5 km, (B) 10 km, (C) 20 km, (D) 30 km, (E) 40 km, and (F) 60 km. S-wave velocity distribution for the crustal and uppermost mantle component of SREM-SC at depths of (G) 5 km, (H) 10 km, (I) 20 km, (J) 30 km, (K) 40 km, and (L) 60 km.
Figures 9C,D,I,J display the P-wave velocity and S-wave velocity in the crustal and uppermost mantle components of the SREM-SC at 20 and 30 km depth. At depth of 20 km, the velocity distribution characteristics of the P-wave and S-wave are roughly the same. The P-wave velocity in the Jiangnan Orogenic shows high-velocity anomalies. Up to 30 km depth, the velocity structure shows a significant change from west to east and does not correspond to the geological structure like the upper crust structure. The low-velocity anomalies are concentrated in the Songpan-Gantze Block and the southeastern margin of the Tibetan Plateau. These low-velocity anomalies possibly relate to the channel flow in the middle-lower crust beneath Tibet (Clark and Royden, 2000; Royden et al., 2008). We also can see a generally good correlation between the distribution patterns of S-wave velocity, P-wave velocity, and Moho depth discussed in section 4 (Figure 5C), for instance, regions with a thicker crust usually have lower velocity values than regions with a thinner crust.
The P-wave velocity and S-wave velocity in the crustal and uppermost mantle components of the SREM-SC at 40 and 60 km depth are shown in Figures 9E,F,K,L. At the depth of 40 km, the velocity characteristics remain in the same distribution pattern as at 30 km depth. At the depth of 60 km, the whole study area displayed as high velocities, while the southeastern Tibetan Plateau retains some low-velocity characteristics.
5.2.2 Vertical cross sections
Figure 10 shows five representative vertical cross sections through the crustal and uppermost mantle component of the SREM-SC. The sections at latitude 25°N, latitude 30°N, longitude 110°E, longitude 115°E, and an oblique section extending from the southeast to northwest of the study region are presented in depth slices of S-wave velocity at 30 km depth (Figure 10F).
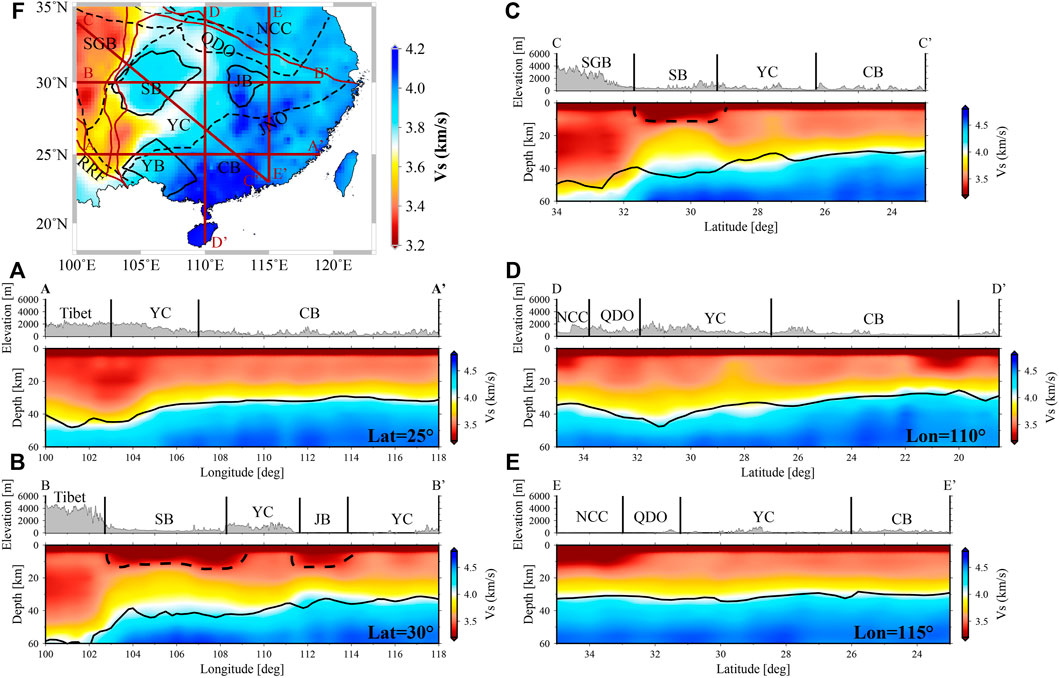
FIGURE 10. Vertical S-wave velocity sections of the crustal and uppermost mantle component of SREM-SC along profiles (A) latitude at 25°N, (B) latitude at 30°N, (C) a diagonal profile CC′, (D) longitude at 110°E; (E) longitude at 115°E. The profile locations are shown in the map view (F) at 30 km. Moho depth of this study (solid black line) is also shown in the map.
Section AA’ (Figure 10A) crosses the southeastern Tibetan Plateau (TP), southern Yangtze Craton (YC), and Cathaysia Block (CB). A low-velocity zone exists beneath the Tibetan Plateau in this section. Section BB’ (Figure 10B) crosses the Tibetan Plateau, Sichuan Basin (SB), and Jianghan basin (JB), and reaches the eastern Yangtze Craton. There is a low-velocity zone in the middle and lower crust of the Tibetan Plateau, which has a clear boundary with the Sichuan Basin, possibly due to the obstruction of the rigid Sichuan Basin (Clark and Royden, 2000; Royden et al., 2008). At the same time, we can observe a clear Moho depth variation between longitude 102°E and 104°E. In addition, there are low-velocity anomalies below the Sichuan Basin and Jianghan Basin, which are related to their thick sediments, but for these sedimentary basins, there is no fully defined lower boundary. Section CC’ (Figure 10C) crosses the Songpan-Gantze block (SGB), Sichuan Basin, Yangtze Craton, and Cathaysia Block. There is a low-velocity zone beneath the Songpan-Gantze Block in the middle-lower crust, and the Moho depth of the whole section increases from southeast to northwest. We can still observe the low velocities below the Sichuan Basin in the shallow crust. Section DD′ and EE’ (Figures 10D,E) both cross the North China craton (NCC), Qinling-Dabie Orogen (QDO), Yangtze Craton, and Cathaysia Block along longitude. In these two sections, the crustal thickness fluctuates slightly, about 35 km.
By comparing our new Moho depth (Figure 5C) discussed in section 4 with the vertical sections of the S-wave velocity, we found a good correspondence between the Moho depth and the Vs of 4.0 km/s. We can see from these sections that the Moho depth increases from southeast to northwest and crustal thickness is positively correlated with topography.
5.3 Comparison with previous models
We compare our average model with those by Zhou et al. (2012), Bao et al. (2015), Shen et al. (2016), Han et al. (2021), and Gao et al. (2022) at 30 km depth in Figure 11 and the other depths in the supplementary material (Supplementary Figures S8–S12). We also show the histograms of velocity difference distribution for all five models at 30 km depth in Figure 12, and the other depths are shown in the supplementary material (Supplementary Figures S13–S17).
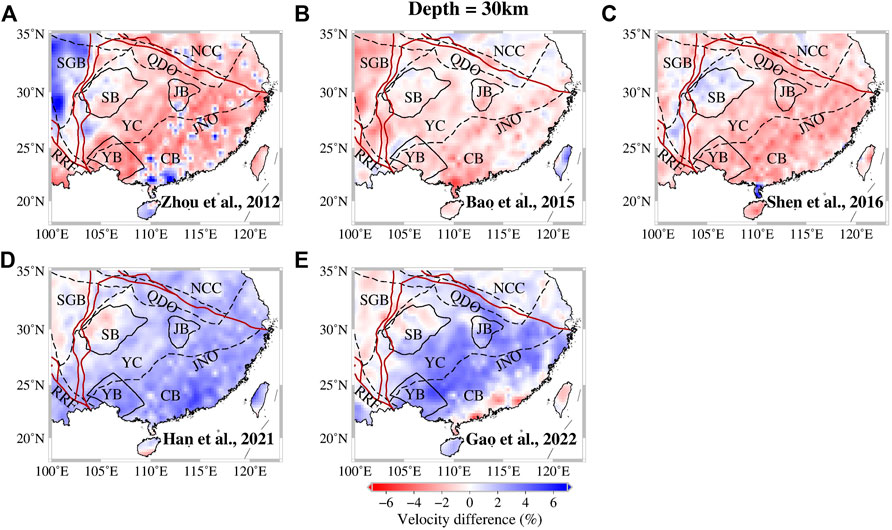
FIGURE 11. Velocity difference of the averaged S-wave velocity model at 30 km depth relative to the models of (A) Zhou et al. (2012), (B) Bao et al. (2015), (C) Shen et al. (2016), (D) Han et al. (2021), (E) Gao et al. (2022).
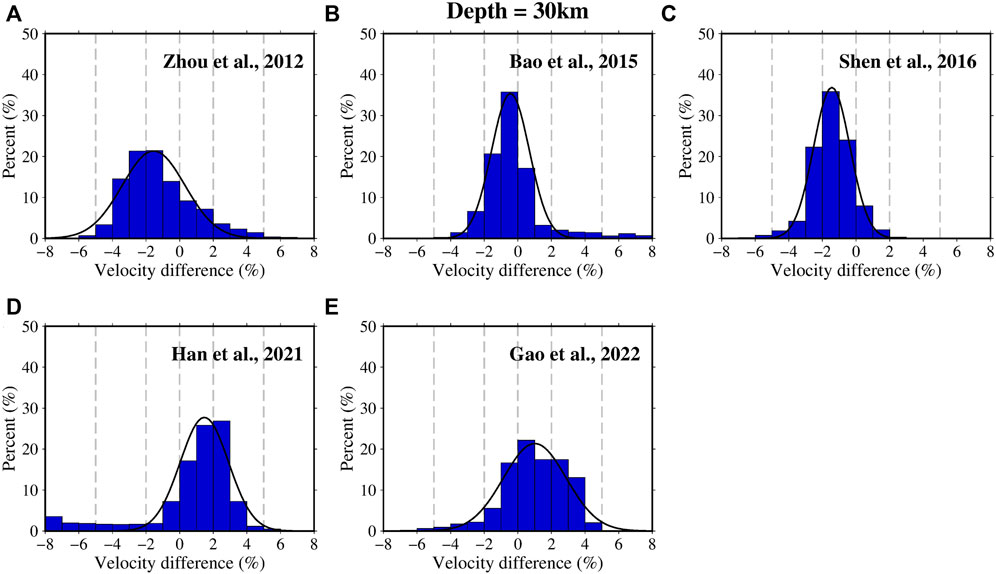
FIGURE 12. Percentage histograms of velocity difference distribution from the average model, calculated at each node, at 30 km depth for (A) Zhou et al. (2012), (B) Bao et al. (2015), (C) Shen et al. (2016), (D) Han et al. (2021), (E) Gao et al. (2022). The dashed gray lines indicate the velocity difference of 0%, ± 2%, and ± 5%.
The result shows that the difference in most areas was less than 6%. At the depth of 30 km, the S-wave velocity results obtained by surface wave tomography (Figures 11A–C) are smaller than the average model in the Yangtze Craton and Cathaysia Block, except for the Sichuan Basin of the model of Shen et al. (2016). In the whole study area, except for the Songpan-Gantze block and the parts of the Sichuan Basin, the results obtained from the joint inversion of body wave and surface wave (Figures 11D,E) are higher than the average model. In the vicinity of the Songpan-Gantze block, except for Zhou et al. (2012) (Figure 11A), other all models show lower velocity than the average model. Figure 12 shows the histogram statistics of the velocity difference distribution at 30 km depth, the models of Figures 12B,C are closest to the average model. The velocity obtained by surface wave inversion is generally lower than the average model, while that obtained by joint inversion is generally higher than the average model.
These published five models are obtained by different data sets and inversion methods, so it is difficult to estimate their systematic biases quantitatively. Zhou et al. (2012) and Shen et al. (2016) think the velocity uncertainties are caused by the trade-off between shear velocity perturbations near a boundary and topography. At shallow depths, uncertainties are highest beneath sedimentary basins. At the depths away from crustal interfaces, the uncertainties are much smaller. At deeper depths, the uncertainties maps are controlled by the Moho depth. The highest uncertainty varies from the eastern of the study region to Tibet. The resolution of the model is about 1–2° in eastern China and has no significant difference in South China (Bao et al., 2015). Han et al. (2021) and Gao et al. (2022) conduct the checkerboard test to evaluate the model and the resolution in South China is relatively uniform. Reasons for these differences may include different types of original data, the method of dispersion measurement, inversion initial models, methods and parameters, etc. We do not determine which model is better or worse, we just attempt to analyze the differences and similarities between the previous models and the newly established average model.
6 Conclusion
We propose the crustal and uppermost mantle component of the Seismological Reference Earth Model in South China (SREM-SC) from many published seismic models, which can serve as a new reference model for the velocity structure of the South China lithosphere. The crustal and uppermost mantle component of SREM-SC is grid-based with a 0.5° sampling in both latitude and longitude, and with vertical sampling points at 5 km intervals to the depth of 60 km. Each grid point is defined by the thickness of the sediments, the Moho depth, the P-wave velocity, the S-wave velocity, and density as a function of depth. The S-wave velocity comes from the ambient noise and earthquake surface wave tomography and the information for the P-wave velocity is a combination of estimates by conversion of Vs using the Vp/Vs ratio and the joint inversion. The density is inferred from empirical relationships between P-wave velocity and density. The Moho depth is obtained by weighted averaging of previously published receiver function results.
The crustal and uppermost mantle component of SREM-SC describes the major lithosphere features in South China. However, we must recognize the limitations of this model. There is no dense P-wave velocity information in the crust of South China, and we limit it by conversing from S-wave velocity. The model can be improved by adding more information constraints. The crustal structure has a significant impact on the tomography of the lithospheric mantle and asthenosphere. The establishment of the crustal and uppermost mantle component of SREM-SC is critical for understanding the crustal structure and improving seismic tomography work. And it can also be used as the initial model for seismic wave propagation simulation, crustal correction for tomography inversion, gravity modeling, etc.
Data availability statement
The raw data supporting the conclusion of this article will be made available by the authors, without undue reservation.
Author contributions
JH: Conceptualization, Investigation, Data Curation, Methodology, Writing—Original Draft, Visualization; WS: Conceptualization, Investigation, Resources, Supervision, Writing—Review and Editing, Funding acquisition; CL: Methodology, Writing—Review and Editing; QT: Data Curation, Methodology, Writing—Review and Editing; L-YF: Resources, Writing—Review and Editing, Project administration, Funding acquisition. All authors contributed to the article and approved the submitted version.
Funding
This research was supported by the National Natural Science Foundation of China (Grants No. 41720104006) and the Youth Innovation Promotion Association CAS.
Acknowledgments
We thank the excellent models provided by Xuewei Bao and Zhi Guo. We thank the models provided by China’s regional seismological reference model achievement center (http://chinageorefmodel.org). We also appreciate Junliu Suwen for his kind help during the revision process. All Figures in this study are plotted by the GMT (http://gmt.soest.hawaii.edu/home).
Conflict of interest
The authors declare that the research was conducted in the absence of any commercial or financial relationships that could be construed as a potential conflict of interest.
Publisher’s note
All claims expressed in this article are solely those of the authors and do not necessarily represent those of their affiliated organizations, or those of the publisher, the editors and the reviewers. Any product that may be evaluated in this article, or claim that may be made by its manufacturer, is not guaranteed or endorsed by the publisher.
Supplementary material
The Supplementary Material for this article can be found online at: https://www.frontiersin.org/articles/10.3389/feart.2022.1080307/full#supplementary-material
References
Bao, X., Song, X., and Li, J. (2015). High-resolution lithospheric structure beneath Mainland China from ambient noise and earthquake surface-wave tomography. Earth Planet. Sci. Lett. 417, 132–141. doi:10.1016/j.epsl.2015.02.024
Cawood, P. A., Wang, Y., Xu, Y., and Zhao, G. (2013). Locating South China in rodinia and gondwana: A fragment of greater India lithosphere? Geology 41 (8), 903–906. doi:10.1130/g34395.1
Clark, M. K., and Royden, L. H. (2000). Topographic ooze: Building the eastern margin of Tibet by lower crustal flow. Geology 28 (8), 703–706. doi:10.1130/0091-7613(2000)28<703:TOBTEM>2.0.CO;2
Deng, Q., Zhang, P., Ran, Y., Yang, X., Min, W., and Chen, L. (2003). Active tectonics and earthquake activities in China. Earth Sci. Front. 10 (S1), 66–73. doi:10.3321/j.issn:1005-2321.2003.z1.012
Deng, Y., Zhang, Z., Badal, J., and Fan, W. (2014). 3-D density structure under South China constrained by seismic velocity and gravity data. Tectonophysics 627, 159–170. doi:10.1016/j.tecto.2013.07.032
Deng, Y., Li, S., Fan, W., and Liu, J. (2011). Crustal structure beneath South China revealed by deep seismic soundings and its dynamics implications. Chin. J. Geophys. (in Chinese) 54 (10), 2560–2574. doi:10.3969/j.issn.0001-5733.2011.10.013
Feng, R., Yan, H., and Zhang, R. (1986). Fast inversion method and corresponding programming for 3D potential field. Acta Geologica Sinica 4 (3), 390–402.
Gao, L., Zhang, H., Gao, L., He, C., Xin, H., and Shen, W. (2022). High-resolution vs tomography of South China by joint inversion of body wave and surface wave data. Tectonophysics 824, 229228. doi:10.1016/j.tecto.2022.229228
Gong, J., and John Chen, Y. (2014). Evidence of lateral asthenosphere flow beneath the South China craton driven by both Pacific plate subduction and the India-Eurasia continental collision. Terra Nova 26 (1), 55–63. doi:10.1111/ter.12069
Guo, L., Gao, R., Shi, L., Huang, Z., and Ma, Y. (2019). Crustal thickness and Poisson's ratios of South China revealed from joint inversion of receiver function and gravity data. Earth and Planetary Science Letters 510, 142–152. doi:10.1016/j.epsl.2018.12.039
Guo, Z., Gao, X., Li, T., and Wang, W. (2018). Crustal and uppermost mantle structures of the South China from joint analysis of receiver functions and Rayleigh wave dispersions. Physics of the Earth and Planetary Interiors 278, 16–25. doi:10.1016/j.pepi.2018.03.001
Han, S., Zhang, H., Xin, H., Shen, W., and Yao, H. (2021). USTClitho2.0: Updated unified seismic tomography models for continental China lithosphere from joint inversion of body-wave arrival times and surface-wave dispersion data. Seismological Research Letters 93 (1), 201–215. doi:10.1785/0220210122
He, C., Dong, S., Santosh, M., and Chen, X. (2013). Seismic evidence for a geosuture between the Yangtze and Cathaysia blocks, South China. Sci Rep 3, 2200. doi:10.1038/srep02200
He, C., and Santosh, M. (2016). Crustal evolution and metallogeny in relation to mantle dynamics: A perspective from P-wave tomography of the SouthSouth China block. Lithos 263, 3–14. doi:10.1016/j.lithos.2016.06.021
He, R., Shang, X., Yu, C., Zhang, H., and Van der Hilst, R. D. (2014). A unified map of Moho depth and Vp/Vs ratio of continental China by receiver function analysis. Geophysical Journal International 199 (3), 1910–1918. doi:10.1093/gji/ggu365
Jin, X.-Y., Zhao, J.-X., Feng, Y.-X., Hofstra, A. H., Deng, X.-D., Zhao, X.-F., et al. (2021). Calcite U-Pb dating unravels the age and hydrothermal history of the giant Shuiyindong Carlin-type gold deposit in the golden triangle, South China. Economic Geology 116 (6), 1253–1265. doi:10.5382/econgeo.4870
Kennett, B. L. N., Fichtner, A., Fishwick, S., and Yoshizawa, K. (2013). Australian seismological reference model (AuSREM): Mantle component. Geophysical Journal International 192 (2), 871–887. doi:10.1093/gji/ggs065
Laske, G., Masters, G., Ma, Z., and Pasyanos, M. (2013). Update on CRUST1.0 - a 1-degree global model of earth’s crust. Geophys. Res. Abstracts 15, EGU2013–2658.
Li, S., Zhao, G., Dai, L., Liu, X., Zhou, L., Santosh, M., et al. (2012). Mesozoic basins in eastern China and their bearing on the deconstruction of the North China Craton. Journal of Asian Earth Sciences 47, 64–79. doi:10.1016/j.jseaes.2011.06.008
Li, Y., Gao, M., and Wu, Q. (2014). Crustal thickness map of the Chinese mainland from teleseismic receiver functions. Tectonophysics 611, 51–60. doi:10.1016/j.tecto.2013.11.019
Li, Z.-X., and Li, X.-H. (2007). formation of the 1300-km-wide intracontinental orogen and postorogenic magmatic province in mesozoic South China: A flat-slab subduction model. Geology 35 (2), 179. doi:10.1130/g23193a.1
Lin, X., and Liu, J. (2019). A review of mountain-basin coupling of Jianghan and Dongting basins with their surrounding mountains. Seismology and Geology 41 (2), 499–520. doi:10.3969/j.issn.0253-4967.2019.02.015
Liu, S., Yang, Y., Deng, B., Zhong, Y., Wen, L., Sun, W., et al. (2021). Tectonic evolution of the Sichuan Basin, southwest China. Earth-Science Reviews 213, 103470. doi:10.1016/j.earscirev.2020.103470
Lu, M., Wu, C., and Jiang, J. (2008). Features and Genesis of gas reservoirs in the Jianghan basin. Natural Gas Industry 28 (8), 12–14. 1000-0976(2008)28:8<12:JHPDQZ>2.0.TX;2-M.
Lü, Q. T., Dong, S. W., Shi, D. N., Tang, J. T., Jiang, G. M., Zhang, Y. Q., et al. (2014). Lithosphere architecture and geodynamic model of middle and lower reaches of Yangtze metallogenic belt: A review from SinoProbe. Acta Petrologica Sinica 30 (4), 889–906.
Lϋ, Q., Yan, J., Shi, D., Dong, S., Tang, J., Wu, M., et al. (2013). Reflection seismic imaging of the Lujiang–Zongyang volcanic basin, Yangtze Metallogenic Belt: An insight into the crustal structure and geodynamics of an ore district. Tectonophysics 606, 60–77. doi:10.1016/j.tecto.2013.04.006
Mao, J., Li, Z., and Ye, H. (2014). Mesozoic tectono-magmatic activities in South China: Retrospect and prospect. Science China Earth Sciences 57 (12), 2853–2877. doi:10.1007/s11430-014-5006-1
Qiu, L., Kong, R., Yan, D.-P., Mu, H.-X., Sun, W., Sun, S., et al. (2022). Paleo–Pacific plate subduction on the eastern Asian margin: Insights from the Jurassic foreland system of the overriding plate. GSA Bulletin 134 (9-10), 2305–2320. doi:10.1130/b36118.1
Qiu, L., Yan, D.-P., Tang, S.-L., Wang, Q., Yang, W.-X., Tang, X., et al. (2016). Mesozoic geology of southwestern China: Indosinian foreland overthrusting and subsequent deformation. Journal of Asian Earth Sciences 122, 91–105. doi:10.1016/j.jseaes.2016.03.006
Qiu, L., Yan, D.-P., Yang, W.-X., Wang, J., Tang, X., and Ariser, S. (2017). Early to middle triassic sedimentary records in the Youjiang Basin, South China: Implications for indosinian orogenesis. Journal of Asian Earth Sciences 141, 125–139. doi:10.1016/j.jseaes.2016.09.020
Qu, P., Chen, Y., Yu, Y., Ge, Z., Li, Q., and Dong, S. (2020). 3D velocity structure of upper mantle beneath SouthSouth China and its tectonic implications: Evidence from finite frequency seismic tomography. Chinese Journal of Geophysics (in Chinese) 63 (8), 2954–2969. doi:10.6038/cjg2020N0183
Royden, L. H., Burchfiel, B. C., and van der Hilst, R. D. (2008). The geological evolution of the Tibetan Plateau. Science 321 (5892), 1054–1058. doi:10.1126/science.1155371
Salmon, M., Kennett, B. L. N., and Saygin, E. (2013). Australian seismological reference model (AuSREM): Crustal component. Geophysical Journal International 192 (1), 190–206. doi:10.1093/gji/ggs004
Shan, B., Xiong, X., Zhao, K. F., Xie, Z. J., Zheng, Y., and Zhou, L. (2016). Crustal and upper mantle structure of South China from Rayleigh wave tomography. Geophysical Journal International 208, 1643–1654. doi:10.1093/gji/ggw477
Shapiro, N. M., Campillo, M., Stehly, L., and Ritzwoller, M. H. (2005). High-resolution surface-wave tomography from ambient seismic noise. Science 307 (5715), 1615–1618. doi:10.1126/science.1108339
Shen, W., Ritzwoller, M. H., Kang, D., Kim, Y., Lin, F.-C., Ning, J., et al. (2016). A seismic reference model for the crust and uppermost mantle beneath China from surface wave dispersion. Geophysical Journal International 206 (2), 954–979. doi:10.1093/gji/ggw175
Shu, L.-S. (2012). An analysis of principal features of tectonic evolution in South China Block. Geological Bulletin of China 31 (7), 1035–1053.
Song, P., Zhang, X., Liu, Y., and Teng, J. (2017). Moho imaging based on receiver function analysis with teleseismic wavefield reconstruction: Application to South China. Tectonophysics 718, 118–131. doi:10.1016/j.tecto.2017.05.031
Su, W., Dong, W., Zhang, X., Shen, N., Hu, R., Hofstra, A. H., et al. (2018). “Carlin-Type gold deposits in the dian-qian-gui “golden triangle” of southwest China,” in Diversity in carlin-style gold deposits. doi:10.5382/rev.20.05
Sun, W., and Kennett, B. L. N. (2016a). Uppermost mantle P wavespeed structure beneath eastern China and its surroundings. Tectonophysics 683, 12–26. doi:10.1016/j.tecto.2016.06.011
Sun, W., and Kennett, B. L. N. (2016b). Uppermost mantle structure beneath eastern China and its surroundings from Pn and Sn tomography. Geophysical Research Letters 43 (7), 3143–3149. doi:10.1002/2016gl068618
Tao, K., Grand, S. P., and Niu, F. (2018). Seismic structure of the upper mantle beneath eastern a sia from full waveform seismic tomography. Geochemistry, Geophysics, Geosystems 19 (8), 2732–2763. doi:10.1029/2018gc007460
Wang, M., Hubbard, J., Plesch, A., Shaw, J. H., and Wang, L. (2016). Three-dimensional seismic velocity structure in the Sichuan basin, China. Journal of Geophysical Research Solid Earth 121 (2), 1007–1022. doi:10.1002/2015jb012644
Wang, Y., Fan, W., Guo, F., Peng, T., and Li, C. (2010). Geochemistry of mesozoic mafic rocks adjacent to the chenzhou-linwu fault, South China: Implications for the lithospheric boundary between the Yangtze and Cathaysia blocks. International Geology Review 45 (3), 263–286. doi:10.2747/0020-6814.45.3.263
Wang, Y., Fan, W., Zhang, G., and Zhang, Y. (2013). Phanerozoic tectonics of the SouthSouth China block: Key observations and controversies. Gondwana Research 23 (4), 1273–1305. doi:10.1016/j.gr.2012.02.019
Wei, Z., Chen, L., Li, Z., Ling, Y., and Li, J. (2016). Regional variation in Moho depth and Poisson’s ratio beneath eastern China and its tectonic implications. Journal of Asian Earth Sciences 115, 308–320. doi:10.1016/j.jseaes.2015.10.010
Xiao, X., Cheng, S., Wu, J., Wang, W., Sun, L., Wang, X., et al. (2021). Shallow seismic structure beneath the continental China revealed by P-wave polarization, Rayleigh wave ellipticity and receiver function. Geophysical Journal International 225 (2), 998–1019. doi:10.1093/gji/ggab022
Yan, D. P., Zhou, Y., Qiu, L., Wells, M. L., Mu, H., and Xu, C.-G. (2018a). The longmenshan tectonic complex and adjacent tectonic units in the eastern margin of the Tibetan plateau: A review. Journal of Asian Earth Sciences 164, 33–57. doi:10.1016/j.jseaes.2018.06.017
Yan, D. P., Qiu, L., Wells, M. L., Zhou, M. F., Meng, X., Lu, S., et al. (2018b). Structural and geochronological constraints on the early mesozoic north longmen Shan thrust belt: Foreland fold-thrust propagation of the SW qinling orogenic belt, northeastern Tibetan plateau. Tectonics 37 (12), 4595–4624. doi:10.1029/2018tc004986
Yang, W. X., Yan, D. P., Qiu, L., Wells, M. L., Dong, J. M., Gao, T., et al. (2021). Formation and forward propagation of the indosinian foreland fold-thrust belt and nanpanjiang foreland Basin in SW China. Tectonics 40 (4). doi:10.1029/2020tc006552
Yao, H., van der Hilst, R. D., and de Hoop, M. V. (2006). Surface-wave array tomography in SE Tibet from ambient seismic noise and two-station analysis - I. Phase velocity maps. Geophysical Journal International 166 (2), 732–744. doi:10.1111/j.1365-246X.2006.03028.x
Yao, H., van der Hilst, R. D., and Montagner, J.-P. (2010). Heterogeneity and anisotropy of the lithosphere of SE Tibet from surface wave array tomography. Journal of Geophysical Research 115 (B12), B12307. doi:10.1029/2009jb007142
Zhang, G., Guo, A., Wang, Y., Li, S., Dong, Y., Liu, S., et al. (2013). Tectonics of South China continent and its implications. Science China Earth Sciences 56 (11), 1804–1828. doi:10.1007/s11430-013-4679-1
Zhang, H., Maceira, M., Roux, P., and Thurber, C. (2014). Joint inversion of body-wave arrival times and surface-wave dispersion for three-dimensional seismic structure around SAFOD. Pure and Applied Geophysics 171 (11), 3013–3022. doi:10.1007/s00024-014-0806-y
Zhang, P., Deng, Q., Zhang, G., Ma, J., Gan, W., Min, W., et al. (2003). Active tectonic blocks and strong earthquakes in the continent of China. Science in China (Series D) 46, 13–24. doi:10.3321/j.issn:1006-9267.2003.z1.002
Zhang, Y., Chen, L., Ai, Y., Jiang, M., Xu, W., and Shen, Z. (2018). Lithospheric structure of the SouthSouth China block from S-receiver function. Chinese Journal of Geophysics (in Chinese) 61 (1), 138–149. doi:10.6038/cjg2018L0226
Zhang, Y., Li, C. a., Wang, Q., Chen, L., Ma, Y., and Kang, C. (2008). Magnetism parameters characteristics of drilling deposits in jianghan plain and indication for forming of the Yangtze River three gorges. Chinese Science Bulletin 53 (4), 584–590. doi:10.1007/s11434-008-0111-1
Zhao, L., Allen, R. M., Zheng, T., and Zhu, R. (2012). High-resolution body wave tomography models of the upper mantle beneath eastern China and the adjacent areas. Geochemistry, Geophysics, Geosystems 13 (6), n/a. doi:10.1029/2012gc00411
Zheng, Y.-F., Xiao, W.-J., and Zhao, G. (2013). Introduction to tectonics of China. Gondwana Research 23 (4), 1189–1206. doi:10.1016/j.gr.2012.10.001
Zhou, J., Xu, F., Wang, T., Cao, A., and Yin, C. (2006). Cenozoic deformation history of the qaidam basin, NW China: Results from cross-section restoration and implications for qinghai–tibet plateau tectonics. Earth and Planetary Science Letters 243 (1-2), 195–210. doi:10.1016/j.epsl.2005.11.033
Zhou, L., Xie, J., Shen, W., Zheng, Y., Yang, Y., Shi, H., et al. (2012). The structure of the crust and uppermost mantle beneath South China from ambient noise and earthquake tomography. Geophysical Journal International 189 (3), 1565–1583. doi:10.1111/j.1365-246X.2012.05423.x
Zhou, X., Sun, T., Shen, W., Shu, L., and Niu, Y. (2006). Petrogenesis of mesozoic granitoids and volcanic rocks in SouthSouth China: A response to tectonic evolution. Episodes 29 (1), 26–33. doi:10.18814/epiiugs/2006/v29i1/004
Zhu, L., and Kanamori, H. (2000). Moho depth variation in southern California from teleseismic receiver functions. Journal of Geophysical Research Solid Earth 105 (B2), 2969–2980. doi:10.1029/1999jb900322
Keywords: South China Block, crust, reference model, surface waves, body waves, receiver functions
Citation: Hu J, Sun W, Liu C, Tang Q and Fu L-Y (2023) Seismological reference earth model in South China (SREM-SC): Crust and uppermost mantle. Front. Earth Sci. 10:1080307. doi: 10.3389/feart.2022.1080307
Received: 26 October 2022; Accepted: 09 December 2022;
Published: 30 January 2023.
Edited by:
Claudia Piromallo, Istituto Nazionale di Geofisica e Vulcanologia (INGV), ItalyReviewed by:
Ting Yang, China Earthquake Administration, ChinaLiang Qiu, China University of Geosciences, China
Raffaele Di Stefano, Istituto Nazionale di Geofisica e Vulcanologia (INGV), Italy
Copyright © 2023 Hu, Sun, Liu, Tang and Fu. This is an open-access article distributed under the terms of the Creative Commons Attribution License (CC BY). The use, distribution or reproduction in other forums is permitted, provided the original author(s) and the copyright owner(s) are credited and that the original publication in this journal is cited, in accordance with accepted academic practice. No use, distribution or reproduction is permitted which does not comply with these terms.
*Correspondence: Weijia Sun, c3dqQG1haWwuaWdnY2FzLmFjLmNu