 Qingya Tang
 Weijia Sun
 Jiamin Hu
 Li-Yun Fu
95% of researchers rate our articles as excellent or good
Learn more about the work of our research integrity team to safeguard the quality of each article we publish.
Find out more
ORIGINAL RESEARCH article
Front. Earth Sci. , 10 January 2023
Sec. Solid Earth Geophysics
Volume 10 - 2022 | https://doi.org/10.3389/feart.2022.1080298
This article is part of the Research Topic Lithospheric Diversity: New Perspective on Structure, Composition and Evolution View all 14 articles
This work is the mantle component of constructing the Seismological Reference Earth Model in South China (SREM-SC). Although there has been a wide range of research for imaging the upper mantle structures beneath South China, most of them focus on the large-scale features of the upper mantle, and the depth resolution is insufficient for existing surface wave tomography models to distinguish anomalies below 200 km. This study aims to develop a 3-D upper mantle Seismological Reference Earth Model in South China based on the prior tomography models. The shear wave velocity model comes from the analysis of several seismic surface wave tomography, supplemented by body wave tomography and the P-wave velocity model is constructed by the conversion from S-wave velocity. The radial anisotropy model is calculated from the SV-wave and SH-wave velocity. The Density model of the upper mantle is derived using the empirical relationship linking the density to the shear-wave velocity. The model is grid with 0.5° × 0.5° in latitude and longitude and 5 km interval in depth from 60 to 300 km. The mantle component of Seismological Reference Earth Model in South China is expected to provide a good representation of the upper mantle structures for further detailed studies. The mantle component of Seismological Reference Earth Model in South China provides new insights into upper mantle structures that should be meaningful to reveal the dynamic mechanism and tectonic evolution of South China.
The South China Block (SCB), located in the southeast of China, is composed of the Yangtze Craton in the northwest and the Cathaysia Block in the southeast, as illustrated in Figure 1. In the north, the SCB is bounded by the Qinling-Dabie orogenic belt and collided with the North China Craton in the Triassic (Enkin et al., 1992; Cao et al., 2018). In the west, the SCB is eastward compressed by the Tibetan Plateau and separated from the Songpan-Gantze Block by the Longmenshan fault in the northwest. In the southwest, the SCB is surrounded by the Indochina Block through the Ailaoshan-Songma suture zone. In the Southeast, the SCB was subducted by the Pacific plate and the Philippine Sea Plate, resulting in the formation of a trench arc back arc system. The Yangtze Craton and Cathaysia Block collided and amalgamated in the Neoproterozoic (1.1–1.0 Ga) along the Jiangnan orogen (Zhang et al., 2013; Mao et al., 2014; Faure et al., 2017). The current geomorphic characteristics of SCB were finally created under the multi-stage compound structural action of multiple tectonic systems. In Phanerozoic, the SCB experienced long-term plate tectonics and multi-stage superimposition (Zhang et al., 2013). During the Paleozoic, the north, west and south sides of SCB were affected by the closure of the ancient Tethys Ocean; In Late Paleozoic, it collided with the Indochina Block and the North China Block on the north and south, respectively. Since the Mesozoic, large-scale heterogeneous regional metamorphism and diffuse planar magmatic activity were formed (Zhang et al., 2013) under the impact of the collision between SCB and the Indochina Block; And a 1,300 km intracontinental orogenic belt and intensely distributed granite magma were formed (Li and Li, 2007), which were affected by the westward subduction of the Pacific plate. The convergence, compression and relative plate motions of the major tectonic domains (the westward subduction of the Pacific plate, the formation of the Tibet Plateau and northward differential movement of the India Australia plate) in the Mesozoic and Cenozoic led to a complex tectonic environment of the SCB, thus it’s necessary to establish a reliable and robust velocity model in order to learn more about the tectonic evolution of SCB.
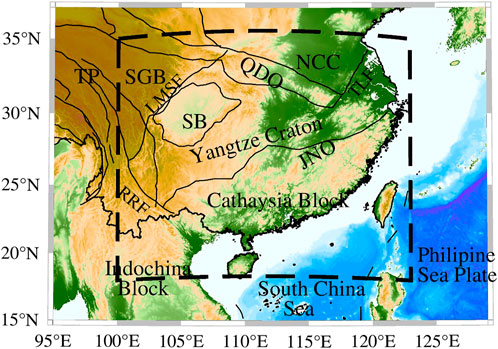
FIGURE 1. Tectonic background of South China Block. TLF, Tanlu fault; RRF, Red River fault; LMSF, Longmenshan fault; NCC, North China Craton; QDO, Qinling-Dabie Orogen; JNO, Jiangnan Orogen; SB, Sichuan Basin; JB, Jiangnan Basin; SGB, Songpan-Gantze Block; TP: Tibetan Plateau.
The evolution process and mechanism of the SCB have been the focus of geoscience research. Several geophysical studies have been conducted to explore the velocity structure, the interface and deformation features of South China in the past decades through the exploitation of dense portable and permanent stations. Many crust and mantle models have been proposed using different data sets and methods, including surface wave tomography (e.g., Li et al., 2013; Bao et al., 2015), body wave tomography (e.g., Zhao et al., 2012; Huang et al., 2015; Sun and Kennett, 2016a, b; Sun and Toksöz, 2006), analysis of receiver function (e.g., He et al., 2014; Guo et al., 2018) and shear wave splitting (e.g., Huang et al., 2011). The large-scale features of the upper mantle of these models are consistent and well delineated, showing a cold lithosphere with fast wave velocity and low Vp/Vs ratio in the Yangtze Craton (e.g., Lebedev and Nolet, 2003; Huang and Zhao, 2006), while the Cathaysia Block shows a low-velocity anomaly and high Vp/Vs ratio. However, these models also show the inconsistency of small-scale structures and the limitation in resolution, which might be attributed to the difference of the data and methods applied in these studies. The receiver function studies concur that the crust and lithosphere are gradually reduction from west to east. The Yangtze Craton is underlain by a thick crust, about 38–46 km (Deng et al., 2014), and a thick mantle lithosphere (extending to over 180 km depth). In the Cathaysia Block, the crustal thickness (Guo et al., 2019) and lithosphere is generally thinner. These regions are part of the circum Pacific tectonic domain and are primarily impacted by the Pacific plate’s subduction zone (An et al., 2006). As for the internal deformation of the SCB, it is believed that the anisotropy in eastern China mainly comes from the upper mantle, and the crust and sedimentary layers have little influence on it. The anisotropy of the upper mantle may be related to the collision of the Indian plate with the Eurasian plate and the subduction of the Pacific plate and the Philippine Sea plate under the Eurasian plate (e.g., Wang et al., 2014). To better study the lithospheric structure, we conduct a joint inversion of body- and surface-wave data to determine a high-resolution Vs model of South China.
This study aims to build a reliable 3-D mantle component of Seismological Reference Earth Model in South China (SREM-SC) down to a depth of 300 km based on these different styles of prior tomographic models, which will capture the major features of the upper mantle in South China and serve as an initial model for further study of more detailed velocity structures or prediction of seismic wave fields, and provides new insights into the dynamic process of the lithospheric evolution of the South China.
The China National Seismic Network Center and domestic research teams (e.g., Zheng et al., 2010) have set up a large number of broadband permanent and portable stations in South China and its surroundings (Figure 2A), providing excellent data resources as the foundation for studying the lithospheric structure. With the numerous earthquakes that occur along the circum-Pacific belt and on the Tibetan Plateau (Figure 2B), these rather dense stations in South China offer a good ray coverage, allowing for the achievement of a decent resolution.
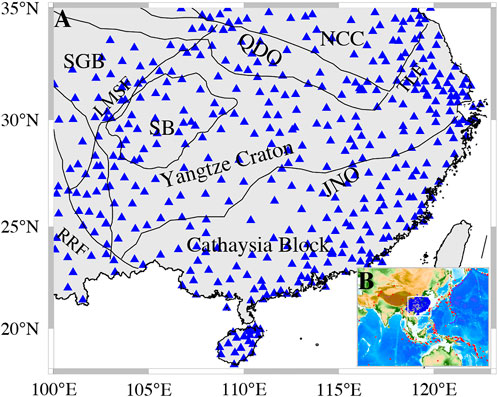
FIGURE 2. (A) Distribution of permanent and portable seismic stations (blue triangles) in the South China Block (B) Insert map: Configuration of seismic stations and seismic events with Ms > 5.5 for the year 2016, to illustrate the potential ray path coverage.
A wide range of techniques have been used to build the 3-D models of the crust and upper mantle utilizing different aspects of seismic records. We accumulated the earth models in the upper mantle of SCB, obtained by the analysis of surface wave dispersion data as well as body waves arrival times (Table 1). We concentrate on the collection of models related to surface waves that combing the ambient noise data and earthquake data. Since the ambient noise correlation offers new data coverage (Shapiro et al., 2005) and shorter period dispersion, this enhances the constraint on the shallow crust. The upper mantle structures from surface waves can be affected by the crustal structure since it has a substantial impact on the propagation of surface waves (Bozdağ and Trampert, 2008; Panning et al., 2010). Therefore, the joint inversion of ambient noise and earthquake surface wave tomography can be helpful to improve the structures in the upper mantle.
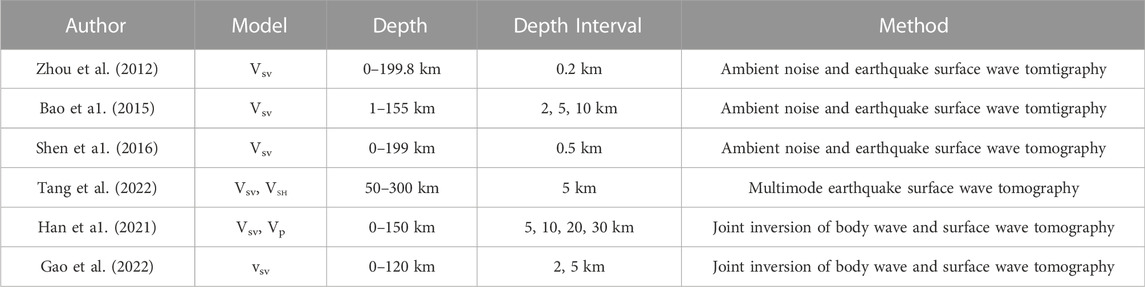
TABLE 1. Previous tomographic models used in this study.
The common approach of surface wave tomography is to extract the dispersion information directly from the observed seismogram or secondary observables based on cross correlograms (Cara and Lévêque, 1987). The 3-D shear wave velocities are then obtained by combing and inverting the path-specific dispersion curves either directly without any intermediate steps (Fang et al., 2015) or indirectly through the 2-D phase or group velocity maps. Due to the overlap and coupling of several higher-mode surface waves (Matsuzawa and Yoshizawa, 2019; Pan et al., 2019), the fundamental mode dispersion is typically measured using this approach, and the period range of the dispersion is in the middle to short period. Another approach proposed by Yoshizawa and Kennett (2002) can measure the multimode dispersion from one-single seismogram, including the intermediate step of creating phase velocity maps for multiple modes and frequencies, allowing the incorporation of finite-frequency effects and ray-tracing (Yoshizawa and Kennett 2004; Yoshizawa and Ekström, 2010).
Here, we provide a brief summary of the chosen upper mantle models in SCB. The main contribution to the mantle component of SREM-SC comes from the SV-wave velocity models obtained by surface wave tomography. Zhou et al., (2012) merged the Rayleigh wave group and phase velocity maps at 6–40 s period from ambient seismic noise data with phase velocity maps at 25–70 s derived from earthquakes in the same time frame to construct a 3-D Vsv model of the crust and upper mantle down to a depth of 150 km across SCB. Bao et al. (2015) presented a high-resolution shear-velocity model of the lithosphere (down to about 160 km) beneath China using Rayleigh wave group and phase velocity maps at periods of 10–140 s through the combination of ambient noise and earthquake data. Shen et al. (2016) produced isotropic Rayleigh wave group and phase velocity maps with uncertainty estimates from 8 to 50 s period across the China from ambient noise tomography, and extend them to 70 s period across parts of South China from earthquake tomography. Then, a Bayesian Monte Carlo methodology is used to build a shear-wave velocity model that covers the mainland China down to a depth of 150 km. Tang et al. (2022) refilled the inversion depth of the radially anisotropic 3-D shear-wave model of the whole South China Block down to a depth of at least 300 km using the multimode surface wave tomography (Yoshizawa and Ekström, 2010).
Apart from the surface wave data, we can make use of tomographic studies carried out using body wave arrivals for both P and S waves. Han et al. (2021) presented an updated high-resolution Vs and Vp models of the crust and uppermost mantle of continental China (USTClitho2.0) down to 150 km depth by joint inversion of numerous high-quality arrivals from 11,953 earthquakes and surface wave dispersion data based on the work of Xin et al. (2019) (USTClitho1.0). Gao et al. (2022) conducted research on the joint inversion of earthquake body wave and surface wave data from both earthquake and ambient noise to produce a high-resolution 3D Vs model of the lithosphere in South China. The jointly inverted models are further improved as a result of the complementary strengths of the two data kinds (Gao et al., 2022).
Figure 3 and Figure 4 illustrate the selected models with absolute velocities at depths of 70 km and 140 km. Only one-half of the models show a velocity structure below 150 km. The velocity anomalies of these models in the Yangtze Craton and Cathaysia Block are basically consistent. At 100 km, the western Yangtze Craton shows fast velocity while the Cathaysia Block, eastern Yangtze Craton, and North China Craton exhibit slow velocity. At 200 km, the western Yangtze Craton exhibits high-velocity anomaly and the Cathaysia Block primarily shows low-velocity anomaly despite the diversity of anomalous characteristic. The general consistency between the various models from surface waves and body waves means that the key features of the structure are comparable and well defined, which provides a basis for constructing the mantle component of SREM-SC. Nevertheless, we have to recognize that there are some discrepancies between the basic models due to the different techniques and data sets.
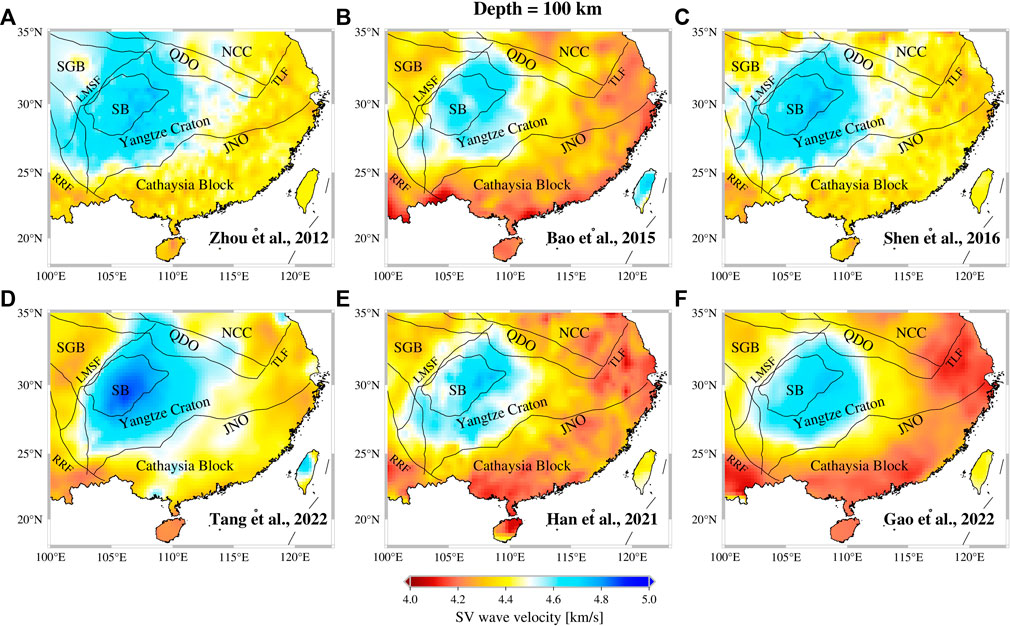
FIGURE 3. Shear wave velocity for the six SV wave models at 100 km depth from (A) Zhou et al. (2012) (B) Bao et al. (2015) (C) Shen et al. (2016) (D) Tang et al. (2022) (E) Han et al. (2021) (F) Gao et al. (2022).
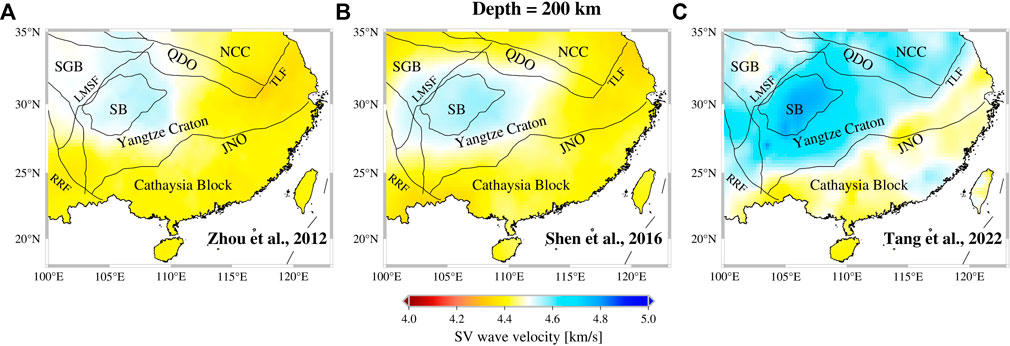
FIGURE 4. Shear wave velocity for the three SV wave models at 200 km depth from (A) Zhou et al. (2012) (B) Shen et al. (2016), and (C) Tang et al. (2022).
We establish the representative mantle component of Seismological Reference Earth Model in South China (SREM-SC) on the basis of information available in the earlier studies, by imitating the construction process of the Australian Seismological Reference Model (AuSREM, Salmon et al., 2013; Kennett et al., 2013), rather than conduct a new inversion.
The major control on the mantle component of SREM-SC comes from the shear wave velocity distribution derived from tomographic results. The radial anisotropy, P-wave velocity and density are then conducted from shear wave velocity. The mantle component of SREM-SC is specified in terms of absolute velocities and the primary model nodes are spaced at 0.5° apart in latitude and longitude and 5 km apart in depth from 60 km to 300 km.
The main contribution to the SV distribution is constructed from the available tomography models mentioned in the last section. Considering the vary grid sizes and depth intervals of these chosen models, we re-interpolate these models to ensure that they share the same range and interval of longitude, latitude and Depths.
In constructing the mantle component of SREM-SC, we seek to provide a representation where the major features are robust and reliable. Therefore, we adopt the linear combinations of these shear-wave velocity models with equal weight to emphasize such features, that is, average these models to obtain the final averaged SV wave model. The tendency is for smaller scale features to be obscured. We give the model same weight because the used seismic stations were similar, which also means that the ray path coverage was comparable.
The horizontal slices of SV wave velocity of the mantle component of SREM-SC are shown in Figure 5. At the uppermost mantle, about 60 km depth (Figure 5A), high-velocity features are observed beneath the Yangtze Craton and Cathaysia Block. While the eastern Tibetan Plateau displays a low-velocity anomaly, which indicates that the uppermost mantle of Tibetan Plateau has undergone significant deformation and high temperature (Bao et al., 2015). The cratonic root beneath Sichuan basin shows fast velocity, extending downward to 300 km, which is consistent with the results of previous studies. For instance, Shan et al. (2016) suggest that the high-velocity root reaches down to at least 250 km beneath the Sichuan Basin. The Cathaysia Block is dominated by a low velocity in the upper mantle as the depth descends (Figures 5B–D), which may reflect the strong mantle upwelling occurred in the late Mesozoic and Cenozoic. As we use absolute velocity, so the wave velocity has a natural tendency to increase with depth (Kennett et al., 2013).
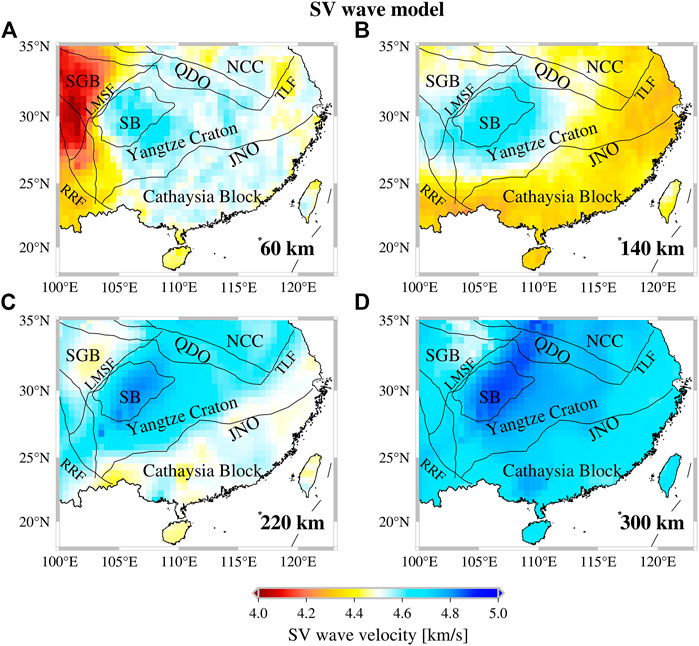
FIGURE 5. SV wave velocity of the mantle component of SREM-SC at depths of (A) 60 km (B) 140 km (C) 220 km, and (D) 300 km.
In addition, we discuss the similarities and differences between our average SV wave model and previous regional models. Since the average SV wave model are originated from these regional models, therefore the major features of all these models are concordant through comparison of multiple depths (take Figures 3–5 as examples), and which provides support for the stability of this representative model. As for the differences, it is mainly evaluated through quantitative calculation of relative velocity difference. The model differences at 100 km are displayed in Figure 6 as a percentage relative to the average model. Results show that the velocity difference in most areas was less than 6%. The velocities of our average SV wave model are smaller than the S-wave velocity results obtained by surface wave tomography (Figures 6A,C,D) in the Yangtze Craton and Cathaysia Block, except for the results of Bao et al. (2015). Beneath Sichuan Basin, the average model is closer to the S-wave results obtained by Zhou et al. (2012) and Shen et al. (2016). The results obtained from the joint inversion of body wave and surface wave (Figures 6E,F) are lower than the average model. In the vicinity of the eastern Tibetan Plateau, except for Zhou et al. (2012) and Shen et al. (2016) (Figures 6A,C), other models show slow velocity than the average model.
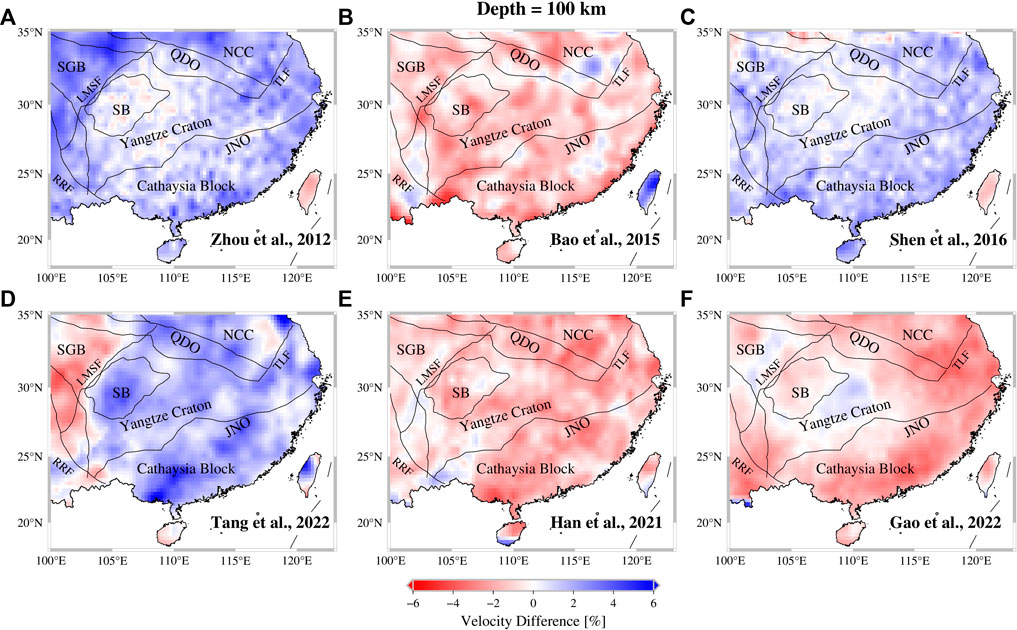
FIGURE 6. Horizontal slices at 100 km depth through SV wave velocity showing the relative velocity difference between regional models of (A) Zhou et al. (2012) (B) Bao et al. (2015) (C) Shen et al. (2016) (D) Tang et al. (2022) (E) Han et al. (2021) (F) Gao et al. (2022) and the mantle component of SREM-SC, respectively.
To date, previous surface wave studies have primarily employed Rayleigh wave phase or group dispersions to obtain the SV-wave structures, thus we have less information about the SH wave distribution. In this case, we tend to use the SH wave model proposed by Tang et al. (2022) as the SH wave representation of the mantle component of SREM-SC. Tang et al. (2022) extracted the fundamental mode to fourth higher-mode Love wave dispersion to construct a 3-D SH-wave velocity model in the entire South China Block using the multimode surface wave tomography.
The SH wave velocity of the mantle component of SREM-SC is displayed in Figure 7. The anomalous features of SH-wave velocity model are consistent with the SV-wave velocity distribution on a large scale, which is characterized by a fast velocity in the western Yangtze craton and a low velocity in the eastern Yangtze craton, the Tibetan Plateau, and the Cathaysia Block. Locally, there are obvious distinctions between SV wave and SH wave velocity anomalies, as shown, the velocity anomaly in the Leizhou Peninsula and southeastern coastal area of Cathaysia Block. Similar low-velocity anomaly has been reported by regional and global tomographic researches, from the surface extends to upper mantle, mantle transition zone, even down to lower mantle. The lowest SH-wave velocity is located beneath southernmost South China at approximately 108°E and 23°N (Figures 7C,D), which is in good agreement with the location of strongest attenuation revealed by teleseismic body wave attenuation tomography (Deng et al., 2021), might be attributed to the deep source mantle plume in this area.
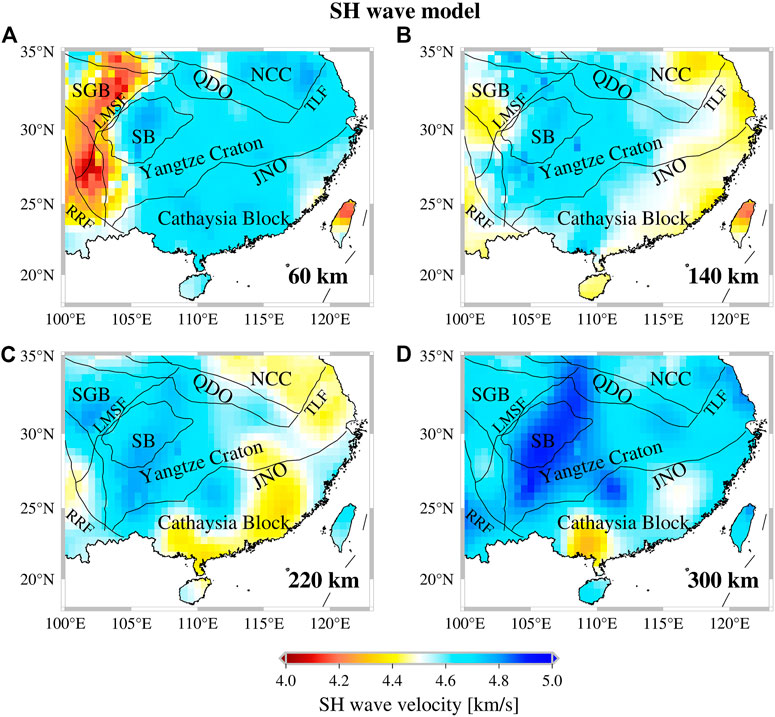
FIGURE 7. SH wave velocity of the mantle component of SREM-SC at (A) 60 km (B) 140 km (C) 220 km, and (D) 300 km depths using the result of Tang et al. (2022).
Seismic anisotropy is a crucial tool for identifying crust-mantle material flow and deep material deformation. The intensity and spatial distribution of anisotropy reflect the deformation properties of the earth’s interior components; thus, the analysis of radial anisotropy can provide constraints on the formation and evolution of crust-mantle structures (Savage, 1999; Mainprice, 2007). The deformation of the SCB has been explored in earlier researches through a variety of methods (e.g., Yao et al., 2010; Huang et al., 2011; Xie et al., 2013; Liu et al., 2019), however the majority of them focus on the shallow crust and lack depth constraints on the upper mantle.
In this study, we construct a representative radial anisotropy model in the upper mantle of SCB by combining the previously stated SV wave and SH wave models. The definition of radial anisotropy is
The radial anisotropy distribution of the mantle component of SREM-SC is illustrated in Figure 8, which is compatible with the work of Tang et al. (2022), who had discussed the similarities and differences between the upper mantle of South China and previous regional and global radial anisotropy models (e.g., Tao et al., 2018; Witek et al., 2021). The study region largely displays positive radial anisotropy at a shallower depth of 60 km (Figure 8A). The Sichuan Basin and its western parts exhibit negative radial anisotropy at 140 km depth (Figure 8B), whereas the Cathaysia Block and Yangtze Craton are dominated by positive radial anisotropy. The Cathaysia Block, Yangtze Craton, NCC, and the eastern Tibetan Plateau gradually exhibit negative radial anisotropy with increasing depth; these features are visible on the map at 220 and 300 km depths (Figures 8C,D). At a depth of 300 km, the anisotropy in the Sichuan Basin decreases while the negative anisotropy of the Cathaysia Block increases, especially beneath the Leizhou Peninsula and its environs and the southeastern coastal region. The negative radial anisotropy beneath the Sichuan Basin and its western portion may reflect the influence of the compression of the Tibetan Plateau and the thermal erosion of mantle flow (Tang et al., 2022). The obvious negative radial anisotropy in the asthenosphere of the coastal region of Cathaysia Block reveals that the vertical movement of mantle material is dominant, which may be related to the small-scale mantle convection above the back arc subduction plate due to the subduction of the Philippine Sea plate (Peng et al., 2007). We attribute the signal of negative radial anisotropy and low-velocity anomaly in Leizhou Peninsula and surroundings to the vertical movement of upper mantle, possibly related to the Cenozoic Hainan mantle plume. This point was supported by the direct seismic observations of receiver function analysis. The results of Wei and Shen (2016) beneath the Lei-Qing region reveal that the crustal thickness has been thickened and the mantle transition zone (MTZ) has been thinning, which suggests the upwelling of mantle materials penetrating the MTZ to thicken the local crust.
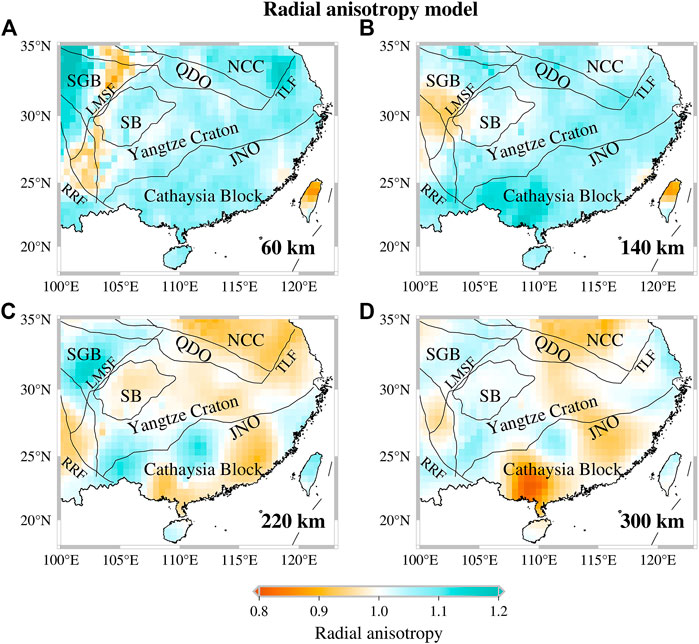
FIGURE 8. Radial anisotropy distribution of the mantle component of SREM-SC at (A) 60 km (B) 140 km (C) 220 km, and (D) 300 km depths, determined from the SV wave velocity of SREM-SC and SH wave velocity of Tang et al. (2022).
There are few publicly available data on the P-wave velocity of the upper mantle in the SCB, and the majority of P-wave model come from body wave tomography from wider regions (e.g., Zhao et al., 2012). The vertical resolution of body wave tomography is poor compared to the study of surface wave tomography because of steep ray paths. The main information we gather on the P-wave velocity distribution of SCB comes from the full waveform seismic tomography on the upper mantle beneath eastern Asia (Tao et al., 2018) and the joint inversion of body-wave and surface wave tomography down to a depth of 150 km (Han et al., 2021).
The construction process of P wave velocity of the mantle component of SREM-SC is shown in Figure 9. In this study, we first use the Vp/Vs ratio derived from FWEA18 model (Tao et al., 2018) and the SV wave velocity of the mantle component of SREM-SC to obtain a converted P wave velocity, instead of using the empirical relationship between P wave velocity and shear wave velocity (named Brocher’s regression fit), which is invalid for shear-wave velocities larger than 4.5 km/s (Brocher, 2005). With equal weights, the converted P wave velocity and the P wave velocity of USTClitho2.0 model (Han et al., 2021) are used to create the averaged P wave model.
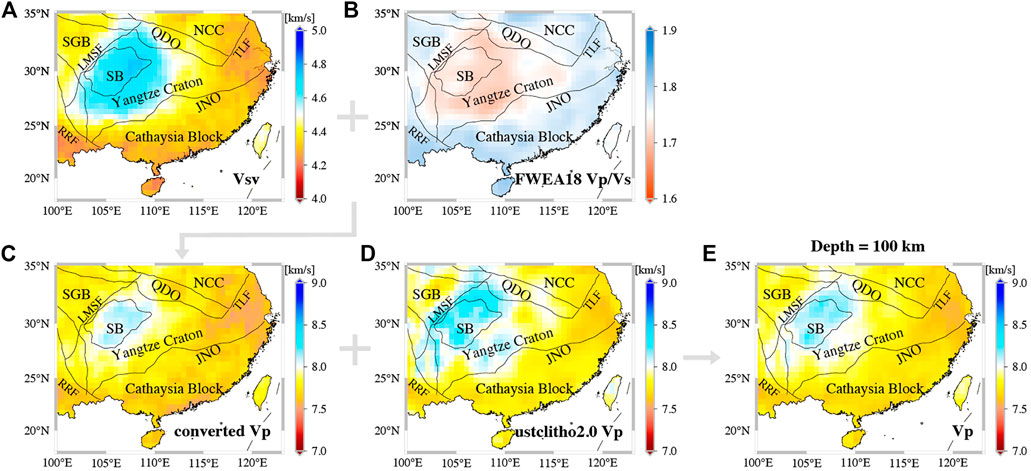
FIGURE 9. The construction process of P wave velocity of the mantle component of SREM-SC keyed at a map view of 100 km depth (C) The converted P wave model is obtained by combing (A) the averaged SV wave model with (B) the Vp/Vs ratio from the FWEA18 model (Tao et al., 2018), and then averaged with (D) the P wave velocity from USTClitho2.0 model (Han et al., 2021) to build (E) the final P wave velocity of the mantle component of SREM-SC.
The resulting distribution of P wave velocity is shown in Figure 10. We utilize variable color bar to better visualize the results, since the absolute velocity of P wave increases greatly with depth. The anomalous features of P wave model are generally similar with those of the shear wave model except for the 60 km. At a depth of 60 km (Figure 10A), the P wave velocities of SCB clearly demonstrate lateral heterogeneity which is primarily caused by the heterogeneous distribution of P wave velocity in the USTClitho2.0 model (Han et al., 2021). The eastern Tibetan Plateau is characterized by a slow velocity. At depths of 140 km and 220 km, the western Yangtze Carton shows a fast velocity while the Cathaysia Block and eastern Yangtze Craton display a slow velocity. At 300 km, the Cathaysia Block exhibits a low-velocity anomaly compared to the high-velocity anomaly in the Sichuan Basin. Zhao et al. (2012) interpreted the low-velocity anomalies of P and S waves in the upper mantle of the Cathaysia block as a result of the upwelling of hot materials, caused by the dehydration of the Paleo Pacific subduction plate detained in the mantle transition zone in the Mesozoic. The high P wave velocity beneath Yangtze Craton is usually associated with low Vp/Vs ratio, thick lithospheric root and lower temperature.
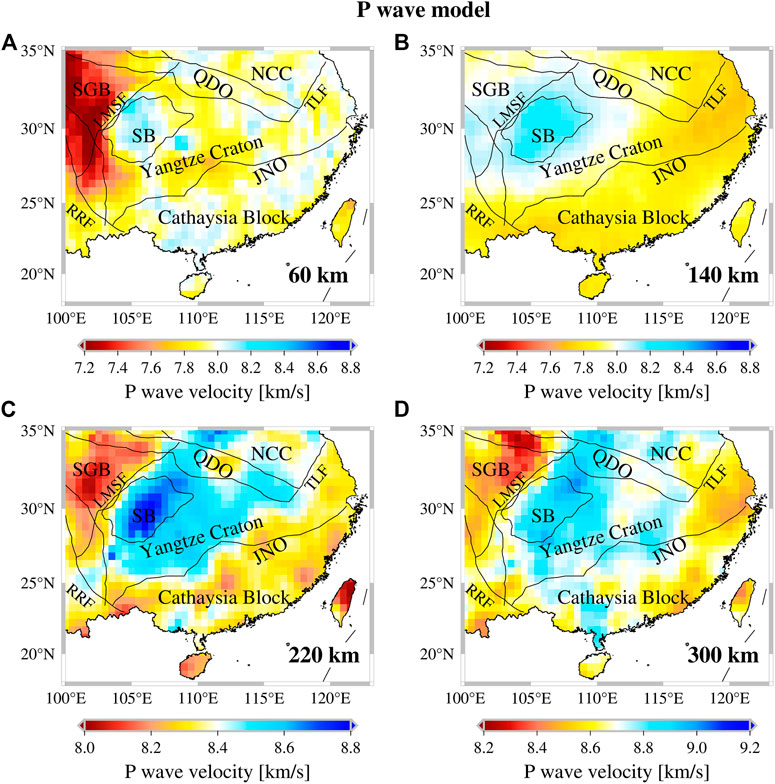
FIGURE 10. P wave velocity of the mantle component of SREM-SC at depths of (A) 60 km (B) 140 km (C) 220 km, and (D) 300 km.
The density attribute is related to its material composition and temperature structure, as an important basic for understanding the plate tectonic evolution and dynamic processes (Ji et al., 2019). The study on the density of SCB mainly focuses on the crust and uppermost mantle, such as Deng et al. (2014) investigated the 3-D density structure of SCB down to 70 km based on P-wave velocities determined from seismic profiles and Bouguer gravity anomalies, but there is less direct information on the density of the upper mantle.
We have followed an empirical relationship linking the density to the shear-wave velocity proposed by Kennett et al. (2013). They set a threshold
Where
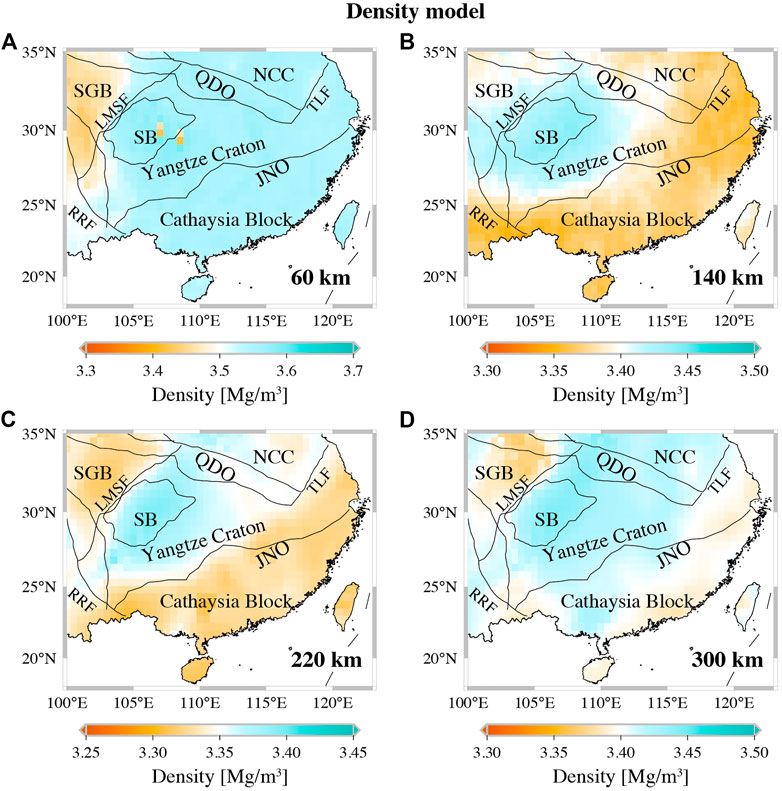
FIGURE 11. The density distribution of the mantle component of SREM-SC at depths of (A) 60 km (B) 140 km (C) 220 km, and (D) 300 km, calculated from the empirical relationship proposed by Kennett et al. (2013) between the density and shear wave velocity. The solid black lines in (A) denote the location of cross-sections in Figure 12, Figure 13.
We propose a 3-D representative upper mantle component of Seismological Reference Earth Model in South China (SREM-SC). For the mantle component of SREM-SC, we employ the SV wave velocity as the primary control, and we derive the radial anisotropy, P wave velocity and density based on the relationship between variables with SV velocity.
The mantle component of SREM-SC is illustrated in Figure 12 and Figure 13 which show four representative cross-sections through the SV wave velocity, SH wave velocity, radial anisotropy, P wave velocity and density in both latitude and longitude. Cross-section W1-E1 and W2-E2 crosses the southeastern Tibetan Plateau (TP), Yangtze Craton (YC), and Cathaysia Block (CB). As can be seen in Figure 12A, the Cathaysia Block shows low SV-wave and P-wave velocity. The SH-wave velocity of western Cathaysia Block is higher than the eastern coastal areas. In Figure 12B, significant fast SV-wave, SH-wave and P-wave velocities and high density are shown beneath the Yangtze Craton, especially the western Yangtze Craton. The eastern Yangtze Craton exhibits slow SV-wave, slow P-wave velocity above 200 km and low density. A low-velocity zone exists beneath the Tibetan Plateau in the uppermost mantle. Cross-section N1-S1 and N2-S2 identify these conspicuous features from the longitude perspective. There is an obvious high-velocity zone and high density in the lithosphere and asthenosphere of the western Yangtze Craton, extending from 50 to 350 km (Figure 13A). The slow velocity beneath the eastern Yangtze Craton is indistinguishable from the Cathaysia Block (Figure 13B), and Huang et al. (2009) believed that the low velocity anomaly was due to the thermochemical effect of the subduction of the Sulu Ocean crust.
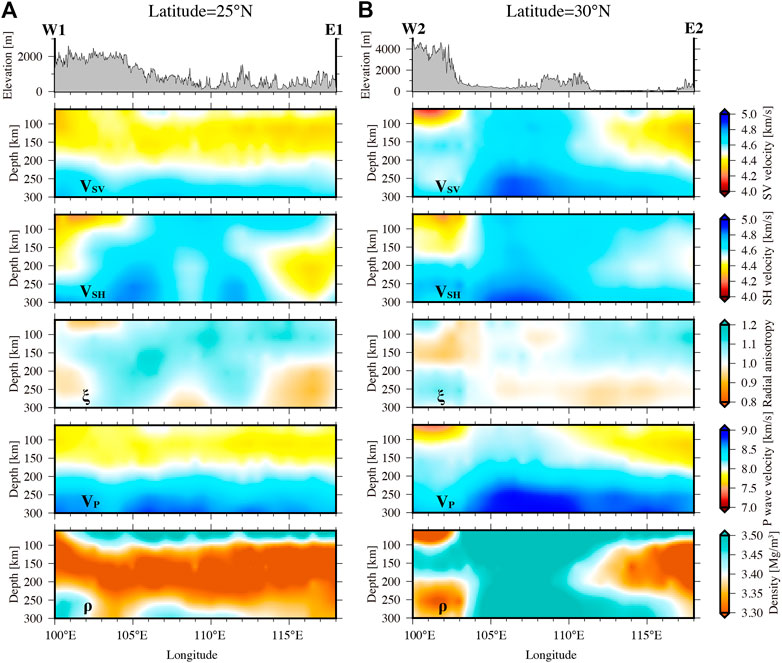
FIGURE 12. Vertical Cross-sections of the mantle component of SREM-SC along profiles (A) W1-E1 at 25°N and (B) W2-E2 at 30°N indicated in Figure 11A. Topography is plotted above each cross-section, and the red lines are the approximate border of the main tectonic units. YC, Yangtze Craton; CB, Cathaysia Block; TP, Tibetan Plateau; NCC, North China Craton; QDO, Qinling-Dabie Orogen.
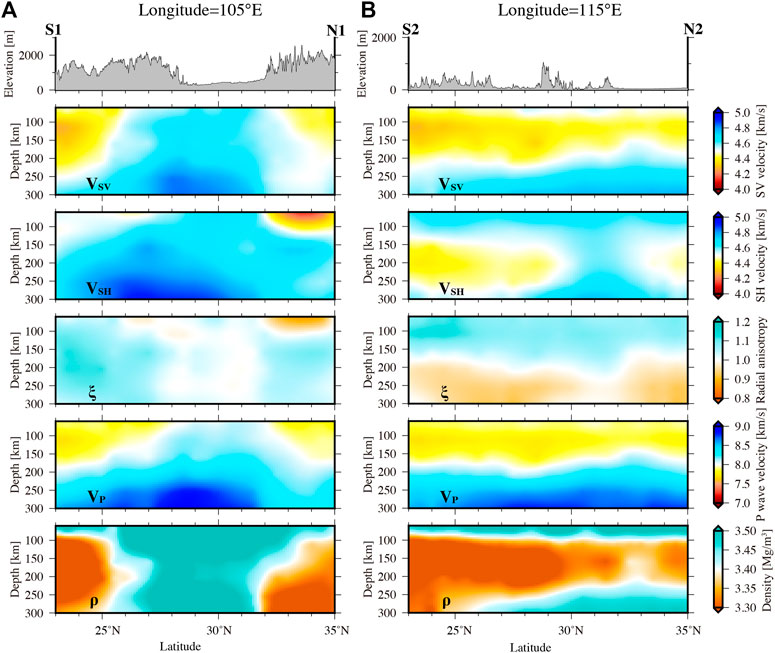
FIGURE 13. Same as Figure 12, but along profiles (A) S1-N1 at 105°E and (B) S2-N2 at 115°E, indicated in Figure 11A.
The SV model is well constrained and we have confidence in the major features. The most noticeable feature of shear wave model and P wave model in the upper mantle is the fast velocity in the Yangtze Craton compared to the low-velocity anomaly in the Cathaysia Block. This is a consistent feature revealed by earlier regional models, for example, the shear wave velocity models described in Section 2, as well as global models. The distribution of radial anisotropy correlates well with the results of Tang et al. (2022), since we adopt their SH wave velocity as the SH wave representation. The research on SH wave determined from Love wave in South China need to be enhanced. By applying the empirical relation constructed by Kennett et al. (2013) to compensate for the effect of high velocity, the density differences are modest and do not show much dependence on the high velocity zones. However, as the seismic S-wave result is the only factor that constrain the density structure, it is preferable to combine the gravity and seismology inversions in order to reduce the non-uniqueness of inversion and improve the horizontal and vertical resolution. At the same time, we realize that the reference model will be further improved based on new information in the future to better construct the lithosphere and asthenosphere boundaries, and attenuation, etc.
The mantle component of SREM-SC provides a good representation of 3-D structure beneath South China Block at a standard 0.5° × 0.5° grid in latitude and longitude and 5 km interval in depth that can be used for a variety of purposes. For instance, gravity modelling and investigations of dynamic topography (Kennett et al., 2013) should benefit from the SREM-SC. The mantle component of SREM-SC provides new insights into upper mantle structures, which should be meaningful to reveal the dynamic mechanism and tectonic evolution of South China. The data set of the mantle component of SREM-SC is added in the Supplementary Material.
The raw data supporting the conclusion of this article will be made available by the authors, without undue reservation.
The specific contributions of each author can be described as follows. QT: Conceptualization, Methodology, Investigation, Data Curation, Writing-Original Draft, Visualization; WS: Conceptualization, Investigation, Resources, Supervision, Writing-Review and Editing, Funding acquisition; JH: Methodology, Data Curation, Form analysis, Validation, Writing-Review and Editing; L-YF: Resources, Writing-Review and Editing, Project administration, Funding acquisition. All authors contributed to the article and approved the submitted version.
This research was supported by National Natural Science Foundation of China (Grants No. 41720104006) and the Youth Innovation Promotion Association CAS.
We thank the shear wave velocity model beneath the mainland China provided by Xuewei Bao. We thank the excellent models provided by Lei Gao (doi.org/10.5281/zenodo.5650189) and Shoucheng Han (https://github.com/ShouchengHan/USTClitho2.0) and the earth models provided by the China regional seismological reference model achievement center (http://chinageorefmodel.org) and the IRIS DMC Data Products effort (Trabant et al., 2012). All figures were drawn using Generic Mapping Tools (Wessel and Smith, 1991).
The authors declare that the research was conducted in the absence of any commercial or financial relationships that could be construed as a potential conflict of interest.
All claims expressed in this article are solely those of the authors and do not necessarily represent those of their affiliated organizations, or those of the publisher, the editors and the reviewers. Any product that may be evaluated in this article, or claim that may be made by its manufacturer, is not guaranteed or endorsed by the publisher.
The Supplementary Material for this article can be found online at: https://www.frontiersin.org/articles/10.3389/feart.2022.1080298/full#supplementary-material
An, M., and Shi, Y. (2006). Lithospheric thickness of the Chinese continent. Phys. Earth Planet. Interiors 159, 257–266. doi:10.1016/j.pepi.2006.08.002
Bao, X., Song, X., and Li, J. (2015). High-resolution lithospheric structure beneath Mainland China from ambient noise and earthquake surface-wave tomography. Earth Planet. Sci. Lett. 417, 132–141. doi:10.1016/j.epsl.2015.02.024
Bozdağ, E., and Trampert, J. (2008). On crustal corrections in surface wave tomography. Geophys. J. Int. 172 (3), 1066–1082. doi:10.1111/j.1365-246X.2007.03690.x
Brocher, T. M. (2005). Empirical relations between elastic wavespeeds and density in the Earth’s crust. Bull. Seismol. Soc. Am. 95 (6), 2081–2092. doi:10.1785/0120050077
Cao, X., Flament, N., Müller, D., and Li, S. (2018). The dynamic topography of eastern China since the latest jurassic period. Tectonics 37, 1274–1291. doi:10.1029/2017tc004830
Cara, M., and Lévêque, J. J. (1987). Waveform inversion using secondary observables. Geophys. Res. Lett. 14, 1046–1049. doi:10.1029/gl014i010p01046
Deng, Y., Byrnes, J. S., and Bezada, M. (2021). New insights into the heterogeneity of the lithosphere-asthenosphere system beneath SouthSouth China from teleseismic body-wave attenuation. Geophys. Res. Lett. 48. doi:10.1029/2020gl091654
Deng, Y., Zhang, Z., Badal, J., and Fan, W. (2014). 3-D density structure under South China constrained by seismic velocity and gravity data. Tectonophysics 627, 159–170. doi:10.1016/j.tecto.2013.07.032
Enkin, R. J., Yang, Z., Chen, Y., and Courtillot, V. (1992). Paleomagnetic constraints on the geodynamic history of the major blocks of China from the Permian to the present. J. Geophys. Res. 97 (B10), 13953. doi:10.1029/92jb00648
Fang, H., Yao, H., Zhang, H., Huang, Y. C., and van der Hilst, R. D. (2015). Direct inversion of surface wave dispersion for three-dimensional shallow crustal structure based on ray tracing: Methodology and application. Geophys. J. Int. 201, 1251–1263. doi:10.1093/gji/ggv080
Faure, M., Chen, Y., Feng, Z., Shu, L., and Xu, Z. (2017). Tectonics and geodynamics of South China: An introductory note. J. Asian Earth Sci. 141, 1–6. doi:10.1016/j.jseaes.2016.11.031
Gao, L., Zhang, H., Gao, L., He, C., Xin, H., and Shen, W. (2022). High-resolution vs tomography of South China by joint inversion of body wave and surface wave data. Tectonophysics 824, 229228. doi:10.1016/j.tecto.2022.229228
Guo, L., Gao, R., Shi, L., Huang, Z., and Ma, Y. (2019). Crustal thickness and Poisson's ratios of South China revealed from joint inversion of receiver function and gravity data. Earth Planet. Sci. Lett. 510, 142–152. doi:10.1016/j.epsl.2018.12.039
Han, S., Zhang, H., Xin, H., Shen, W., and Yao, H. (2021). USTClitho2.0: Updated unified seismic tomography models for continental China lithosphere from joint inversion of body-wave arrival times and surface-wave dispersion data. Seismol. Res. Lett. 93 (1), 201–215. doi:10.1785/0220210122
He, R., Shang, X., Yu, C., Zhang, H., and Van der Hilst, R. D. (2014). A unified map of Moho depth and Vp/Vs ratio of continental China by receiver function analysis. Geophys. J. Int. 199 (3), 1910–1918. doi:10.1093/gji/ggu365
Huang, J., and Zhao, D. (2006). High-resolution mantle tomography of China and surrounding regions. J. Geophys. Res. 111, B09305. doi:10.1029/2005JB004066
Huang, Z., Wang, L., Zhao, D., Mi, N., and Xu, M. (2011). Seismic anisotropy and mantle dynamics beneath China. Earth Planet. Sci. Lett. 306, 105–117. doi:10.1016/j.epsl.2011.03.038
Huang, Z., Zhao, D., and Wang, L. (2015). P wave tomography and anisotropy beneath Southeast Asia: Insight into mantle dynamics. J. Geophys. Res. Solid Earth 120, 5154–5174. doi:10.1002/2015jb012098
Ji, F., Li, F., Zhang, Q., Chen, H., and Xiao, L. (2019). Crustal density structure of the Antarctic continent from constrained 3D gravity inversion. Chin. J. Geophys. (in Chinese) 62 (3), 849–863doi. doi:10.6038/cjg2019M0507
Kennett, B. L. N., Engdahl, E. R., and Buland, R. (1995). Constraints on seismic velocities in the Earth from traveltimes. Geophysical Journal International 122 (1), 108–124. doi:10.1111/j.1365-246x.1995.tb03540.x
Kennett, B. L. N., Fichtner, A., Fishwick, S., and Yoshizawa, K. (2013). Australian seismological reference model (AuSREM): Mantle component. Geophys. J. Int. 192 (2), 871–887. doi:10.1093/gji/ggs065
Lebedev, S., and Nolet, G. (2003). Upper mantle beneath southeast Asia fromSvelocity tomography. J. Geophys. Res. 108 (B1). doi:10.1029/2000jb000073
Li, Y., Wu, Q., Pan, J., Zhang, F., and Yu, D. (2013). An upper-mantle S-wave velocity model for East Asia from Rayleigh wave tomography. Earth and Planetary Science Letters 377-378, 367–377. doi:10.1016/j.epsl.2013.06.033
Li, Z. X., and Li, X. H. (2007). formation of the 1300-km-wide intracontinental orogen and postorogenic magmatic province in mesozoic South China: A flat-slab subduction model. Geol. 35, 179–182. doi:10.1130/g23193a.1
Liu, C., Yao, H., Yang, H. Y., Shen, W., Fang, H., Hu, S., et al. (2019). Direct inversion for three-dimensional shear wave speed azimuthal anisotropy based on surface wave ray tracing: Methodology and application to yunnan, southwest China. J. Geophys. Res. Solid Earth 124, 11394–11413. doi:10.1029/2018jb016920
Mainprice, D. (2007). Seismic anisotropy of the deep earth from a mineral and rock physics perspective. Treatise on Geophysics 1, 437–491. doi:10.1016/b978-044452748-6.00045-6
Mao, J., Li, Z., and Ye, H. (2014). Mesozoic tectono-magmatic activities in South China: Retrospect and prospect. Sci. China Earth Sci. 57 (12), 2853–2877. doi:10.1007/s11430-014-5006-1
Matsuzawa, H., and Yoshizawa, K. (2019). Array-based analysis of multimode surface waves: Application to phase speed measurements and modal waveform decomposition. Geophys. J. Int. 218 (1), 295–312. doi:10.1093/gji/ggz153
Pan, L., Chen, X., Wang, J., Yang, Z., and Zhang, D. (2019). Sensitivity analysis of dispersion curves of Rayleigh waves with fundamental and higher modes. Geophys. J. Int. 216, 1276–1303. doi:10.1093/gji/ggy479
Panning, M. P., Lekić, V., and Romanowicz, B. A. (2010). Importance of crustal corrections in the development of a new global model of radial anisotropy. J. Geophys. Res. 115, B12325. doi:10.1029/2010JB007520
Peng, Y.-J., Huang, Z., Su, W., and Zheng, Y. J. (2007). Anisotropy in crust and upper mantle beneath China continent and its adjacent seas. Chinese J. Geophys. 50 (3), 666–674. (In Chinese). doi:10.1002/cjg2.1080
Salmon, M., Kennett, B. L. N., and Saygin, E. (2013). Australian seismological reference model (AuSREM): Crustal component. Geophys. J. Int. 192 (1), 190–206. doi:10.1093/gji/ggs004
Savage, M. K. (1999). Seismic anisotropy and mantle deformation: What have we learned from shear wave splitting? Rev. Geophys. 37, 65–106. doi:10.1029/98rg02075
Shan, B., Xiong, X., Zhao, K. F., Xie, Z. J., Zheng, Y., and Zhou, L. (2016). Crustal and upper mantle structure of South China from Rayleigh wave tomography. Geophys. J. Int. 254, ggw477. doi:10.1093/gji/ggw477
Shapiro, N. M., Campillo, M., Stehly, L., and Ritzwoller, M. H. (2005). High-resolution surface-wave tomography from ambient seismic noise. Science 307, 1615–1618. doi:10.1126/science.1108339
Shen, W., Ritzwoller, M. H., Kang, D., Kim, Y., Lin, F.-C., Ning, J., et al. (2016). A seismic reference model for the crust and uppermost mantle beneath China from surface wave dispersion. Geophys. J. Int. 206 (2), 954–979. doi:10.1093/gji/ggw175
Sun, W., and Kennett, B. L. N. (2016a). Uppermost mantle P wavespeed structure beneath eastern China and its surroundings. Tectonophysics 683, 12–26. doi:10.1016/j.tecto.2016.06.011
Sun, W., and Kennett, B. L. N. (2016b). Uppermost mantle structure beneath eastern China and its surroundings from Pn and Sn tomography. Geophys. Res. Lett. 43 (7), 3143–3149. doi:10.1002/2016gl068618
Sun, Y., and Toksöz, M. N. (2006). Crustal structure of China and surrounding regions from P wave traveltime tomography. J. Geophys. Res. 111. doi:10.1029/2005jb003962
Tang, Q., Sun, W., Yoshizawa, K., and Fu, L. (2022). Anomalous radial anisotropy and its implications for upper mantle dynamics beneath South China from multimode surface wave tomography. JGR. Solid Earth 127–e2021JB023485. doi:10.1029/2021JB023485
Tao, K., Grand, S. P., and Niu, F. N. (2018). Seismic structure of the upper mantle beneath Eastern Asia from full waveform seismic tomography. Geochem. Geophys. Geosyst. 19, 2732–2763. doi:10.1029/2018GC007460
Trabant, C., Hutko, A. R., Bahavar, M., Karstens, R., Ahern, T., and Aster, R. (2012). Data products at the IRIS DMC: Stepping stones for research and other applications. Seismological Research Letters 83 (5), 846–854. doi:10.1785/0220120032
Wang, C., Chang, L., Ding, Z., Liu, Q., Liao, W., and Flesch, L. M. (2014). Upper mantle anisotropy and crust-mantle deformation pattern beneath the Chinese mainland. Sci. China Earth Sci. 57, 132–143. doi:10.1007/s11430-013-4675-5
Wei, S. S., and Chen, Y. J. (2016). Seismic evidence of the Hainan mantle plume by receiver function analysis in southern China. Geophys. Res. Lett. 43, 8978–8985. doi:10.1002/2016GL069513
Wessel, P., and Smith, W. H. F. (1991). Free software helps map and display data. Eos Trans. AGU. 72 (41), 441. doi:10.1029/90eo00319
Witek, M., Chang, S.-J., Lim, D. Y., Ning, S., and Ning, J. (2021). Radial anisotropy in East Asia from multimode surface wave tomography. JGR. Solid Earth 126–e2020JB021201. doi:10.1029/2020JB021201
Xie, J., Ritzwoller, M. H., Shen, W., Yang, Y., Zheng, Y., and Zhou, L. (2013). Crustal radial anisotropy across eastern Tibet and the western Yangtze craton. J. Geophys. Res. Solid Earth 118 (8), 4226–4252. doi:10.1002/jgrb.50296
Xin, H., Zhang, H., Kang, M., He, R., Gao, L., and Gao, J. (2019). High-resolution lithospheric velocity structure of continental China by double difference seismic traveltime tomography. Seismological Research Letters 90 (1), 229–241. doi:10.1785/0220180209
Yao, H., van der Hilst, R. D., and Montagner, J.-P. (2010). Heterogeneity and anisotropy of the lithosphere of SE Tibet from surface wave array tomography. J. Geophys. Res. 115 (B12), B12307. doi:10.1029/2009jb007142
Yoshizawa, K., and Ekström, G. (2010). Automated multimode phase speed measurements for high-resolution regional-scale tomography: Application to north America. Geophys. J. Int. 183, 1538–1558. doi:10.1111/j.1365-246X.2010.04814.x
Yoshizawa, K., and Kennett, B. L. N. (2004). Multimode surface wave tomography for the Australian region using a three-stage approach incorporating finite frequency effects. J. Geophys. Res. 109. doi:10.1029/2002jb002254
Yoshizawa, K., and Kennett, B. L. N. (2002). Non-linear waveform inversion for surface waves with a neighbourhood algorithm—Application to multimode dispersion measurements. Geophys. J. Int. 149, 118–133. doi:10.1046/j.1365-246X.2002.01634.x
Zhang, G., Guo, A., Wang, Y., Li, S., Dong, Y., Liu, S., et al. (2013). Tectonics of South China continent and its implications. Sci. China Earth Sci. 56 (11), 1804–1828. doi:10.1007/s11430-013-4679-1
Zhao, L., Allen, R. M., Zheng, T., and Zhu, R. (2012). High-resolution body wave tomography models of the upper mantle beneath eastern China and the adjacent areas. Geochem. Geophys. Geosyst. 13 (6). doi:10.1029/2012gc004119
Zheng, X., Jiao, W., Zhang, C., and Wang, L. (2010). Short-Period Rayleigh-wave group velocity tomography through ambient noise cross-correlation in xinjiang, northwest China. Bulletin of the Seismological Society of America 100 (3), 1350–1355. doi:10.1785/0120090225
Keywords: South China block, upper mantle, surface waves, body waves, tomography
Citation: Tang Q, Sun W, Hu J and Fu L-Y (2023) Seismological reference earth model in South China (SREM-SC): Upper mantle. Front. Earth Sci. 10:1080298. doi: 10.3389/feart.2022.1080298
Received: 26 October 2022; Accepted: 29 November 2022;
Published: 10 January 2023.
Edited by:
Lidong Dai, Institute of geochemistry (CAS), ChinaCopyright © 2023 Tang, Sun, Hu and Fu. This is an open-access article distributed under the terms of the Creative Commons Attribution License (CC BY). The use, distribution or reproduction in other forums is permitted, provided the original author(s) and the copyright owner(s) are credited and that the original publication in this journal is cited, in accordance with accepted academic practice. No use, distribution or reproduction is permitted which does not comply with these terms.
*Correspondence: Weijia Sun, c3dqQG1haWwuaWdnY2FzLmFjLmNu
Disclaimer: All claims expressed in this article are solely those of the authors and do not necessarily represent those of their affiliated organizations, or those of the publisher, the editors and the reviewers. Any product that may be evaluated in this article or claim that may be made by its manufacturer is not guaranteed or endorsed by the publisher.
Research integrity at Frontiers
Learn more about the work of our research integrity team to safeguard the quality of each article we publish.