 Xinqiang Gao1
 Chao Kong
 Feng Lu
 Songbo Ren
95% of researchers rate our articles as excellent or good
Learn more about the work of our research integrity team to safeguard the quality of each article we publish.
Find out more
ORIGINAL RESEARCH article
Front. Earth Sci. , 20 December 2022
Sec. Environmental Informatics and Remote Sensing
Volume 10 - 2022 | https://doi.org/10.3389/feart.2022.1079405
This article is part of the Research Topic Advances and Applications of Artificial Intelligence and Numerical Simulation in Risk Emergency Management and Treatment View all 22 articles
The stability of the surrounding rock analysis and evaluation during tunnel construction is the basis of tunnel construction risk control. In this paper, we focus on the stability of a large-scale transportation tunnel complex during its construction in a densely-populated urban area. The tunnel complex includes seven shallow-buried tunnels with large cross-sections. In order to gain insight into the excavation influence of the different tunnels, stability analyses were first carried out using FLAC3D numerical simulation. Results showed that the tunnels were subjected to heave and crown settlement induced by adjacent excavation. Also, stress concentrated in the rock blocks connecting different tunnels. Subsequently, a bench-scale model test was performed to understand the failure of the rock blocks and to examine the accuracy of the numerical simulation. The test results agreed well with the numerical simulation. Based on the numerical and test results, the mechanism of the rock blocks failure was explained and construction risk control technology to stabilize the rock blocks was proposed. The construction risk analyses revealed: 1) tunnels are subjected to significant heave due to the excavation of tunnels located above; 2) the stability of the rock blocks is the paramount determinant for stabilizing the whole tunnel complex; 3) ensuring rock blocks to be in a state of triaxial stress is conducive to its stability and hence the stability of multiple tunnels.
The analysis and evaluation of tunnel stability is the basis of tunnel construction risk control (Liu et al., 2018; Xu et al., 2021). The stability of the rock mass during underground construction is the highest priority for engineers and scholars in the field of underground engineering because it is closely related to people’s lives and property safety. Previous experience has shown that rock mass failure in underground works induces heavy casualties and property loss, especially in densely-populated urban areas. For example, the collapse of a large-scale metro tunnel support system in Singapore claimed four victims and caused subsidence of the nearby Nicoll Highway (COI, 2005; Whittle, 2006). Another serious accident during the metro construction in Sao Paulo (Barton, 2008), seven lives were lost. The risk of tunnel construction is primarily assessed by the geological environment, surrounding rock stability, liner deformation, surrounding rock stress, and so on (Yu et al., 2017; Li et al., 2019).
The construction stability of large tunnel complex is related to the degree of fracture and shear strength of the rock. The correct selection of rock strength is the premise of tunnel stability calculation. Many scholars have made a lot of research on the accurate measurement of rock strength. To better understand the shear behavior of infilled rock joints with standard joint roughness coefficient (JRC) profiles, Zhao (Zhao et al., 2020) used the direct shear method to experiment on sand-filled joints by replicating standard JRC profiles on rock-like materials and placing fill material within the joints. Due to the discrete nature of rock strength, a new natural rock formation strength model was developed based on the shear-related roughness classification of fuzzy integrated evaluation (Zhao et al., 2021a). And other rock strength measurement methods are also available (Zhao et al., 2019; Cao et al., 2016). In fact, the importance of rock mass stability has long been recognized and a great deal of research in recent years has focused on this issue for the underground engineering safety (Liu et al., 2011; Feng et al., 2012; Qian and Lin, 2016; Liang and Liu, 2022). Unfortunately, due to the complexity of geotechnical engineering, stability analysis of rock mass still heavily relies on empiricism even though a few failure criteria (e.g., the Mohr-Coulomb criterion) has been proposed (John, et al., 2007). Zheng et al. (2006, 2008) formulated a strength reduction finite element method (SRFEM) to deal with this problem. Athough still in research phase, the SRFEM has gradually been recognized in engineering practice in China (Zhang, et al., 2007; Pan et al., 2021; Wang et al., 2022).
On the other hand, limited space on the ground has stimulated the development of underground space. For example, in recent years there has been significant construction of underground infrastructure in urban areas with the emergence of adjacent transport tunnel projects (Kim, 1996; Liu et al., 2009; Kong et al., 2016; Hu et al., 2021; Zhao et al., 2021b), even the projects of tunnel complex (multiple tunnels) (Zheng, et al., 2009; Duan and Li, 2012; Zhang et al., 2018; Zheng et al., 2021; Zheng et al., 2022). It is clear that the trend of urban underground excavations is becoming increasingly complex, which makes the complicated stability analysis of rock mass an even more critical issue. And the risks of construction are significantly increased. For tunnel construction risk control measures, different construction situations require targeted analysis. Safety risk control mainly includes pre-construction risk identification and risk warning in construction (Li et al., 2018). During the risk identification phase, a number of challenges need to be overcome. First, traditional methods require a lot of human resources, materials and time. The second problem is the shortage of experienced risk identification experts. Limited by time and space, timely sharing of knowledge becomes unrealistic. Finally, the tunnel construction team will be disbanded at the end of the construction. Therefore, the accumulation of security risk knowledge is completely blank. On the other hand, the quality of risk warning depends on the monitoring data during construction. However, the formulation of control standards based on monitoring data is not reasonable (Zhou et al., 2015).
This paper, based on an unprecedented tunnel complex that contains seven parallel or intersecting tunnels with shallow depths and large cross sections, investigates the stability of the rock mass using FLAC3D numerical models. Stress distribution, crown displacement and the development of plastic zones induced by excavations of multiple tunnels were analyzed. Results showed that the stability of the rock blocks connecting different tunnels was the primary determinant of the overall stability of the multiple tunnels. Furthermore, in order to examine the accuracy of the above analyses, a scaled model test was performed in the laboratory. The test results confirmed the accuracy of the numerical simulation in terms of the potential failure zones and the stress distribution in the rock mass. Subsequently, the mechanism of the stability of the rock blocks was discussed on the basis of the Mohr-Coulomb criterion. According to the analysis, a practical reinforcement scheme strengthening the rock blocks was proposed to reduce the construction risk of the entire tunnel complex project.
The large-scale tunnel complex, consisting of seven shallow-buried tunnels with large cross-sections, is located in the Hongyan Village in Chongqing, China. Specifically, the seven tunnels are as follows (Figure 1): a subway station (SS); a ventilation duct (VD) intersecting with the subway station; two parallel double-lane highway tunnels (HT-L and HT-R); two ramp tunnels (RT-A and RT-B) that are in close proximity to the highway tunnels; an existing railway tunnel (ERT) which was built in the 1970s and now is out of service. Additionally, it is worth mentioning that the minimum distance between the SS and the ERT is only 1.2 m and the minimum distance between the SS and the HT-L is only 2.0 m. The south and west sides of the project are adjacent to populated residential areas with densely built buildings.
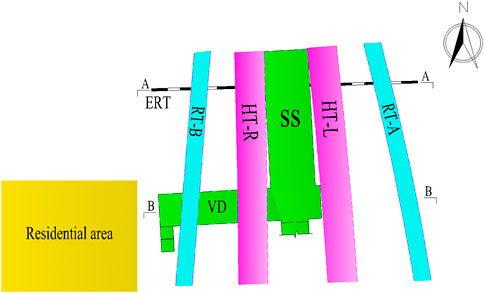
FIGURE 1. Schematic overview of the tunnel complex.
A detailed field study revealed that the vertical geological profile of the tunnel complex: the sandstone and argillaceous sandstone strata are overlaid by miscellaneous fill material with a thickness of approximately 20 m, as can be seen in Table 1.
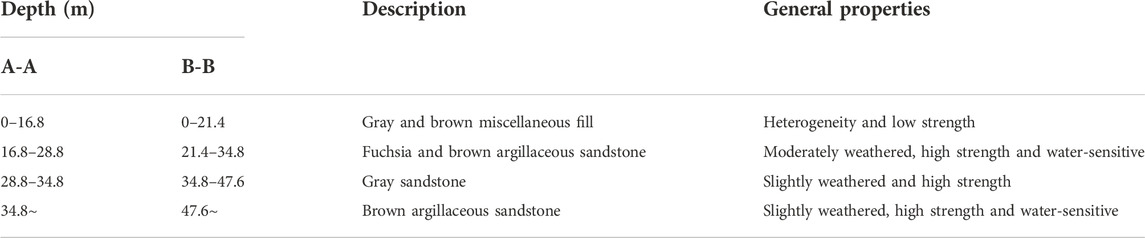
TABLE 1. Geological profile of the ground.
Clearly, due to the complexity of the multiple tunnels, a two-dimensional (2D) model based on the plane strain assumption is incapable of meeting the accuracy requirements of stability analysis. Consequently, in accordance with the actual terrain and engineering design parameters, 3D numerical simulations were performed utilizing finite difference analysis software FLAC3D (Itasca, 2012), which is widely applied in the field of geotechnical engineering.
The numerical simulation makes the following basic assumptions.
1) The tunnel is located in a semi-infinite horizontal laminated medium, with each layer made up of thin layers that extend infinitely in the horizontal direction.
2) Each layer is an isotropic homogeneous medium, and the conditions for coordination of displacements between layers and between subsurface structures and rock layers are satisfied, with no relative slippage or detachment between them.
3) The influence of pore water pressure and sand liquefaction is ignored, and only ground stress under gravity’s action is considered.
In order to minimize the boundary effect, the model dimensions were selected to be 60 m (length)*160 m (width)*50 m (depth). In terms of boundary conditions, the displacements were set to be zero in all three directions with no horizontal and vertical movements allowed at the bottom of the model. The movements in two horizontal directions were restrained, and only vertical movement was permitted on the four side boundaries.
Shotcrete and lining were modeled using shell elements and elastic solid elements respectively. In addition, the rock mass was modeled utilizing elastic-perfectly plastic constitutive elements (based on the Mohr-Coulomb failure criterion) without joint consideration.
The total number of hexahedral elements used for the rock mass was 13, 1642 eight-noded, while 2, 1001 structural elements were used for shotcrete and cladding (Figure 2).
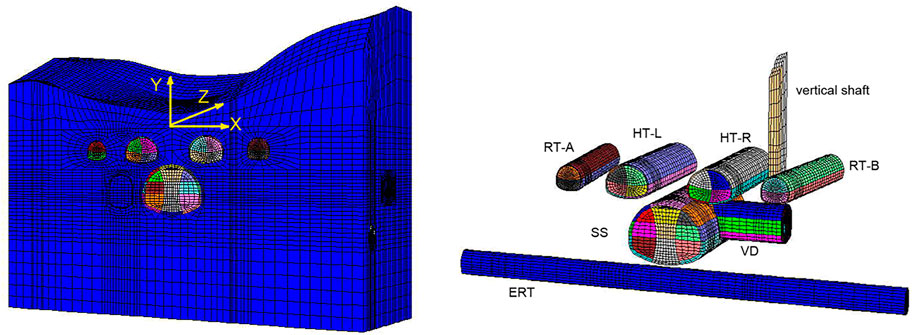
FIGURE 2. Three-dimensional numerical model and positional relationship of the tunnels.
The Z-axis is the tunneling direction, with excavation starting from −Z toward +Z direction. The simulation was carried out in the following excavation sequence:
1) Firstly, the ERT was excavated using bench cut method with its proper lining.
2) Secondly, the SS was excavated using double-wall poilt method followed by the excavation of the VD using bench cut method, and the lining was constructed as soon as the excavations were completed.
3) Thirdly, after the lining strength of the SS and the VD reached the design strength, the HT-L and the HT-R were excavated respectively using bench cut method followed by lining construction.
4) Finally, the RT-A and the RT-B were excavated simultaneously utilizing bench cut method.
For more details regarding these excavation methods can be found in Wang et al. (2010).
To determine the geological conditions, a comprehensive site investigation was carried out by Survey and Design Institute of Chongqing, the major contractor of the project. According to the Code for Design on Highway Tunnel (JTG D70-2004, 2004), the rock mass was classified as Grade IV. The survey also found that the tunnel complex was built at an elevation of 65 m above the water table and that pore water and joint water were both in short supply. Therefore, the influence of water on the rock mass is insignificant. Based on the geotechnical drilling, in situ data and laboratory testing, together with previous experience (Qiu et al., 2010) in the Chongqing region, the relevant calculation parameters of the rock mass, shotcrete and liner design parameters used in this study are given in Table 2. The shotcrete and liner design parameters are listed in Table 3.
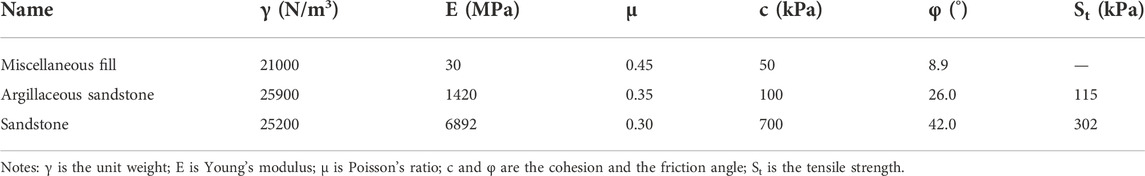
TABLE 2. Calculation parameters of rock mass.
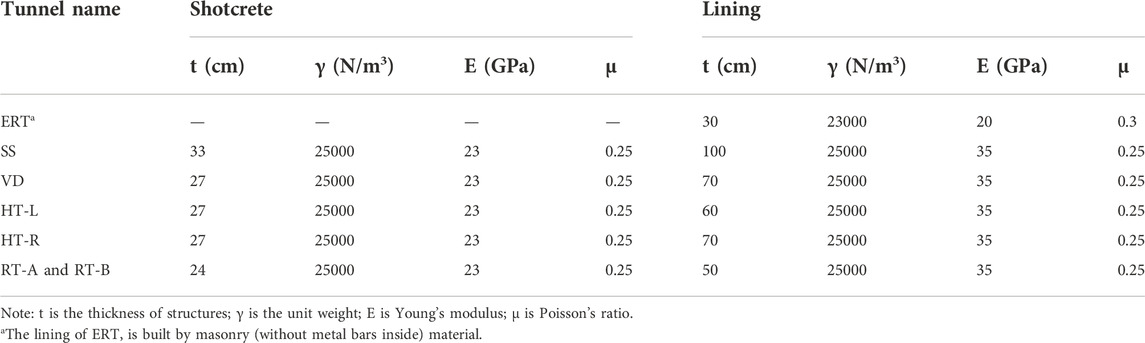
TABLE 3. Calculation parameters of shotcrete and lining.
1) Stress regime before the excavation of the tunnel complex.
Figure 3A,B shows the distribution of maximum and minimum principal stress while Figure 3C provides plots of the deviatoric stress before the tunnel complex is built. Negatives indicate compressive stress whereas positives indicate tensile stress Due to the disturbance induced by excavation of ERT. The influence range of surrounding rock is from ERT vault to 6 m above the vault.
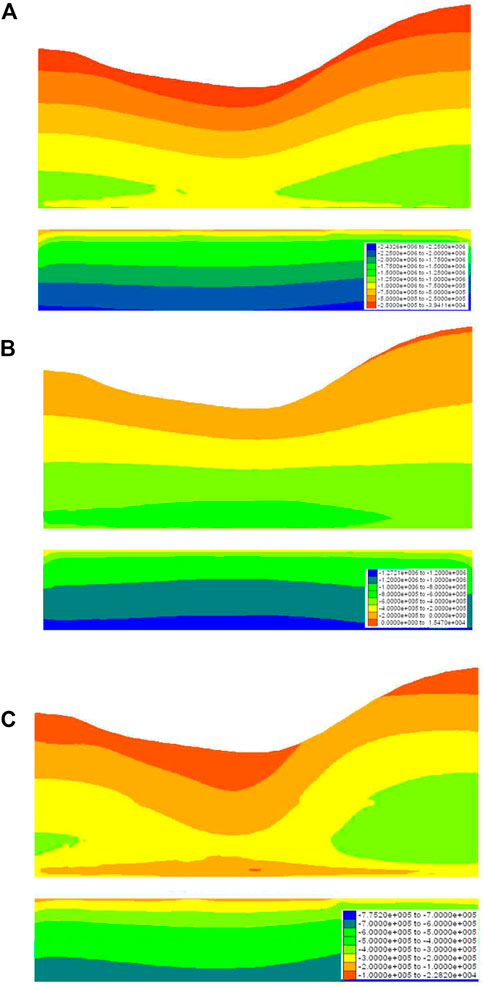
FIGURE 3. The distribution of surrounding mass stress before excavation (negatives indicate compressive stress whereas positives indicate tensile stress). (A) Distribution diagram of the maximum principal stress of A-A cross-section before the excavation of the tunnel complex. (B) Distribution diagram of the minimum principal stress of A-A cross-section before the excavation of the tunnel complex. (C) Distribution diagram of the deviatoric stress of A-A cross-section before the excavation of the tunnel complex.
Cross-section A-A
Figure 4A and Figure 4B illustrate that the rock mass mainly bears compressive stress and Figure 4C shows the plots of deviatoric stress. Tensile stress zones mainly localize the periphery of individual tunnels. The maximum tensile stress is 0.73 Mpa, occurring near the crown of the SS. This tensile stress far exceeds the tensile strength of rock mass (see Table 2), which will bring to cracking and even small-scale collapse of the rock. Figure 4A clearly shows that stress concentrates in two zones after the excavation of multiple tunnels: 1) the rock blocks connecting the SS and the HT-L; 2) the rock blocks connecting the SS and the HT-R. The maximum value in the stress concentration zone is 2.1 MPa.
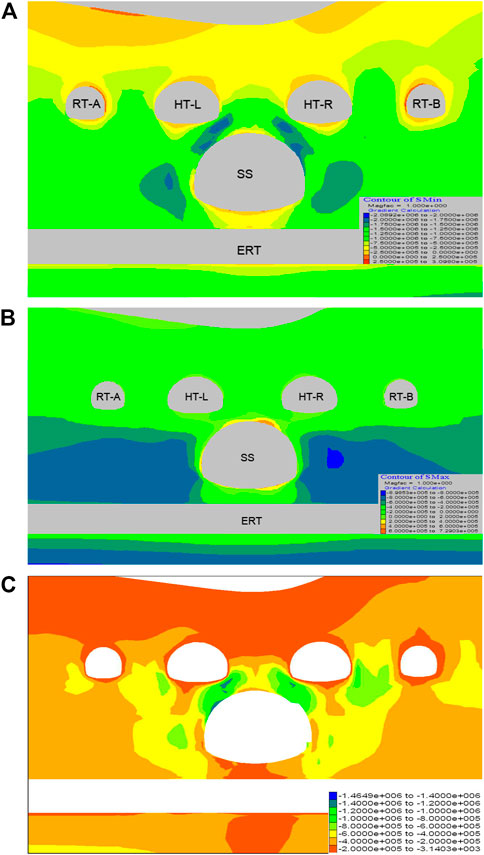
FIGURE 4. The distribution of surrounding mass stress (A-A). (A) Distribution diagram of the maximum principal stress of A-A cross-section. (B) Distribution diagram of the minimum principal stress of A-A cross-section. (C) Distribution diagram of the deviatoric stress of A-A cross-section.
Cross-section B-B.
As shown in Figure 5A,B, the rock mass primarily bears compressive stress and the deviatoric stress plots are shown in Figure 5C. Tensile stress zones only localize the periphery of individual tunnels. The maximum tensile stress is 0.97 Mpa, occurring at the toe of the SS’s left sidewall. This tensile stress far exceeds the tensile strength of rock mass (see Table 2), which will bring to cracking and even small-scale collapse of the rock. Obviously, stress concentrates in the rock blocks connecting the SS and the HT-L after the excavation of multiple tunnels. The maximum value in the stress concentration zone is 2.4 MPa.
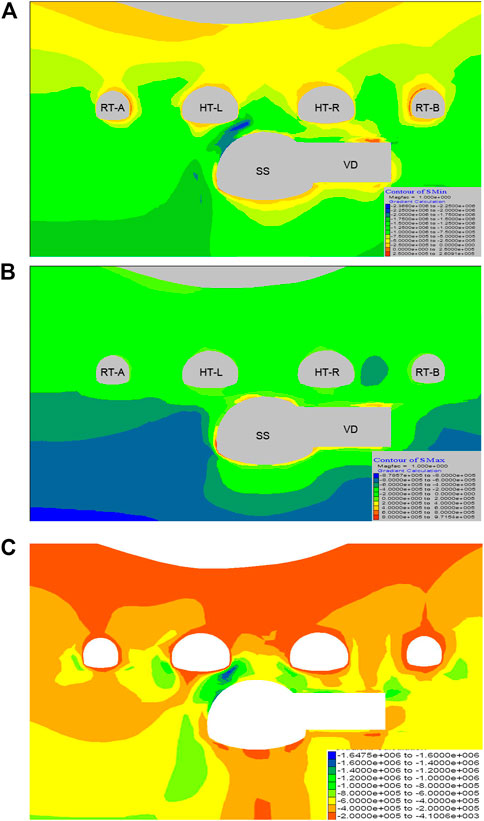
FIGURE 5. The distribution of surrounding mass stress (B-B). (A) Distribution diagram of the maximum principal stress of B-B cross-section. (B) Distribution diagram of the minimum principal stress of B-B cross-section. (C) Distribution diagram of the deviatoric stress of B-B cross-section.
In summary, during the construction of the multiple tunnels, stress concentrates in the rock blocks. This is likely to decrease the strength of the rock mass due to the propagation of discontinuities (such as joints) and ultimately threaten the stability of the tunnel complex. It also should be noted that although the tensile stress exceeds the tensile strength in limited areas and therefore brings cracking of the rock, the area of tensile stress zones is so limited that this would not cause failure of multiple tunnels.
1) As can be seen in Figure 6A, the excavation of the SS and other multiple tunnels located above the ERT results in a significant heave displacement of the ERT. In particular, the scope of -20–20 m is subjected to strong influence and the maximum heave is 11.2 mm (curve ②). This heave is triggered by the load release effect induced by the excavation. In addition, it is worth noting that the heave caused by the excavation of the SS is over 10 mm (curve ①), accounting for 89.3% of the final heave displacement (curve ②). Because the lining of the ERT was constructed using masonry (without metal bars inside) whose tensile strength is low, the heave poses a great threat to the stability of the ERT.
2) According to Figure 6B, the weight of the overlying rock mass causes the crown settlement of the SS after its excavation with the maximum value of 13.3 mm occurring at the coordinate of 28 m along its axial direction (curve ①). Despite the ERT is located directly below the 0–20 m scope of the SS, curve
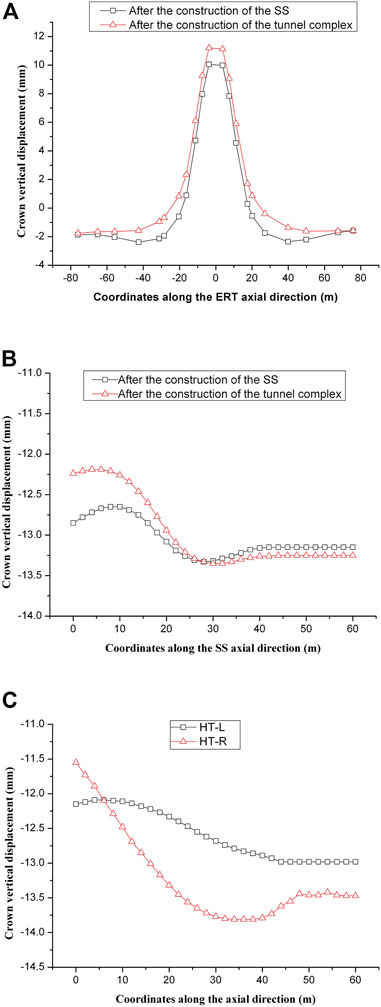
FIGURE 6. Crown displacement of the tunnels. (A) Crown displacement of the ERT along its axial direction. (B) Crown displacement of the SS along its axial direction. (C) Crown displacement of the HT-L and the HT-R along their axial direction.
Curve ② proves that the load release effect induced by the excavation of the multiple tunnels located over the SS leads to a small uplift of the SS (the maximum value is only 0.6 mm). This small heave probably results from the fact that the multiple tunnels are not excavated directly above the SS. Also, the overlying rock mass of the SS is sandstone with high strength, which may contribute to the small heave of the SS.
3) According to Figure 6C, for both the HT-L and the HT-R, the overall crown settlement gradually increases with increasing buried depth along the tunnel axial direction. The maximum settlement values of the HT-L and the HT-R are 13.0mm and 13.8 mm respectively.
Since the VD is excavated directly below the HT-R whereas no excavation is done directly below the HT-L, more remarkable settlements occur in the middle section along the axial direction of the HT-R.
As shown in Figure 7A–C, plastic zones of the rock mass mainly localize in three areas: 1) the rock blocks connecting the SS and the ERT; 2) the rock blocks connecting the SS and the HT-L; 3) the rock blocks connecting the SS and the HT-R. Also, plastic zones near the crown of the HT-L have been developed on the ground surface.
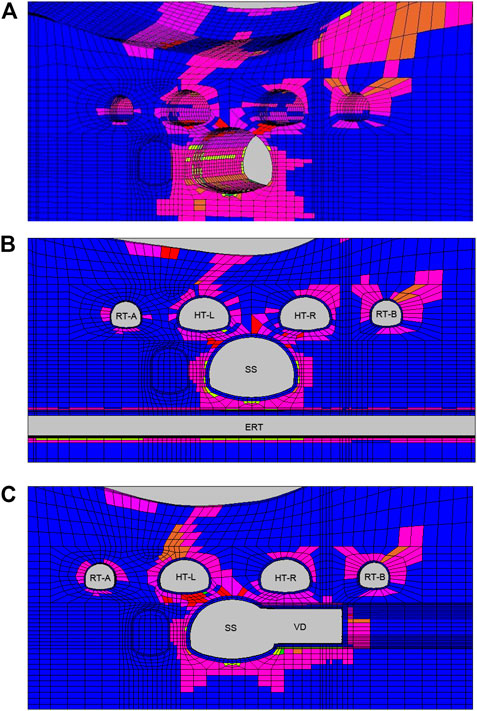
FIGURE 7. The distribution diagram of the plastic zones of the tunnels. (A) The 3D distribution diagram of the plastic zones (tunnel support structures are not shown). (B) The distribution diagram of the plastic zones of the A-A cross-section. (C) The distribution diagram of the plastic zones of the B-B cross-section.
Due to the residual strength, being in plastic states does not necessarily mean strength failure of the rock blocks. Nevertheless, numerical simulation clearly proves that the stability of the rock blocks is the paramount factor for stabilizing the entire tunnel complex.
The three-dimensional numerical simulation shows that the ERT is subjected to significant heave induced by the excavation of multiple tunnels located above it. On the other hand, because the ERT was constructed in the 1970s (now it is out of service) and its lining was built of masonry (without metal bars inside) material with low tensile strength, the heave may cause instability of the ERT. Clearly, this would threaten the stability of the whole tunnel complex. Therefore, given the fact that the ERT is no longer in operation, it is recommended that the affected section of the ERT (−40m–40 m along its axial coordinate) should be sealed up by concrete filling before the excavation of multiple tunnels for the sake of the overall stability. The timing of the seal operation is crucially important. It must allow enough time for the hardening process of concrete.
It has been widely accepted that it is important to make good use of the bearing capacity of the rock mass during tunnel construction. However, in terms of the construction of the tunnel complex, the bearing capacity of the rock mass is severely undermined by multiple openings in the rock mass and hence causing stress concentration in the rock blocks and the shotcrete and lining. As a result, the stability of the rock blocks emerges as the most critical factor for stabilizing of the entire tunnel complex.
In order to gain insight into the failure process of the rock mass and verify the accuracy of the numerical simulation, a scaled model test was conducted in the laboratory.
The test model was made according to the A-A cross-section. For the purpose of simplifying the problem, the test was on the basis of the plane strain assumption and the actual terrain was not considered. Moreover, the influence of the ERT was negligible due to the proposal mentioned earlier (the ERT should be sealed up). Figure 8 shows the test model and cross-sectional dimensions.
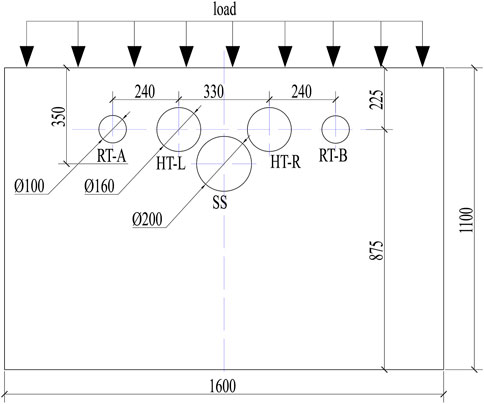
FIGURE 8. Dimensions of the test model. (unit: mm).
The test apparatuses consist of a scaled model (including lining models and the simulated rock mass), a set of loading equipment and micro geotechnical pressure cells.
During the test, the ground load level was gradually increased by a step of 20 kN until the failure of the model. Simultaneously, the failure modes and behavior of the rock mass were carefully observed. Micro geotechnical pressure cells were used to measure the stress on the liner.
The lining models were made of low-pressure polyethylene. A homogeneous material was used to simulate the actual rock mass (argillaceous sandstone), and the stratum characteristic of the actual rock mass was not considered because of the complexity of the simulation test. The simulated rock mass was made of cement, fly ash, gypsum, river sand and water (25.0%, 13.2%, 6.5%, 5.3%, and 50%, by mass percentage).
Material parameters of the prototype were adopted from actual engineering data and their model counterparts are listed in Table 4. During the laboratory test, five groups of parameters were simulated and the similarity ratios (Physical variables with subscript p refer to the prototype, and physical variables with subscript m refer to the model) are:

TABLE 4. Rock mass and lining parameters of the prototype and model.
1) Failure modes
The failure process of the rock mass is shown in Figure 9: initially, the destruction occurred at the spring line of the SS 1) and then the toe of sidewall of the HT-L 2): next, the rock blocks connecting the SS and the HT-L broke; subsequently, the rock blocks connecting the SS and the HT-R damaged 3); eventually, cracks occurred in the area of d and e and they spread into the ground surface. Model failure occurred when the load level reached 200 kN (Figure 11). A detailed description of the failure modes is shown in Figure 10.
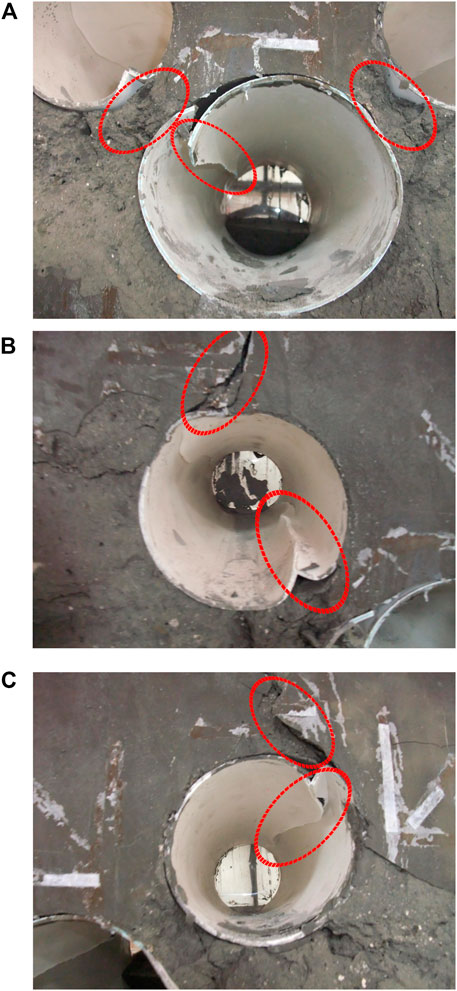
FIGURE 9. Detailed failure modes in the test. (A) Failure modes around the SS. (B) Failure modes around the HT-L. (C) Failure modes around the HT-R.
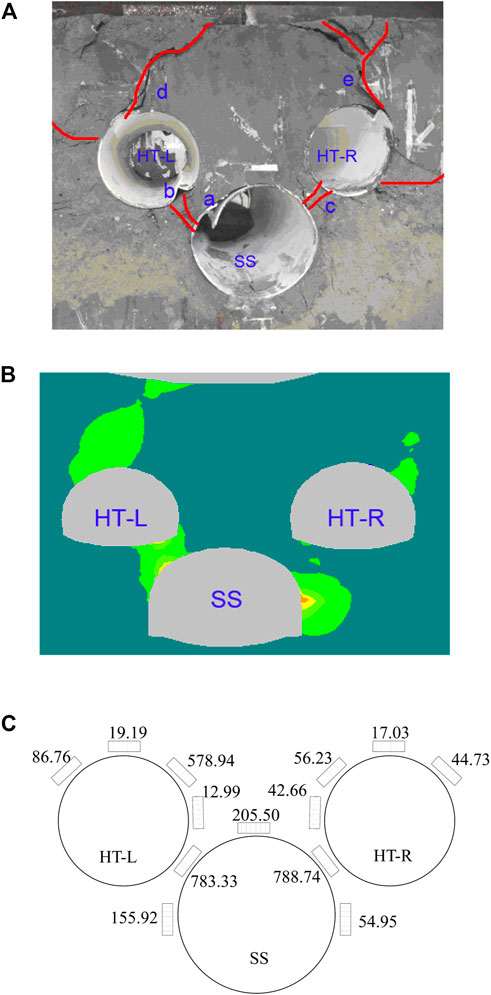
FIGURE 10. Failure zones comparison and Stress distribution on the lining. (A) Failure zones in the test. (B) Failure zones in SRFEM numerical simulation. (C) Pressure distribution on the lining when the rock mass failed. (unit: kPa).
2) Stress distribution on the lining
The failure zones observed in the test were in fairly good agreement with the theoretical failure zones calculated by the strength reduction finite element method (SRFEM), as can be seen from Figure 10A and Figure 10B. The numerical model used in SRFEM is a 2D model and its dimensions and boundary conditions are the same as the 3D model. The parameters of the rock mass are listed in Table 4. Details about the SRFEM can be found in Zheng et al. (2006, 2007).
In terms of the stability of the rock blocks, only the rock blocks connecting the SS and the HT-L (the left rock blocks) damaged in the SRFEM numerical simulation (2D). However, apart from that, the rock blocks connecting the SS and the HT-R (the right rock blocks) also damaged during the test. This discrepancy may be due to the fact that the actual terrain was considered in the SRFEM numerical simulation whereas it was not considered in the model test: the slope of the terrain produced asymmetric rock mass pressure to tunnels whereas the load in the test was nearly symmetric.
Nevertheless, both the test and the SRFEM numerical results showed that the damage of the left rock blocks was more severe compared to the right rock blocks. This is mainly due to the greater thickness of the right rock blocks and hence the greater bearing capacity compared with the left rock blocks.
The pressure exerted on the linings when the rock mass failed can be seen in Figure 10C. Data from the pressure cells SS-2 and SS-4 are 788.74 kPa and 783.33 kPa respectively, which were much greater compared with other pressure cells. This indicates that stress concentrates in the left rock blocks and the right rock blocks. This test result agrees well with the stress distribution in the 3D numerical simulation.
The failure zones of rock blocks damage in the test is basically consistent with the zones of surrounding rock stress concentration in the numerical simulation, and the lining damage pattern is also basically consistent with the lining stress distribution in the numerical simulation, which indicates that the test and numerical simulation results have certain correlation and can provide support for the conclusion.
As an example, consider the left-hand rock blocks (Figure 11A) to explain the failure mechanism of the rock blocks. During the whole process, the Mohr circle at the rock blocks underwent five changes: the first time, after the excavation of the SS, the tangential stress at the rock blocks was released significantly due to stress relief, and the Mohr circle was cut with the strength envelope; the second time, after the completion of the SS construction, the Mohr circle diameter decreased, and it gradually moved away from the strength envelope; the third time, a large concentration of tangential stresses occurred during the excavation of the HT-L, and the diameter of the molar circle increased until it was tangential to the strength envelope; the fourth time, after the support was set in HT-L, the radial stress increased and the diameter of the molar circle became smaller and gradually moved away from the strength envelope; the fifth time, after the excavation of the tunnel complex was completed, the molar circle again gradually moved away from the strength envelope.
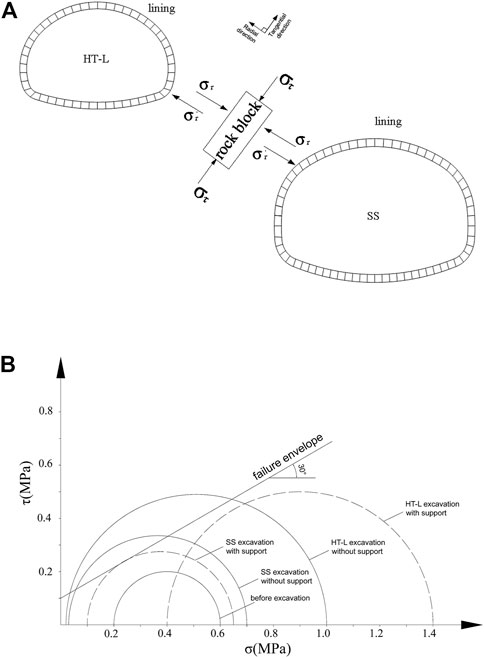
FIGURE 11. Mechanical model and analysis. (A) Rock blocks stress analysis. (B) Rock blocks principal stress analysis using Mohr’s circle.
Clearly, the tangential stress (στ) concentration leads to the radial expansion of the rock blocks due to the Poisson effect. Meanwhile, the tunnel lining provides radial stress (σr), turning the rock blocks into a state of biaxial stress. As the degree of stress concentration increases, the tangential stress increases to a certain level when the lining becomes incapable to provide sufficient radial stress (lining is buckled) to sustain the biaxial stress state. Subsequently, the radial expansion increases sharply as a consequence of the end of biaxial stress state. The state of uniaxial stress produces shear failure of the rock blocks, which ultimately leads to the failure of the multiple tunnels.
The above analyses suggest that providing sufficient radial stress is vitally important for stabilizing rock blocks. This can be demonstrated by plotting the Mohr’s circle diagrams of the principal stresses of the rock blocks.
Based on the plane strain assumption together with ignoring the effect of the ERT and the VD, two cases were calculated using FLAC3D: 1) tunnels without support structures; 2) tunnels with support structures. The principal stress analysis of the left rock blocks is shown in Figure 11B.
Before the excavation of the SS, the Mohr’s circle is below the failure envelope and the rock blocks are stable. At this stage the rock mass has not been disturbed by excavation.
Under the condition of tunnels without lining, the Mohr’s circle is above the failure envelope after the excavation of the SS, which indicates the beginning of rock blocks failure. When the excavation of the HT-L is completed, the radius of the Mohr’s circle increases and hence the Mohr’s circle is above the failure envelope due to the tangential stress concentration. At this stage the rock blocks fail.
As for the tunnels with lining, the Mohr’s circle is on the failure envelope after the excavation of the SS, indicating the state of equilibrium. When the excavation of the HT-L is completed, the radius of the Mohr’s circle increases but the Mohr’s circle moves to the right due to the radial stress provided by lining. Therefore, it is still below the failure envelope: the rock blocks remain stable.
In engineering practice, auxiliary stabilization measures that can provide radial stress (e.g., rock bolts and pre-stressed anchor cables) can improve the stress state of the rock blocks, ensuring the rock blocks are in a state of triaxial stress. It should be noted, however, the number of these measures must be limited in order to avoid excessively weakening the integrity of rock blocks.
This paper presents stability analyses of a large-scale tunnel complex based on a case study in Chongqing, China. The analyses were performed using FLAC3D and compared with a scaled model test in the laboratory. The following conclusions can be drawn from the study:
1) The stability of the surrounding rock analysis and evaluation during tunnel construction is the basis of tunnel construction risk control. For tunnel construction risk control measures, different construction situations require targeted analysis.
2) During the excavation of the multiple tunnels, stress concentrates in the rock blocks and the plastic zones localize in the rock blocks. Because the rock blocks function as the main bearing body and connect the lining of different tunnels to form a bearing system, the stability of the rock blocks is the paramount determinant for stabilizing the entire tunnel complex.
3) The ERT and the SS are subjected to heave displacement due to the excavation of the tunnels located above. Particularly, the ERT is strongly influenced. In order to stabilize the multiple tunnels, it is proposed to seal up the ERT by concrete filling given it is no longer in operation.
4) The stability of rock blocks is the key to control construction risk. Ensuring the rock blocks to be in a state of triaxial stress is conducive to its stability. This can be achieved by applying rock bolts and pre-stressed anchor cables in engineering practice. Radial stress provided by these measures can turn the rock blocks into a state of triaxial stress, thereby enhancing its bearing capacity.
5) Multiple tunnel failure modes were obtained in the scaled model experiments. Despite some limitations in the study, the conclusions still provide important technical guidance to the construction of this tunnel complex. And it can reduce construction risk.
The original contributions presented in the study are included in the article/Supplementary Material, further inquiries can be directed to the corresponding authors.
XG: contributed to conceptualization, methodology, analysis, and writing; CK, DW, and FL: contributed to validation, resources, and funding acquisition; CK and HW: contributed to experiment design, and data collection; FL, ML, and SR: contributed to investigation, supervision, and review editing. All authors have read and agreed to the published version of the manuscript.
This work is supported by the National Natural Science Foundation of China (52108385), and open project of state key laboratory of mechanical behavior and system safety of traffic engineering structures (Grant Nos. KF 2021-08 and KF 2022-08), Natural Science Foundation of Sichuan (2022NSFSC1025).
Authors DW and ML were employed by the company of Chongqing urban constrution investment (group) Co., Ltd.
The remaining authors declare that the research was conducted in the absence of any commercial or financial relationships that could be construed as a potential conflict of interest.
All claims expressed in this article are solely those of the authors and do not necessarily represent those of their affiliated organizations, or those of the publisher, the editors and the reviewers. Any product that may be evaluated in this article, or claim that may be made by its manufacturer, is not guaranteed or endorsed by the publisher.
Barton, Nick (2008). International workshop (TC41) geotechnical infrastructure for mega cities and new capitals. Brazil: Buzios.The main causes of the Pinheiros cavern collapse.
Cao, R. H., Cao, P., Fan, X., Xiong, X., and Lin, H. (2016). An experimental and numerical study on mechanical behavior of ubiquitous-joint brittle rock-like specimens under uniaxial compression. Rock Mech. Rock Eng. 49 (11), 4319–4338. doi:10.1007/s00603-016-1029-6
COI (2005). Report of the Committee of Inquiry into the incident at the MRT circle line worksite that led to collapse of Nicoll Highway on 20 April 2004. Singapore: Ministry of Manpower.
Duan, B. F., and Li, L. (2012). Study of construction technology for subsurface excavation of metro tunnel group in complex environment. Chin. J. Rock Mech. Eng. 31, 2776–2782.
Feng, W. K., Huang, R. Q., and Li, T. (2012). Deformation analysis of a soft-hard rock contact zone surrounding a tunnel. Tunn. Undergr. Space Technol. 32, 190–197. doi:10.1016/j.tust.2012.06.011
Hu, Z., Shen, J., Wang, Y., Guo, T., Liu, Z., and Gao, X. (2021). Cracking characteristics and mechanism of entrance section in asymmetrically-load tunnel with bedded rock mass: A case study of a highway tunnel in southwest China. Eng. Fail. Anal. 122, 105221. doi:10.1016/j.engfailanal.2021.105221
John, A. H., and John, P. H. (2007). Engineering rock mechanics. first ed. Amsterdam: Elservier, 106–107.
JTG D70-2004 (2004). Code for design on highway tunnel. Beijing, China: The Professional Standards Compilation Group of People’s Republic of China.
Kim, S. H. (1996). Model testing and analysis of interactions between tunnels in clay. United States: Department of Engineering Science, University of Oxford.
Kong, C., Gao, X., Cao, L., and Liu, K. (2016). Analysis of the failure of primary support of a deep-buried railway tunnel in silty clay. Eng. Fail. Anal. 66, 259–273. doi:10.1016/j.engfailanal.2016.04.008
Li, M., Yu, H., Jin, H., and Liu, P. (2018). Methodologies of safety risk control for China’s metro construction based on BIM. Saf. Sci. 110, 418–426. doi:10.1016/j.ssci.2018.03.026
Li, T., He, Y., and Fu, X. (2019). Dynamic risk assessment method and application of large deformation of high ground stress tunnel during construction period. J. Eng. Geol. 27 (1), 29–37.
Liang, Y., and Liu, Q. (2022). Early warning and real-time control of construction safety risk of underground engineering based on building information modeling and internet of things. Neural Comput. Applic. 34 (5), 3433–3442. doi:10.1007/s00521-021-05755-8
Liu, H. L., Li, P., and Liu, J. Y. (2011). Numerical investigation of underlying tunnel heave during a new tunnel construction. Tunn. Undergr. Space Technol. 26, 276–283. doi:10.1016/j.tust.2010.10.002
Liu, H. Y., Small, J. C., Carter, J. P., and Williams, D. J. (2009). Effects of tunnelling on existing support systems of perpendicularly crossing tunnels. Comput. Geotechnics 36, 880–894. doi:10.1016/j.compgeo.2009.01.013
Liu, W., Zhao, T., Zhou, W., and Tang, J. (2018). Safety risk factors of metro tunnel construction in China: An integrated study with EFA and SEM. Saf. Sci. 105, 98–113. doi:10.1016/j.ssci.2018.01.009
Pan, Y., Liu, Y., Tyagi, A., Lee, F. H., and Li, D. Q. (2021). Model-independent strength-reduction factor for effect of spatial variability on tunnel with improved soil surrounds. Géotechnique 71 (5), 406–422. doi:10.1680/jgeot.19.p.056
Qian, Q., and Lin, P. (2016). Safety risk management of underground engineering in China: Progress, challenges and strategies. J. Rock Mech. Geotechnical Eng. 8 (4), 423–442. doi:10.1016/j.jrmge.2016.04.001
Qiu, C. Y., Zheng, Y. R., Song, Y. K., Ge, S. M., and Yuan, Y. (2010). Failure pattern study and security analysis of tunnel affected by pile load. Chin. J. Rock Mech. Eng. 29, 3132–3143.
Wang, M. S. (2010). Tunnelling and underground engineering technology in China. Beijing: China Communication Press, 72–97.
Wang, W., Zhang, J., and Li, A. (2022). The application of the strength reduction shortest path method to the stability analysis of shallow buried tunnel. Geotech. Geol. Eng. 40 (3), 1091–1101. doi:10.1007/s10706-021-01944-3
Whittle, A. J. (2006). “Nicoll highway collapse: Evaluation of geotechnical factors affecting design of excavation support system,” in International Conference on Deep Excavation, Singapore, June 28-30.
Xu, Z., Cai, N., Li, X., Xian, M., and Dong, T. (2021). Risk assessment of loess tunnel collapse during construction based on an attribute recognition model. Bull. Eng. Geol. Environ. 80 (8), 6205–6220. doi:10.1007/s10064-021-02300-8
Yu, J., Zhong, D., Ren, B., Tong, D., and Hong, K. (2017). Probabilistic risk analysis of diversion tunnel construction simulation. Computer-Aided Civ. Infrastructure Eng. 32 (9), 748–771. doi:10.1111/mice.12276
Zhang, H., Chen, L., Chen, S., Sun, J., and Yang, J. (2018). The spatiotemporal distribution law of micro seismic events and rockburst characteristics of the deeply buried tunnel group. Energies 11 (12), 3257. doi:10.3390/en11123257
Zhang, L. M., Zheng, Y. R., Wang, Z. Q., and Wang, J. X. (2007). Application of strength reduction finite element method to road tunnels. Rock Soil Mech. 28, 97–101.
Zhao, Y., Shi, Y., and Yang, J. (2021a). Study of the concrete lining cracking affected by adjacent tunnel and oblique bedded rock mass. Iran. J. Sci. Technol. Trans. Civ. Eng. 45 (4), 2853–2860. doi:10.1007/s40996-021-00710-y
Zhao, Y., Wang, Y., Wang, W., Tang, L., Liu, Q., and Cheng, G. (2019). Modeling of rheological fracture behavior of rock cracks subjected to hydraulic pressure and far field stresses. Theor. Appl. Fract. Mech. 101, 59–66. doi:10.1016/j.tafmec.2019.01.026
Zhao, Y., Zhang, C., Wang, Y., and Lin, H. (2021b). Shear-related roughness classification and strength model of natural rock joint based on fuzzy comprehensive evaluation. Int. J. Rock Mech. Min. Sci. 137, 104550. doi:10.1016/j.ijrmms.2020.104550
Zhao, Y., Zhang, L., Wang, W., Liu, Q., Tang, L., and Cheng, G. (2020). Experimental study on shear behavior and a revised shear strength model for infilled rock joints. Int. J. Geomech. 20 (9), 04020141. doi:10.1061/(asce)gm.1943-5622.0001781
Zheng, B. C., Cheng, W. B., and Hu, G. W. (2009). Analysis and monitoring of ground subsidence caused by excavation of adjacent and crossing metro tunnel with shallow-depth and subsurface excavation method. J. Railw. Eng. Soc. 124, 72–76.
Zheng, H., Li, P., and Ma, G. (2021). Stability analysis of the middle soil pillar for asymmetric parallel tunnels by using model testing and numerical simulations. Tunn. Undergr. Space Technol. 108, 103686. doi:10.1016/j.tust.2020.103686
Zheng, H., Li, P., Ma, G., and Zhang, Q. (2022). Experimental investigation of mechanical characteristics for linings of twins tunnels with asymmetric cross-section. Tunn. Undergr. Space Technol. 119, 104209. doi:10.1016/j.tust.2021.104209
Zheng, Y. R., Deng, C. J., and Zhao, S. Y. (2007). Development of finite element limiting analysis method and its applications in geotechnical engineering. Eng. Sci. 5, 10–36.
Zheng, Y. R., Qiu, C. Y., Zhang, H., and Wang, Q. Y. (2008). Exploration of stability analysis method for surrounding rocks of soil tunnel. Chin. J. Rock Mech. Eng. 27, 1968–1980.
Zheng, Y. R., Zhao, S. Y., Deng, C. J., Liu, M. W., Tang, X. S., and Zhang, L. M. (2006). Development of finite element limit analysis method and its applications to geotechnical engineering. Eng. Sci. 12, 39–61.
Keywords: construction risk, tunnel complex, stability, rock blocks, laboratory model test, numerical simulation
Citation: Gao X, Kong C, Wu D, Lu F, Liu M, Wang H and Ren S (2022) Construction risk control technology of a large tunnel complex in urban area. Front. Earth Sci. 10:1079405. doi: 10.3389/feart.2022.1079405
Received: 25 October 2022; Accepted: 21 November 2022;
Published: 20 December 2022.
Edited by:
Chengyi Pu, Central University of Finance and Economics, ChinaReviewed by:
Ben-Guo He, Northeastern University, ChinaCopyright © 2022 Gao, Kong, Wu, Lu, Liu, Wang and Ren. This is an open-access article distributed under the terms of the Creative Commons Attribution License (CC BY). The use, distribution or reproduction in other forums is permitted, provided the original author(s) and the copyright owner(s) are credited and that the original publication in this journal is cited, in accordance with accepted academic practice. No use, distribution or reproduction is permitted which does not comply with these terms.
*Correspondence: Chao Kong, a29uZ2NoYW9rY0Bmb3htYWlsLmNvbQ==; Feng Lu, ZmVuZ2x1MDkwMUBmb3htYWlsLmNvbQ==
Disclaimer: All claims expressed in this article are solely those of the authors and do not necessarily represent those of their affiliated organizations, or those of the publisher, the editors and the reviewers. Any product that may be evaluated in this article or claim that may be made by its manufacturer is not guaranteed or endorsed by the publisher.
Research integrity at Frontiers
Learn more about the work of our research integrity team to safeguard the quality of each article we publish.