Abstract
Ensemble forecast plays a vital role in numerical weather prediction. Hence, effectively extracting useful information from ensemble members to improve precipitation forecasting skills has always been an important issue. Using the ensemble forecast data on precipitation from the ECMWF-GEPS (Global Ensemble Prediction System), we propose a stepwise correction method, based on segmented hierarchical clustering (SHC), for forecast of daily precipitation. This method employs a segmented correction scheme, thereby generating more probabilistic forecast information and improving forecasts. Validations of the SHC method have been performed by comparison with two other methods, namely the ensemble-mean (EM) method and the direct hierarchical clustering (HC) method. Our results showed that deterministic forecast via SHC improved the ability to forecast heavy precipitation in short- and medium-range forecast timeframes. Therefore, SHC performed better than either EM or HC by effectively extending lead time to impending severe rainfall by 2–3 days relative to the other two methods. SHC also demonstrated better performance than the other methods through continuous forecast verification in summer 2021, and even had better effects in the forecast of multiple heavy-precipitation cases, including the Zhengzhou extreme rainfall on 20 July 2021. Overall, the SHC method has great potential for improving ensemble rainfall forecasts in the current operational system.
1 Introduction
Ensemble forecast has long played an indispensable role in numerical weather prediction. Compared with deterministic forecast, ensemble forecast provides a feasible way to complement a single deterministic forecast with an estimate of the probability density function of forecast states (Li and Chen, 2002; Buizza et al., 2005; Zhu, 2005). Currently, the conventional methods of precipitation ensemble forecast include mainly ensemble quantitative precipitation forecast (QPF), frequency-matching method (FMM), multiple statistics fusion technology, rank histogram recalibration, and the probabilistic quantitative precipitation forecast (PQPF) correction technique based on logistic regression (Zhu and Toth, 2005; Stensrud and Yussouf, 2007).
In addition to calculating the ensemble mean (EM) and probability forecast, clustering analysis can be used to classify ensemble members and interpret related multi-group information. Ensemble members with high similarity can be classified into one category to maximize the distance between different categories and minimize the distance within the same category (Yang et al., 2001). There was some progress in ensemble clustering research in the 1990s. For example, the Kohonen self-organizing artificial neural network, the tubing algorithm, and the Ward algorithm were applied in ensemble forecasts for further classification and interpretation (Ecker et al., 1996; Molteni et al., 1996; Atger, 1999). Based on a given ensemble clustering in a specific time window, Ferstl et al. (2016) studied when and where forecast trajectories start to diverge and can be indicated. Wang et al. (2019) showed that the clustered ensemble forecasts using the farthest distance as a matrix could improve precipitation area and intensity forecasts. Based on the Global Ensemble Prediction System in the China Meteorological Administration (CMA-GEPS), Luo et al. (2021) introduced a dynamic discriminant approach into the traditional Ward clustering analysis and found that the major categories of atmospheric circulation have higher deterministic skills than EM. Apart from these, the EM method only considers the average of ensemble members at each spatial point and ignores the continuity of adjacent spatial points; therefore, machine learning can retain information that has been ignored by EM.
Currently, the accuracy of numerical weather forecast of heavy precipitation is not high enough. Forecast skill decreases rapidly with increased forecast lead time and rainfall peaks are often underestimated (Chen, 2006; Shen et al., 2017; Cassola et al., 2015; Nuissier et al., 2012). The frequency matching method (FMM), a common segmented correction tool constructed using observed and historical forecast data, can improve deterministic forecasts of heavy precipitation (Zhu and Luo, 2015).
Furthermore, the stepwise correction method based on statistical regression and projection schemes can effectively improve numerical forecasts (Wang et al., 2020). In addition, Cressman’s stepwise correction (Cressman, 1959) and moving-biweight correction methods have been used to improve the quality of site-based temperature forecast (Xue et al., 2019). Wang et al. (2019) used the stepwise circular-positioning method to improve identification of southwest vortices based on synoptic charts and grid data. Johnson et al. (2011) used a non-traditional object-based threat score (OTS) to quantify the dissimilarity of precipitation forecasts and found that the object-oriented hierarchical-cluster-analysis algorithm performs much better than the traditional hierarchical-cluster-analysis algorithm.
In summary, segmentation correction, stepwise correction, and cluster analysis have their respective application values in correcting precipitation forecasts. Therefore, in this study, we combined all these correction methods by introducing the Isomap algorithm (a machine learning method) and developed a new stepwise correction method based on segmented hierarchical clustering (SHC). We then validated the results of forecast of heavy rainfall. The remainder of this article is organized as follows. In section 2, we describe the data and methods. In section 3, we evaluate the performance of the SHC method on forecast of summer rainfall. In section 4, we further analyze and verify the performance of this method in cases of extreme rainfall. Finally, we include a summary and discussion in section 5.
2 Data and methods
2.1 Datasets
2.1.1 Observational data
The observation data used in our study were from the 0.05°×0.05° grid dataset of daily average precipitation provided by the National Meteorological Information Center of the China Meteorological Administration. The data were interpolated by the thin disk spline method and the three-dimensional geospatial information, and they were derived from two datasets. One is the homogenized precipitation dataset of China’s national surface meteorological stations developed by the National Meteorological Information Center, and the other is a 0.5°×0.5° digital elevation model of China’s land mass produced by resampling from GTOPO30 data (a global digital elevation model with a horizontal grid spacing of 30 arc seconds). The horizon range was (70°E–136°E, 0°N–55°N), and the locations of grid points were consistent with those of the following European Centre for Medium-Range Weather Forecasts-Global Ensemble Prediction System (ECMWF-GEPS) model.
2.1.2 ECMWF-GEPS real-time forecasts
The forecast data from ECMWF-GEPS are the daily precipitation ensemble predictions with the initial forecast time at 12:00 UTC (Universal Time Coordinated). With a horizon resolution of 0.5°×0.5°, it consists of 51 ensemble members, i.e., 50 disturbance forecast members and 1 control forecast member (Mullen and Buizza, 2002). In this study, to fully predict the daily precipitation in JJA (from June to August; summertime), we selected the period from May to August in 2019–2021 as the forecast period and selected the China region (70°E–136°E, 0°N–55°N) as the forecast area. The forecast lead time was from 1 to 10 days.
2.2 Forecasting methods
2.2.1 Hierarchical clustering
The purpose of clustering is to classify similar samples into one group and dissimilar samples into different groups. The sample distance within a group should be as small as possible, while the sample distance between groups should be as large as possible. Referring to the scheme of hierarchical clustering (Johnson, 1967), for a given N samples (or objects) and corresponding N×N distance matrices, the samples are divided into n groups. When the criterion between groups is the sum of squared deviations (or covariance), this clustering method degenerates into Ward clustering. In this study, the complete linkage criterion was used to find the most dissimilar samples (i.e., the farthest distance) from the two groups in the cluster. This part corresponds to the HC process in Figure 1.
FIGURE 1

Flow chart of the SHC method.
2.2.2 Inversion correction method based on the Isomap-mode
In the ensemble forecast, EM is defined as the average value of all the ensemble members at each grid point (or each station), which has been generally used as the most useful deterministic forecast result. However, it only considers the average of the ensemble members at each spatial point and ignores the continuity of adjacent spatial points and the skewness among all ensemble members. Hence, the Isomap algorithm in manifold learning and the mode (or majority number) were used in this study to improve the continuity of spatial points and decrease the skewness of members.
In machine learning, the manifold learning methods mainly focus on non-linear mapping and assume that, in a low dimensional space, data lie on a densely sampled manifold to be unrolled (Sedlmair et al., 2012). Among them, the Isomap algorithm (Tenenbaum, 1997; Balasubramanian and Schwartz, 2002) is non-linear (global), unsupervised, and manifold-based.
The mode denotes the point of central tendency in the statistical distribution, and it is rarely affected by the ensemble extreme value (Hu et al., 2017). Therefore, the central tendency of mapping point(s) on the Isomap low-dimensional field can be obtained via the theoretical mode equation as follows:where is the median of samples. Based on the skewness of samples, the theoretical mode reflects the central tendency of the ensemble members.
The inverse distance weighting (IDW) method is used to inverse the mapping field of central tendency, which is the Isomap-mode field (IM) and defined as follows:where m represents the mth ensemble member; W and F are the weights and fields of ensemble members, respectively; d denotes the Euclidean distance between the low-dimensional point of each member and the central tendency of all members. This part corresponds to the Isomap-mode process in Figure 1.
2.2.3 Stepwise correction based on segmented hierarchical clustering
In the clustering scheme, the data can be normalized to the unit range [0, 1] to have the same order of magnitude, which can improve the rationality of clustering and reduce the disturbance of extreme values.
Moreover, a subspace clustering method can be used to carry out data segmentation, and stepwise clustering can be used to obtain a more accurate result (Zhang et al., 2004; Zhou et al., 2006). Hence, in this study, daily precipitation was divided into 6 subspaces (0–0.1, 0.1–10, 10–25, 25–50, 50–100, and above 100; unit: mm) corresponding to the precipitation categories: below light rain, light rain, moderate rain, heavy rain, rainstorm, and heavy rainstorm, respectively.
In the subspace of [, ), for an arbitrary point in the precipitation Field(x), the segmented-transformed function Tfun(x) is as follows:where is the binarization function. For the subspace of [, ), the upper limit of the threshold interval is used as a binary segmentation as follows:
For the subspace above the magnitude of rainstorm, the rainstorm characteristics of the original variables can be well-demonstrated after clustering as follows:
Meanwhile, for any correction interval threshold of the subspace [, ), the retention formula of uncorrected spatial point (x) is as follows:
The SHC procedure was as follows. For each ensemble member, the grades of the daily accumulated precipitation were transferred to the binarization field via Eqs 5, 6 and to the Tfun(x) via Eq. 4. Then, the group with the largest proportion was obtained via HC (with 2 clusters) (Luo et al., 2021). Trend_Field was calculated by the retained members via the Isomap-mode (see Inversion correction method based on the Isomap-mode), and its value was used in Eq. 7. Finally, the above correction process was repeated, in order, for different precipitation grades. The parts above correspond to the binary and corrected processes in Figure 1.
In the SHC method, binary clustering can better characterize and improve probability forecast information from ensemble members. Additionally, the relationship between ensemble members can be represented by the Isomap method, and the deterministic forecast can be obtained by extracting sufficient probabilistic information from ensemble forecasts.
2.2.4 Comparison of parallel tests
To better evaluate the prediction skills of the SHC method, a set of parallel tests were designed to demonstrate the advantages of the SHC method. In parallel tests, direct HC with the original ensemble forecast was adopted. The EM of the group with the largest proportion in HC was then taken as the final result.
2.3 Validation methods
When evaluating ensemble deterministic forecasts, Threat Score (TS) and Equitable Threat Score (ETS) are commonly used indexes to evaluate precipitation forecasts (Mesinger, 2008; Liu et al., 2021). In this study, they were also adopted to compare the performance of the EM, HC, and SHC methods. Thresholds of 25 mm, 50 mm, and 100 mm were selected to focus on forecasts of heavy rainfall.
2.3.1 Threat score
For a given threshold, TS is defined as follows:where , , and represent the number of successful forecasts, missed forecasts, and false forecasts, respectively. TS ranges from 0 to 1, and the larger TS the better the prediction.
2.3.2 Equitable Threat Score
As an improvement based on TS, ETS penalizes false and missed forecasts and better reflects deterministic forecasts. It is expressed as follows:where represents the number of times that neither forecast nor observation reaches the threshold, and is the mathematical expectation of stochastic forecast () when the number of false forecasts equals the number of missed forecasts. Hence, if both results have higher TS and ETS, it indicates better forecast performance that is not due to false and missed forecasts.
2.3.3 The increment and growth rate of scores
The advantages and disadvantages of different methods can be quantitatively determined by the increment and growth rate of TS or ETS. The latter can also be used to express the effects of improvement due to use of SHC compared to the EM method. Expression of increment and growth rate are as follows:
3 Evaluation of the SHC method in forecast of summer rainfall
3.1 Comparisons of precipitation forecast skills
3.1.1 Evaluation of the forecasts at different lead times
In general, at the same lead time, both TS and ETS decreased as the precipitation threshold increased. Hence, the histograms of TS/ETS are sequentially overlapping in Figure 2. As shown in Figure 2, both TS and ETS decreased with increased lead time due to initial signal loss and model errors. At the same lead time, compared with EM, the HC method had slightly higher scores, but the TS was smaller at the 25 mm threshold. This indicates that the HC method brings some limited or negative corrections to precipitation forecast. In contrast, the SHC method showed stably improved forecasts with higher TS/ETS relative to EM and HC for the thresholds of 25 mm, 50 mm, and 100 mm. Therefore, compared with the HC and EM methods, based on probability information, the SHC method extracted useful signals from ensemble forecast members more effectively, resulting in remarkably improved heavy precipitation forecasts, which are generally underestimated in ensemble forecasts.
FIGURE 2
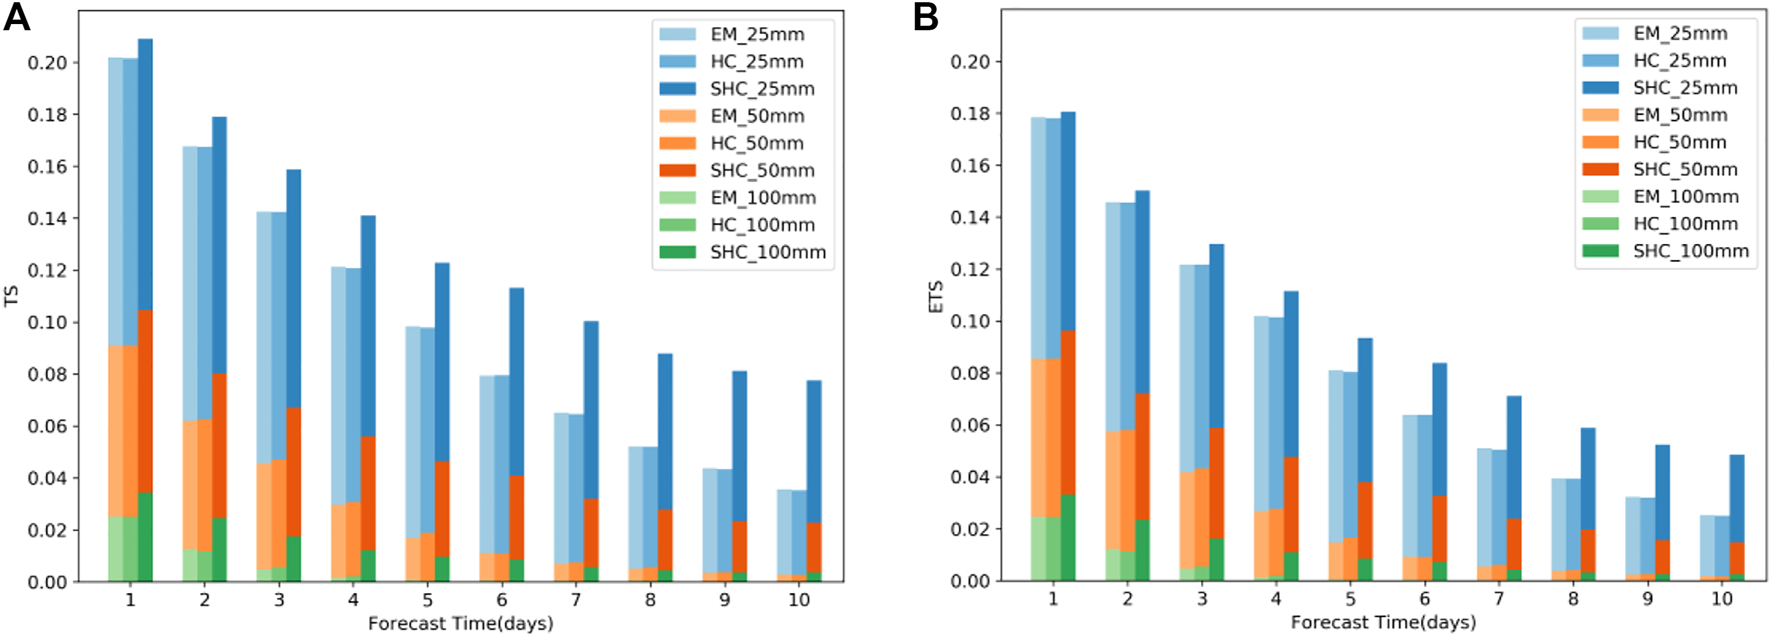
(A) TS and (B) ETS of the different (correction) forecast methods used in prediction of daily precipitation in summer from 2019 to 2021; blue, orange, and green denote 25 mm, 50 mm, and 100 mm, respectively; EM, HC, and SHC are denoted as colors from shallow to deep.
As has been reported, ETS removes the contribution from the hits by chance in random forecasts, and thus has merit in offsetting false gain by overestimation in TS (Hung et al., 2020). In our case, the ETSs of the EM, HC, and SHC methods were all lower than the TSs, which indicate that all three methods were overfitting. However, the ETSs (Figure 2B) suggest the same conclusions as the TSs. These data indicate that the SHC method is still better than the EM and HC methods and provides better precipitation forecasts.
The forecast of precipitation above 25 mm is important for debris-flow forecast. There were obvious differences in the 25-mm-threshold TS among the EM, HC, and SHC methods (Table 1). The increments of TS were less than 0 for HC, reflecting a negative effect and indicating that HC is unsuitable for correcting forecasts of heavy rainfall. In contrast, using the stepwise correction and probability-forecast information, the SHC method had a much higher TS than the EM method at all lead times. More specifically, its corresponding growth rates increased rapidly with increased forecast lead time. These results indicate that the SHC method can effectively capture magnitude information that either EM or HC fails to capture, thus greatly improving precipitation forecasts, particularly at longer lead times. Although ensemble forecasts diverge gradually with increased forecast time, the SHC method can effectively reintegrate the information of ensemble members and obtain better deterministic forecasts.
TABLE 1
| Lead days | EM | HC | SHC | Diff_HC | Rate_HC (%) | Diff_SHC | Rate_SHC (%) |
|---|---|---|---|---|---|---|---|
| 1 | 0.202 | 0.202 | 0.209 | 0.000 | −0.2 | 0.007 | 3.5 |
| 2 | 0.168 | 0.168 | 0.179 | 0.000 | −0.1 | 0.011 | 6.7 |
| 3 | 0.143 | 0.142 | 0.159 | 0.000 | −0.1 | 0.016 | 11.3 |
| 4 | 0.121 | 0.121 | 0.141 | −0.001 | −0.5 | 0.020 | 16.3 |
| 5 | 0.098 | 0.098 | 0.123 | −0.001 | −0.7 | 0.024 | 24.8 |
| 6 | 0.079 | 0.080 | 0.113 | 0.000 | 0.1 | 0.034 | 42.6 |
| 7 | 0.065 | 0.065 | 0.100 | −0.001 | −1.0 | 0.035 | 54.1 |
| 8 | 0.052 | 0.052 | 0.088 | 0.000 | −0.1 | 0.036 | 68.7 |
| 9 | 0.044 | 0.043 | 0.081 | 0.000 | −0.7 | 0.038 | 85.9 |
| 10 | 0.036 | 0.035 | 0.078 | 0.000 | −1.1 | 0.042 | 117.5 |
TS, its increment (Diff_HC and Diff_SHC), and its growth rate related to 25 mm precipitation using EM, HC, and SHC to analyze data from summer 2019 to 2021.
Additionally, the average TS of the EM method was 0.078 at the 6-day lead time, while that of the SHC reached 0.079 at the 10-day lead time, indicating that the SHC method was able to provide the same forecast performance 4 days earlier than the EM method. Similar conclusions were reached based on ETS data (Table 2). The SHC method provided the same skilled forecast at the 10-day lead time as the EM method at the 7–8-day lead time. These data demonstrate that the SHC method provides effective precipitation forecasts earlier.
TABLE 2
| Lead days | EM | HC | SHC | Diff_HC | Rate_HC (%) | Diff_SHC | Rate_SHC (%) |
|---|---|---|---|---|---|---|---|
| 1 | 0.178 | 0.178 | 0.181 | 0.000 | −0.2 | 0.002 | 1.2 |
| 2 | 0.146 | 0.146 | 0.150 | 0.000 | −0.2 | 0.004 | 3.1 |
| 3 | 0.122 | 0.122 | 0.130 | 0.000 | −0.1 | 0.008 | 6.5 |
| 4 | 0.102 | 0.101 | 0.112 | −0.001 | −0.5 | 0.010 | 9.4 |
| 5 | 0.081 | 0.080 | 0.093 | −0.001 | −0.8 | 0.012 | 15.3 |
| 6 | 0.064 | 0.064 | 0.084 | 0.000 | 0.1 | 0.020 | 31.3 |
| 7 | 0.051 | 0.050 | 0.071 | −0.001 | −1.1 | 0.020 | 39.4 |
| 8 | 0.039 | 0.039 | 0.059 | 0.000 | −0.2 | 0.020 | 49.5 |
| 9 | 0.032 | 0.032 | 0.052 | 0.000 | −1.0 | 0.020 | 61.8 |
| 10 | 0.025 | 0.025 | 0.048 | 0.000 | −1.4 | 0.023 | 91.3 |
Same as Table 1, but for ETS.
The forecast of heavy rainstorms (daily precipitation greater than 100 mm) is one of the most difficult issues in numerical weather prediction. Its predictability is usually lower than that of heavy rainfall due to the limitations in the model and the errors of initial values. As shown in Tables 3, 4, the skill growth rates of HC were all negative for both TS and ETS, except at the lead time of 3–4 days, which indicates that the correction of HC is unstable. Therefore, HC is only useful for limited-range weather forecasting because HC can neither provide better results effectively when ensemble members are too convergent at initial lead times, nor extract information from the members with a too large spread in medium-range weather forecast. In contrast, the SHC method showed improvement in both TS and ETS at all lead times. The TS/ETS increments of the SHC method were 10 times larger than that of the EM method at the 5-day lead time, demonstrating that the SHC method captured information even during the poor-performing period of the EM method. To a certain extent, the SHC method successfully captured rainstorm and heavy rainstorm information for all lead times, and, remarkably, had improved forecast performance even for extreme heavy rainstorms. Furthermore, as with the 25-mm-threshold forecast, the SHC method also demonstrated the same performance (0.097×10⁻¹) at the 5-day lead time as the EM method at the 2–3-day lead time. Again, these data demonstrate that the correction of SHC leads to effective extraction and utilization of useful information from ensemble members.
TABLE 3
| Lead days | EM | HC | SHC | Diff_HC | Rate_HC (%) | Diff_SHC | Rate_SHC (%) |
|---|---|---|---|---|---|---|---|
| 1 | 0.252 | 0.251 | 0.344 | −0.002 | −0.6 | 0.092 | 36.3 |
| 2 | 0.126 | 0.116 | 0.247 | −0.010 | −7.6 | 0.121 | 96.7 |
| 3 | 0.048 | 0.057 | 0.175 | 0.008 | 17.4 | 0.127 | 263.1 |
| 4 | 0.015 | 0.021 | 0.122 | 0.006 | 36.7 | 0.107 | 712.7 |
| 5 | 0.008 | 0.005 | 0.097 | −0.003 | −34.7 | 0.090 | 1193.3 |
| 6 | 0.006 | 0.003 | 0.085 | −0.002 | −38.2 | 0.080 | 1450.9 |
| 7 | 0.004 | 0.003 | 0.056 | −0.002 | −36.6 | 0.052 | 1270.7 |
Same as Table 1, but for TS related to 100 mm precipitation (order of magnitude: 10−1).
TABLE 4
| Lead days | EM | HC | SHC | Diff_HC | Rate_HC (%) | Diff_SHC | Rate_SHC (%) |
|---|---|---|---|---|---|---|---|
| 1 | 0.247 | 0.245 | 0.331 | −0.001 | −0.6 | 0.085 | 34.4 |
| 2 | 0.122 | 0.113 | 0.235 | −0.010 | −7.9 | 0.113 | 92.1 |
| 3 | 0.046 | 0.054 | 0.162 | 0.008 | 17.6 | 0.116 | 252.4 |
| 4 | 0.014 | 0.019 | 0.109 | 0.005 | 40.0 | 0.095 | 706.7 |
| 5 | 0.006 | 0.004 | 0.084 | −0.003 | −41.3 | 0.078 | 1234.9 |
| 6 | 0.004 | 0.002 | 0.072 | −0.002 | -47.7 | 0.068 | 1543.2 |
| 7 | 0.003 | 0.002 | 0.044 | −0.002 | -48.4 | 0.041 | 1312.9 |
Same as Table 1, but for ETS related to 100 mm precipitation (order of magnitude: 10−1).
3.1.2 Comprehensive evaluation of real-time forecasts in 2021
We further evaluated the performance of three methods (EM, HC, and SHC) in predicting weather for summer 2021. In this sub-section, only TS was used for evaluation because the increasing rate of ETS may be abnormal when values are negative.
The daily time series of TS for 25-mm-threshold forecasts (Figure 3) demonstrates that the TS of the HC method oscillated around that of the EM method, while the SHC method had the highest TS series overall, except in a few cases. The TS growth rate of the SHC method increased greatly with forecast lead time, indicating that the performance of the SHC method is more stable than that of the EM method (the TS of the EM method decreased rapidly with increased lead time). The SHC method corrects the model forecasts by extracting information from divergent ensemble members at different lead times, which is more apparent at longer lead times when the spread of the ensemble becomes larger. The best correction capacity of the SHC method tended to occur at 3–5-day lead times., and similar results were found for the 50-mm-threshold TS series (data not shown).
FIGURE 3

Time series of TS and its growth rate related to 25 mm precipitation with lead time of 1(A), 3(B), 5(C), and 7(D) days in summer 2021; green, orange, and blue lines denote EM, HC, and SHC, respectively, corresponding to the left axis; the grey bars denote the SHC growth rate compared with EM, corresponding to the right axis.
The TS series of 100-mm-threshold forecasts are shown in Figure 4. In addition to the conclusions summarized above, Figure 4 demonstrates the advantages of the SHC method for heavy rainstorm forecast. At the lead time of 1–3 days, the SHC method showed a relatively higher TS and was effective, even if the EM method failed to predict a heavy rainstorm. Especially with longer than a 5-day lead time, the TS of both the EM and HC methods became 0, completely unskilled, while the SHC method still provided skilled precipitation forecasts. In summary, these data demonstrate that, even for heavy rainstorms, the SHC method can improve the short-range (1–3 days) forecasts and even medium-range (4–7 days) forecasts that are not achievable with the EM and HC methods.
FIGURE 4

Time series of TS related to 100 mm precipitation with lead time of 1 (A), 3 (B), 5 (C), and 7 (D) days in summer 2021; green, orange, and blue lines denote EM, HC, and SHC, respectively.
4 Verification and analysis for cases of extreme rainfall
In this study, we have proposed a new method of SHC to elevate the skill of severe rainfall forecasting. To illustrate the advantages of the SHC method, direct application using data from typical cases of severe weather events was needed. Specific cases of extreme weather were selected due to status as well-known instances of severe rainfall with typical features that occurred over Eastern China during the period of data availability.
4.1 Forecasts of the Zhengzhou “7.20” extreme heavy rainstorm event
The rainstorm that occurred from 18–22 July 2021 was the heaviest rainfall event in Zhengzhou. The daily precipitation at eight national meteorological stations broke historical records for extreme weather. During the event, a typhoon near the southern coast of China and the subtropical high provided sufficient water vapor to inland areas (Wei et al., 2022). The heaviest precipitation occurred from 20–22 July 2021, so we evaluated forecasting results of the three methods based on data available for use in forecasting the weather for these days.
As shown by observations of precipitation on 20 July 2021 (Figure 5A), two obvious heavy rainfall areas, with daily rainfall greater than 250 mm, were centered in Zhengzhou of Henan Province and in the coastal area near Yangjiang of Guangdong Province. Over the northwestern Pacific, the rainband was accompanied by the typhoon. Afterward, the Zhengzhou rainband gradually moved northward and weakened; the Yangjiang rainband also weakened and gradually moved westward (Figures 5E, I).
FIGURE 5
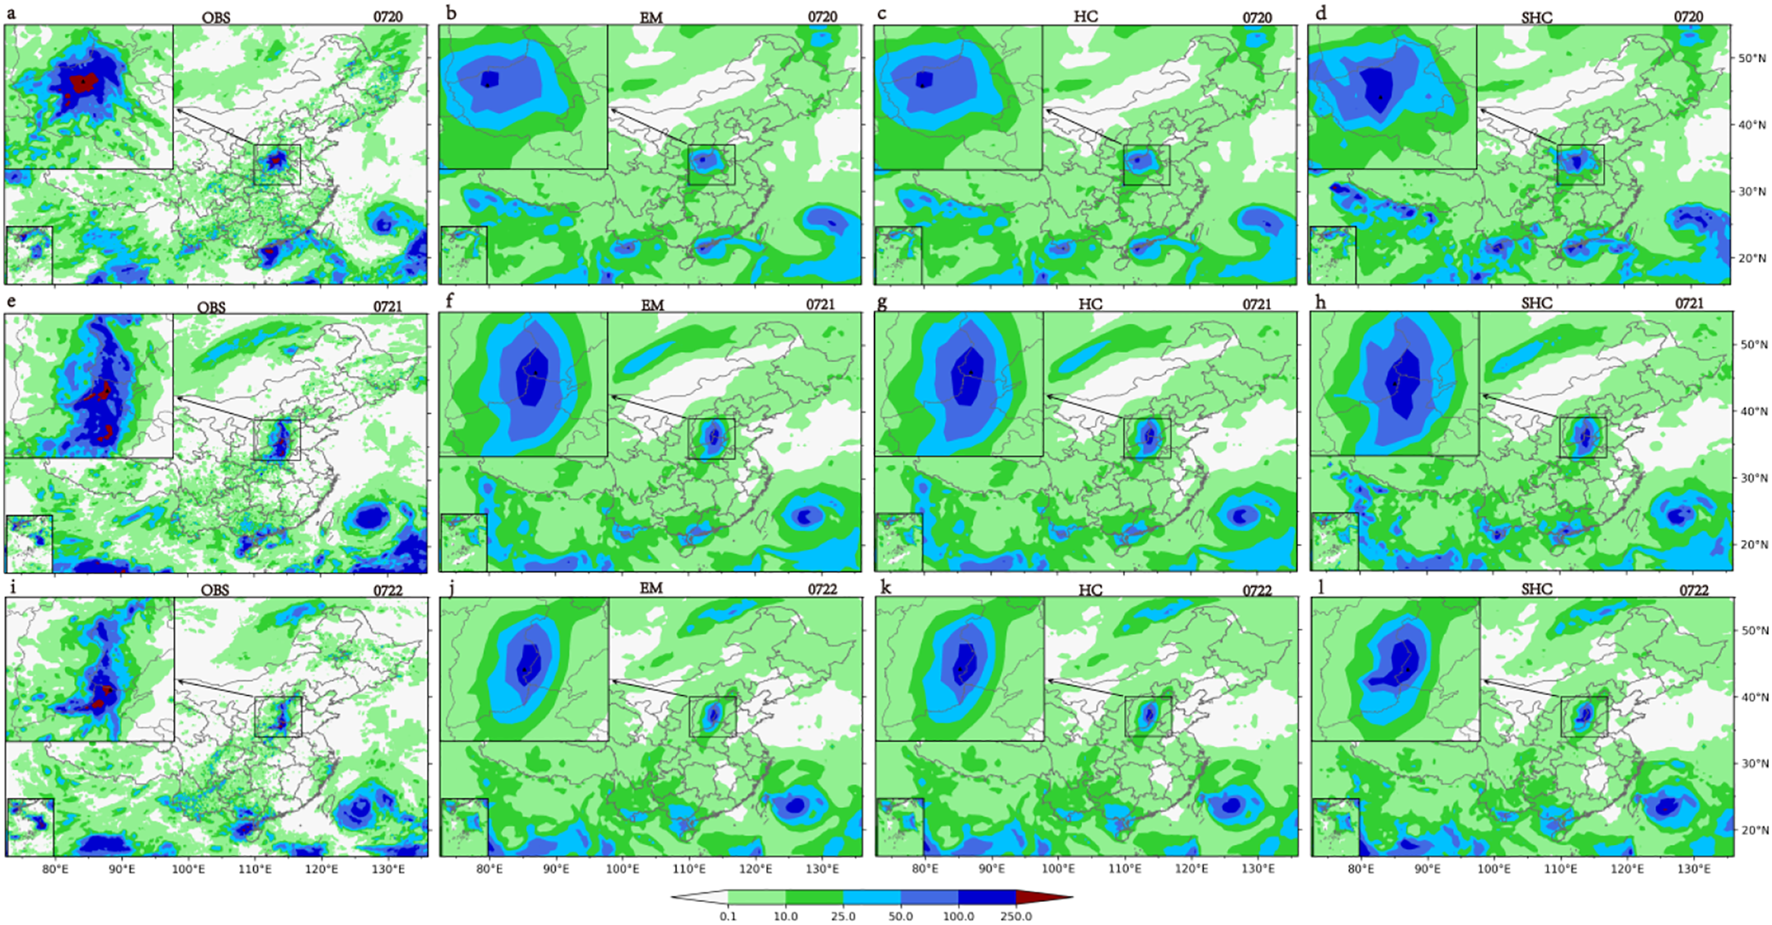
Daily cumulative precipitation predicted by the different methods at 1-day lead time. Observed precipitation from 20–22 July 2021 (A, E, I); predictions for each day, respectively (B–D, F–H, J–L); the black triangle is the grid point of max precipitation in the subplot.
The HC-correction forecasts (Figures 5C, G, K) did result in an evident improvement compared to the EM forecasts, and the latter was greatly weakened, with small precipitation amplitude (Figures 5B, F, I). It was difficult to extract information and correct forecasts using the HC method because the ensemble members were highly consistent at 1-day lead time (see Tables 1–4). The obvious differences between the SHC and HC methods for this “7.20” event were reflected in the magnitude and center location of maximum precipitation (Figures 5D, H, L). As a deterministic precipitation forecast in GEPS, EM had obvious damping effects on the precipitation amplitude, which was chiefly responsible for the missing forecasts of heavy precipitation and false forecasts of weak precipitation. Therefore, the maximum precipitation and its location was used to quantitatively evaluate the performances of different methods (Tables 5, 6).
TABLE 5
| 0720 | 0721 | 0722 | ||||
|---|---|---|---|---|---|---|
| Location | Distance (°) | Location | Distance (°) | Location | Distance (°) | |
| Obs | 34.65°N | 35.80°N | 36.15°N | |||
| 113.25°E | 114.25°E | 114.35°E | ||||
| EM | 34.50°N | 1.26 | 36.50°N | 0.74 | 37.00°N | 1.20 |
| 112.00°E | 114.00°E | 113.50°E | ||||
| SHC | 34.00°N | 0.70 | 36.00°N | 0.78 | 37.00°N | 0.92 |
| 113.00°E | 113.50°E | 114.00°E | ||||
Locations of maximum precipitation and their differences in distance when comparing data from SHC (or EM) and observation in subplot (see Figure 5).
TABLE 6
| 0720 | 0721 | 0722 | |
|---|---|---|---|
| Obs | 548.4 | 424.2 | 399.6 |
| EM (Max) | 113.0 (326.7) | 165.4 (345.4) | 147.1 (332.3) |
| SHC | 174.2 | 228.4 | 238.3 |
Maximum precipitation amounts (mm) predicted by the different methods and obtained via observation in subplot (see Figure 5).
On the first day (20 July, Figures 5A–D), EM gave a precipitation center more westward than the observation and could not accurately predict the rainfall area. However, the SHC method made a substantial correction. The precipitation center was shifted eastward in the forecast provided by SHC (Figure 5D) and was more consistent with the observation. Quantitatively, the bias of precipitation center was greatly reduced using SHC, from 1.26° (EM) to 0.7° (SHC), which is about 60 km, indicating that the SHC method can effectively correct the rainfall location, to a certain extent, at 1-day lead time. On the second day (21 July, Figures 5E–H), the SHC method captured similar information compared with the EM method, but predicted a slightly increased rainfall magnitude. On the last day (22 July, Figures 5I–L), the precipitation distribution pattern was better predicted by the SHC method, although the indicated center location was more northward than the observation. Interestingly, from observation, there was an extra east-west rainband located to the south of the main south-north rainband, which was also predicted by the SHC corrected forecast (Table 5).
Based on maximum precipitation forecast using the different methods (Table 6), EM provided forecasts that were underestimations relative to observation. The effective correction of the rainfall forecast by the SHC method reached 60 mm–90 mm, and the corrected forecasts were closer to the observations. In addition, the maximum precipitation of all members still did not reach the observed amplitude, limiting the upper boundary of both the EM and SHC methods.
4.2 Forecasts of two rainfall cases in 2020
To better verify the SHC method, two additional rainfall events in 2020 were analyzed. One was the large-scale heavy rainstorm that occurred in Jiangsu Province on 22 July 2020, which had an east-west rain belt (Figure 6A). The other was the heavy rainfall that occurred in North and Northeast China on 12–13 August 2020, which had a north-south rainband and a southwest-northeast rainband (Figures 6D, G).
FIGURE 6
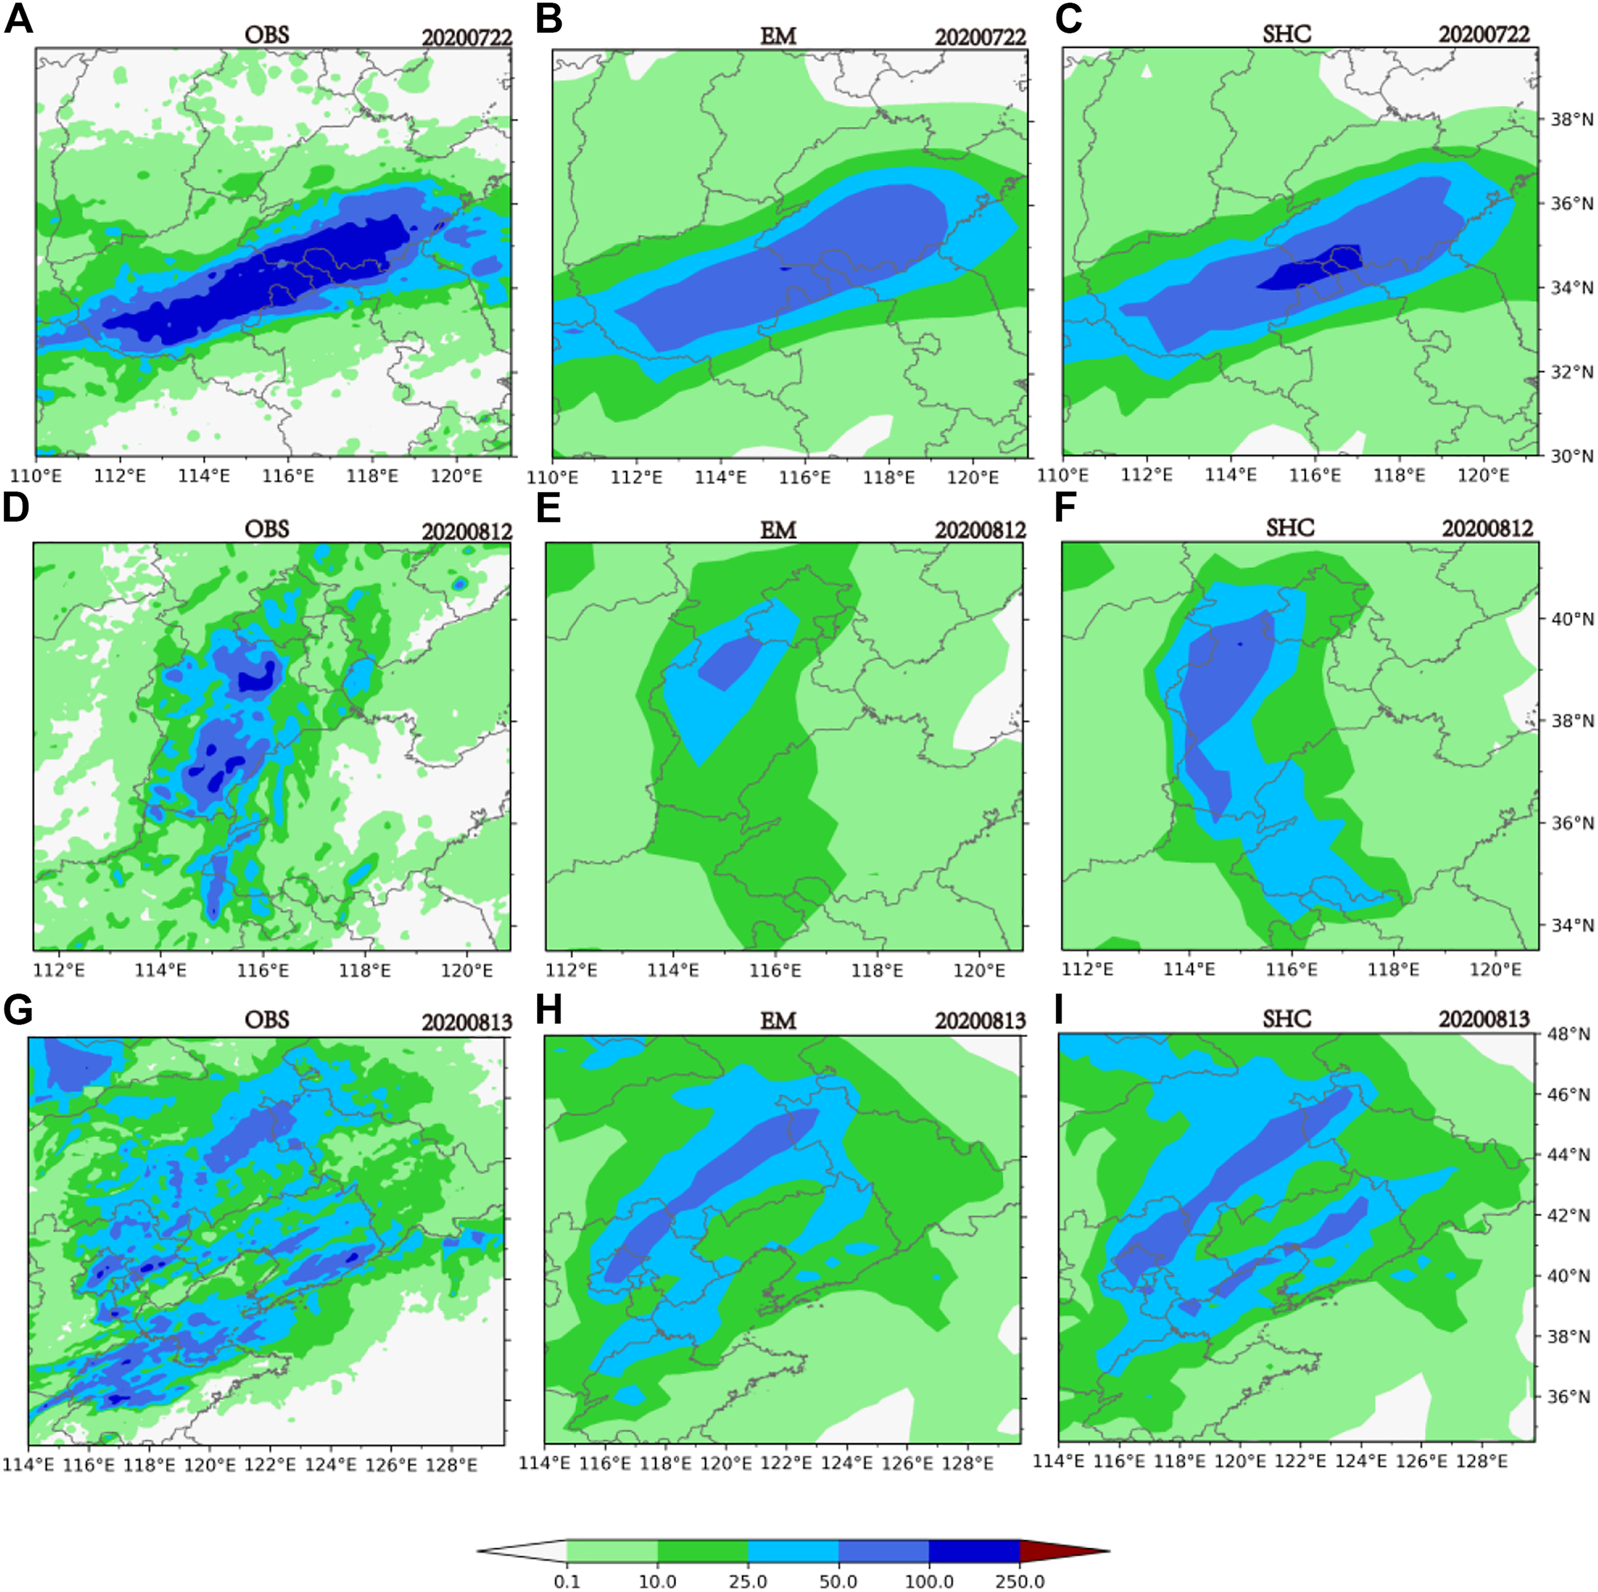
Daily cumulative precipitation predicted by the different methods at 1-day lead time. Observed precipitation for 22 July 2020 (A–C) and 12–13 August 2020 (D–I).
As shown in Figures 6A–C, although the area of rainstorm (50–100 mm) was well-demonstrated by the EM method, the heavy storm (>100 mm) on 22 July 2020 was barely captured using EM. In contrast, the SHC method provided a better forecast of rainfall intensity. In the case of the storm on 12 August 2020, the EM forecast presented a precipitation center at 39°N, but the magnitude of the rainband was not large enough. The SHC correction greatly increased the overall magnitude of the rainband and the area predicted to receive precipitation of 25 to 100 mm corresponded well with observation data (Figures 6E, F). In addition, another rainband in the south was better captured by the SHC method.
The SHC method generally increased the predicted precipitation intensity through utilizing ensemble probability forecast information, and had remarkably effective corrections for extreme precipitation; e.g., for the area with precipitation over 100 mm in the 22 July 2020 case and for the area with precipitation of 25–100 mm in the 12 August 2020 case. For the forecasts of multiple rainbands, such as in the case on 13 August 2020, the SHC method provided better indication of different rainbands by increasing rainfall intensity (Figures 6H, I).
Overall, the SHC method presented more detailed precipitation distributions that were closer to the observations compared to the EM and HC methods. The improvement in prediction is due to the Isomap-mode inversion scheme used in the SHC method, which fully considers the integrity of each member. For the EM method, an ensemble mean on Eulerian points misses, to some extent, the spatial continuity of ensemble forecast members, which is maintained in the Isomap-mode. By reintegrating the information of members, the SHC method obtained a corrected deterministic forecast with more probabilistic forecast characteristics.
5 Summary and discussion
It is a challenge to fully extract ensemble member information for improving heavy rainfall forecasts. The SHC method proposed in this study effectively used probabilistic information from ensemble forecasts and improved deterministic forecasting skills by using segmented correction based on hierarchical clustering. To reveal the advantages of SHC in improving precipitation forecasts, we compared it with the EM and HC methods.
The SHC method performed better in terms of TS/ETS scores at the thresholds of 25 mm, 50 mm, and 100 mm based on the ECMWF-GEPS real-time forecasts in 2019–2021. The results confirmed the ability of the SHC method to effectively capture heavy rainfall signals in ensemble forecasts and quantitatively extract and utilize the useful information from ensemble members. Furthermore, the SHC method had better correction in the continuous forecast period and for multiple cases of heavy rain compared to the other two methods, indicating good performance by SHC in obtaining earlier-effective corrected forecasts for extreme rainfall events.
Moreover, the SHC method did not require a training process with historical data and was based only on the probability information from ensemble members. Therefore, SHC correction depended only on the quality of the ensemble forecast. As a new interdisciplinary method, SHC integrates segmentation, clustering, and manifold learning in meteorology and machine learning. Therefore, it is also a method that can be used to correct the deterministic forecast from the probabilistic forecast based on the characteristics of ensemble members.
Theoretically, the ensemble forecast usually uses as many forecast members as possible to achieve the best description of the initial field and reduce the influence of observation and analysis errors on forecasts. However, it is not easy to forecast weather situations based on information from many members. Thus, the EM method (smoothing the random disturbance components of individual members) has become one of the most useful deterministic forecasts. As reviewed in the introduction, numerical weather prediction operation centers worldwide use different methods to cluster the ensemble forecasts. For deterministic forecast, many studies have used segmented and stepwise correction methods to improve the forecast effectiveness. In this study, based on machine learning, we combined the advantages of the methods mentioned above and developed the SHC method. The SHC method can achieve certain forecast correction with interpretability by providing a deterministic forecast, including the probability of ensemble forecasts. The parameters of the SHC method remained relatively simple in this preliminary study on precipitation forecast. Optimization of other parameters are still needed to further improve forecasts based on more datasets from different ensemble forecasting systems. This new SHC method has been validated through applying it to the ECMWF ensemble forecast and comparing results with the traditional EM method that is widely used in operational platforms. Our results demonstrate that the SHC method has good potential for operational use due to its hindcast-independent advantages, and particularly for improvement of operational forecasts of severe rainfall.
Statements
Data availability statement
The raw data supporting the conclusion of this article will be made available by the authors, without undue reservation.
Author contributions
LG supervised the study and wrote the paper and ZZ carried out the analysis and wrote the paper. QC, JQ, and HC contributed to discussion of results and revision of the paper. All authors commented on the manuscript.
Funding
This work was jointly supported by the National Natural Science Foundation of China (42175015 and 41875138) and the National Key Research and Development Program of China (2018YFF0300103).
Conflict of interest
The authors declare that the research was conducted in the absence of any commercial or financial relationships that could be construed as a potential conflict of interest.
Publisher’s note
All claims expressed in this article are solely those of the authors and do not necessarily represent those of their affiliated organizations, or those of the publisher, the editors and the reviewers. Any product that may be evaluated in this article, or claim that may be made by its manufacturer, is not guaranteed or endorsed by the publisher.
References
1
AtgerF. (1999). Tubing: An alternative to clustering for the classification of ensemble forecasts. Weather Forecast.14 (5), 741–757. 10.1175/1520-0434(1999)014<0741:taatcf>2.0.co;2
2
BalasubramanianM.SchwartzE. L.et al (2002). The Isomap algorithm and topological stability. Science295 (5552), 7. 10.1126/science.295.5552.7a
3
BuizzaR.HoutekamerP. L.PellerinG.TothZ.ZhuY.WeiM. (2005). A comparison of the ECMWF, MSC, and NCEP global ensemble prediction systems. Mon. Weather Rev.133 (5), 1076–1097. 10.1175/mwr2905.1
4
CassolaF.FerrariF.MazzinoA. (2015). Numerical simulations of mediterranean heavy precipitation events with the wrf model: A verification exercise using different approaches. Atmos. Res.164, 210–225. 10.1016/j.atmosres.2015.05.010
5
CressmanG. P. (1959). An operational objective analysis system[J]. Mon. Weather Rev.87 (10), 367–374. 10.1175/1520-0493(1959)087<0367:aooas>2.0.co;2
6
EckertP.CattaniD.AmbühlJ. (1996). Classification of ensemble forecasts by means of an artificial neural network. Metall. Apps.3 (2), 169–178. 10.1002/met.5060030207
7
FerstlF.KanzlerM.RautenhausM.WestermannR. (2016). Time-hierarchical clustering and visualization of weather forecast ensembles. IEEE Trans. Vis. Comput. Graph.23 (1), 831–840. 10.1109/tvcg.2016.2598868
8
HuH. C.HuangB.WeiX. L. (2017). Objective correction method of ensemble forecast of 10 m winds on Chinese offshore. Meteor Mon.43 (7), 856–862. 10.7519/j.issn.1000-0526.2017.07.009
9
HungM. K.SaitoK.KhiemM. V.et al (2020). Application of GSMaP satellite data in precipitation estimation and nowcasting: Evaluations for october 2019 to january 2020 period for vietnam[J]. V.N. J. Hydrometeorol.5, 80–94. 10.36335/vnjhm.2020(5).80-94
10
JohnsonA.WangX.KongF.XueM. (2011). Hierarchical cluster analysis of a convection-allowing ensemble during the hazardous weather testbed 2009 spring experiment. Part I: Development of the object-oriented cluster analysis method for precipitation fields. Mon. Weather Rev.139 (12), 3673–3693. 10.1175/mwr-d-11-00015.1
11
JohnsonS. C. (1967). Hierarchical clustering schemes. Psychometrika32 (3), 241–254. 10.1007/bf02289588
12
LiZ. C.ChenD. H. (2002). The development and application of the operational ensemble predictionsystem at National Meteorological Center. J. Appl. Meteor Sci.13 (1), 1–15.
13
LiuC.SunJ.YangX.JinS.FuS. (2021). Evaluation of ECMWF precipitation predictions in China during 2015–18. Weather Forecast.36 (3), 1043–1060. 10.1175/WAF-D-20-0143.1
14
LuoY. L.GaoL.ChenQ. L.CaiH. K.RenH. L. (2021). Classification interpretation method and verification of circulation ensemble forecasts in GRAPES-GEPS. Acta Meteorol. Sin.79 (4), 646–658. 10.11676/qxxb2021.047
15
MesingerF. (2008). Bias adjusted precipitation threat scores. Adv. Geosci.16, 137–142. 10.5194/adgeo-16-137-2008
16
MolteniF.BuizzaR.PalmerT. N.PetroliagisT. (1996). The ECMWF ensemble prediction system: Methodology and validation. Q. J. R. Meteorol. Soc.122 (529), 73–119. 10.1002/qj.49712252905
17
MullenS. L.BuizzaR. (2002). The impact of horizontal resolution and ensemble size on probabilistic precipitation forecasts by the ECMWF ensemble prediction system. Weather Forecast.17 (2), 173–191. 10.1175/1520-0434(2002)0172.0.CO;2
18
NuissierO.JolyB.ViéB.DucrocqV. (2012). Uncertainty of lateral boundary conditions in a convection-permitting ensemble: A strategy of selection for mediterranean heavy precipitation events. Nat. Hazards Earth Syst. Sci.12, 2993–3011. 10.5194/nhess-12-2993-2012
19
SedlmairM.BrehmerM.IngramS.et al (2012). British columbia, vancouver, BC, Canada.” in Dimensionality reduction in the wild: Gaps and guidance. Steve Jobs. Univ. British Columbia, Vancouver, BC: Dept. Comput. Sci., Univ.Tech. Rep. TR-2012-03.
20
StensrudD. J.YussoufN. (2007). Reliable probabilistic quantitative precipitation forecasts from a short-range ensemble forecasting system. Weather Forecast.22 (1), 3–17. 10.1175/waf968.1
21
TenenbaumJ. (1997). Mapping a manifold of perceptual observations[J]. Adv. neural Inf. Process. Syst., 10.
22
WangJ.ChenJ.ZhangJ.et al (2019). A new method for gradually identifying the southwest vortex. Trans. Atmos. Sci.42 (4), 621–630. 10.13878/j.cnki.dqkxxb.20170806001
23
WangL.RenH. L.ZhuJ.HuangB. (2020). Improving prediction of two ENSO types using a multi-model ensemble based on stepwise pattern projection model. Clim. Dyn.54 (7), 3229–3243. 10.1007/s00382-020-05160-2
24
WangT. W.WangY.ChenD. H.et al (2015). Validation of strategies using clustering analysis for initial perturbations in limited area model ensemble prediction system. J. Meteor Environ.31 (6), 18–26. 10.3969/j.issn.1673-503X.2015.06.003
25
WeiP.XuX.XueM.ZhangC.WangY.ZhaoK.et al (2022). On the Key dynamical processes supporting the 21.7 Zhengzhou record-breaking hourly rainfall in China. Adv. Atmos. Sci.10.1007/s00376-022-2061-y
26
XueC. B.ChenX.ZhangY.et al (2019). Bias correction method for the 2m temperature forecast of ECMWF high resolution model. Meteor Mon.45 (06), 831–842. 10.7519/j.issn.1000-0526.2019.06.009
27
YangX. S.JeanN.GirardotN. (2001). Automatic classification of the products of ECMWF Prediction System according to the weather types. Acta Meteorolosica Sin.59 (2), 173–182. 10.11676/qxxb2001.018
28
ZhangW. J.FanF. H.TanY. (2004). Application of cluster method to radar signal sorting. Radar Sci. Technol. (04), 219
29
ZhouX. Y.SunZ. H.ZhangB. L.et al (2006). An efficient discovering and maintenance algorithm of subspace clustering over high dimensional data streams. J. Comput. Res. Dev.43 (05), 834–840. (in Chinese). 10.1360/crad20060510
30
ZhuY.LuoY. (2015). Precipitation calibration based on the frequency-matching method. Weather Forecast.30 (5), 1109–1124. 10.1175/waf-d-13-00049.1
31
ZhuY.TothZ. (2005). “Calibration of QPF/PQPF forecast based on the NCEP global ensemble[C],” in Preprints, 19th conf. On hydrology (San Diego, CA: Amer. Meteor. Soc., CD-ROM J.), 3.
32
ZhuY. (2005). Ensemble forecast: A new approach to uncertainty and predictability. Adv. Atmos. Sci.22, 781–788. 10.1007/BF02918678
Summary
Keywords
ensemble forecast, severe rainfall, machine learning, stepwise correction, segmented hierarchical clustering
Citation
Gao L, Zhao Z, Qin J, Chen Q and Cai H (2023) Stepwise correction of ECMWF ensemble forecasts of severe rainfall in China based on segmented hierarchical clustering. Front. Earth Sci. 10:1079225. doi: 10.3389/feart.2022.1079225
Received
25 October 2022
Accepted
29 November 2022
Published
24 January 2023
Volume
10 - 2022
Edited by
Fumin Ren, Chinese Academy of Meteorological Sciences, China
Reviewed by
Fang Zhou, Nanjing University of Information Science and Technology, China
Yun Chen, China Meteorological Administration, China
Updates
Copyright
© 2023 Gao, Zhao, Qin, Chen and Cai.
This is an open-access article distributed under the terms of the Creative Commons Attribution License (CC BY). The use, distribution or reproduction in other forums is permitted, provided the original author(s) and the copyright owner(s) are credited and that the original publication in this journal is cited, in accordance with accepted academic practice. No use, distribution or reproduction is permitted which does not comply with these terms.
*Correspondence: Li Gao, gaol@cma.gov.cn
This article was submitted to Geohazards and Georisks, a section of the journal Frontiers in Earth Science
Disclaimer
All claims expressed in this article are solely those of the authors and do not necessarily represent those of their affiliated organizations, or those of the publisher, the editors and the reviewers. Any product that may be evaluated in this article or claim that may be made by its manufacturer is not guaranteed or endorsed by the publisher.