 Shuting Wu1,2,3,4
 Zhigang Wei
94% of researchers rate our articles as excellent or good
Learn more about the work of our research integrity team to safeguard the quality of each article we publish.
Find out more
ORIGINAL RESEARCH article
Front. Earth Sci., 20 January 2023
Sec. Atmospheric Science
Volume 10 - 2022 | https://doi.org/10.3389/feart.2022.1079131
This article is part of the Research TopicExtreme Precipitation in Arid Regions: Observation, Mechanisms, and SimulationsView all 9 articles
With global warming and more frequent extreme precipitation events in recent years, the phenomenon of warming and humidification in the arid regions of Northwest China (ANWC) has attracted increasing attention. We assessed the coupling effects of soil temperature and moisture on extreme precipitation in the ANWC by using daily precipitation data from CN05.1 and monthly data on soil temperature, soil moisture, and energy from ERA5-land, 1961–2018. After logical partitioning by K-means clustering, the primary influencing routes in each partition were investigated using two indices of extreme precipitation, indicated by precipitation on very wet days (R95P) and the number of extreme precipitation days (R10day). We found that 1) Local extreme precipitation has had a steadily growing impact on overall precipitation. In summer, this impact is primarily driven by an increase in the quantity of extreme precipitation, but in winter, it is primarily driven by an increase in the intensity of single precipitation. 2) The Tianshan Mountains (TM) and Qilian Mountains (QM) are the key locations for the coupling of soil temperature and moisture with the extreme precipitation index. Both locations exhibit a positive coupling state for soil temperature with extreme precipitation with positive coupling in the TM but negative coupling in the QM for soil moisture with extreme precipitation. 3) In the coupling of soil temperature and moisture with energy, the relevant significant regions are almost all over the ANWC throughout the year and all seasons, and the coupling high-value areas are concentrated around the basin. 4) In the TM–Hami Basin (HB)–QM, the coupling between energy and the extreme precipitation index is also stronger. The specific coupling paths have been changing with seasonal and regional changes.
The frequency, intensity, and duration of extreme climate events have increased in recent decades with global warming (IPCC, 2021). The extreme climate has ranked first in the top 10 global risks for five consecutive years (World Economic Forum, 2021). Extreme weather has led to significant loss of life and the economy, and approximately 46% of the global area is likely to suffer from moderate-to-high-risk disasters from extreme precipitation in the future (Huang et al., 2021). The number of extreme precipitation events in China has increased significantly. The stations with an increasing trend of extreme precipitation and extreme precipitation days accounted for 68% of the total number of stations, mainly concentrated in the southeastern coastal and western regions. Extreme precipitation occurrences in China start and end at times that clearly show advancement and postponement, respectively. The arid regions of Northwest China (ANWC) not only have the fastest increase in the number of extreme precipitation days but also have significantly earlier and later start and end times of extreme precipitation events. The increasing trend of extreme precipitation reaches the 0.01 significance level, and the summer climate is becoming more humid in the ANWC (Sun and Zhang 2017; Peng et al., 2018; Ning et al., 2021).
At the beginning of the 21st century, Shi et al. (2002) found that precipitation showed an increasing trend in the ANWC and that the increase in the frequency of extreme weather events may be related to a climate shift from humid to dry conditions. Current predictions of extreme precipitation have higher uncertainty in dry regions than in wet regions (Kim et al., 2020). The ecological environment of the ANWC is vulnerable to climate and land use/land cover change, while the ecological quality is an important aspect of the UN Sustainable Development Goals (Wang et al., 2022).
Northwest China has a high frequency of drought events and a complex mechanism of precipitation occurrence, with a trend of wetness in all seasons. Extreme precipitation is not only controlled by large-scale climate but also influenced by local small-scale or medium-scale weather processes. Extreme precipitation in different seasons is influenced by different combinations of large-scale climate indices with different lag times, and the regional responses are more complex when each climate index is in different stages (Chen et al., 2017; Chen et al., 2019). The interaction between multiple climate oscillations is heterogeneous in most seasons and phases, and certain phases can significantly trigger extreme precipitation due to amplification effects between climate oscillations (Shi et al., 2017). Ning et al. (2021) showed that the sources of water vapor in the ANWC are the North Atlantic and the Arctic Oceans, the Arabian Sea and the Bay of Bengal, and the northwest Pacific Ocean, with the associated precursor signal from the North Atlantic triggered by the NAO.
Extreme precipitation events are predicted by models to become more intense in the future (Peng et al., 2018; Donat et al., 2019). The frequency of extreme weather events and the extent of damage caused by these events will continue to increase (Chen et al., 2012). Existing studies have focused more on the causes of precipitation, less on extreme precipitation, and only on some specific regions, with little attention given to the differences in the causes of extreme precipitation between regions. The complexity of the causes of past and future extreme precipitation events in China has led to a limited understanding of their formation mechanisms, despite the many studies that have been conducted (Zhou and Chen 2012; Lu et al., 2021).
Current studies on the causes of extreme precipitation have mainly focused on exploring the relationships among extreme events, large-scale circulation changes, and sea surface temperature. Few studies have explored the causes of extreme precipitation from the perspective of land surface processes or thermal anomalies, and there are still many uncertainties in the understanding of land‒atmosphere interactions in arid regions. The changes in land‒atmosphere coupling and coupling mechanisms are very important for accurately predicting future climate (Chen and Zhou 2013; Diro et al., 2014; Zscheischler et al., 2015; Chen et al., 2017; Zhang et al., 2021). The existing method for comprehending and enhancing the Earth–atmosphere system and its variability in climate change prediction continues to have weaknesses in understanding land‒atmosphere interactions (Santanello et al., 2015).
Processes at the land‒atmosphere interface are an important component of the climate system, soil temperature and soil moisture are the key variables of land‒ atmosphere interactions, and soil moisture is the main constraint on evapotranspiration in the presence of an adequate energy supply, especially in water-scarce regions (Seneviratne et al., 2010; Hao et al., 2021). The response of soil temperature to atmosphere changes and the effect of soil temperature on the atmosphere can be thought of as signal propagation processes. Understanding the storage and release of atmospheric signals in soil temperature is beneficial for improving climate prediction and weather forecasting (Song et al., 2022). Hu and Feng (2005) found that precipitation effects can be included in soil temperature, and soil temperature is an accurate proxy for changes in low-frequency climate conditions at the surface. Xue et al. (2018) argue that the possible impact of large-scale surface temperatures in upstream regions on drought/flooding has been largely overlooked and that a causal relationship exists between spring soil temperature anomalies in North America and East Asia and downstream summer drought/flooding.
Reduced evaporation due to dry soils may affect the surface energy balance; when evaporation is limited by soil moisture, the supply of water in the atmosphere is depleted, and this deficit may propagate in time and space (Lorenz et al., 2016; Schumacher et al., 2022). Spatial heterogeneity and variability of soil moisture trigger feedback to temperature and precipitation, which have been recognized as important drivers of climate variability (Brubaker et al., 1993; Zhou et al., 2019). Soil moisture can act directly on the atmospheric boundary layer through the regulation of latent and sensible heat fluxes, affecting surface air temperature and precipitation. Upward heat transport processes on the land surface can not only affect the local thermal conditions but can also have significant impacts on atmospheric circulation, which is the basis for understanding land‒atmosphere interaction processes (Koster et al., 2004; Zhang et al., 2016; Schwingshackl et al., 2017; Huggannavar and Indu 2020).
In general, soil temperature and moisture feedbacks and sensible and latent heat flux changes all contribute to regional amplification to varying degrees. Extreme climate events strongly affect society, ecology, and the economy but are not well represented in current Earth system models, which have implications for the prediction of both drought and extreme precipitation. The mechanisms affecting extreme climate are unclear and require further in-depth analysis before we can make robust predictions (Martha et al., 2018; Shen and Chen 2018; Williams 2019).
This paper briefly analyzes extreme precipitation characteristics based on daily precipitation data from 1961 to 2018 in the ANWC and then couples the analysis with related ground variables and energy to find the key influencing factors in extreme precipitation events and the regionally significant influencing paths.
The topography of the ANWC (Figure 1) is intricate. The distribution of subalpine and alpine-dominated mountains and mid-altitude, plain-dominated basins form a mountain–basin system with typical continental temperate desert climate features. The ANWC has the most remarkable geomorphological combination, is the driest region in China, and has far less precipitation than other areas at the same latitude. However, the high and very high alpine regions of the Tianshan Mountains (TM), Qilian Mountains (QM), and Altay Mountains (AM) receive higher precipitation, turning them into “wet islands” in the desert. They are also littered with lacustrine and gravity landforms (Li et al., 2013). Local land‒atmosphere interactions are therefore quite complicated. The ANWC selected in this paper includes all of Xinjiang, Ningxia, Gansu, Inner Mongolia, and parts of Qinghai (36°N∼50°N, 73°E∼107°E).
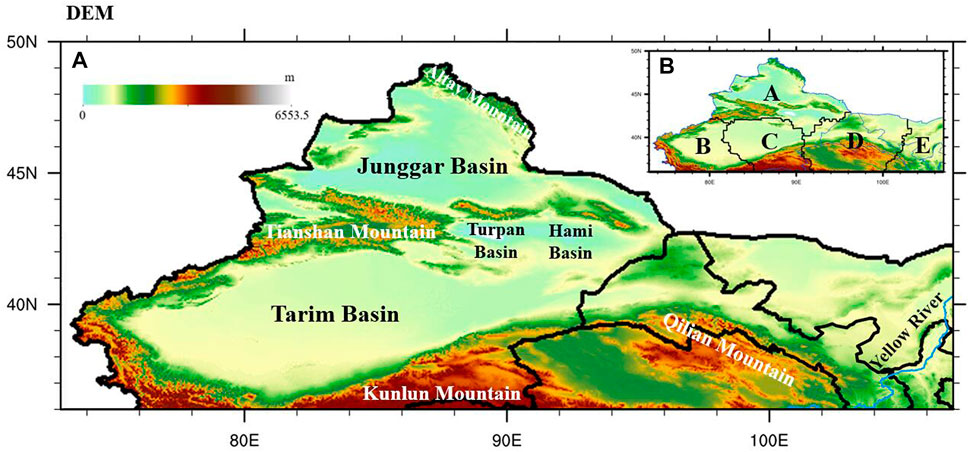
FIGURE 1. Topography and subregions in the ANWC. K-means clustering divides the ANWC into five regions: A, B, C, D, and E. The bottom layer of the map is topographical. The black lines in (A) are provincial boundaries, and the blue line is a river. The black lines in (B) are the dividing lines between regions, and the blue lines indicate provincial and national boundaries.
In this paper, reanalysis data CN05.1 from the China Meteorological Administration (CMA) and fifth-generation reanalysis data ERA5-land developed by the European Centre for Medium-Range Weather Forecasts (ECMWF) were used.
The gridded 0.25°×0.25° observation dataset of CN05.1 is based on the observations of 2,416 ground-based meteorological stations in China. An anomaly approach interpolation was used on this dataset. To create the final dataset, the gridded climatology was first calculated, and then the gridded daily anomaly was added to the climatology (Wu and Gao, 2013). We chose the daily precipitation data (pre) from 1961.1.1 to 2018.12.31.
ERA5-Land is an enhanced global dataset with a spatial resolution of 0.1° × 0.1°, which was produced by global high-resolution numerical integration of the ECMWF land surface model in the framework of the Copernicus Climate Change Service (C3S) of the European Commission. The period covered spans from 1950 to the present, with continuous updates to support land monitoring applications (Joaquín et al., 2021). To ensure a consistent data length, we chose the monthly data from 1961 to 2018 for analysis. The variables used include soil temperature at a 0–7 cm depth (stl1), soil moisture at a 0–7 cm depth (swvl1), sensible heat flux (sshf), latent heat flux (slhf), and net longwave radiation (str).
Although numerous extreme precipitation indices exist, they all have comparable variational traits. The extreme climate indices were developed by the Expert Team on Climate Change Detection and Indices (ETCCDI) and were jointly established by the World Meteorological Organization (WMO) and the World Climate Research Programme (WCRP). We selected two extreme precipitation indices, R95P and R10day, based on ANWC features to indicate the variance characteristics of local extreme precipitation and extreme precipitation days, respectively. The unit used in R95P is “mm,” which refers to the total precipitation for days with precipitation greater than 95% of the ranked value. The unit used in R10day is “day,” which refers to the number of days with at least 10 mm of precipitation in a single day (Zhang et al., 2011).
The spatial and temporal characteristics of annual and seasonal extreme precipitation in the ANWC from 1961 to 2018 were first analyzed, and the results were subjected to significance t tests. The two-step coupling index was then used to quantify local land‒atmosphere coupling processes and discover the main influencing factors in the ground variables and energy to further explore the local land‒atmosphere interactions. Winter (DJF) refers to December of the previous year to February of the current year, spring (MAM) refers to March to May, summer (JJA) refers to June to August, and autumn (SON) refers to September to November. The winter values for 1961 were calculated from the values of January and February of the current year only. Then, to completely comprehend the variability characteristics of extreme precipitation in the area, the EOF (Empirical Orthogonal Function) of the extreme precipitation was utilized. K-means clustering was then utilized to fairly divide the ANWC for further study.
The ground variable–extreme precipitation index, ground variable–energy index, and energy–extreme precipitation index coupling are carried out in sequence based on the definition of the two-step coupling index offered by current studies for the land‒atmosphere coupling subprocess (Dirmeyer, 2011; Hirsch et al., 2019; Yang et al., 2021). The data were initially averaged by year or season for the coupling calculation, and the coupling coefficients were then calculated using the two-step coupling equation in Eq. 1. If we consider soil moisture as the driving variable and latent heat flux as the response variable, then the physical meaning of the land‒atmosphere coupling index is the response value of latent heat flux to each standard deviation change in soil moisture. The positive and negative coupling coefficients represent the positive and negative correlation of two related variables, and the larger the absolute value of the coupling coefficient is, the stronger the land‒atmosphere interaction.
where TCI denotes the coupling coefficient. A and B denote two variables, and the whole represents the effect of A on B.
We conducted the significance test of correlation for the corresponding grids and marked the grids that passed the 0.05 significance level test with dots on the graph. Because there is no significant test for the coupling coefficient, only the magnitude of the value is needed to respond to the influence. When the grid passed the significance test and the coupling coefficient was large, we considered that B was more sensitive to the change in A and that the land‒atmosphere coupling strength was strong.
In the correlation coupling of energy, the soil heat flux is an exchange between the surface layer of the ground and the deep soil layer; it is not transported to the atmosphere and generally does not affect precipitation. Therefore, we used energy1 to denote the sum of sensible and latent heat flux transported from the ground to the atmosphere and energy2 to denote the total energy transported from the ground to the atmosphere (including sensible heat, latent heat, and effective radiation).
where sshf and slhf are the sensible heat flux and latent heat flux, respectively, and str is the surface effective radiation (negative value of net longwave radiation). For the calculation, we processed the ERA5-land data to specify that the sensible heat flux, latent heat flux, and effective radiation are all upward positive (transported to the atmosphere).
Figure 2 shows the spatial distribution of annual and seasonal R95P and R10day in the ANWC during 1961–2018. In the central ANWC, particularly inside the Tarim Basin (TB), extreme precipitation is generally low throughout the year, and the number of extreme precipitation days is lower in the Junggar Basin (JB) and Hami Basin (HB) than in other regions (Figures 2A,F).
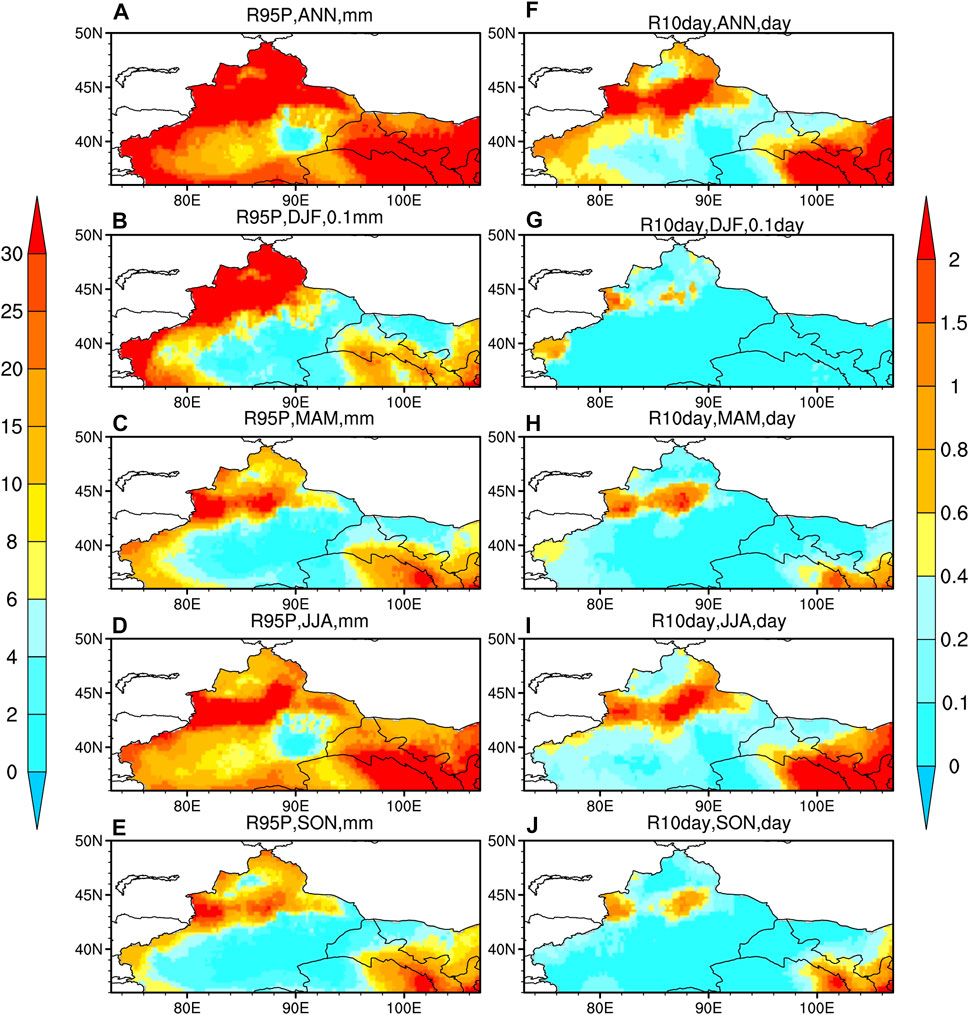
FIGURE 2. Spatial distributions of annual and seasonal R95P (A–E) and R10day (F–J) in the ANWC during 1961–2018. The remaining units are day and mm, except the units in winter (B,G), which are 0.1 day and 0.1 mm, respectively.
Extreme precipitation is more common and on a larger scale in summer (Figures 2D,I) than in other seasons and occurs less frequently in winter (Figures 2B,G). Winter extreme precipitation only occurs in the northern TM and the westernmost region of Xinjiang. Spring (Figures 2C,H) and autumn (Figures 2E,J) extreme precipitation occurrences are concentrated in the TM, QM, and the area east of QM. The precipitation range is even wider in summer than in spring and autumn. With multiyear average extreme rainfall (Figure 2D) above 30 mm in summer and multiyear average extreme precipitation days exceeding 2 days (Figure 2I), the TM and QM are two high-value centers for the occurrence of extreme precipitation in the ANWC.
Figure 3 shows the spatial distribution of annual and seasonal precipitation trends and regional mean precipitation anomalies in the ANWC from 1961 to 2018. Annually (Figures 3A,K), extreme precipitation only shows a slight downward trend in parts of the TB, the western side of Inner Mongolia, and the border between Gansu and Ningxia, while the area of decreasing extreme precipitation days also includes a small area of the JB. From the regional mean precipitation anomalies (Figures 3F–J, P–T), both extreme precipitation and extreme precipitation days show an increasing trend, with an average annual increase in extreme precipitation of 0.445 mm/10 a and an average increase in extreme precipitation days of 0.135 days/10 a. We can see the increasing rate of both extreme precipitation and extreme precipitation days by comparing the blue trend lines. In comparison with the previous 30 years, the growth rate of extreme precipitation days and amounts accelerated significantly after the 1990s, both for the entire year and for each season.
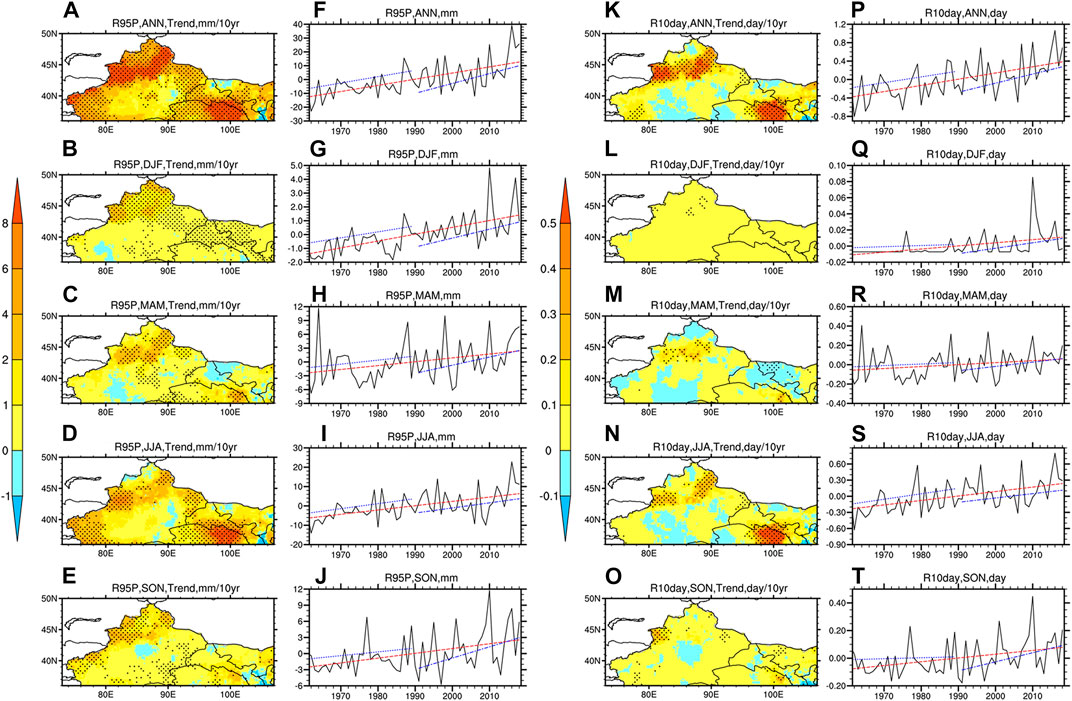
FIGURE 3. Spatial distribution of annual and seasonal precipitation trends from 1961 to 2018. (A–E, K–O), the black dots are the grids that passed the 0.05 level significance test) and regional mean precipitation anomalies (F–J, P–T) in the ANWC. The red and two blue lines represent the overall trends from 1961 to 2018, 1961 to 1990, and 1990 to 2018, respectively.
The TM and QM are the areas of high multiyear average rainfall, which are also the regions with the fastest growth in extreme precipitation and extreme precipitation days and pass the significance test at the α=0.05 level. Significant growth areas also exist in the JB, HB, and along the headwaters of many rivers on the western side of Xinjiang.
Seasonally, summer with the highest precipitation is also the fastest-growing season, with an average increase in extreme precipitation of 0.222 mm/10 a and extreme precipitation days of 0.083 days/10 a. Spring and autumn are comparable, and winter is growing relatively slow in comparison.
However, the significant growth areas in different seasons are slightly different. In winter, the significant growth area is mainly concentrated in the northern part of the TM and near the Hexi Corridor. In spring, the location of the significant growth area of extreme precipitation shifts southward and appears in the TB, but the significant growth area of extreme precipitation days is in the TM and the western side of Inner Mongolia. In summer, the significant area is not only near the TM but also in Qinghai and the QM. The significant growth area in autumn decreases from the summer and is similar to the spring, but the overall distribution is slightly more dispersed compared to the spring. Meanwhile, different areas of the TB show a drying trend in spring, summer, and autumn.
Figure 4 shows the annual and seasonal variation of the ratio of R95P to total precipitation (Figure 4A) and the ratio of R10day to total precipitation days (Figure 4B) in the ANWC from 1961 to 2018. The proportion of extreme precipitation and extreme precipitation days to total precipitation increases in cyclical fluctuations at annual and seasonal scales. The single extreme precipitation increase also indicates that the impact of extreme precipitation on the local total precipitation is gradually increasing.
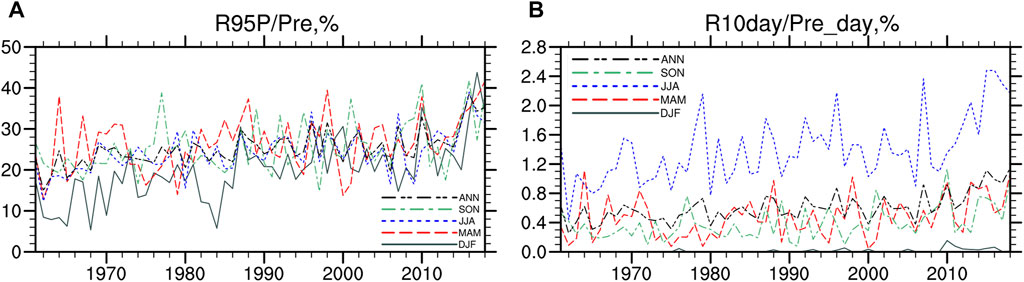
FIGURE 4. Variations in the ratio of R95P to total precipitation (A) and the ratio of R10day to total precipitation days (B) in the ANWC from 1961 to 2018.
Specifically, the increasing rates of annual and seasonal R95P (R10day) are shown in Table 1. The proportion of extreme precipitation days in winter to total precipitation days in that season is the smallest of the four seasons, less than 1/10 of the annual variation rate, but the proportion of extreme precipitation variation rate is nearly twice that of the annual rate. The increase in extreme precipitation in summer is only slightly higher than that in spring and autumn and lower than the annual increasing rate. However, the rate of increase in extreme precipitation days in summer reaches nearly three times that in spring and fall. This indicates that the increase in extreme precipitation in wet summer is mainly due to the increase in the number of extreme precipitation days; whether there is a slight decrease in the precipitation amount of single extreme precipitation events needs to be further investigated. The increase in extreme precipitation in the relatively dry winter is mainly due to the increase in the precipitation amount of single extreme precipitation events.
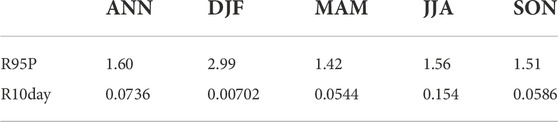
TABLE 1. Annual and seasonal growth rates of the R95P to total precipitation ratio and R10day to total precipitation day ratio, 1961–2018. (%/10 a).
Through the EOF analysis of the annual variation of R95P and R10day, we can see from Figure 5 that the most dominant first mode has consistent variation characteristics across the region, which are consistently increasing in terms of time coefficients. The second mode characteristics are the reverse of the east‒west variation, and the third mode characteristics show the middle and around variations are opposite. Additionally, there are annual fluctuations with time variation. In the EOF PCs, there are some decadal-scale changes, we speculate that this may be related to PDO.
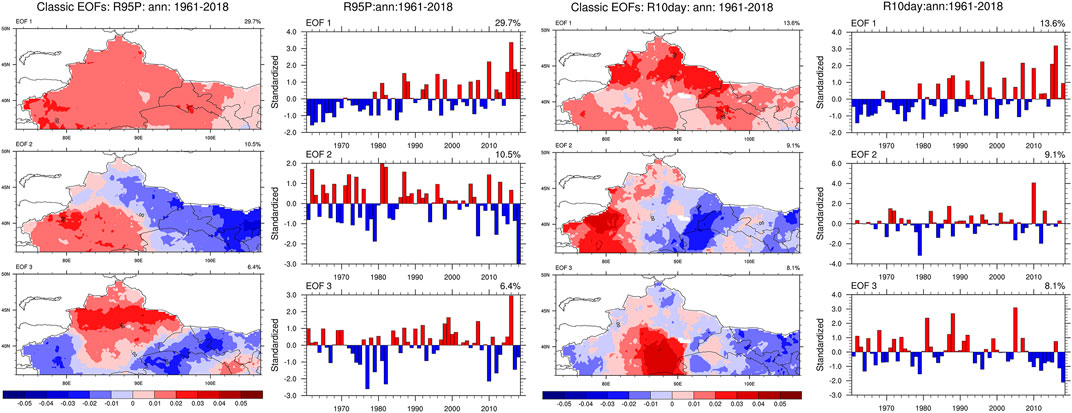
FIGURE 5. Spatial distributions of the first three EOF modes of R95P and R10day in the ANWC during 1961–2018 and the corresponding standard time series.
From the above spatial distribution and changing characteristics of extreme precipitation, the characteristics of each region in the ANWC are different and should be reasonably zoned. Previous studies have usually divided the ANWC into westerly, plateau, and monsoon zones or divided the ANWC by the boundaries near 100°E (summer monsoon fringe) and the TM, arguing that the west was mainly influenced by westerly winds, and the east was mainly influenced by monsoons (Song and Zhang 2003; Cai et al., 2015; Lu et al., 2021).
Chen et al. (2021) showed that there is no significant prevailing wind direction in the northern part of the Qinghai–Tibet Plateau in summer. In recent decades, the summer precipitation increase in the ANWC has mainly been caused by summer moisture transport anomalies under the weakening trend of the East Asian summer monsoon. The Mongolian anticyclone generates persistent easterly winds in northern China, which can penetrate along the northern part of the Qinghai–Tibet Plateau to the western part of the TB. The contribution of local evaporation to precipitation variability in the ANWC may be exaggerated if the moisture transport of extreme precipitation in the ANWC is ignored. The whole northwestern region is largely influenced by the synergistic effects of both the westerly and monsoonal circulations.
Therefore, we use k-means clustering to divide the ANWC into five regions, as shown in Figure 1B: A (northern Xinjiang), B (southwestern Xinjiang), C (southeastern Xinjiang), D (western Gansu, western Inner Mongolia, and northern Qinghai), and E (eastern ANWC), based on the 58-year annual variability in extreme precipitation combined with the results of the EOF analysis. The division of regions not only distinguishes extreme precipitation with different variability characteristics but it also generally coincides with the topographic features of the ANWC, which facilitates further investigation of the main land‒atmosphere coupling factors in each region.
Overall, both extreme precipitation indices in the five regions show an increasing trend, with the fastest increase in Area A, with R95P and R10day values of 0.557mm/10a and 0.0180 day/10 a, respectively. Region C shows the slowest change, with 0.132 mm/10 a and 0.000494 day/10 a, respectively. The rates of change in Areas B, D, and E are relatively similar, with R95P (R10day) changing at 0.369 mm/10 a (0.00570 day/10 a), 0.378 mm/10 a (0.0137 day/10 a) and 0.308 mm/10 a (0.0150 day/10 a), respectively.
Based on the analysis of the characteristics, we find that extreme precipitation changes significantly in winter and summer, while the changes in spring and autumn are relatively weaker. Focusing on the extreme precipitation in winter and summer is of great significance for agriculture, society, the economy, and flood prevention and mitigation.
Using Eq. 1, we calculate the land‒atmosphere coupling intensity in the ANWC and find that there are some missing grids in the distribution maps. Because the value of the extreme precipitation index in the grid has been missing or a constant value throughout the 58-year series, or the two variables coupled to each other do not have nonzero values at the same time. We can see the similarity of the overall characteristics of R10day and R95P through the previous feature analysis. R10day is mainly a reflection of the number of extreme precipitation days; therefore, we only use the coupling of R10day with some missing grids as an auxiliary reference for the analysis of R95P in the subsequent exploration.
Figure 6 and Figure 7 show the spatial distribution of the annual and seasonal coupling index of soil temperature and moisture with R95P and R10day. In contrast, the coupling with R95P is stronger than that with R10day, but the overall coupling distributions of the two are similar. At the annual scale, the significant areas of soil temperature coupled with extreme precipitation (Figures 6A, 7A) are mainly concentrated in Areas A, D, and E for a positive coupling. Area C is also positively coupled, and Area B is negatively coupled. The significant areas of soil moisture coupling with extreme precipitation (Figures 6F, 7F) are concentrated in Areas B and D, with positive coupling in Area B and negative coupling in Area D. Areas A and C are also dominated by positive coupling, and Area E is dominated by negative coupling.
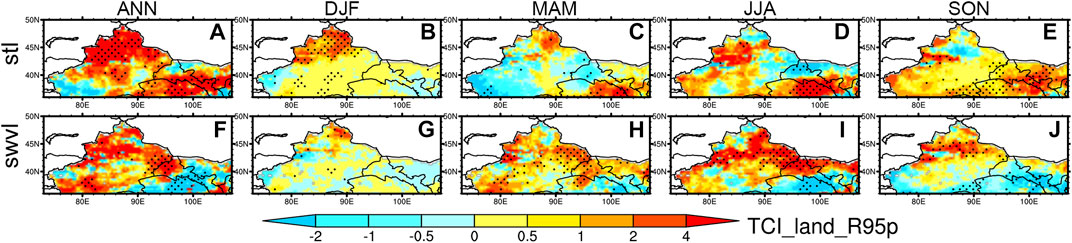
FIGURE 6. Spatial distributions of the annual and seasonal coupling index of stl1 and swvl1 with R95P. The black dots are the grids that passed the 0.05 level significance test.
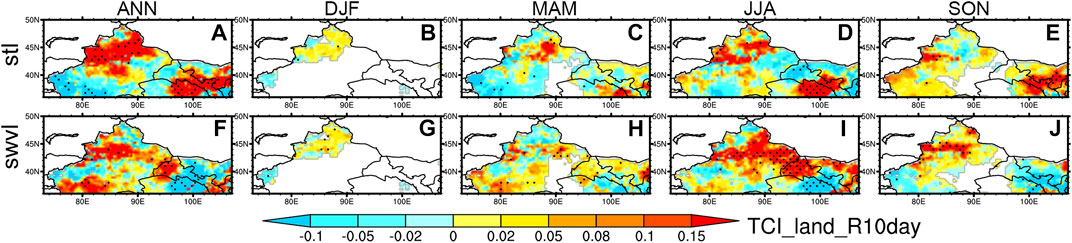
FIGURE 7. Spatial distributions of the annual and seasonal coupling index of stl1 and swvl1 with R10day. The rest of the caption is the same as in Figure 6.
In the coupling of soil temperature and extreme precipitation, the significant areas in winter (Figures 6B, 7B) are relatively concentrated in Areas A, B, and C, and a large area of Area A is positively coupled with high values. Except for the western part of Area B and most of Area E, which are negatively coupled, the rest of the areas are positively coupled. In spring (Figures 6C, 7C), the significant areas are relatively sporadic, with a positively coupled high-value area near the QM, and the Areas B and C and the northern parts of D are all mainly dominated by negative coupling; Areas A and E are dominated by positive coupling. In summer (Figures 6D, 7D), significant areas are mainly in the TM and Area D, which are positively coupled. Except for a few areas in B and northern part of the QM in D, which are negatively coupled, the other areas are positively coupled. In autumn (Figures 6E, 7E), significant coupled areas exist in Area D and the southern part of Area C, except for the JB in Area A, which is the center of negative coupling, and the rest are mainly positive coupling.
In the coupling between soil moisture and extreme precipitation, the significant areas in winter (Figures 6G, 7G) are mainly in Areas A, B, and C. The overall distribution is relatively sparse, except for Area E, which is mainly negatively coupled, and all other areas are alternately positively or negatively coupled. There is a positive coupling, high-value area near the AM and negative coupling high-value areas on the westernmost side of the TM and the western side of Area B. The significant areas in spring (Figures 6H, 7H) and summer (Figures 6I, 7I) are mainly concentrated in the vicinity of the TM and HB, and both are positive coupling areas. A positive coupling area also exists in Area C in spring and in Area D in summer. There is a negative coupling area near the AM and QM in spring and the rest of the areas have positive couplings, while a negative coupling area is on the eastern side of Area B in summer and the rest are similar to spring. The absolute values of coupling in summer are significantly larger and have a wider distribution than those in spring, but the overall distribution is also similar. In autumn (Figures 6J, 7J), the significant area is slightly less than that in spring, there is a relatively concentrated area in the TM, and it is a positive coupling high-value area. Overall, Areas B, D, and E are dominated by negative coupling states, and the remaining areas are positively coupled.
In general, the coupling high-value area is still mainly in the TM and QM. The coupling of soil temperature and extreme precipitation shows positive coupling in both places. The coupling of soil moisture and extreme precipitation still shows positive coupling in the TM, but the coupling in the QM becomes a negative coupling.
Figures 8–9 show the coupling distribution between soil temperature and moisture with each energy in turn. Compared with the direct coupling between land surface variables and extreme precipitation, the number of grids passing the significance t-test increases substantially at annual and seasonal scales. This indicates that the association between land surface variables and energy is more direct. The dominant energy in energy1 and energy2 is also changing through the coupling states and significant regions.
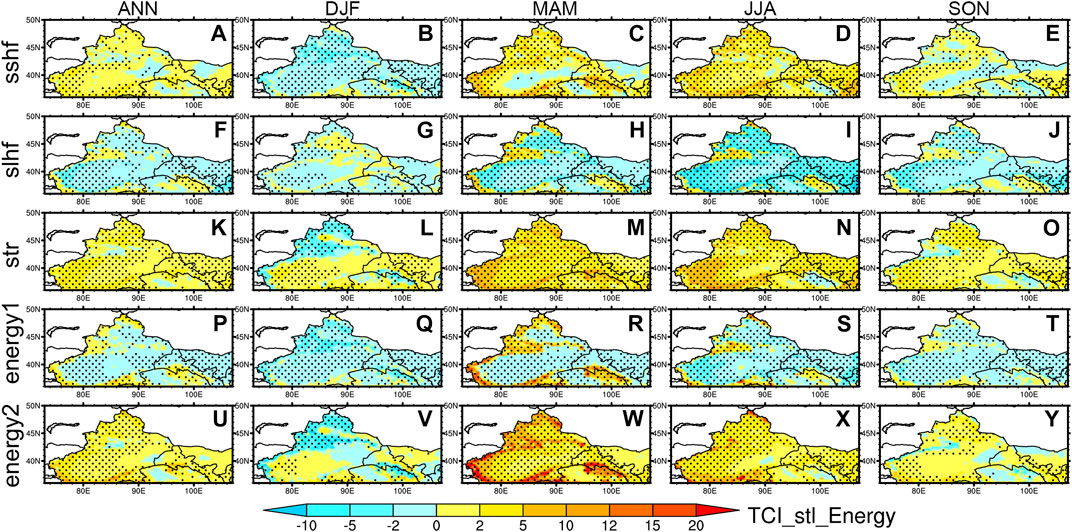
FIGURE 8. Spatial distributions of the annual and seasonal coupling index of stl1 with sshf, slhf, str, energy1, and energy2. The rest of the caption is the same as in Figure 6.
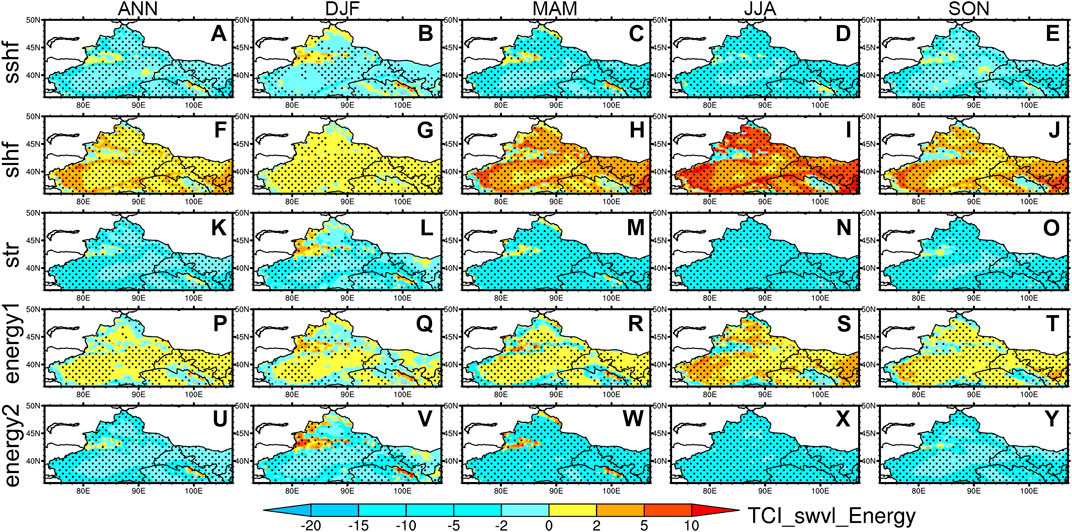
FIGURE 9. Spatial distributions of the annual and seasonal coupling index of swvl1 with sshf, slhf, str, energy1, and energy2. The rest of the caption is the same as in Figure 6.
Annually, the significant areas of coupling between soil temperature and sensible heat flux (Figure 8A), latent heat flux (Figure 8F), and effective radiation (Figure 8K) are distributed in all areas. However, the significant areas of coupling with sensible heat flux are relatively sparse in Areas C, D, and E. The significant areas of coupling with latent heat flux and effective radiation are relatively few in Area D, and Areas B and E are fully covered. In terms of the coupling relationship, it shows a large positive coupling with sensible heat flux and effective radiation and a large negative coupling with latent heat flux. In the area with more vegetation, the coupling relationship shows the opposite state in general. The coupling of soil temperature with energy1 (Figure 8P) is similar to that with latent heat flux, but there are more coupling significant areas in Area D. The coupling with energy2 (Fig. 8u) is similar to that of effective radiation, but there are almost no coupling significant areas in Area E.
In winter, the coupling between soil temperature and sensible heat flux (Figure 8B) changes to a negative coupling state in almost all regions. The significant areas also increase greatly, except Gansu and the TB, which have less significant areas around, and there is a large area of negative coupling with high values in Area A. The significant areas of coupling with latent heat flux (Figure 8G) decrease significantly in Areas B and E, and the coupling state changes from positive to negative in the TM, becoming positive in the JB and HB. The coupling with effective radiation (Figure 8L) decreases in Areas C and E, but the coupling state is almost unchanged. However, in Area A, the TM and AM become negatively coupled, not only significant but also with a high value of negative coupling, while a few areas in the JB become positively coupled. The coupling with energy1 (Figure 8Q) is still similar to the coupling of sensible heat flux, but there are more significant areas in Area D. The coupling with energy2 (Fig. 8v) is similar to that with the effective radiation, but there are few coupling significant areas in Areas C and E.
In summer, the significant area of coupling between soil temperature and sensible heat flux (Figure 8D) is not covered only in Areas A and D. The positive coupling area is further expanded based on the whole year, and the coupling intensity is increasing. Compared with the sensible heat flux, the significant area of coupling with the latent heat flux (Figure 8I) is larger. The overall coupling state is not changed compared with spring, but the coupling intensity is further enhanced. The significant area of coupling with effective radiation (Figure 8N) is narrower in Area C and larger in Area D. The coupling state is changed to negative in the QM, and the intensity of the rest of the positive coupling area is still enhanced. The coupling with energy1 (Figure 8S) and energy2 (Figure 8X) is still similar to latent heat flux and effective radiation, respectively, but the overall coupling intensity is weakened.
In spring, the coupling of soil temperature with each energy, except for the regions where the coupling state changed, the coupling coefficients increases significantly in the remaining regions, especially in the positive coupling areas around the JB and TB. The significant areas of coupling with effective radiation (Figure 8M cover almost the whole area, and all of them are positively coupled. In autumn, the intensity of the coupling of soil temperature with individual energies decreased slightly compared to the whole year, with only a slight expansion of the range of significant areas of coupling with energy1 (Figure 8T).
A negative feedback relationship also occurs between soil temperature and soil moisture. For instance, over most of the arid study region, there are negative (positive) coupling between the soil temperature (moisture) and the latent heat flux in Figure 8 (9). This clearly shows a physical path of soil moisture affecting local temperature: the increased soil moisture causes more surface evaporation and thus lowers the soil temperature. Therefore, compared with soil temperature, the coupling between soil moisture and each energy, except for a few regions, the coupling state is opposite. Similarly, the coupling between soil moisture and energy also passes the significance test for a large number of grids (Figure 9).
Annually, the significant coupling areas among soil moisture, sensible heat flux (Figure 9A), latent heat flux (Figure 9F), and effective radiation (Figure 9K) are spread except in the HB, the TM and QM, the main area of the TM, in order. The negative coupling is shown with both sensible heat flux and effective radiation, and the positive coupling is shown with latent heat flux. Area E and the western periphery of the JB and TB are positive couplings in high-value areas. The coupling state with energy1 (Figure 9P) is positive except for the QM and around the JB and TB, and significant areas are almost in the positive coupling area. The coupling state and the significant area of the coupling with energy2 (Figure 9U) in Areas A, B, and C are similar to sensible heat flux, and Areas D and E are similar to effective radiation.
In winter, the significant coupling areas between soil moisture and sensible heat flux (Figure 9B) are greatly reduced except for Area C, while the northern part of Area A becomes positive coupling, and the positive coupling intensity increases near the QM. The coupling with latent heat flux (Figure 9G) is no longer significant near the AM, the whole area is positive coupling, and no high-value area exists. A large number of grids coupled with effective radiation (Figure 9L) in Areas A and E are no longer significant, but the overall coupling state is still negative. The coupling intensity of the positive coupling area in the TM and QM is strengthened, and a small amount of positive coupling area also appears in Area E. The coupling with energy1 (Fig. 9q) is mainly concentrated in the TM and Areas B and D, and the remaining areas are only slightly distributed. The coupling state of grids in Area A has a large number of positive and negative transitions, while positive coupling with high-value areas also appears in the TM and QM. The coupling with energy2 (Figure 9V) is almost the same as the coupling with effective radiation, but the coupling intensity in the positive coupling area is stronger.
In summer, the negative coupling strength of the coupling with sensible heat flux (Figure 9D) is further strengthened in all regions based on spring, but the positive coupling area is weakened, and the significant grids are reduced. In the coupling with latent heat flux (Figure 9I), the positive coupling strength is also further strengthened, and there are few weak positive coupling areas in the whole region. However, the TM, QM, and AM all show negative coupling, and the whole region is almost significant. The coupling with effective radiation (Fig. 9n) passes the significance test in the whole region, all grids show negative coupling, and the coupling value is relatively weak only in the center of the basin. The coupling with energy1 (Figure 9S) is the same as that of latent heat flux, but the coupling value is weakened, and the overall coupling value is similar to that of latent heat flux throughout the year. The coupling with energy2 (Figure 9X) is nearly the same as that of effective radiation in the season, and the coupling value is slightly stronger in Areas C and E and only slightly weaker in the remaining three zones.
Compared with the whole year, the coupling intensity was strengthened in spring, and the coupling with latent heat flux, significant areas increases further based on the whole year (Figure 9H), and the overall coupling intensity increases in all directions with the basin as the center, forming a circle-type, high-value area. In autumn, the coupling strength with each energy is weaker than in spring and summer, and the significant zones are all reduced.
In general, the mean values of coupling between soil temperature (moisture) and sensible heat flux, effective radiation, and energy2 are mostly positive (negative) in all regions. The coupling with latent heat flux and energy1 are mostly negative (positive) in relative terms. The soil temperature and moisture coupling with each energy and relevant significant areas are widely spread throughout the year and all seasons in the ANWC, and the coupling high-value areas are mainly concentrated around the basin.
Figure 10 to Figure 11 show the coupling distribution of each energy with R95P and R10day throughout the year and in each season. As mentioned before, the distributions of R95P and R10day are generally consistent regardless of the coupling states, the high-value areas, or the areas that pass the significance test. The various energies are also more strongly coupled to R95P. Therefore, here, we also mainly analyze R95P and take R10day as a reference, which has some missing lattice points.
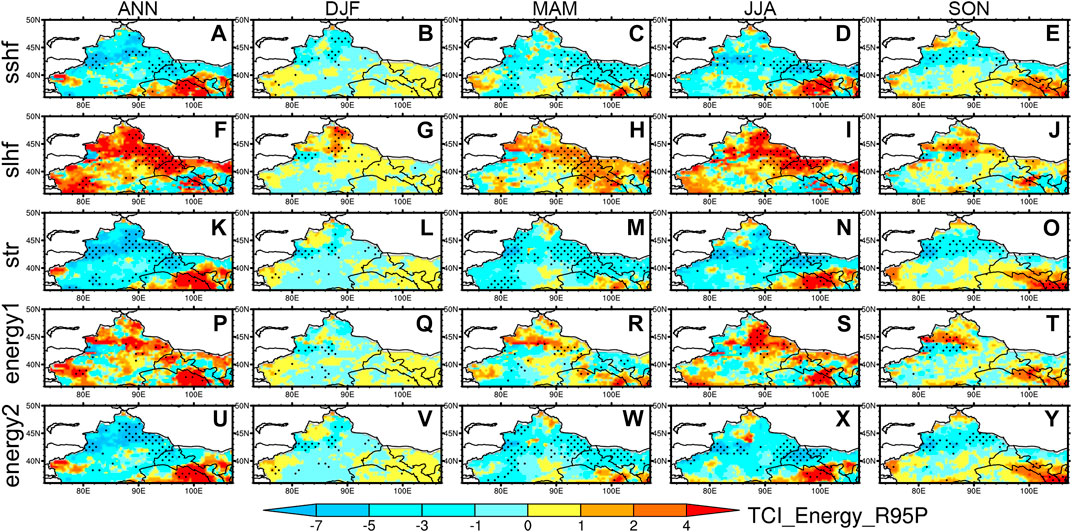
FIGURE 10. Spatial distributions of the annual and seasonal coupling index of sshf, slhf, str, energy1, and energy2 with R95P. The rest of the caption is the same as in Figure 6.
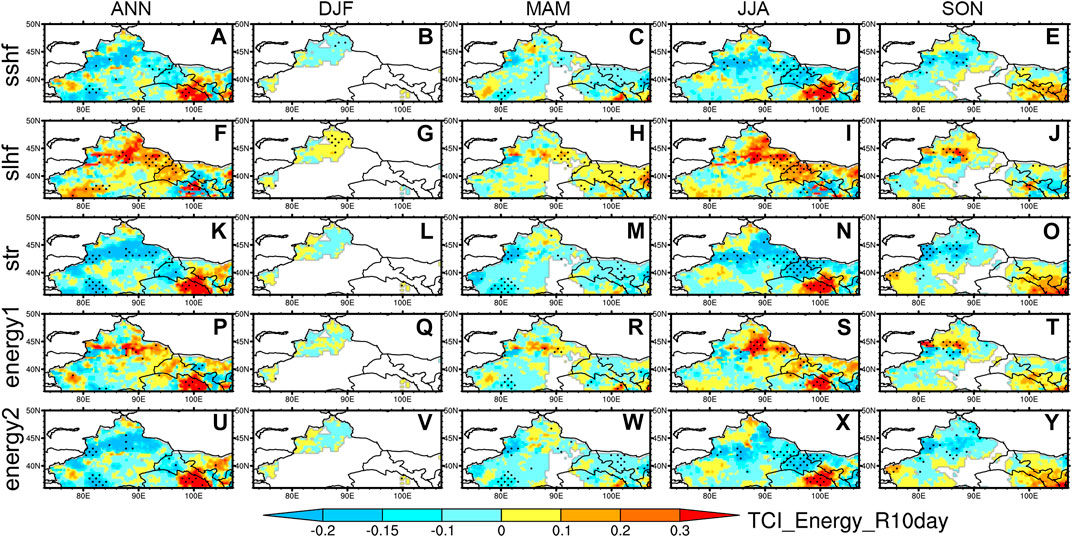
FIGURE 11. Spatial distributions of the annual and seasonal coupling index of sshf, slhf, str, energy1, and energy2 with R10day. The rest of the caption is the same as in Figure 6.
Annually, the coupling states of sensible heat flux (Figures 10A, 11A) and effective radiation (Figures 10K, 11K) with the extreme precipitation index are mainly negative. The coupling states of latent heat flux (Figures 10F, 11F) with the extreme precipitation index are mainly positive, except for a few positive coupling high-value areas near the QM and the westernmost part of Area B, which are almost opposite to those of sensible heat flux and effective radiation. The significant coupling areas of sensible heat flux and extreme precipitation index are mainly in Areas A and D, distributed along the TM and HB, with almost all negative coupling in Area A, mainly negative coupling in Areas B and C, and mainly positive coupling in Areas D and E. The overall coupling state of latent heat flux is negative only in Area E, and Areas A, B, and C are the most strongly coupled energy with extreme precipitation index. The significant coupling areas are located in Area A, Area D near the HB, and Area B near the Kunlun Mountains. The coupling state of effective radiation is similar to that of sensible heat flux, but the distribution of significant areas is similar to that of latent heat flux, and the strongest energy coupling with extreme precipitation is in Area E, while the negative (positive) coupling high-value area is in the TM (QM). The coupling related to energy1 (Figures 10P, 11P) has mixed positive and negative coupling states, but the positive coupling state is stronger in all regions, and the significant coupling areas are distributed in Areas A, B, and D. The coupling related to energy2 (Figures 10U, 11U) is more similar to sensible heat flux, and the coupling states are the same in all regions, but the significant coupling areas are similar to the effective radiation.
In winter, the significant area of sensible heat flux (Figures 10B, 11B) coupling is concentrated in Area A, and there is a small significant area of negative high-value coupling. The coupling state in Area B becomes positive, and some lattice grids of positive coupling state are interspersed in negative-coupling Areas A and C. The significant coupling area of latent heat flux (Figures 10G, 11G) is also mainly concentrated in Area A. Positive coupling high-value areas exist in the center of the AM and JB, negative coupling high-value areas exist in the TM, and most of them pass the significance test. The overall negative coupling status dominates in Areas B and C, and the rest are positive coupling. The coupling with effective radiation (Figures 10L, 11L) is concentrated in the TM and Area B. Except for Areas D and E, which are mainly positive coupling areas, there are also some positive coupling areas in the westernmost part of Areas A and B. The coupling with energy1 (Figures 10Q, 11Q) and the coupling of sensible heat flux are similar, and the negative coupling state is in both Areas A and C, but the positive coupling lattice grids appear more in Area A, and the significant areas are concentrated in the TM. The coupling with energy2 (Figures 10V, 11V) and the coupling of effective radiation are similar, the significant areas appear more in Areas A and C, and the significant areas are concentrated in the TM. The negative coupling in Areas A and C and the positive coupling in Areas D and E are stronger than the coupling of effective radiation, but the mean value of coupling in Area B is only -0.007, which is weaker than the coupling of effective radiation.
In summer, the significant areas of coupling of each energy with the extreme precipitation index become more concentrated, and the strength of coupling in each area is further strengthened than in spring. The significant areas of coupling with sensible heat flux (Figures 10D, 11D) start from the TM and extend to the east, which is also the main high-value negative coupling area. The QM is a positive coupling high-value area, and there are also a few significant areas, but the whole area is still dominated by a negative coupling state. The coupling with effective radiation (Figures 10N, 11N) is similar to sensible heat flux, but the overall coupling strength is stronger, the negative coupling high-value in Area A is more widely distributed, and the positive coupling state in Area C is less. The coupling with energy1 (Figures 10S, 11) is similar to latent heat flux, but the coupling strength is weakened, and the significant areas are mainly found only in Area A. The JB and QM are two positive coupling high-value areas. The coupling with energy2 (Figures 10X, 11X) is similar to effective radiation, with slightly reduced significant areas and weakened coupling strength, but a small positive coupling high-value area appears in the center of Area A.
In spring, the coupling significant areas for all energy increase and are concentrated in the TM and its southern area, mainly in Areas A, B, and D. In autumn, the coupling significant zone is mainly along the TM and is a negative coupling high-value area. When the latent heat flux (Figures 10J, 11J) and energy1 (Figures 10T, 11T) are coupled with the extreme precipitation index, the positive coupling high-value area also exists in the northern TM. When each energy is coupled with the extreme precipitation index, the QM is a high-value coupling area with a positive coupling state.
In general, the coupling strength of energy with extreme precipitation is stronger in the TM–HB–QM area than in other areas. The coupling between energy and extreme precipitation is more complex, and the strongest coupling of energy changes with seasonal and regional changes.
By combining the aforementioned coupling results, we calculate the regional mean values of each region for the whole year and each season, select the correlation variable with the largest absolute values of coupling values for each season in each region in turn, and organize them to obtain Table 2 and Table 3, which show the main paths in each region at annual seasonal scales.
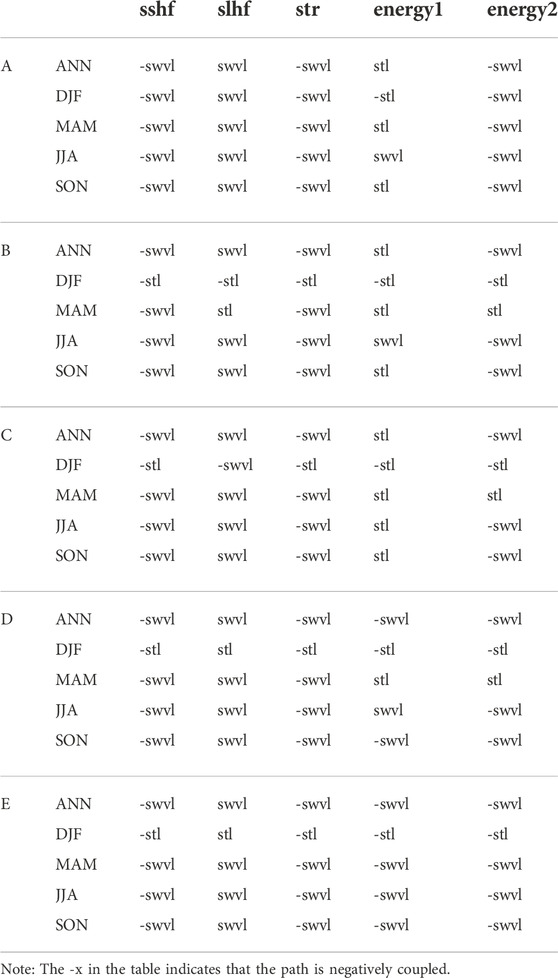
TABLE 2. Dominant ground variables of the whole year and four seasons in various regions.
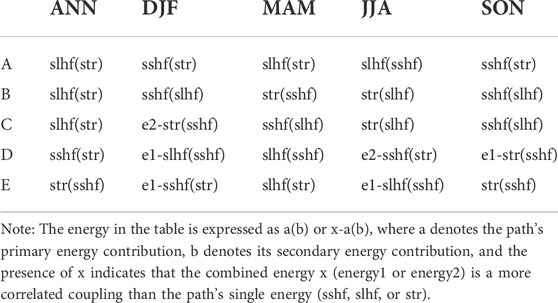
TABLE 3. Dominant energy of the whole year and four seasons in various regions.
Table 2 shows the land surface variables that are most strongly coupled to the five energy sources in the corresponding regions in each season. The -x in the table indicates that the path is negatively coupled. The energy in Table 3 is expressed as a(b) or x-a(b), where a denotes the path’s primary energy contribution, b denotes its secondary energy contribution, and the presence of x indicates that the combined energy x (energy1 or energy2) is a more correlated coupling than the path’s single energy (sshf, slhf, or str).
In coupling the land surface variable to energy (Table 2), the soil moisture is more strongly coupled to individual energy. The soil temperature is more strongly coupled to each energy only in winter, which is relatively more strongly coupled to energy1. At the same time, the coupling state between soil moisture and sensible heat flux, effective radiation, and energy2 is always negative.
The coupling of energy and extreme precipitation (Table 3) annually is dominated by latent heat flux and followed by effective radiation in Areas A, B, and C. Area D is dominated by sensible heat flux and followed by effective radiation, while Area E, on the contrary, is dominated by effective radiation and followed by sensible heat flux. In the four seasons, energy1 becomes dominant in the fall and winter in Area D and winter and summer in Area E. The energy2 dominates in winter in Area C and summer in Area D. Except for this, Areas A, D, and E are dominated by latent heat flux in spring. In summer, Areas B and C are dominated by effective radiation, followed by latent heat flux. Areas A, B, and C in fall and Areas A and B in winter are dominated by sensible heat flux.
Finally, combining Table 2 and Table 3, we obtain the two-step, coupling path schematic in Figure 12, which shows the most important two-step coupling paths in each region throughout the year and in each season. Through the schematic diagram, we can clearly see that the coupling between ground variables and energy is dominated by soil temperature only in the south of TM in winter, and the coupling state is negative. When soil moisture is the dominant variable, the coupling state also varies with season and region, and the overall negative coupling state is predominant. The coupling between energy and R95P, the dominant energy also changes with season and regions, which fully illustrates the complexity of ANWC topography and the diversity of landscapes.
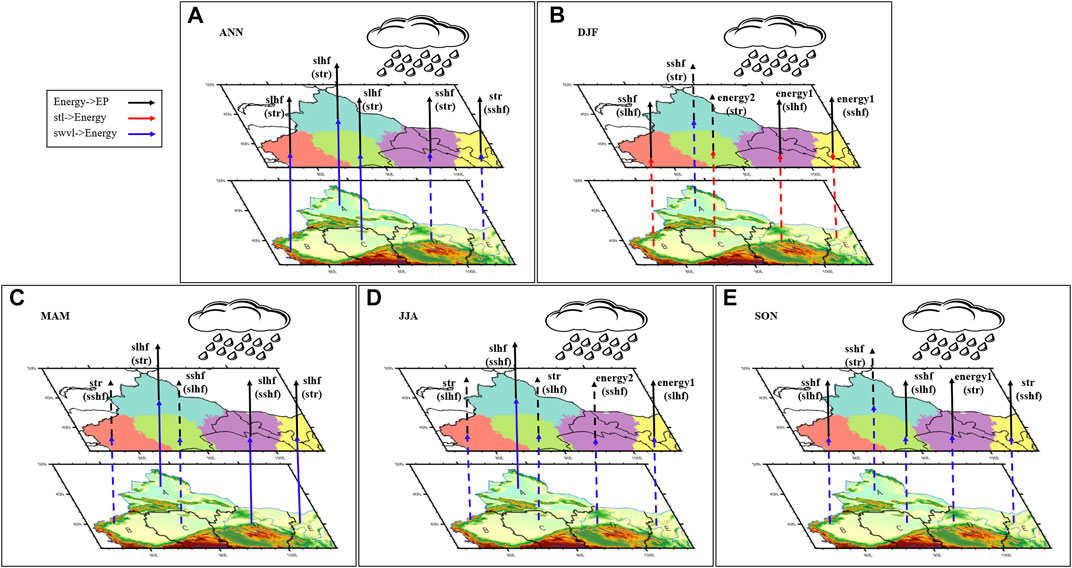
FIGURE 12. Two-step coupled paths throughout the year and seasons in the five regions. In the figure, the most important energy contribution source of the path is shown next to the path arrow, the secondary contribution amount is in parentheses, the different color arrows represent the different feedback paths, and the dotted arrow indicates that the main energy coupling state of the path is negative.
In this study, the extreme precipitation characteristics and the land‒atmosphere coupling effects of soil temperature and moisture and associated energy in the ANWC were analyzed by using CN05.1 and ERA5-land data from 1961 to 2018. We obtain the following conclusions:
1) The influence of extreme precipitation on total precipitation gradually increases both on an annual scale and in all seasons. The TM and QM, which are areas of high multiyear average rainfall, are also the regions with the fastest growth in extreme precipitation and extreme precipitation days and pass the α=0.05 level significance test. Significant growth areas also exist in the JB, HB, and along the headwaters of many rivers on the western side of Xinjiang. The extreme precipitation in summer is mainly due to the increase in the number of extreme precipitation days, and the increase in extreme precipitation in winter is mainly due to the increase in the precipitation amount of single extreme precipitation.
2) Through the EOF analysis of the annual variation in R95P and R10day, the first mode has consistent variation characteristics across the region, which are consistently increasing in terms of time coefficients. The second mode characteristics are the east‒west reverse variation, and the third mode characteristics show the middle and the around variations are opposite. R95P and R10day of the five regions show increasing trend characteristics. The fastest change is in Area A, and the slowest change is in Area C.
3) The coupling high-value area between soil temperature and moisture with the extreme precipitation index is still mainly in the TM and QM. The coupling of soil temperature (moisture) and extreme precipitation shows a positive coupling state in the TM, and the coupling in the QM is positive (negative). The coupling between soil temperature (moisture) and sensible heat flux, effective radiation, and energy2 are mostly positive (negative) in all regions. The coupling with latent heat flux and energy1 are mostly negative (positive) in relative terms. The soil temperature and moisture coupling with each energy and relevant significant areas are widely spread throughout the year and all seasons in the ANWC, and the coupling high-value areas are mainly concentrated around the basin.
4) Most areas in DJF are dominated by soil temperature with a negative coupling state. The remaining area is dominated by soil moisture and is almost always a negative coupling state in JJA and SON. The coupling strength of energy with extreme precipitation indices is stronger in the TM–HB–QM than in other areas, the coupling is more complex, and the dominant energy changes with seasonal and regional changes.
In the context of global warming, surface ecology has also changed considerably, which has had a dramatic impact on extreme precipitation. The enhanced evaporation from the surface and the consequent changes in surface heat sources affect extreme precipitation. Exploring the ground variables and energy impact pathways of ANWC throughout the year and seasons in various regions can not only help the research related to extreme precipitation but also guide the related ecological conservation, etc. After the coupling analysis is used to find the main ways in which extreme precipitation in the ANWC is affected by land surface processes, we will use the simulated data or regional downscaling model to further explore the mechanisms of land surface processes on extreme precipitation influence in the next step.
The datasets CN05.1 for this study can be found in the Climate Change Research Center (https://ccrc.iap.ac.cn/resource/detail?id=228). And ERA5-land can be found in the European Centre for Medium-Range Weather Forecasts (https://cds.climate.copernicus.eu/cdsapp#!/dataset/reanalysis-era5-land-monthly-means?tab=overview).
Conceptualization: SW, ZW. Methodology: SW, ZW. Formal analysis and investigation: SW, ZW, XL, and LM. Writing—original draft preparation: SW and ZW. Writing—review and editing: ZW, SW, XL, and LM. Funding acquisition: ZW.
This study is supported by the State Key Laboratory of Earth Surface Processes and Resource Ecology (2022-GS-01) and the National Natural Science Foundation of China (Grant No. 41875089).
The authors declare that the research was conducted in the absence of any commercial or financial relationships that could be construed as a potential conflict of interest.
All claims expressed in this article are solely those of the authors and do not necessarily represent those of their affiliated organizations, or those of the publisher, the editors and the reviewers. Any product that may be evaluated in this article, or claim that may be made by its manufacturer, is not guaranteed or endorsed by the publisher.
Brubaker, K. L., Entekhabi, D., and Eagleson, P. S. (1993). Estimation of continental precipitation recycling. J. Clim. 6 (6), 1077–1089. doi:10.1175/1520-0442(1993)006<1077:EOCPR>2.0.CO;2
Cai, Y., Song, M., Qian, Z., Wu, T. W., and Luan, C. (2015). Reanalyses of precipitation circulation and vapor transportation of severe dry and wet events in summer in arid region of Northwest China. Plateau Meteorol. 34 (3), 597–610. (in Chinese). doi:10.7522/j.issn.1000-0534.2015.00049
Chen, H., and Zhou, J. (2013). Impact of interannual soil moisture anomaly on simulation of extreme climate events in China. Part II: Sensitivity experiment analysis. Chin. J. Atmos. Sci. (in Chinese) 37 (1), 1–13. doi:10.3878/j.issn.1006-9895.2012.11048
Chen, H., Sun, J., and Fan, K. (2012). Decadal features of heavy rainfall events in eastern China. Acta Meteorol. Sin. 26, 289–303. doi:10.1007/s13351-012-0303-0
Chen, Y., Wang, H., Wang, Z., and Zhang, H. (2017). Characteristics of extreme climatic/hydrological events in the arid region of northwestern China. Arid Land Geography 40 (01), 1–9. (in Chinese). doi:10.13826/j.cnki.cn65-1103/x.2017.01.001
Chen, A., He, X., Guan, H., and Zhang, X. (2019). Variability of seasonal precipitation extremes over China and their associations with large scale ocean-atmosphere oscillations. Int. J. Climatol. 39, 613–628. doi:10.1002/joc.5830
Chen, C., Zhang, X., Lu, H., Jin, L., Du, Y., and Chen, F. (2021). Increasing summer precipitation in arid central Asia linked to the weakening of the East Asian summer monsoon in the recent decades. Int. J. Climatol. 41, 1024–1038. doi:10.1002/joc.6727
Dirmeyer, P. A. (2011). The terrestrial segment of soil moisture–climate coupling. Geophys. Res. Lett. 38, L16702. doi:10.1029/2011GL048268
Diro, G., Sushama, L., Martynov, A., Jeong, D., Verseghy, D., and Winger, K. (2014). Land-atmosphere coupling over North America in CRCM5. J. Geophys. Res. Atmos. 119, 11–995. doi:10.1002/2014JD021677
Donat, M. G., Oliver, A., and Ukkola, A. M. (2019). Intensification of precipitation extremes in the world's humid and water-limited regions. Environ. Res. Lett. 14 (6), 065003. doi:10.1088/1748-9326/ab1c8e
Hao, X., Haichao, H., and Zhang, J. (2021). Soil moisture influenced the variability of air temperature and oasis effect in a large inland basin of an arid region. Hydrological Processes 35 (6), 35. doi:10.1002/hyp.14246
Hirsch, A. L., Evans, J. P., Di Virgilio, G., Perkins-Kirkpatrick, S. E., Argüeso, D., Pitman, A. J., et al. (2019). Amplification of Australian heatwaves via local land-atmosphere coupling. J. Geophys. Res. Atmos. 124 (24), 13625–13647. doi:10.1029/2019JD030665
Hu, Q., and Feng, S. (2005). How have soil temperatures been affected by the surface temperature and precipitation in the Eurasian continent? Geophys. Res. Lett. 32 (14), 1–4. doi:10.1029/2005GL023469
Huang, H., Cui, H., and Ge, Q. (2021). Assessment of potential risks induced by increasing extreme precipitation under climate change. Nat. Hazards 108, 2059–2079. doi:10.1007/s11069-021-04768-9
Huggannavar, V., and Indu, J. (2020). Seasonal variability of soil moisture-precipitation feedbacks over India. Journal of Hydrology 589, 125181. doi:10.1016/j.jhydrol.2020.125181
IPCC (2021). Climate change 2021: The physical science basis. Contribution of working group I to the sixth assessment report of the intergovernmental panel on climate change. Cambridge: Cambridge University Press, 3–32. doi:10.1017/9781009157896.001
Joaquín, M-S., Dutra, E., Agustí-Panareda, A., Albergel, C., Arduini, G., Balsamo, G., et al. (2021). Era5-land: A state-of-the-art global reanalysis dataset for land applications. Earth Syst. Sci. Data 13, 4349–4383. doi:10.5194/essd-13-4349-2021
Kim, S., Eghdamirad, S., Sharma, A., and Kim, J. H. (2020). Quantification of uncertainty in projections of extreme daily precipitation. Earth and Space Science 7 (8), 1052. doi:10.1029/2019EA001052
Koster, R. D., Dirmeyer, P. A., Guo, Z., Bonan, G., Chan, E., Cox, P., et al. (2004). Regions of strong coupling between soil moisture and precipitation. Science 305, 1138–1140. doi:10.1126/science.1100217
Li, B., Pan, B., Cheng, W., Han, J., Qi, D., and Zhu, C. (2013). Research on geomorphological regionalization of China. Acta Geographica Sinica 68 (03), 291–306. doi:10.11821/xb201303001
Lorenz, R., Argüeso, D., Donat, M. G., Pitman, A. J., Hurk, B., Berg, A., et al. (2016). Influence of land-atmosphere feedbacks on temperature and precipitation extremes in the GLACE-CMIP5 ensemble. J. Geophys. Res. Atmos. 121, 607–623. doi:10.1002/2015JD024053
Lu, H., Hu, Z., Yu, H., Fan, W., Fu, C., and Wu, D. (2021). Changes of extreme precipitation and its associated mechanisms in northwest China. Adv. Atmos. Sci. 38 (10), 1665–1681. doi:10.1007/s00376-021-0409-3
Martha, M. V., Zscheischler, J., and Seneviratne, S. I. (2018). Varying soil moisture–atmosphere feedbacks explain divergent temperature extremes and precipitation projections in central Europe. Earth Syst. Dynam. 9 (3), 1107–1125. doi:10.5194/esd-9-1107-2018
Ning, G., Luo, M., Zhang, Q., Wang, S., Liu, Z., Yang, Y., et al. (2021). Understanding the mechanisms of summer extreme precipitation events in Xinjiang of arid northwest China. JGR. Atmospheres 126 (15). doi:10.1029/2020JD034111
Peng, Y., Zhao, X., Wu, D., Tang, B., Xu, P., Du, X., et al. (2018). Spatiotemporal variability in extreme precipitation in China from observations and projections. Water 10 (8), 1089. doi:10.3390/w10081089
Santanello, J. A., Roundy, J., and Dirmeyer, P. A. (2015). Quantifying the land–atmosphere coupling behavior in modern reanalysis products over the u.s. southern great plains. Journal of Climate 28 (14), 5813–5829. doi:10.1175/JCLI-D-14-00680.1
Schumacher, D. L., Keune, J., Dirmeyer, P., and Miralles, D. G. (2022). Drought self-propagation in drylands due to land–atmosphere feedbacks. Nat. Geosci. 15, 262–268. doi:10.1038/s41561-022-00912-7
Schwingshackl, C., Martin, H., and Sonia, I. (2017). Quantifying spatiotemporal variations of soil moisture control on surface energy balance and near-surface air temperature. Journal of Climate 30 (18), 7105–7124. doi:10.1175/JCLI-D-16-0727.1
Seneviratne, S. I., Corti, T., Davin, E. L., Hirschi, M., Jaeger, E. B., Lehner, I., et al. (2010). Investigating soil moisture–climate interactions in a changing climate: A review. Earth-Science Reviews 99 (3-4), 125–161. doi:10.1016/j.earscirev.2010.02.004
Shen, D., and Chen, H. (2018). Possible linkage between spring extreme precipitation over East China and surface sensible heat flux over the Eurasian Continent. Climatic and Environmental Research (in Chinese) 23 (1), 103–112. doi:10.3878/j.issn.1006-9585.2017.16226
Shi, Y., Shen, Y., and Hu, R. (2002). Impact and foreground of climatic shift from warm-dry to warm-humid in northwest China. Journal of Glaciolgy and Geocryology 24 (3), 219–226. doi:10.3969/j.issn.1000-0240.2002.03.001
Shi, P., Yang, T., Xu, C., Yong, B., Shao, Q., Li, Z., et al. (2017). How do the multiple large-scale climate oscillations trigger extreme precipitation? Global and Planetary Change 157, 48–58. doi:10.1016/j.gloplacha.2017.08.014
Song, L., and Zhang, C. (2003). Changing features of precipitation over Northwest China during the 20th century. Journal of Glaciology and Geocryology (in Chinese) 02, 143–148. doi:10.3969/j.issn.1000-0240.2003.02.005
Song, Y., Huang, A., and Chen, H. (2022). The storage of antecedent precipitation and air temperature signals in soil temperature over China. Journal of Hydrometeorology 23 (3), 377–388. doi:10.1175/JHM-D-21-0126.1
Sun, J., and Zhang, F. (2017). Daily extreme precipitation and trends over China. Sci. China Earth Sci. 60, 2190–2203. doi:10.1007/s11430-016-9117-8
Wang, J., Ding, J., Ge, X., Qin, S., and Zhang, Z. (2022). Assessment of ecological quality in Northwest China (2000–2020) using the Google Earth Engine platform: Climate factors and land use/land cover contribute to ecological quality. J. Arid Land 14, 1196–1211. doi:10.1007/s40333-022-0085-x
Williams, I N. (2019). Evaluating soil moisture feedback on convective triggering: Roles of convective and land-model parameterizations. J. Geophys. Res. Atmos. 124 (1), 317–332. doi:10.1029/2018JD029326
World Economic Forum (2021). The global risks report 2021:16th edition. Davos, Switzerland: Weforum.Org. Available at: https://www.weforum.org/reports/the-global-risks-report-2021.
Wu, J., and Gao, X. J. (2013). A gridded daily observation dataset over China region and comparison with other datasets. Chinese Journal of geophysics (in Chinese) 56 (4), 1102–1111. doi:10.6038/cjg20130406
Xue, Y., Diallo, I., Li, W., David Neelin, J., Chu, P. C., Vasic, R., et al. (2018). Spring land surface and subsurface temperature anomalies and subsequent downstream late spring-summer droughts/floods in North America and East Asia. J. Geophys. Res. Atmos. 123, 5001–5019. doi:10.1029/2017JD028246
Yang, Y., Yang, Q., Wang, Z., and Lu, Z. (2021). A study of spatial and temporal distribution of land-atmosphere coupling strength in China. Journal of Arid Meteorology (in Chinese) 39 (3), 374–385. doi:10.11755/j.issn.1006-7639(2021)-03-0374
Zhang, X., Alexander, L., Hegerl Gabriele, C., Jones, P., Tank, A. K., Peterson, T. C., et al. (2011). Indices for monitoring changes in extremes based on daily temperature and precipitation data. WIREs Clim. Change 2, 851–870. doi:10.1002/wcc.147
Zhang, R., Liu, L., and Zuo, Z. (2016). Variations of soil moisture over China and their influences on Chinese climate. Chinese Journal of Nature (in Chineses) 38 (05), 313–319. doi:10.3969/j.issn.0253-9608.2016.05.001
Zhang, M., Yang, X., Ren, L., Pan, M., Jiang, S., Liu, Y., et al. (2021). Simulation of extreme precipitation in four climate regions in China by general circulation models (GCMs): Performance and projections. Water 13 (11), 1509. doi:10.3390/w13111509
Zhou, J., and Chen, H. (2012). Impact of interannual soil moisture anomaly on simulation of extreme climate events in China. Part I: Model evaluation of CAM3.1. Chinese Journal of Atmospheric Sciences (in Chinese) 36 (6), 1077–1092. doi:10.3878/j.issn.1006-9895.2012.11047
Zhou, S., Williams, A. P., Berg, A. M., Cook, B. I., Gentine, P., Hagemann, S., et al. (2019). Land–atmosphere feedbacks exacerbate concurrent soil drought and atmospheric aridity. Proc. Natl. Acad. Sci. U. S. A. 116 (38), 18848–18853. doi:10.1073/pnas.1904955116
Keywords: land-atmosphere coupling, soil temperature and moisture, arid region, extreme precipitation, Northwest China
Citation: Wu S, Wei Z, Li X and Ma L (2023) Land‒atmosphere coupling effects of soil temperature and moisture on extreme precipitation in the arid regions of Northwest China. Front. Earth Sci. 10:1079131. doi: 10.3389/feart.2022.1079131
Received: 25 October 2022; Accepted: 21 November 2022;
Published: 20 January 2023.
Edited by:
Andreas Franz Prein, National Center for Atmospheric Research (UCAR), United StatesCopyright © 2023 Wu, Wei, Li and Ma. This is an open-access article distributed under the terms of the Creative Commons Attribution License (CC BY). The use, distribution or reproduction in other forums is permitted, provided the original author(s) and the copyright owner(s) are credited and that the original publication in this journal is cited, in accordance with accepted academic practice. No use, distribution or reproduction is permitted which does not comply with these terms.
*Correspondence: Zhigang Wei, d3pnQGJudS5lZHUuY24=
Disclaimer: All claims expressed in this article are solely those of the authors and do not necessarily represent those of their affiliated organizations, or those of the publisher, the editors and the reviewers. Any product that may be evaluated in this article or claim that may be made by its manufacturer is not guaranteed or endorsed by the publisher.
Research integrity at Frontiers
Learn more about the work of our research integrity team to safeguard the quality of each article we publish.