 Alexandra Lima Tavares1
 Renato Oliveira Da Silva Jr2*Alexandre Melo Casseb Do Carmo3Gabriel Caixeta Martins2Wilson Da Rocha Nascimento Jr2Douglas Batista Da Silva Ferreira2Marcio Sousa Da Silva2Carlos Eduardo Aguiar De Souza Costa4
 Paulo Rógenes Pontes2
 Renata Gonçalves Tedeschi2
- 1Climatempo (StormGeo), Rua José Antônio Coelho, São Paulo, Brazil
- 2Vale Institute of Technology Sustainable Development—ITV DS, Belém, Pará, Brazil
- 3Institute of Geosciences, Federal University of Pará—UFPA, Belém, Pará, Brazil
- 4Faculty of Sanitary and Environmental Engineering, Federal University of Pará—UFPA, Tucuruí, Pará, Brazil
In the present study, hourly wind direction and speed data from six subregions along the Itacaiúnas River watershed (IRW), Eastern Amazon, are analyzed over a 1-year period. The data are acquired from six hydrometeorological stations located in areas of the IRW with different characteristics of land use and plant cover. Among the stations studied, Serra Leste (mine to pasture transition) stands out, with prevailing winds from the Southeast and the East-Southeast, in addition to higher wind speeds. In contrast, at the Salobo (forest) station, the lowest wind speeds are observed, and this station presents the highest percentage of calm winds (60%) in the series. In the analysis of the daytime (from 6 a.m. to 5 p.m.) and nighttime (from 6 p.m. to 5 a.m.) wind cycles, the breeze and mesoscale circulation system are identified. Predominantly northerly winds are observed acting on the Abadia Farm and IFPA Rural (Federal Institute of Education, Science and Technology of Pará) stations, both during the day and at night, overlapping with the local breeze effects. Daily (24 h) and associated breeze circulation (12 h) cycle frequency signals are identified through wavelet transform analyses of the wind for all stations. The interference from large-scale phenomena, such as the Intertropical Convergence Zone (ITCZ) and the South Atlantic Convergence Zone (SACZ), which operate in the region, is evident. Finally, the data show that the differences in wind patterns are also due to environmental aspects such as plant cover, land use, and topography.
1 Introduction
The characterization of spatial and temporal patterns of wind is essential to several sectors, including energy, urban climate, and applied meteorology (Correia Filho et al., 2022). In addition, wind data are used in the calculation of hydrological models, with the objective of assessing the impacts of changes in land cover on the water balance of the Itacaiúnas River Basin, providing insights into the management of water resources (Pontes et al., 2019).
In the context of environmental risk, studying wind transport allows us to understand the potential for mass dispersion, such as gaseous pollutants, in a given region. In this way, Ye et al. (2019) found that the modulation between large-scale atmospheric circulation and regional transport explained the wet deposition of mercury in an urban environment from anthropogenic emissions outside the state of New York. In another study, Quaghebeur et al. (2019) observed high concentrations of arsenic from the interaction between rain and the roof in a rainwater harvesting system on the outskirts of Poopó Lake in Oruro, Bolivia, and reported that the source of arsenic in the dust may be natural, related to mining, or both.
In Brazil, the Itacaiúnas River Watershed (IRW), which is located in the Eastern Amazon (Figure 1), brings together urban areas, farms, forests, and mining activity. Hypothetically, the elaboration of strategic plans for production and security of productive sectors such as agrarian, mining and public management should include prior knowledge about regional wind transport since the propagation of all types of matter, such as plumes of smoke, gases, and dust, depends mainly on the trajectory of the prevailing winds and their intensity, which can vary considerably between seasons. In this context, Tavares and Silva Júnior (2019) discussed the role of regional circulation from a mining area in the municipality of Canaã dos Carajás in the state of Pará, Brazil, to understand the wind field in order to make immediate decisions regarding the supposed aerial displacement of pollutants to urbanized areas. The authors found that during the period studied, the predominant wind directions were Northeast (NE) and Southeast (SE); therefore, no pollutants were transported to urban regions.
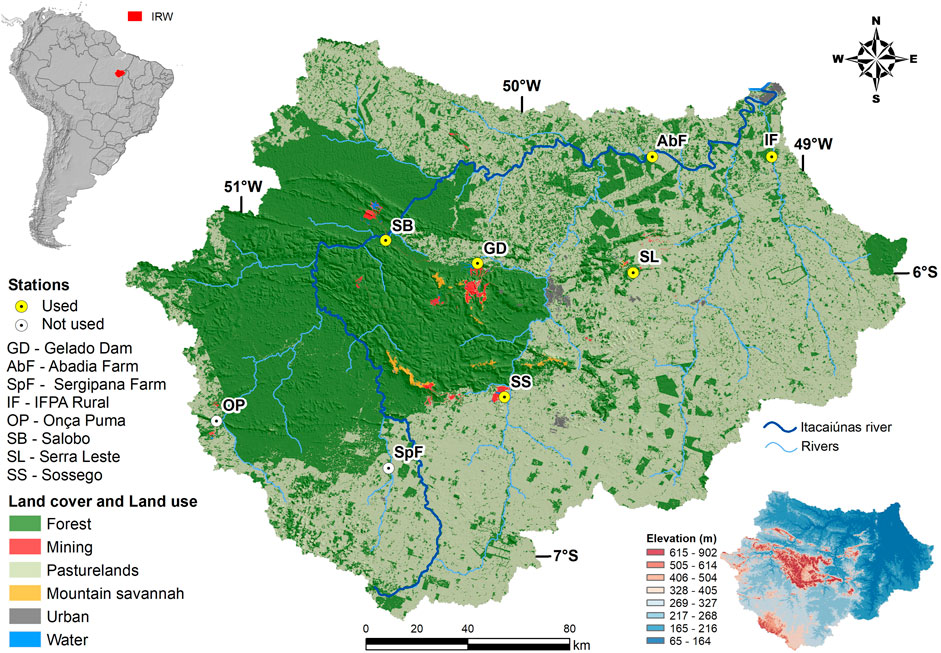
FIGURE 1. Map of the Itacaiúnas River Basin (IRW), including main drainage and altimetry. The highlighted points represent the location of the hydrometeorological stations under study: Fazenda Abadia (AbF), IFPA (Federal Institute of Education, Science and Technology of Pará) Rural (IF), Gelado Dam (GD), Serra Leste (SL), Salobo (SB) and Sossego (SS).
Atmospheric circulation in the IRW region, presents variability caused by the composition of multiple-scale (space and time) phenomena, including local storms, squall lines, and the intertropical convergence zone (ITCZ) (Cohen et al., 1995; De Souza et al., 2017). In these cases, advanced studies on the theme of atmospheric variability (hereafter frequencies or periodicities) have successfully used the wavelet transform (WT) technique, which identifies the dominant periodicities and their interactions with other frequencies in a time series. Studies such as these are important in supporting environmental diagnoses, in addition to providing knowledge of small-scale mechanisms that influence local circulation and the regional climate (Bitencourt et al., 2016). Thus, the WT has been used in several studies on atmospheric phenomena (Echer et al., 2008; Blain and Kayano 2011; Moura and Vitorino, 2012; Vilani and Sanches, 2013; Rocha et al., 2018; Rocha et al., 2019), hydrological systems (Sassi et al., 2011; Santos et al., 2013; Guo et al., 2015; Sun et al., 2016), and tidal studies (Danial et al., 2019).
Knowledge of the variability of local systems, such as breezes and topographical forcing, is important when acquired during periods when the effects of the El Niño-Southern Oscillation (ENSO) are not present. Studies indicate that this large-scale phenomenon interferes with the local wind field (Berg et al., 2013; Mohammadi and Goudarzi, 2018). Watts et al. (2017) assessed the impact of ENSO on the wind speed used for energy production. They concluded that in the Canela area of Chile, El Niño significantly decreases the wind speed and energy generation from September to December, while La Niña increases these parameters in the same months.
The aim of this study is to describe the space-temporal variability of the local wind circulation considering six distinct areas, into same river watershed: forest, pasture, and the transitions forest/pasture (two areas), urban/pasture and mine/pasture. It is important to highlight that, to achieve this objective, we used data observed through six automatic meteorological stations strategically distributed in a 42,000 km2 area watershed in the Eastern Amazon region (Figure 1).
2 Materials and methods
2.1 Characterization of the study area
The IRW is located between the geographic coordinates 05° 10′ and 07° 15′ S (latitude) and 48° 37′ and 51° 25′ W (longitude) in the Eastern Amazon, located in the Tocantins-Araguaia watershed region (CNRH, 2003) (Figure 1). The IRW drains an area of approximately 42,000 km2 with marked relief at altitudes ranging from 80 m to 900 m; the Carajás Mountain Range (400 m–900 m) stands out (Figure 1). This mountain range presents two types of predominant soil cover: tropical forest and mountain savannah. However, in the last 40 years, there has been a significant process of conversion of native vegetation to extensive pastures, which surround forest remnants, as well as indigenous lands and conservation units protected by law, occupying 11,700 km2 and correspond to approximately one-fourth of the watershed area (Souza Filho et al., 2016; Silva Júnior et al., 2017a; Silva Júnior et al., 2017b).
The climate in the region is typical of monsoons, corresponding to tropical rainy conditions (hot and humid), with a mean air temperature above 26°C (INMET, 1992; Alvares et al., 2013). Because this region is located in the equatorial zone, the incident solar radiation on the surface is more intense than that observed in the extra tropics. This radiation leads to the production of intense fluxes of sensible heat and latent heat from the surface to the atmosphere and directly contributes to the generation of deep convection and, consequently, a large amount of rainfall (Sodré et al., 2015). The amplitude of the mean monthly temperature in the state of Pará suffers small variations, on the order of 1°C–2°C. Specifically, in the IRW region, the mean recorded value is 27.2°C, and the lowest annual temperature is 26.6°C, which occurs in January, while the highest annual temperature is 28.1°C and is observed in September (Tavares et al., 2018).
Pluviometry in the basin region presents two well-defined seasons, rainy, and dry, popularly known as Amazonian winter and summer, respectively (Lopes et al., 2013). The rainy season (November to May) and dry season (June to October) present annual accumulated precipitation varying between 1,800 mm and 2,300 mm, in the rainy season, and between 10 mm and 350 mm during the dry season (Moraes et al., 2005; Silva Junior et al., 2017a; Silva Junior et al., 2017b).
In the dry period, the rainfall regime is associated with the influence of frontal systems, responsible for convective activity in the Eastern Amazon (De Souza et al., 2017). Tavares et al. (2018), studied the climate indicators in the IRW, demonstrating that the rainy season covered the 4 months, from January to April, in the area of influence of three of the six stations in this study. During the rainy season in Eastern Amazonia, the main meteorological system acting in the rainfall regime is the ITCZ convective cloud cover band.
2.2 Data
The data used for the present study were obtained from six hydrometeorological stations monitored by the Instituto Tecnológico Vale Desenvolvimento Sustentável (Vale Institute of Technology Sustainable Development—ITV DS). These stations were installed in July 2014 as part of a project to monitor time and water resources in the IRW region. This monitoring network corresponds to eight hydrometeorological stations and 23 measurement points of the level and flow rates of the main drainages. The stations were installed in different areas of land use and cover, such as forest, pasture, forest/pasture transition, mine/pasture transition and urban/pasture transition, namely, Abadia Farm (AbF), IFPA Rural (IF—Instituto Federal de Educação, Ciência e Tecnologia do Pará), Gelado Dam (GD), Serra Leste (SL), Salobo (SB), and Sossego (SS) (Table 1), to observe the behavior of atmospheric variables in different environments and soil/atmosphere interactions.
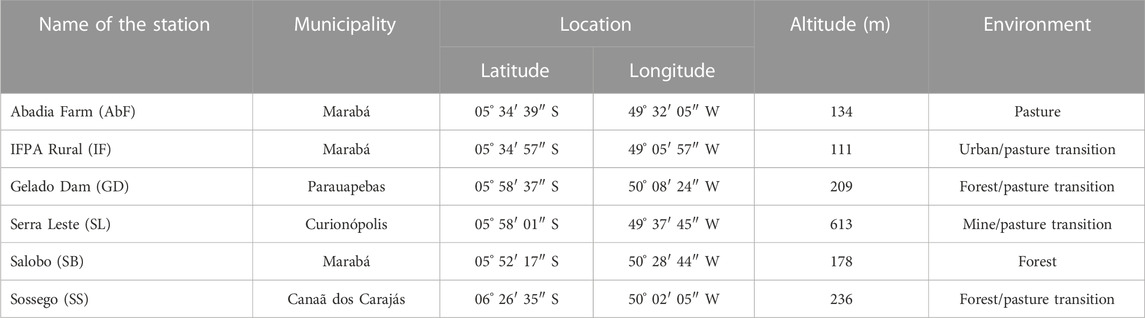
TABLE 1. ITV stations with respective locations and characteristics.
We used hourly data from 2017 consisting of the wind direction and speed from six hydrometeorological stations of the ITV. The study focuses only on one annual cycle using six of the eight stations because of data availability. The year 2017 was chosen for analysis because of the need to evaluate a neutral year, i.e., a year in which there were no climate variability mode. The wind speed and direction were recorded by a Wind Monitor MA sensor (model 05106) from R. M. Young, which was installed in the tower of the stations at a height of 10 m.
To verify the predominance of the direction and the mean speed of the winds in each hydrometeorological station under study, the wind rose was prepared for 2017 using WRPLOT View software, which is available free of charge for download at https://www.weblakes.com/products/wrplot/index.html and was developed by Lakes Environmental. This methodology has been successfully used in similar studies on wind patterns (Mattiuzzi and Marchioro, 2012; Pimentel et al., 2014; Bitencourt et al., 2016).
2.3 Wavelet transform
The analysis of the high-temporal resolution of the wind speed variability was performed using the WT. For this, we generated graphs using the statistical program PAST (Paleontological Statistics) version 3.25 (Hammer et al., 2001), which is available free for download at https://folk.uio.no/ohammer/past/.
The WT is a widely used tool for the analysis of time series; it provides the decomposition of a non-stationary time and frequency series, allowing the identification of the dominant modes of variability and how they vary over time (Torrence and Compo, 1998; Echer et al., 2008; Rocha et al., 2019).
Conceived by Morlet and Grossmann, the term “wavelets” refers to a set of functions in the form of waves generated by dilations ψ(t) → ψ(2t) and translations ψ(t) → ψ(t + 1) of a function ψ(t), which is quadratically integrable over the real field or space [L2(R)] and has finite energy. The function ψ(t) is called the “mother wavelet”, while the dilated and translated functions derived from the mother wavelet are simply called “wavelets” (Weng and Lau, 1994; Reboita, 2004; Vitorino et al., 2006). The wavelet function is defined as follows:
where a is the dilation, which determines the wavelet oscillation frequency and length; b is the translation, which determines its displacement position; and t is the time function. The transformation of f(t) into continuous wavelets is as follows:
where Wψf is the wavelet transform of the function f(t), which is the series to be analyzed by the mother wavelet function. The coefficient
Several functions are used to generate wavelets (Daubechies, 1992; Foufoula-Georgiou and Kumar, 1994). In the present study, the Morlet wavelet function was used because it is a complex function and has characteristics similar to those of meteorological signals, such as symmetry or asymmetry and abrupt or smooth temporal variation (Silva, 2017). The literature reports that this is a criterion for choosing the wavelet function (Weng and Lau, 1994; Morettin 1999; Vitorino et al., 2006; Silva, 2017). This function has the following form:
where t refers to the time period or time scale studied and
3 Results
Figure 2 summarizes wind speeds recorded during 2017 at each hydrometeorological station for daytime (from 6 a.m. to 5 p.m.) and nighttime (from 6 p.m. to 5 a.m.) periods. Regardless of the hydrometeorological station, the wind speed during the nighttime period tends to be lower than that measured during the daytime period. However, it is noteworthy that at the same weather station, in both periods, the wind speed has a similar range.
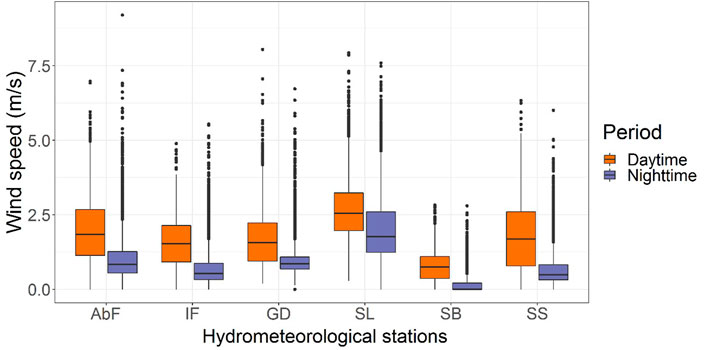
FIGURE 2. Boxplot of the wind speed for stations Abadia Farm (AbF), IFPA Rural (IF), Gelado Dam (GD), Serra Leste (SL), Salobo (SB), and Sossego (SS). The horizontal line (inside the box) represents the median.
At station SL, for the daytime period, the mean wind speed is 2.66 ± .99 m/s (.28–7.93 m/s), and 75% of the observations are values lower than 3.23 m/s. In contrast, at the SB station, for the same period, a mean wind speed of .7 ± .49 m/s (0–2.83 m/s) is observed, and 75% of the observations are values lower than 1.1 m/s.
The prevailing wind patterns in the region show the composition in the wind rose for each of the stations, simultaneously indicating the frequency of occurrences and their respective intensities (Figure 3). The data for AbF (Figure 3A) and IF (Figure 3B) show preferred winds from North-Southwest (N-SW) and from North-North-Northeast (N-NNE), respectively. The highest frequencies of wind direction at the GD station (Figure 3C) are North-Northeast (NNE) and South-Southwest (S-SW), with the highest most frequent speeds between 3.5 m/s and 5.0 m/s.
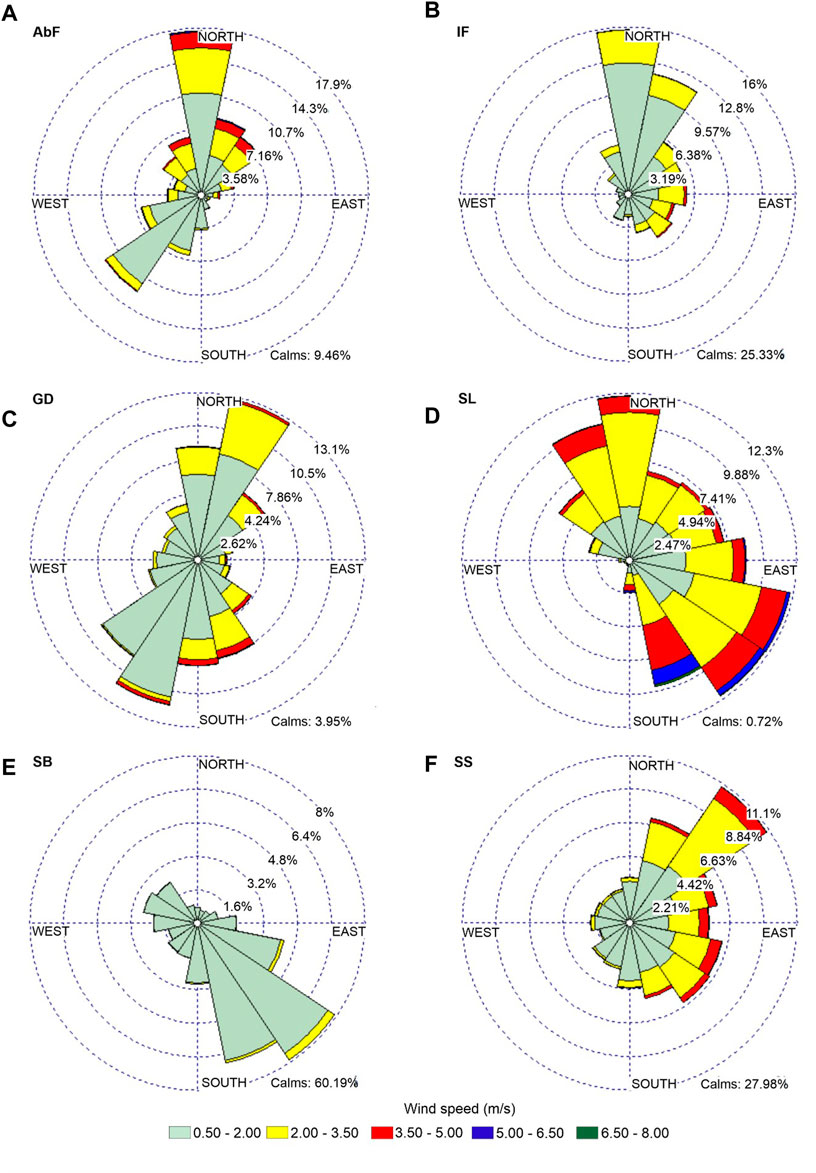
FIGURE 3. Distribution of the wind frequency for the stations: (A) Abadia Farm (AbF), (B) IFPA Rural (IF), (C) Gelado Dam (GD), (D) Serra Leste (SL), (E) Salobo (SB), and (F) Sossego (SS). The predominant wind direction and speed for each station throughout 2017 are also shown. “Calm” is reported when the average wind speed is less than 1 kn, from 0 to .2 m s-1 (WMO 2017).
The data for the SL station (Figure 3D) show a higher frequency of Southeast (SE) and East-Southeast (ESE) direction winds and more intense and frequent winds than the other stations. In contrast, station SB is characterized by the highest percentage of calm in relation to the total records in its wind time series, reaching a total of approximately 60% (Figure 3E).
In AbF, the predominance of winds during the day is N and NE, with few frequencies of SW (Figure 4A). At night, there are much more frequent SW winds. However, the predominance of N winds remains at night (Figure 4B).
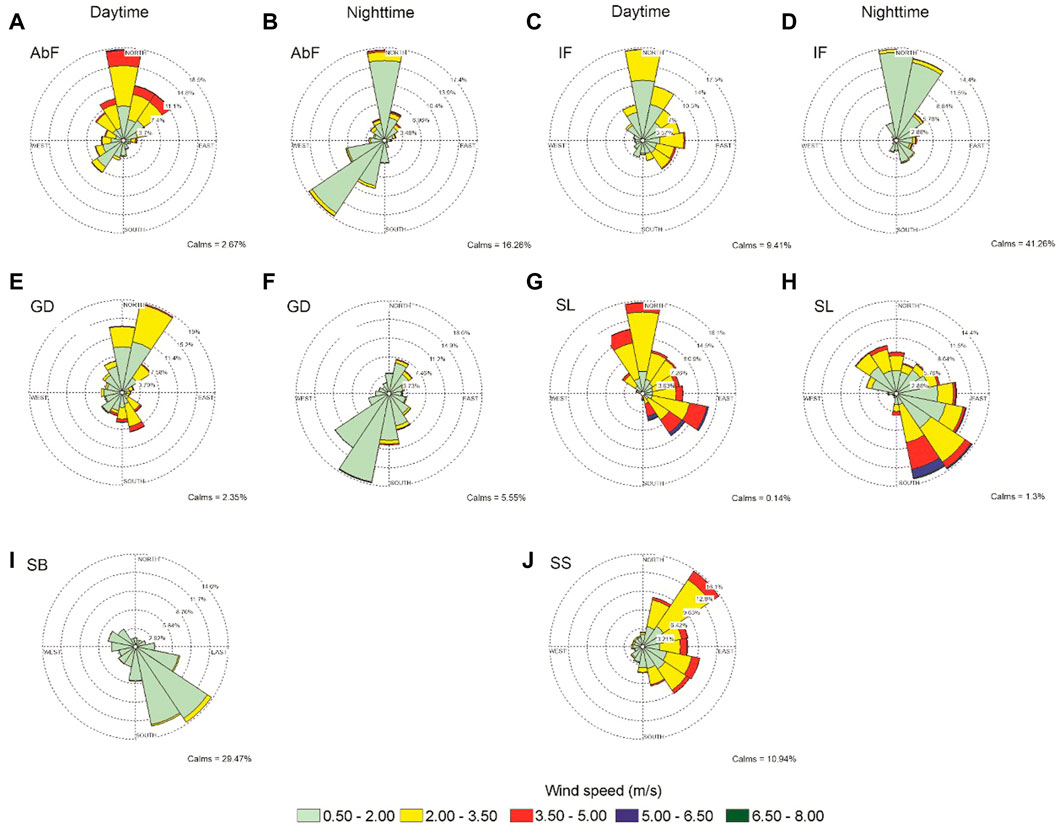
FIGURE 4. Distribution of the wind frequencies of the stations: (A,B) Abadia Farm (AbF), (C,D) IFPA Rural (IF), (E,F) Gelado Dam (GD), (G,H) Serra Leste (SL), (I) Salobo (SB), and (J) Sossego (SS). The predominant wind direction and speed during the daytime and nighttime periods. “Calm” is reported when the average wind speed is less than 1 kn, from 0 to .2 ms−1 (WMO 2017).
Hourly WT analyses are applied to the three-dimensional (scale, time, and energy intensity) components of the mean wind speed during 2017. In the present study, the x-axis shows the temporal length (in days) of the series, corresponding to a year of hourly data and totaling 8,760 h, and the y-axis represents the frequency (in hours) of the phenomena, i.e., the multiple frequencies that exist in the result. At all stations, there is a frequency between 16 h and 32 h with more intense signals in the center of the data period, which corresponds to the daily wind cycle (24 h).
4 Discussion
The prevailing wind patterns in the region (wind speed and wind direction) were influenced by differences in land cover, land use and topography. For example, the SL station present higher frequency of Southeast (SE) and East-Southeast (ESE) direction winds and more intense and frequent winds than the other stations, which is possibly associated with the topographic aspect; the SL station is located at a high altitude (613 m) in relation to the other stations in this study, in addition to being located in a mine/pasture transition area. The highest percentage of calm recorded in station SB may be because it is in a forested area, where two factors can contribute to these results: a) a weak horizontal temperature gradient at the surface, common in wooded areas, and b) the very roughness of the forest that imposes a natural reduction in wind speed. Dos Santos et al. (2013) carried out a study in a dense tropical forest in the Amazon and found that the temperature at the top of the canopy gradually decreases to ground level, with a redistribution of energy throughout the day, important factors that characterize the vertical and horizontal fluxes and modulate the forest microclimate.
The predominance of winds is also influenced by other factors. The same is true for AbF station, in which the Northern Flow, both during the day and at night, may be associated with a larger scale segment, probably of a mesoscale circulation. According to Figures 4C, D and considering that the IF station is located east of the AbF station (Figure 1), the same flux of N is observed acting on these stations. This corroborates the existence of a predominant flux on a larger scale that overlaps the local effects of heating and cooling, daytime and nighttime, producing circulating breezes. On the other hand, the GD station is in a more isolated orographic condition (Figure 1), with predominant N winds. In the GD station, the local effect of the breeze is pronounced because during the day, the predominance is N-NE (Figure 4E), and at night, it decreases in frequency and its direction is reversed, switching to S-SW (Figure 4F), with weaker winds between .5 and 2 m s−1.
The SL station is located between a higher region in the North and lower in the South (Figure 1), with predominant winds in the North during the day (Figure 4G). At night, there are more intense prevailing winds from SE and S-SE (Figure 4H) because when the winds blow from the SE, there are no barriers, while N winds are intercepted by the relief of the highest part of the mountain. Therefore, there is a local breeze system. The predominant winds at the SB station region during the day are SE and weak winds because SB is in an area of forest (Figure 4I). During the night, the winds become weaker and often negligible. The same is true for the frequency of nighttime winds at the SS station (Figure 4J).
In the WT analysis, the continuous line in the shape of a cone varying in both axes of graphics, which is called the cone of influence, encompasses areas with significant variances at a 95% level; i.e., the periods outside this cone should be disregarded because they do not have adequate statistical confidence (Vilani and Sanches, 2013). The highest frequencies are at the top of the y-axis, and low frequencies are found at the bottom of the graph (Figures 6A–E). It is possible to observe the signal between 8 h and 16 h, in which the wind variability is on the order of 12 h; i.e., every day and every 12 h during the dry period (June to October), there is a dominant variability in the wind field. It is suggested that this signal is associated with local breeze circulation. Teague et al. (2014), using wavelet analysis, identified a wind force associated with the sea breeze in the medium circulation of the Northwestern Gulf of Mexico, Texas. Likewise, in another study carried out on the southwest coast of Portugal, greater wind speed energy was observed in the daytime period in the analysis of wavelets (Morlet) (Lamas et al., 2017).
Regarding the frequency between 16 h and 32 h present in all stations, it is noted that these signals are weak at the beginning of the year due to the interference of larger-scale phenomena in the rainy season, while during the dry season the daily wind cycle strengthens, becoming more prominent. The dynamics of large-scale phenomena, such as ITCZ and SACZ, may be the explanation for the attenuation of this signal during the rainy season. De Souza et al. (2017), studying the climatic patterns of precipitation in the Eastern Amazon, suggests that both ITCZ and SACZ are the main responsible for the increase in rainfall volumes, when present over the region. These phenomena produce extensive cloud cover and frequent storms (De Souza et al., 2005; De Souza and Rocha 2006; Ferreira et al., 2015; Santos et al., 2015; De Souza et al., 2017; Zeri et al., 2018). Therefore, the highest frequency of intense rain and gusts is expected in the entire region under study. Thus, we strongly suggest that during the rainy season in the region, the circulation of local breeze is attenuated due to the combined effect of two forcings: the attenuation of insolation, due to the increase in cloudiness, which weakens the surface temperature gradient between forests, pastures and cities; and the increase in rainfall volumes characteristic of storms produced more frequently as a result of the presence of the ITCZ and/or SACZ. In addition, we cannot avoid considering that the large-scale flow may also be modulating the microscale wind variability.
This study corroborates with that carried out by Oliveira and Costa (2011), who found important changes in the behavior of the wind due to the influence of the ITCZ and the anomalies of Sea Surface Temperature (SST), as well as strong events of El Niño and La Niña in Northeast Brazil. Pascual et al. (2010) analyzed the connections between the wind speeds and the large-scale atmospheric field. These authors showed that large-scale atmospheric patterns dominate the wind field in Spain. Thus, large-scale phenomena can attenuate or intensify smaller-scale phenomena, and in the case of the stations in this study, the signal of the daily wind variability is weakened. At the SB station (Figure 5E), in the rainy season, this signal suffers this interference to a lesser extent than the other stations, possibly because station SB is in a forested region and the wind dynamics are different. The mean wind intensity in this region is lower due to the influence of dense vegetation, as previously shown in Figure 3E.

FIGURE 5. Local wavelet power spectrum (WPS) for the magnitude of the wind during 2017 at the stations: (A) Abadia Farm (AbF), (B) IFPA Rural (IF), (C) Gelado Dam (GD), (D) Serra Leste (SL), (E) Salobo (SB), and (F) Sossego (SS). The WPS indicates the observed amplitude (color levels) in time (x-axis), according to the period (equivalent to frequency), on the y-axis.
In the TW analysis of the meridional wind field of the GD station (Figure 6F), which is installed in a transition area, this variability is stronger because there is a predominance of pasture in the North and there is a forest in the South; therefore, the variation in the wind in the meridional direction is more evident both in the diurnal cycle and in the intraseasonal variability, while it is barely perceptible in the zonal component. On the other hand, station SS (Figure 7), also a transition area, has a weaker meridional component due to the distribution between the predominant NE and SE winds throughout the year, as shown in Figure 3F, resulting in the variability in the wavelets of the stronger zonal field (Figure 7). The SL station stands out, presenting strong intraseasonal variability in its zonal component and evident variability in the meridional component (Figure 7).
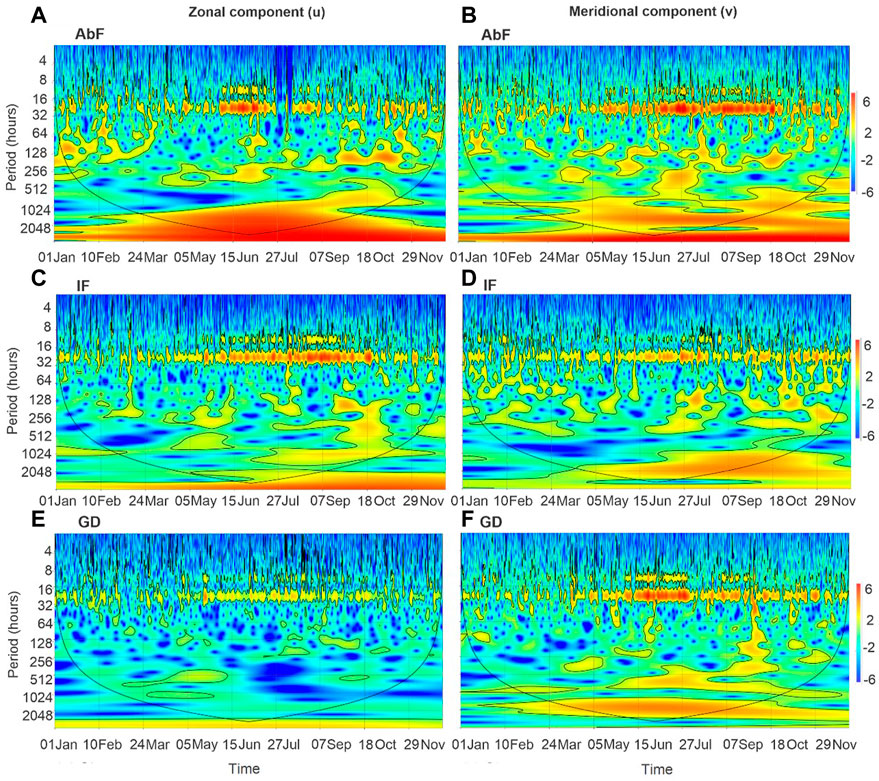
FIGURE 6. Local wavelet power spectrum (WPS) for the zonal wind component (u) to the right and for the meridional wind component (v) to the left during 2017 at the following stations: (A, B) Abadia Farm (AbF), (C, D) IFPA Rural (IF), (E, F) Gelado Dam (GD).
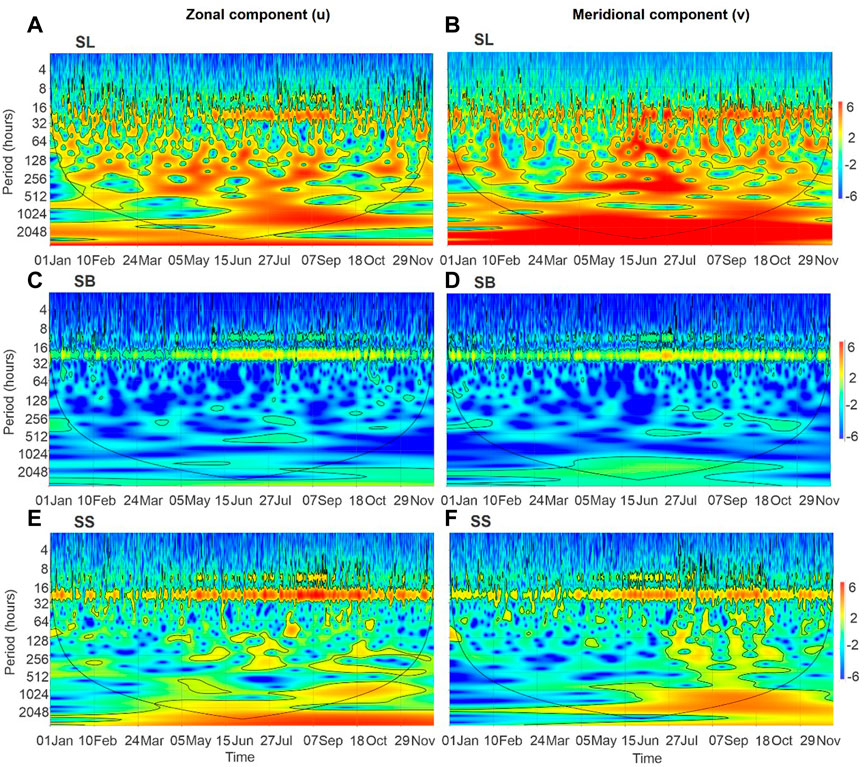
FIGURE 7. Local wavelet power spectrum (WPS) for the zonal wind component (u) to the right and for the meridional wind component (v) to the left during 2017 at the following stations: (A, B) Serra Leste (SL), (C, D) Salobo SB), and (E, F) Sossego (SS).
At all stations, the marked signal of wind variability in the dry season can be explained by the increase in the surface temperature. For example, in the analysis of the TW of the average air temperature for stations GD and IF (Figure 8), a strong daily cycle (24 h) signal is noted, as is noted for the wind speed (Figure 5). This signal is due to the alternation of heating and surface cooling, weaker in the beginning of the year due to the rainy season and more intense in the dry period because the surface reaches higher temperatures. Even the superficial thermal contrasts of forest/pasture (GD) and urban/pasture (IF) in this period are accentuated. This behavior (WT mean air temperature) is reproduced at the other study stations. These results corroborate those shown by Moura et al. (2014), which were obtained for Santa Rita Island, which is located 15 km south of the city of Maceió, Alagoas state, Brazil; the authors found that the magnitude of the wind, with a persistent signal at the 24 h scale during the dry period, is caused by surface heating, where the land-sea thermal contrast is higher and results in intense breezes in the region.
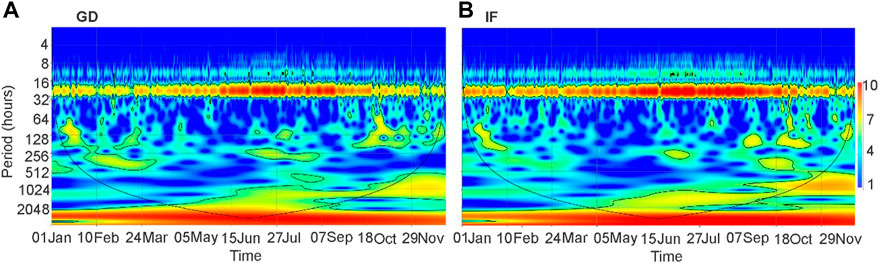
FIGURE 8. Local wavelet power spectrum (WPS) for the mean air temperature during 2017 at the stations: (A) Gelado Dam (GD) and (B) IFPA Rural (IF).
5 Conclusion
In this study, the surface wind variability was investigated over a hydrographic basin composed of six different environments: forests, pastures and the forest/pasture, urban/pasture and mine/pasture transitions.
The prevailing wind patterns in the territory of the IRW are influenced by vegetation cover, land use and topography, with the SL station, in the mine/pasture transition area, presenting the highest values of wind speeds and the SB station, in an area forest, the lowest values.
The most evident breeze circulation is identified at GD and SL stations (transition areas), signaled by the reversal of wind direction during the night. These stations are distinguished by relief, GD in an isolated orographic condition and SL located in a higher region. The same N wind flow is observed at AbF and IF stations, predominantly during the day and night, overcoming the effects of the local breeze.
In the wind speed WT analyses, more marked frequency signals are identified in the 24 h wind cycle (daily) and in the 12 h wind cycle associated with breeze circulation in all seasons, with different signal strengths.
The data show the interference of large-scale phenomena, such as the ITCZ and the SACZ, which operate in the region in the first months of the year. The results suggest that these systems modulate wind variability on a local scale.
The limitation of the time series is that the installation of the stations of interest is quite recent. It is hoped that this work can incentivize the refinement and broadening of studies on environmental impacts in the region.
In summary, it is recommended to incorporate data from non-neutral years and additional meteorological stations in further studies, in order to have a broader characterization of the wind field in the IRW.
Data availability statement
The raw data supporting the conclusion of this article will be made available by the authors, without undue reservation.
Author contributions
All authors contributed to the conceptualization and investigation. AT: Writing—original draft, review and editing. RD: Project administration, funding acquisition, supervision, writing and review. AD: Writing—original draft, review and editing. GM: Writing—review and editing. WN: Review and editing. CC: Writing and review. PP: Writing and review. RT: Writing and review. MD: Writing and review. DF: Writing and review.
Funding
Vale Institute of Technology Sustainable Development (ITV DS), National Council for Scientific and Technological Development (CNPq), Coordination for the Improvement of Higher Education Personnel (CAPES).
Acknowledgments
The authors thank the Vale Institute of Technology Sustainable Development (ITV DS) for financial and logistical support and the National Council for Scientific and Technological Development (CNPq) for financing the Industrial Postdoctoral Fellowship (PDI, the acronym in Portuguese) granted to the first author. The GCM would like to thank the Coordination for the Improvement of Higher Education Personnel (CAPES—Grant number 88887.160998/2017-00) for the postdoctoral scholarship.
Conflict of interest
AT was employed by the Climatempo (StormGeo).
The remaining authors declare that the research was conducted in the absence of any commercial or financial relationships that could be construed as a potential conflict of interest.
Publisher’s note
All claims expressed in this article are solely those of the authors and do not necessarily represent those of their affiliated organizations, or those of the publisher, the editors and the reviewers. Any product that may be evaluated in this article, or claim that may be made by its manufacturer, is not guaranteed or endorsed by the publisher.
References
Alvares, C. A., Stape, J., Sentelhas, P., Gonçalves, J., and Sparovek, G. (2013). Köppen's climate classification map for Brazil. Meteorol. Z 22, 711–728. doi:10.1127/0941-2948/2013/0507
Berg, N., Hall, A., Capps, S. B., and Hughes, M. (2013). El Niño-Southern oscillation impacts on winter winds over Southern California. Clim. Dyn. 40, 109–121. doi:10.1007/s00382-012-1461-6
Bitencourt, D. P., Fuentes, M. V., and Calearo, D. S. (2016). Análise de variáveis atmosféricas observadas em alta resolução espaço-temporal durante um experimento de 30 dias na mesorregião da ilha de Santa Catarina. Rev. Bras. Meteorol. 31, 122–140. doi:10.1590/0102-778631220140138
Blain, G. C., and Kayano, M. T. (2011). 118 anos de dados mensais do índice padronizado de precipitação: Série meteorológica de Campinas, estado de São Paulo. Rev. Bras. Meteorol. 26, 137–148. doi:10.1590/S0102-77862011000100012
CNRH (2003). Resolução N° 32 de 15 de outubro de 2003. Institui a divisão hidrográfica nacional, em regiões hidrográficas, nos termos dos Anexos I e II, e das outras providências. Diário Oficial da União, de 17/12/2003, nº 245, Seção 1, pág. 142, Brasília. Available at: https://www.jusbrasil.com.br/diarios/808334/pg-142-secao-1-diario-oficial-da-uniao-dou-de-17-12-2003 (Accessed July 2, 2019).
Cohen, J., Dias, M., and Nobre, C. (1995). Environmental conditions associated with amazonian squall lines: A case study. Mon. Weather Rev. 123, 3163–3174. doi:10.1175/1520-0493(1995)123<3163:ECAWAS>2.0.CO;2
Correia Filho, W. L. F., Souza, P. H. A., Oliveira Júnior, J. F. d., Santiago, D. d. B., Lyra, G. B., Zeri, M., et al. (2022). The wind regime over the Brazilian Southeast: Spatial and temporal characterization using multivariate analysis. Int. J. Climatol. 42 (3), 1767–1788. doi:10.1002/joc.7334
Danial, M. M., Kawanisi, K., and Al Sawaf, M. B. (2019). Characteristics of tidal discharge and phase difference at a tidal channel junction investigated using the fluvial acoustic tomography system. Water 11, 857. doi:10.3390/w11040857
De Souza, E., and Rocha, E. P. (2006). Diurnal variation of rainfall in bragança-PA (eastern Amazon) during rainy season: Mean characteristic and extremes events. Rev. Bras. Meteorol. 21, 142–152.
De Souza, E. B., Ferreira, D. B. S., Guimarães, J. T. F., Franco, V. S., Azevedo, F. T. M., Souza, P. J. O. P., et al. (2017). Padrões climatológicos e tendências da precipitação nos regimes chuvoso e seco da Amazônia oriental. Rev. Bras. Climatol. 21, 81–93. doi:10.5380/abclima.v21i0.41232
De Souza, E. B., Kayano, M. T., and Ambrizzi, T. (2005). Intraseasonal and submonthly variability over the Eastern Amazon and Northeast Brazil during the autumn rainy season. Theor. Appl. Climatol. 81, 177–191. doi:10.1007/s00704-004-0081-4
Dos Santos, A., Tota, J., Moura, M., Fitzjarrald, D., Santana, R., Andrade, A., et al. (2013). Dinâmica do escoamento de ar acima e dentro de uma floresta tropical densa sobre terreno complexo na Amazônia [Dynamics of airflow above and within a tropical rainforest canopy dense in the complex terrain on Amazonia]. Rev. Bras. Geogr. Fís 6, 308–319. doi:10.13140/RG.2.1.1486.4400
Echer, M. P. S., Echer, E., Nordemann, D. J., Rigozo, N. R., and Prestes, A. (2008). Wavelet analysis of a centennial (1895–1994) Southern Brazil rainfall series (Pelotas, 31°46′19″S 52°20′ 33″W). Clim. Change 87, 489–497. doi:10.1007/s10584-007-9296-6
Ferreira, D. B. S., de Souza, E. B., de Moraes, B. C., and Filho, L. G. M. (2015). Spatial and temporal variability of rainfall in Eastern Amazon during the rainy season. Sci. World J. 2015, 1–9. doi:10.1155/2015/209783
Foufoula-Georgiou, E., and Kumar, P. (1994). Wavelets in geophysics: Wavelet analysis and its applications. Cambridge, MA: Academic Press.
Guo, L., van der Wegen, M., Jay, D. A., Matte, P., Wang, Z. B., Roelvink, D., et al. (2015). River-tide dynamics: Exploration of nonstationary and nonlinear tidal behavior in the yangtze river estuary. J. Geophys Res. Oceans 120, 3499–3521. doi:10.1002/2014JC010491
Hammer, O., Harper, D., and Ryan, P. (2001). Past: Paleontological statistics software package for education and data analysis. Palaeontol. Electron 4, 1–9.
INMET (1992). Instituto nacional de meteorologia. Normais climatológicas. Available at: http://www.inmet.gov.br/portal/index.php?r=bdmep/bdmep (Accessed October 15, 2019).
Lamas, L., Peliz, A., Dias, J., Oliveira, P. B., Angélico, M. M., Castro, J. J., et al. (2017). Diurnal variability of inner-shelf circulation in the lee of a cape under upwelling conditions. Cont. Shelf Res. 143, 67–77. doi:10.1016/j.csr.2017.06.006
Lopes, M. N. G., De Souza, E. B., and Ferreira, D. B. S. (2013). Climatologia regional da precipitação no estado do pará. Rev. Bras. Climatol. 12, 84–102. doi:10.5380/abclima.v12i1.31402
Mattiuzzi, H. V., and Marchioro, E. (2012). O comportamento dos ventos em vitória (ES): A gestão e interpretação dos dados climatológicos. Rev. Geonorte 2, 983–993.
Mohammadi, K., and Goudarzi, N. (2018). Study of inter-correlations of solar radiation, wind speed and precipitation under the influence of El Niño Southern Oscillation (ENSO) in California. Renew. Energy 120, 190–200. doi:10.1016/j.renene.2017.12.069
Moraes, B., Costa, J., Costa, A., and Costa, M. (2005). Variação espacial e temporal da precipitação no Estado do Pará. Acta amaz 35, 207–214. doi:10.1590/S0044-59672005000200010
Morettin, P. A. (1999). Ondas e ondeletas: Da análise de fourier à análise de ondeletas. Brazil: EDUSP.
Moura, M. A. L., Ferreira, A. D., and Carneiro, R. G. (2014). Estudo dos padrões climatológicos do vento usando transformada em ondeletas. Rev. Bras. Geogr. Fís 7, 447–783. doi:10.26848/rbgf.v7.5.p774-783
Moura, M. N., and Vitorino, M. I. (2012). Variabilidade da precipitação em tempo e espaço associada à zona de convergência intertropical. Rev. Bras. Meteorol. 27, 475–483. doi:10.1590/S0102-77862012000400010
Oliveira, J. L., and Costa, A. A. (2011). Estudo de variabilidade do vento em escala sazonal sobre o nordeste brasileiro utilizando o RAMS: Os casos de 1973-1974 e 1982-1983. Rev. Bras. Meteorol. 26, 53–66. doi:10.1590/S0102-77862011000100006
Pascual, A., Martín, M. L., Valero, F., Luna, M. Y., and Morata, A. (2010). Wintertime connections between extreme wind patterns in Spain and large-scale geopotential height field. Atmos. Res. 122, 213–228. doi:10.1016/j.atmosres.2012.10.033
Pimentel, L., Marton, E., da Silva, M., and Jourdan, P. (2014). Caracterização do regime de vento em superfície na Região Metropolitana do Rio de Janeiro. Eng. Sanit. Ambient. 19, 121–132. doi:10.1590/S1413-41522014000200003
Pontes, P. R. M., Cavalcante, R. B. L., Sahoo, P. K., Júnior, R. O. D., da Silva, M. S., Dall'Agnol, R., et al. (2019). The role of protected and deforested areas in the hydrological processes of Itacaiúnas River Basin, eastern Amazonia. J. Environ. Manage 235, 489–499. doi:10.1016/j.jenvman.2019.01.090
Quaghebeur, W., Mulhern, R. E., Ronsse, S., Heylen, S., Blommaert, H., Potemans, S., et al. (2019). Arsenic contamination in rainwater harvesting tanks around lake Poopó in Oruro, Bolivia: An unrecognized health risk. Sci. Total Environ. 688, 224–230. doi:10.1016/j.scitotenv.2019.06.126
Reboita, M. S. (2004). Elementos da variabilidade climática no extremo Sul do Brasil, no Período de 1990 a 2001. Dissertation [in Portuguese] (Brazil: Universidade Federal do Rio Grande).
Rocha, Â. F. D., da Silva, E., and De Musis, C. (2018). Topoclimate in morlet, cross and coherence wavelet analyses in the Brazilian cerrado. Floresta Ambiente 25, e20171079. doi:10.1590/2179-8087.107917
Rocha, R., Filho, F., and Silva, S. (2019). Análise da relação entre a precipitação média do reservatório orós, Brasil - ceará, e os índices PDO e AMO através da análise de changepoints e transformada de ondeletas. Rev. Bras. Meteorol. 34, 139–149. doi:10.1590/0102-77863340034
Santos, C., Freire, P., and Torrence, C. (2013). A transformada wavelet e sua aplicação na análise de séries hidrológicas. Rev. Bras. Recur. Hídr 18, 271–280. doi:10.21168/rbrh.v18n3.p271-280
Santos, E. B., Lucio, P. S., and Silva, C. M. S. E. (2015). Precipitation regionalization of the Brazilian Amazon. Atmos. Sci. Lett. 16, 185–192. doi:10.1002/asl2.535
Sassi, M. G., Hoitink, A. J. F., de Brye, B., Vermeulen, B., and Deleersnijder, E. (2011). Tidal impact on the division of river discharge over distributary channels in the Mahakam Delta. Ocean. Dyn. 61, 2211–2228. doi:10.1007/s10236-011-0473-9
Silva, D. F. (2017). Aplicação de análises de ondaletas para detecção de ciclos e extremos pluviométricos no leste do nordeste do Brasil. Rev. Bras. Meteorol. 32, 187–198. doi:10.1590/0102-77863220002
Silva Júnior, R. O., Queiroz, J. C. B., Ferreira, D. B. S., Tavares, A. L., Souza Filho, P. W. M., Guimaraes, J. T. F., et al. (2017a). Estimativa de precipitação e vazões médias para a bacia hidrográfica do rio Itacaiúnas (BHRI), Amazônia Oriental, Brasil (Estimation of Precipitation and average Flows for the Itacaiúnas River Watershed (IRW) - eastern Amazonia, Brazil). Rev. Bras. Geogr. Física 10 (5), 1638–1654. doi:10.26848/rbgf.v.10.5.p1638-1654
Silva Júnior, R. O., Souza, E. B., Tavares, A. L., Mota, J. A., Ferreira, D., Souza Filho, P. W., et al. (2017b). Three decades of reference evapotranspiration estimates for a tropical watershed in the eastern Amazon. An. Acad. Bras. Ciências 89 (3), 1985–2002. doi:10.1590/0001-3765201720170147
Sodré, G., Moraes, B., Ferreira, D., Oliveira, J., and De Souza, E. (2015). Teleconexões oceânicas nos padrões climatológicos da amazônia oriental: Análise dos últimos 40 anos (1974-2013) [ocean climatological teleconnections in standards of eastern Amazon: Analysis of the last 40 years (1974-2013)]. Rev. Bras. Climatol. 17, 52–66. doi:10.5380/abclima.v17i0.38113
Souza-Filho, P. W., de Souza, E. B., Júnior, R. O. S., Nascimento, W. R., de Mendonça, B. R., Guimarães, J. T., et al. (2016). Four decades of land-cover, land-use and hydroclimatology changes in the Itacaiúnas River watershed, southeastern Amazon. J. Environ. Manage 167, 175–184. doi:10.1016/j.jenvman.2015.11.039
Sun, T., Ferreira, V. G., He, X., and Andam-Akorful, S. A. (2016). Water availability of São Francisco river basin based on a space-borne geodetic sensor. Water 8, 213. doi:10.3390/w8050213
Tavares, A., do Carmo, A., Silva Junior, R. O., Souza-Filho, P., Silva, M., Ferreira, D., et al. (2018). Climate indicators for a watershed in the eastern Amazon. Rev. Bras. Climatol. 23, 389–410. doi:10.5380/abclima.v23i0.61160
Tavares, A. L., and Silva Júnior, R. O. (2019). Rosa dos ventos da estação Sossego dos anos de 2017 e 2018: Resultados de monitoramento da estação Sossego (Canaã dos carajás-PA). Belém, PA: ITV, Relatório Interno.
Teague, W. J., Wijesekera, H. W., Jarosz, E., Lugo-Fernández, A., and Hallock, Z. R. (2014). Wavelet analysis of near-inertial currents at the east flower garden bank. Cont. Shelf Res. 88, 47–60. doi:10.1016/j.csr.2014.06.013
Torrence, C., and Compo, G. P. A. (1998). Practical guide to wavelet analysis. Bull. Am. Meteorol. Soc. 79, 61–78. doi:10.1175/1520-0477(1998)079<0061:APGTWA>2.0.CO;2
Vilani, M. T., and Sanches, L. (2013). Análise de Fourier e wavelets aplicada à temperatura do ar em diferentes tipologias de ocupação. Rev. Bras. Eng. Agríc Ambient. 17, 1340–1346. doi:10.1590/S1415-43662013001200013
Vitorino, M. I., Dias, P. L. S., and Ferreira, N. J. (2006). Observational study of the seasonality of the submonthly and intraseasonal signal over the tropics. Meteorol. Atmos. Phys. 93, 17–35. doi:10.1007/s00703-005-0162-7
Watts, D., Durán, P., and Flores, Y. (2017). How does El Niño southern oscillation impact the wind resource in Chile? A techno-economical assessment of the influence of El Niño and La Niña on the wind power. Renew. Energy 103, 128–142. doi:10.1016/j.renene.2016.10.031
Weng, H., and Lau, K. M. (1994). Wavelets, period doubling, and time–frequency localization with application to organization of convection over the tropical Western Pacific. J. Atmos. Sci. 51, 2523–2541. doi:10.1175/1520-0469(1994)051<2523:WPDATL>2.0.CO;2
World Meteorological Organization (2017). Guide to the global global observing system. Geneva, Switzerland: WMO-No. 488.
Ye, Z., Mao, H., and Driscoll, C. T. (2019). Primary effects of changes in meteorology vs. anthropogenic emissions on mercury wet deposition: A modeling study. Atmos. Environ. 198, 215–225. doi:10.1016/j.atmosenv.2018.10.052
Keywords: wind direction, wind speed, wavelet transform, intertropical convergence zone, south atlantic convergence zone
Citation: Tavares AL, Da Silva RO, Do Carmo AMC, Martins GC, Nascimento WDR, Ferreira DBDS, Da Silva MS, Costa CEADS, Pontes PR and Tedeschi RG (2023) Analysis of the wind regime at high spatial-temporal resolution in the itacaiúnas river watershed, eastern amazon. Front. Earth Sci. 10:1076695. doi: 10.3389/feart.2022.1076695
Received: 28 October 2022; Accepted: 28 December 2022;
Published: 13 January 2023.
Edited by:
Andreas Franz Prein, National Center for Atmospheric Research (UCAR), United StatesReviewed by:
José Francisco Oliveira Júnior, Federal University of Alagoas, BrazilAmanda Rehbein, University of São Paulo, Brazil
Copyright © 2023 Tavares, Da Silva, Do Carmo, Martins, Nascimento, Ferreira, Da Silva, Costa, Pontes and Tedeschi. This is an open-access article distributed under the terms of the Creative Commons Attribution License (CC BY). The use, distribution or reproduction in other forums is permitted, provided the original author(s) and the copyright owner(s) are credited and that the original publication in this journal is cited, in accordance with accepted academic practice. No use, distribution or reproduction is permitted which does not comply with these terms.
*Correspondence: Renato Oliveira Da Silva Jr., cmVuYXRvLnNpbHZhLmp1bmlvckBpdHYub3Jn