 Yang Gao
 Huaiwei Dong
 Yufeng Dai
 Naixia Mou2
94% of researchers rate our articles as excellent or good
Learn more about the work of our research integrity team to safeguard the quality of each article we publish.
Find out more
ORIGINAL RESEARCH article
Front. Earth Sci., 05 January 2023
Sec. Hydrosphere
Volume 10 - 2022 | https://doi.org/10.3389/feart.2022.1075988
This article is part of the Research TopicClimatic and Associated Cryospheric and Hydrospheric Changes on the Third Pole, volume IIView all 11 articles
The spatial and temporal resolutions of snow remote sensing data have been increasing, but the unique snow characteristics such as thin snow depth and high frequency of change on the Tibetan Plateau have limited their applicability in this region. In this study, five commonly used snow remote sensing data were evaluated based on snow observations at 139 stations during the latest 20 years, and the advantages of each data were integrated to develop a multi-source data fusion snow cover dataset for the Tibetan Plateau. Based on these data, we conducted snow zonation and comparative snow variability analysis on the Tibetan Plateau. The results indicated that the snow cover days on the Tibetan Plateau are not only influenced by the longest snow cover duration (SCD) but also controlled by the short-term snow cycles. More than 70% of the annual snow cover days come from short-term snow cycles, except the Amu Darya and Indus. From 2000 to 2021, 23.0% of the plateau has experienced a significant decrease in snow cover days (mainly in the southeast) and 4.9% has experienced a significant increase (mainly in the northwest). As the altitude increases, the area and magnitude of the decreased and increased snow cover increases, and at high altitude the areas with increased snow are greater than that with decreased. The significant reduction in the snow cover days over large areas of the plateau stems from the superimposed effect of the simultaneous reductions in the longest SCD and the short-term snow cycles, but the reduction in the Amu Darya and Indus comes mainly from the reduction in the short-term snow cycle. The significant increase in the snow cover days in the Amu Darya, Indus, Tarim, and Hexi mainly comes from the increase in the longest SCD, while that in the Yellow River and Qaidam mainly comes from the increase in the short-term snow cycles. This contrasting change in the snowpack on the Tibetan Plateau, which decreases in the southeast and increases in the northwest, with a large decrease at lower elevations and an increase at higher elevations, will bring new challenges to water resource management in the region.
Snow cover is a special form of land cover caused by low-temperature snowfall, snow transport, and accumulation in the process of melting (Che Z et al., 2008). It is an important part of the cryosphere, which is mainly distributed in the high-latitude and -altitude regions (Henderson et al., 2018). Snow cover has a large-scale cooling effect on the global climate system (Flanner et al., 2011), and its high reflectivity affects land–air energy exchange. Meanwhile, the changes in its status also affect water circulation processes. With an average altitude over 4,000 m, the Tibetan Plateau is the highest plateau in the world, which is covered by a large amount of seasonal and perennial snow. Rivers originating from the plateau provide domestic and production water for dozens of neighboring countries and regions, and snowmelt water is one of the important supplies for these rivers (Immerzeel et al., 2009; Smith et al., 2017; Hill et al., 2020). Climate warming causes rapid changes in snow cover on the Tibetan Plateau, which affects the annual distribution of runoff, local ecosystem, and disaster prevention. Therefore, comprehensive observation of snow cover and accurate acquisition of its dynamic changes are of great practical significant for water resource management.
Ground snow observation is usually carried out manually or automatically using a snow ruler or ultrasound for snow depth and a snow core tube or snow pillow for snow water equivalent. Studies based on ground-observed snow depth data show that snow on the Tibetan Plateau has different trends during different periods. Observation at 60 stations indicates a general increasing trend of snow on the Tibetan Plateau from 1957 to 1990 (Ke et al., 1997). Observation at 94 stations shows a significant decrease of snow cover days on the Tibetan Plateau from 1981 to 2010. Observation at 115 stations shows that a decreasing–increasing–decreasing trend in the eastern part of the plateau for three phases 1972–1987, 1987–1998, and 1998–2016. Although snow observations on the plateau are increasing and more and more stations are being used for snow studies (Chen et al., 2022), the majority of stations are located in the eastern part of the plateau, which does not allow for a comprehensive and accurate understanding of the snow over the whole plateau.
Remote sensing data have the characteristics of less restriction by the ground environment, wide coverage, and abundant information (Merz et al., 2013). The remote sensing data widely applying in snow studies can be divided into three categories according to spatial resolution. High-resolution snow cover data, including VIIRS/NPP Snow Cover Daily L3 Global 375 m SIN Grid (375 m, 2012–present) (Riggs and Hall, 2020), MODIS/Terra Snow Cover Daily L3 Global 500 m SIN Grid (MOD10A1) (500 m, 2000–present), MODIS/Aqua Snow Cover Daily L3 Global 500 m SIN Grid (MYD10A1) (500 m, 2002–present) (Chelamallu et al., 2013; Mishra et al., 2016) and related de-clouded data (Muhammad and Thapa, 2021; Gyawali and Bárdossy, 2022; Mattar et al., 2022), and IMS Daily Northern Hemisphere Snow and Ice Analysis data (IMS) (1km, 2014–present) (Chiu et al., 2020), can be used for basin-scale snow studies. Medium-resolution snow data, including IMS (4 km, 2004–present), daily 5-km Gap-free AVHRR snow cover extent product over China (AVHRR) (5 km, 1981–present) based on the advanced very-high-resolution radiometer (AVHRR), can be used for regional-scale snow studies. Low-resolution snow data, including weekly snow cover data developed by NOAA based on AVHRR (160 km, 1966–present) (Brown et al., 2014), daily snow cover data based on the Special Sensor Microwave/Image (SSM/I) (25 km, 1995–present), long-term series of daily snow depth dataset in China (CSD) (25 km, 1979–2021) (Che Z et al., 2008), and IMS (24 km, 1997–present) (Ramsay, 1998), can be used for global or continental scale snow studies. The more widely used data in the study of the Tibetan Plateau include high-resolution MODIS, IMS data, medium-resolution AVHRR data, and low-resolution CSD data. The evaluation results of MOD10A1/MYD10A1 on the Tibetan Plateau from 2002 to 2014 show that the total accuracy under clear sky can reach 85.0%, while more than 52.3% is covered by cloud (Yu et al., 2017). The total accuracy of 4 km and 1 km IMS snow and ice data on the plateau from 2010 to 2019 can reach 80.1% and 83.0%, respectively (Chu et al., 2021). The total accuracy of AVHRR snow cover data from 1985 to 2013 on the plateau can reach 87.4% (Li et al., 2022). The total accuracy of 25 km CSD from 2003 to 2014 on the plateau is 66.7% (Dai et al., 2017).
At present, a large number of remote sensing data have been applied to the monitoring of snow cover on the Tibetan Plateau. MODIS eight-day combined snow cover data MOD10A2 shows a significant decreasing trend of snow cover in the southeast and northwest of the plateau (Yang et al., 2017). The MODIS and IMS fusion data indicate that from 2002 to 2012, the areas with significantly earlier and later snow cover onset account for 18.1% and 8.5%, and the areas with earlier and later snow cover end account for 23.2% and 6.9%, respectively. The cloud-free MODIS snow data developed by the triple spline interpolation show that from 2000 to 2020, the snow cover onset of 14.4% region is delayed 2.3 days per year (d/y), and end of 15.5% is advanced 1.7 d/y (Tang et al., 2013). Previous studies focus more on the snow cover days, the start and end dates of snow cover (Dietz et al., 2013; Notarnicola, 2020), while little is known about the short-period snow cover on the Tibetan Plateau. Moreover, the reliability of snow monitoring is directly related to the used remote sensing data. High-resolution data can capture snow accurately, but most of them are obtained from optical sensors and affected by cloud. Multi-source data fusion is an effective method to integrate the respective advantages of different snow data. Targeted fusion strategies based on regional snow characteristics can significantly increase the adaptability of new products in the region.
This study plans to evaluate and comparatively analyze the five commonly used snow cover data based on unified data and indexes, to generate the Tibetan Plateau MODIS dataset using the suitable NDSI snow recognition threshold based on the snow characteristics of this region, to formulate multi-source data fusion strategies based on the performance of each data on the Tibetan Plateau, and to develop a multi-source data fusion snow dataset with high spatial resolution at the day scale. Based on this, the snow cover days and their changes on the Tibetan Plateau has been analyzed, and the longest snow cover duration (SCD) and the number of snow cycles have been comprehensively considered to understand the snow and its dynamic changes. The second part of this paper introduces the study area and data. The third part introduces the evaluation index, fusion strategy, snow cover parameters, and variation analysis methods. The fourth part analyzes the data fusion effect, spatial difference, and contrasting changes of snow cover on the Tibetan Plateau. The fifth part is the conclusion.
The Tibetan Plateau is the largest snow-covered area on the Earth except for the poles, which is the birthplace of dozens of large rivers and is known as the “Asia water tower.” The plateau is mainly influenced by the Indian monsoon and westerlies, with cold regions in the northwest and warm regions in the south and central parts. The precipitation over the plateau shows a decreasing trend from southeast to northwest. The Tibet Plateau is dominated by natural geomorphology, taking into account the elevation, mountain integrity, and river geomorphology, and is divided into 12 major basins: Indus, Amu Darya, Tarim, Hexi, Qaidam, Yellow River, TP interior, Yangtze, Lancang River, Nujiang River, Yarlungzangbo, and Ganges (Figure 1), and the proportion of each elevation area is 6.4% (<1500 m), 4.3% (1,500–2000m), 4.1% (2000–2500 m), 7.8% (2500–3000 m), 8.2% (3000–3500 m), 10.3% (3500–4000 m), 17.4% (4000–4500 m), 26.4% (4500–5000 m), and 15.1% (>5,000 m), respectively.

FIGURE 1. Study area and locations of 139 snow observation sites.
Remote sensing data used in this study include MOD10A1/MYD10A1 snow cover data, IMS snow and ice data, AVHRR snow area data, and CSD (Figure 2). All data have been pre-processed for format conversion and numerical unification.
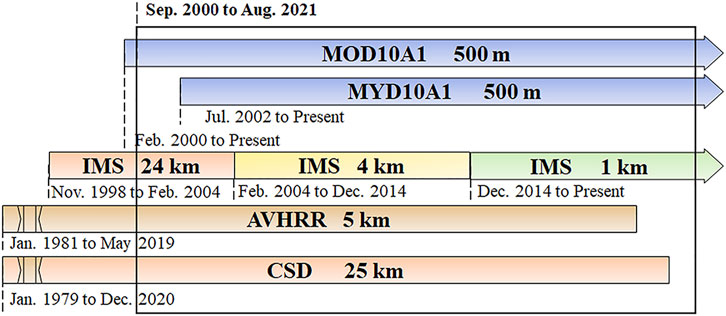
FIGURE 2. Remote sensing data used in this study.
MODIS data version 6 before 31 August 2021, including MOD10A1 and MYD10A1, has been downloaded from the National Snow and Ice Data Center (NSIDC, https://nsidc.org). Different form version 5, which only provides “snow” and “no snow” binary maps, version 6 snow dataset provides normalized difference snow index (NDSI) and data quality parameters (Hall et al., 2002). According to the snow characteristics of different regions, users can define the recognition threshold suitable for the region to obtain more accurate snow data. The data have been acquired between 10:30 a.m. and 1:30 p.m., respectively. The consistency of these two data is stronger in winter and the weakest in summer (Painter et al., 2009).
The IMS snow/ice data are a multi-source fusion dataset of snow and sea ice for the Northern Hemisphere, distributed by the NSIDC. The source datasets include data from NOAA’s very low orbit, Geostationary Operational Environmental Satellites, Geostationary Meteorological Satellite, United States Department of Defense Polar Satellites Orbiters, Multi-Function Transport Satellites, and European Meteorological Satellites. Also, the data of various radar sources from European countries, Japan, China, South Korea, Canada, and the United States and snow observations in many countries were combined (Ramsay, 1998; Helfrich et al., 2007). This study used data from 1 September 2000 to 31 August 2021.
The AVHRR snow data are obtained by quality control, cloud detection, snow identification by multi-layer decision tree, and gap filling. Based on normalized vegetation index (NDVI), NDSI, and DEM, the snow has been identified based on different thresholds for different surface conditions (Hao et al., 2021). The data within 16–56°N and 72–142°E can be obtained from the National Tibetan Plateau Data Center (TPDC, http://www.tpdc.ac.cn/en/). Data from 1 September 2000 to 31 May 2019 were used in this study.
The CSD is a snow depth dataset developed based on the snow characteristics in China (Che T et al., 2008; Dai et al., 2015; Dai et al., 2017), which can be downloaded from TPDC. The source data are passive microwave data SMMR (1979–1987), SSM/I (1987–2007), and SSMI/S (2008–2020). To ensure the consistency of the data in time, the data from different sensors are first cross-calibrated. Then, Chang’s snow depth algorithm is fitted and revised based on the snow depth observations in China, and a snow depth inversion algorithm suitable for China is developed. According to different surfaces such as sand, permafrost, and cold desert, different snow recognition algorithms are developed. Data from 1 September 2000 to 31 August 2021 were used in this study.
The snow depth records from 1 September 2000 to 31 August 2020 at 139 stations, operated by China National Meteorological Administration, have been viewed as true values (Figure 1). Daily snow depth is measured by professionals using a ruler at 8 a.m. When the snow depth is greater than 1 cm, the snow depth is recorded as the integer centimeter. In this study, the samples with a snow depth of 1 cm or more have been defined as “snow,” and samples with snow depth less than 1 cm have been defined as “no snow.” The elevation of these stations range from 1,220 to 5,285 m; 82.0% of these stations are located between 2,000 and 4,500 m, accounting for 47.8% of the Tibetan Plateau. Nine stations are located at altitudes greater than 4,500 m, accounting for 21.6%. Therefore, these measured snow depth data can well represent the snow cover in the study area. Meanwhile, SRTM DEM (the Shuttle Radar Topography Mission, https://srtm.csi.cgiar.org) with spatial resolution of 90 m is used for hypsometry of each basin.
Three metrics, overall accuracy (OA), snow accuracy (SA), and snow omission error (SOE), have been used to evaluate the accuracy of the source data and the performance of the data fusion (Painter et al., 2009; Rittger et al., 2013). The overall accuracy is defined as the ratio of the number of correctly classified samples to the total number of samples, and thus represents the overall accuracy for recognition in the data corresponding to “snow” and “no snow.” The snow accuracy is defined as the ratio between the number of correctly recognized “snow” samples and the number of “snow” samples identified by the remote sensing data, representing the correct snow recognition. The omission error is the ratio of the number of samples that misjudged “snow” as “no snow” based on remote sensing retrieval vs. the number of snow samples verified by ground observations, thus giving a measure of the snow missed by remote sensing observation.
The “step-by-step iterative test” has been used to define a suitable MODIS NDSI threshold for snow recognition. The NDSI threshold was based on carrying out 99 iterations between 0 and 1 in the steps of 0.01. The snow recognitions under each threshold were evaluated based on the ground observations by three metrics, i.e., the OA, SA, and SOE. The optimal threshold of MODIS NDSI has been determined by comparing and analyzing these parameters. In this study, the Tibetan Plateau has been classified into 96 types, according to the month and altitude interval, and the corresponding NDSI threshold has been determined for each type (Supplementary Table S1). When the NDSI value is greater than or equal to the threshold, it is identified as “snow,” and when it is less than the threshold, it is identified as “no snow."
Multi-source data fusion is an important method to remove cloud masking of optical data and to combine the advantages of different types of data (Gafurov and Bardossy, 2009; Gao et al., 2010; Dietz et al., 2013). For the three spatial resolutions of the IMS, we have divided the five data into three periods: 1 September 2000–23 April 2004 (period 1), 24 April 2004–2 December 2014 (period 2), and 3 December 2014–31 August 2020 (period 3). The accuracies of these five data have been comprehensively evaluated and compared. According to the evaluation results of each data in these three periods, the corresponding fusion strategy has been formulated and adopted. According to different strategies, multi-source data fusion has been carried out and the new snow cover dataset has been generated. The specific fusion strategies are defined in Section 4.1.
To provide a comprehensive understanding of the snowpack status, three parameters including the annual snow cover days, the longest snow cover duration (SCD), and the number of snow cycles have been used. The annual snow cover days is the sum of the number of snow days within a snow year (from September 1 in this year to August 31 in the next year). The process of “no snow–snow–no snow” in an area is defined as a snow cycle. SCD means the duration of a snow cycle. The number of snow cycles, i.e., how many such cycles are within a snow year, includes not only the long-term snow processes (more than 30 days) but also all the short-term snow processes (less than 30 days) (Zhang and Zhong, 2014). The longest SCD is the duration of the longest snow cover cycle.
Based on the annual snow cover days and the longest SCD, the Tibetan Plateau can be divided into four types: persistent, stable, unstable, and ephemeral snow covers (Li et al., 2022). The regions meeting any of the conditions of more than 180 days of annual snow cover days or more than 60 days of the longest SCD are defined as persistent snow cover. Outside the persistent snow cover, the regions meeting any of the conditions of annual snow cover days more than 60 days and the longest SCD more than 30 days are defined as the stable snow cover. Outside the aforementioned two types, regions with annual snow cover days or the longest SCD more than 10 days are defined as the unstable snow cover. Areas outside the aforementioned three types are defined as the ephemeral snow cover.
The trend of snow cover changes has been analyzed using the Mann–Kendall trend test algorithm (M–K algorithm). This method is a non-parametric test method. It does not require samples to follow a certain distribution and can overcome the interference of a few outliers, so it is widely used in climate trend testing and prediction. First, for the stationary and independent series, Xt (t = 1, 2, 3, … , n; n is the sequence length) defines the statistic S (1).
where Sgn (xi-xj) for
For n≥10, the variance of the statistic S (approximately normally distributed) is Var(S) (2) and the standardized test statistic is Z (3).
Here, Z represents the upward or downward trend of the series, where Z>0 indicates an upward trend and Z<0 indicates a downward trend. For a given significance level α, if |Z| ≥ Z1- α/2, it means that at the level of significance test α, Xt has an obvious upward or downward trend; 1.96 and 1.28 correspond to the critical values at significance levels (P) of 0.05 and 0.20, respectively. The calculation process is as follows: α = 0.05 as an example, Z1- α/2=Z0.975, the query standard normal distribution table Z0.975=1.96, so when |Z| ≥ 1.65, the sequence passes the 95% significance test. In this study, p≤0.05 and 0.05<p≤0.2 were defined as significant and weakly significant change, respectively. Only significant and weakly significant change has been analyzed in the following sections.
The accuracy of the original and multi-source fusion snow cover data have been evaluated based on snow observations at 139 stations from 2000 to 2020 (Figure 3). Among the five original data, the overall accuracies of MOD10A1, MYD10A1, and AVHRR are above 90%. Snow accuracies are the highest for MOD10A1 with 48.2–67.2%, AVHRR with 39.8–46.1%, and MYD10A1 with 31.5–40.6%. The snow omission error rates are MOD10A1, AVHRR, and MYD10A1 in order from low to high, above 50%, 60%, and 70%, respectively. It can be seen that the applicability of these three data on the Tibetan Plateau is MOD10A1, AVHRR, and MYD10A1 in a descending order, but the spatial resolution of MOD10A1 and MYD10A1 is much higher than that of AVHRR. The overall accuracy of IMS data is only 77.5% in period 1, but above 90% in periods 2 and 3. Similarly, its snow accuracy is only 20.3% in period 1, but more than 40% in periods 2 and 3. In the latter two periods, the snow accuracies of IMS data are higher than that of AVHRR data, but the accuracy of IMS no snow part is lower than AVHRR. Compared with other data, the CSD data have lower overall accuracy (74.8–77.6%) and lower snow accuracy (11.6–20.3%), although its snow omission error is lower.

FIGURE 3. Accuracy evaluation of original and multi-source fusion snow cover data. (A) Overall accuracy. (B) Snow accuracy. (C) Snow omission error.
Considering the aforementioned analysis and spatial resolution of the data, two multi-source data fusion strategies have been determined to develop the Tibetan Plateau multi-source data fusion snow cover dataset (TPMFSCD). The specific fusion process is shown in Supplementary Figure S1. In the fusion process, the MODIS data are used as the benchmark to calculate the center coordinates of each pixel, and then the pixel values from other data in the corresponding positions under the same coordinate system (WGS84) are obtained to participate in data fusion. Before 24 April 2004, i.e., period 1, the fusion has been performed in the order of MOD10A1 cloud-free part, MYD10A1 cloud-free part, AVHRR identified part, IMS, and CSD. In periods 2 and 3, the fusion has been performed in the order of MOD10A1 cloud-free part, MYD10A1 cloud-free part, IMS snow part, AVHRR identified part, IMS no snow part, and CSD. The validation of the fusion results shows that the overall accuracy of the newly developed data is higher than 92%, and the snow accuracies range from 42.5% to 48.3%. Although the snow accuracy of the new data is lower than MOD10A1, it is higher than other data. At the same time, the snow omission error of the new data is effectively reduced, especially in the two periods after 2004. Compared to the existing cloud-free data AVHRR and IMS, the snow omission error of the new data is reduced by 4.1–15.9% and 15.4–22.5%, respectively. It can be seen that the newly developed TPMFSCD not only integrates the high snow accuracy of MODIS data in cloud-free condition but also improves the snow omission error. The TPMFSCD is completely cloud-free data with high spatial and temporal resolutions, which can reflect all the snow cover conditions on the Tibetan Plateau.
The snow distribution on the Tibetan Plateau has obvious spatial heterogeneity (Figure 4). Percentage of the longest SCD is the ratio of the longest SCD to snow cover days, which is used to reflect the contribution of the longest snow cover period to the annual snow. The Amu Darya and Indus in the western part of the plateau have the longest average snow cover days, reaching 186 and 160 days, respectively. The longest SCD in these two basins last 5–9 months, with the average of 130 and 99 days, respectively, accounting for more than 60% of the snow cover days. The average snow cover days in the Tarim, Lancang River, Nujiang River, Yarlungzangbo, and Ganges are 89, 83, 106, 78, and 72 days, respectively. The longest SCD in most areas range from 25 to 35 days, and more than 70% of the snow cover comes from short-term snow cycles less than 5 days. Other basins, including the Hexi, Qaidam, TP interior, Yellow River, and Yangtze, have annual snow cover days of less than 2 months, 53, 47, 52, 58, and 56 days, respectively. The longest SCD is also short, at around 2 weeks, and more than 80% of the snow cover comes from the short-term snow cycles lasting less than 3 days. The snow cycles is ∼5 times in areas below 2,000 m at the edge of the plateau, and ∼20 times in areas above 2,000 m, except for the south of the TP interior and the upper reaches of the Yarlungzangbo. The snow cycle is more than 35 times at high altitude of the Tarim, Lancang River, Nujiang River, and Ganges. All of these indicate that the contribution of the longest SCD to the snow cover is limited, and the short-term snow cycles and their variation should be considered simultaneously when understanding the snow cover on the Tibetan Plateau.
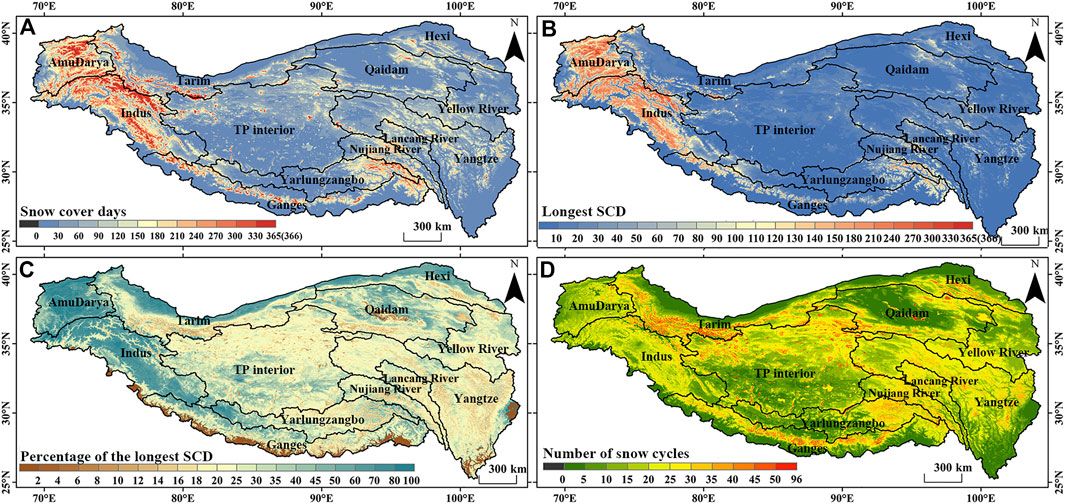
FIGURE 4. TPMFSCD observed snow characteristics on the Tibetan Plateau. (A) Snow cover days, (B) longest snow cover duration (SCD), (C) percentage of the longest SCD, and (D) number of snow cycles.
As the altitude increases, the annual snow cover days and the longest SCD increase, while the number of snow cycles first increases and then decreases (Figure 5, Supplementary Figure S2). The snow cover in high-altitude areas is relatively stable, since the low temperature conditions here are more conducive to preserving the snow cover, even in summer. According to the annual snow cover days and the longest SCD, the plateau has been divided into persistent, stable, unstable, and ephemeral snow covers (Figure 6). The persistent snow cover is 5.84×10⁵ km2 (16.2%), mainly distributed in the Indus (5.5%,>2900 m), Amu Darya (3.6%, >3300 m), Tarim (1.6%,>5100 m), Ganges (1.7%,>5100 m), and Yarlungzangbo (1.1%, >5500 m). The three northern regions have the annual snow cover days of 253–316 days, the longest SCD of 176–218 days, and the snow cycle of 15 times, all of which in the two southern regions is ∼300 days, ∼140 days, and 22 times. The stable snow cover is 9.45×10⁵ km2 (26.2%), mainly distributed in the TP interior (4.7%, 5,300–5800 m), Yangtze (4.6%, 4,200–5500 m), Yellow River (3.3%, 3,600–4900 m), and Tarim (2.6%, 3,300–5100 m). The annual snow cover days is ∼100 days, with the longest SCD of ∼30 days, and snow cycle of 23–27 times. The unstable snow cover is 1.64×10⁶ km2 (45.5%), mainly distributed in the TP interior (12.7%, <5300 m), Yangtze (6.9%, 2500–4200 m), Yellow River (6.1%, <3600 m), and Tarim (4.5%, 3300 m), with the annual snow cover days of 25–43 days. The longest SCD lasts ∼10 days, and the snow cycle is 8–17 times. The ephemeral snow cover is 4.36×10⁵ km2 (12.1%), mainly distributed in the area below 2,000 m of the Ganges and Yangtze and in the Qaidam. Compared with previous studies (Li and Li, 1983; Zhang and Zhong, 2014; Li et al., 2022), this study has fully considered the spatial and temporal continuities of snow cover and clarified the snow classification in different basins and their altitude dependences.
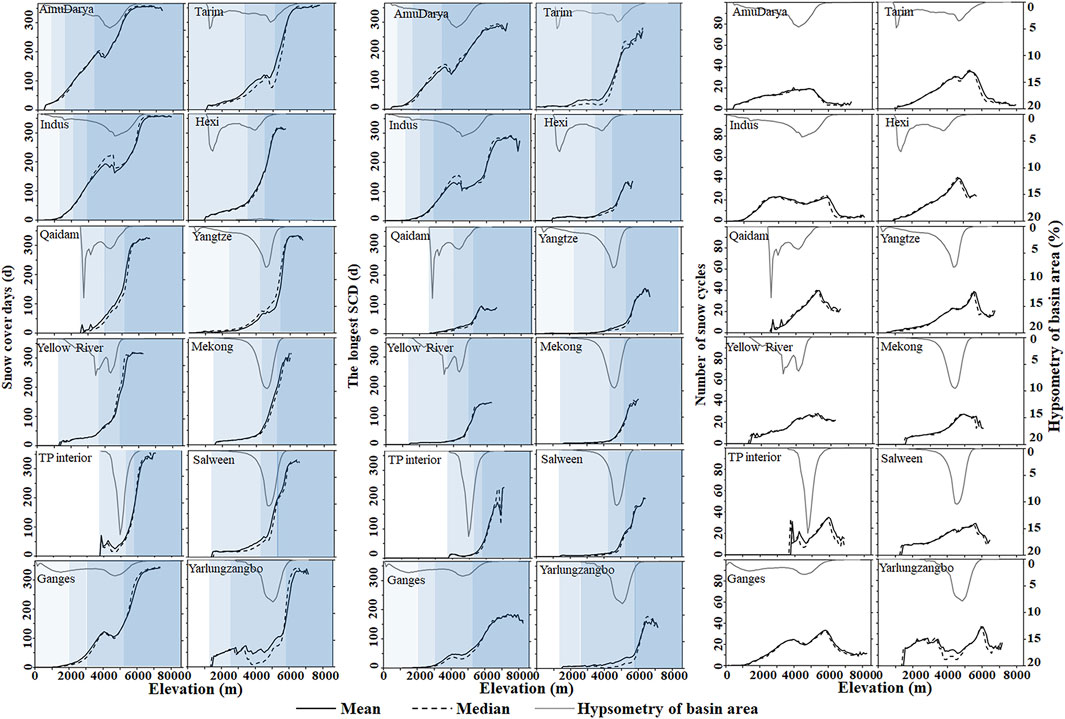
FIGURE 5. Snow cover days, the longest SCD, and number of snow cycles in each basin of the Tibetan Plateau.
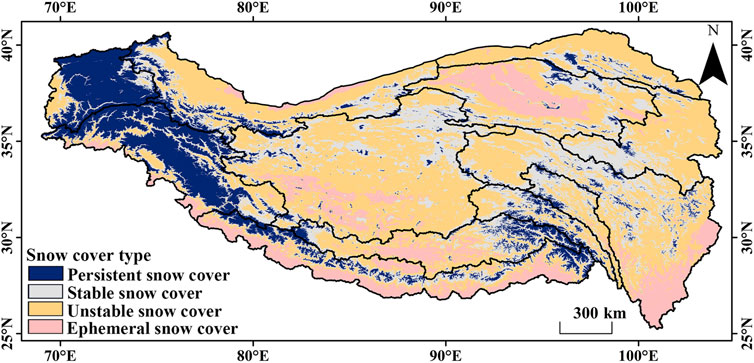
FIGURE 6. Snow cover zoning of the Tibetan Plateau.
In terms of basins, the Amu Darya and Indus are dominated by persistent snow cover. The Lancang River and Nujiang River are dominated by stable snow cover, and other basins are dominated by unstable snow areas, followed by stable snow areas. Controlled by geographical location and climatic background, the altitude of each basin to reach the persistent and stable snow cover are different. The Amu Darya and Indus in the northwestern direction of the plateau are at high latitude and directly controlled by the westerly, reaching the persistent snow cover at ∼3,000 m. Other areas of the plateau do not have the persistent snow cover until at least 5,000 m. In the TP interior and the upper reaches of the Yarlungzangbo, the persistent snow cover will not appear until at least 6,000 m. Similarly, the Amu Darya and Indus can have the stable snow cover at ∼2,000 m, and the Ganges, controlled by the Indian monsoon, has the stable snow cover at 3,000 m. The Tarim, Hexi, and the Yellow River with higher latitude have the stable snow cover at ∼3,500 m. The Qaidam, Yangtze, Lancang River, Nujiang River, and the middle and lower reaches of the Yarlungzangbo, which are inland or at lower latitudes, have the stable snow cover at ∼4,200 m, and the stable snow cover does not occur until even above 5,300 m on the TP interior.
During the period from 2000 to 2021, we estimate a significant decrease in in the snow cover days for the large region on the Tibetan Plateau (23.0%), and significant increasing accounting 4.9%, with a trend of −1.5 and 2.1 d/y(Figure 7A). The areas with snow decreasing are mainly in the Yangtze, Lancang River, Nujiang River, Yarlungzangbo, and Ganges, located in the southeastern and south part of the plateau. The gradual rise of the snowline height in these areas from 1995 to 2016 (Liu et al., 2021) also confirms the decreasing trend of snow cover. Areas of increasing and decreasing snow coexist in the Amu Darya, Indus, Tarim in the northwestern part of the plateau, and in the Qaidam and Yellow Rivers in the northeast. The area of snow reduction increases with elevation, from 4.4% (<2,500 m) to 8.4% (2,500–4,000 m) to 10.3% (>4,000 m), and that of increased snow also increases from 0.2% (<2,500 m) to 1.0% (2,500–4,000 m) to 3.6% (>4,000 m) (Supplementary Figure S3A). The corresponding snow reductions range from −0.7 to −1.3 to −1.9 d/y, and the increases range from 0.4 to 2.0 to 2.2 d/y (Figure 7B). It can be seen that the change of snow cover is more pronounced, and the magnitude is greater at higher altitude. The reduction of snow cover at high elevation may aggravate the warming of the TP interior (Zhang et al., 2022).
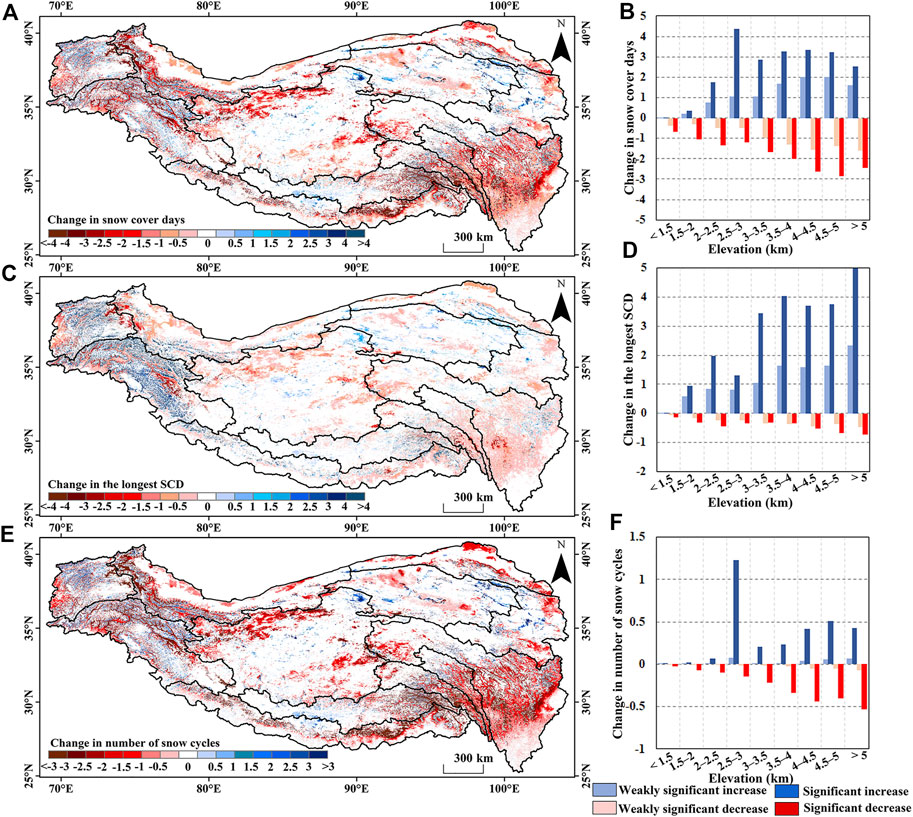
FIGURE 7. Changes in snow cover days (A), longest SCD (C), number of snow cycles, (E) and corresponding values in different elevation zones (B,D,F).
During the same period, the longest SCD decreases in 17.4% and increases in 5.8% of the Tibetan Plateau (Supplementary Figure S3D), with the rate of −0.4 and 2.5 d/y (Figures 7C,D). The areas with large reduction in the longest SCD are located in the Yangtze, Lancang River, Nujiang River, and Brahmaputra rivers, and that of the increase are located in the Amu Darya and Indus. Number of snow cycle decreases in 27.6% and increases in 3.7% of the plateau (Supplementary Figure S3F), with the rate of −0.2 and 0.1 time per year (n/y) (Figure 7E). The number of snow cycle is significantly reduced in most snow-covered areas of the Tibetan Plateau, except for the central part of the Yellow River and the upper reaches of the Yarlungzangbo. Similarly, the area and magnitude of changes in the longest SCD and number of snow cycles increases with elevation (Figure 7F, Supplementary Figure S3).
Figures 8, 9 illustrate the percentage of increase and decrease area and trends in snow cover of each basin. In the latest 21 years, the snow cover days in all the basins dominated by the significant reductions, and the area with significant decrease is much larger than the area with significant increase. Compared to other basins, the basins with the largest proportion of snow increase are the Amu Darya and Indus. The snow cover days decrease in 21.2% of the basins and increase in 10.4%, with the rate of -1.9 and 1.8 d/y, respectively. Almost all the increasing areas are located above 3,000 m. As the altitude increases, the area of increasing snow cover days increase, and the area of increased snow cover days above 4,500 m is more than decreased. It is noteworthy that in both basins above 3,000 m, the areas and magnitude of the increased longest SCD are more than that of the decreased (14.4%, 4.0 d/y vs 6.4%, and −2.3 d/y). In the area less than 3,000 m, the longest SCD is dominated by a decrease of −0.9 d/y. For the snow cycle, 27.0% of the area decreases and 6.0% increases. The snow cycle increases by less than 1.3% at all elevation intervals. Therefore, the decrease of snow cover days on the Amu Darya and Indus are mainly due to the reduction of short-term snow cycles. Meanwhile, the increase of snow cover days over 3,000 m is mainly due to the increase of the longest SCD, while the short-term snow cycles also decreases. From the period of 2001–2005 to 2016–2021, the longest SCD on the Amu Darya increases from 128 to 138 days, and on the Indus from 84 to 109 days. The number of snow cycles on the Amu Darya decreases from 18 to 15, while that on the Indus decreases from 19 to 17. In addition, there is an increase in the longest SCD in some areas of these two basins, along with a decrease in the short-term snow cycles, which leaves the snow cover days unchanged.
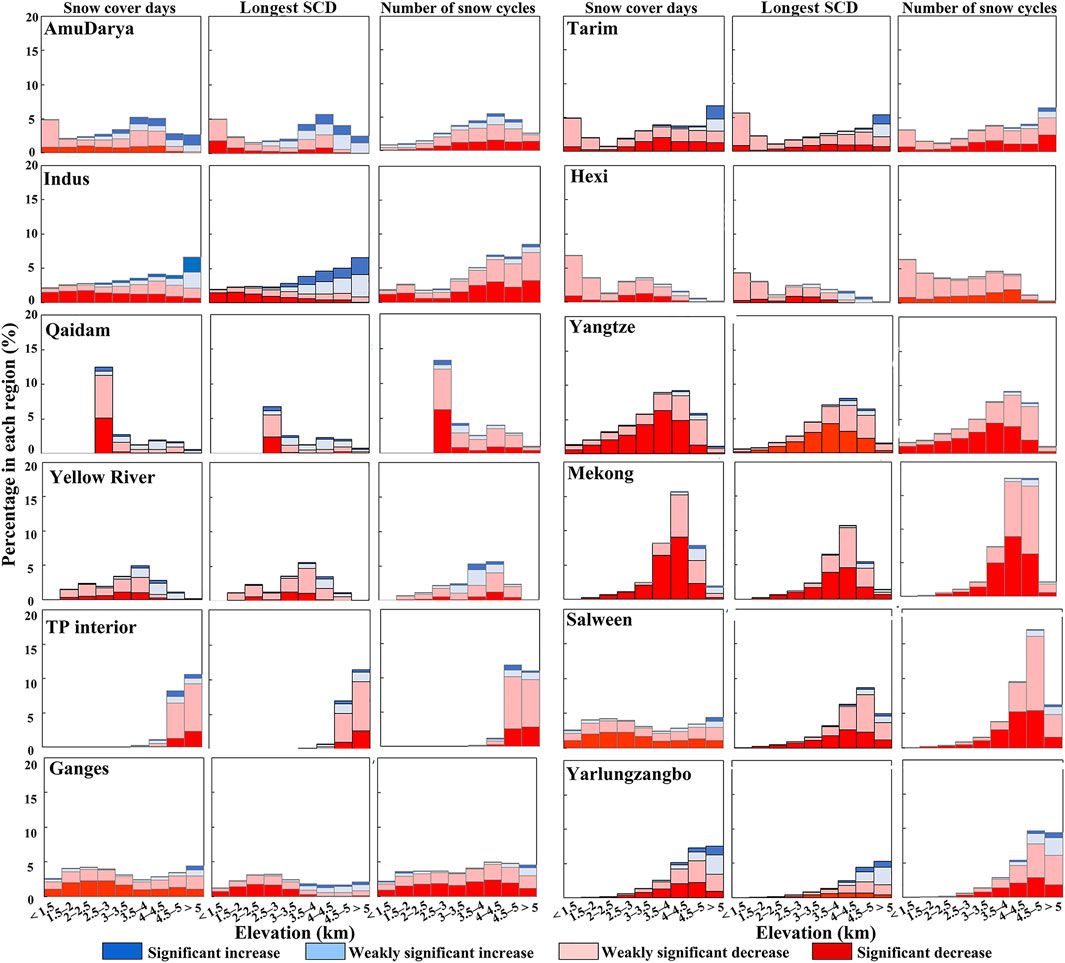
FIGURE 8. Percentage of snow cover increase and decrease areas in each basin.
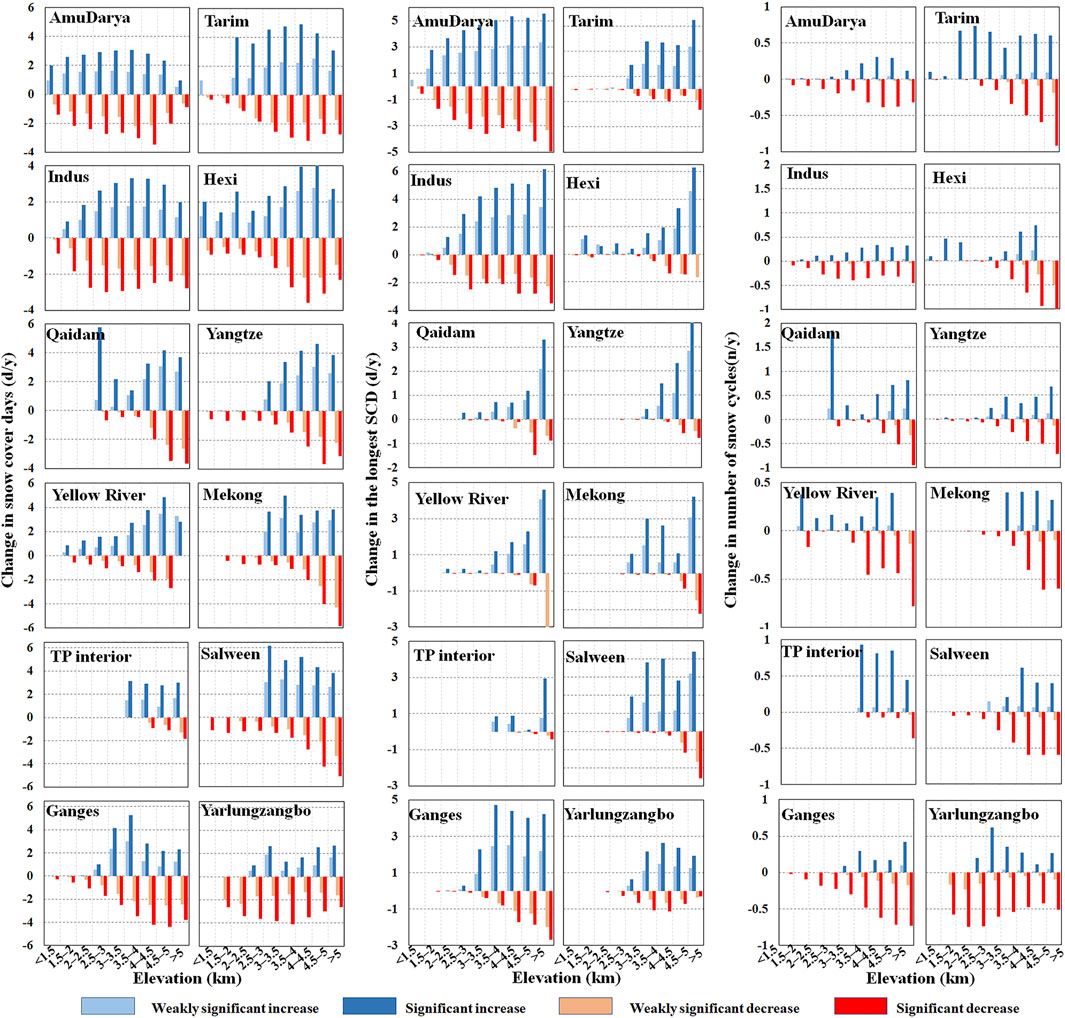
FIGURE 9. Trends in snow cover of each basin.
In Tarim and Hexi, the areas and magnitudes of decreased and increased snow cover days are 23.0%, −1.4 d/y and 3.8%, 2.5 d/y, respectively. The areas and magnitudes of decrease and increase in the longest SCD are 18.4%, −0.3 d/y and 4.4%, 2.5 d/y, respectively, while that of the snow cycles are 28.2%, −0.2 n/y and 2.0%, 0.2 n/y, respectively. The decrease in snow cover days, mainly located below 4,500 m, is not only related to the decrease of the longest SCD but also the decrease in the short-term snow cycles brings a greater impact. The area of increased snow cover days are located above 4,500 m, and there are more areas of increase than decrease, mainly influenced by the increase in the longest SCD, but the short-term snow cycles still decrease, which is identical to that of the Indus and Amu Darya.
In Qaidam, the Yellow River and TP interior, the snow cover days decrease and increase by 14.4% and 4.4% (-0.5 vs 2.2 d/y), respectively. The areas of increased snow cover days occur above 4,000 m. The longest SCD decrease and increase by 12.7% and 4.3% (- 0.1 vs 0.8 d/y), respectively, and the number of snow cycles decreases and increases by 18.9% and 4.5% (- 0.1 vs 0.2 n/y), respectively. The decrease in snow cover days in these regions is related to both the decrease in the longest SCD and the short-term snow cycles, and the increase in snow cover days is also the superposed effect of the increase in the longest SCD and short-term snow cycles. But the increase of the snow cover days in the Yellow River mainly comes from the increase of short-term snow cycles.
The most significant reduction of snow cover days is observed in the Yangtze, Lancang River, and Nujiang River. The snow cover days decreased in 35.0% (-1.8 d/y) of these regions and increased in only 3.3% (3.0 d/y). Most of the increased areas are located above 4,000 m, but the increased areas are much smaller than the decreased. The areas with decreased and increased longest SCD are 26.6% and 2.4% (-0.3 vs 1.8 d/y), respectively, while that snow cycles are 40.7% and 2.0% (-0.2 vs. 0.1n/y), respectively. The combination of the reductions in the longest SCD and the decreases of snow cycles over the large areas, has resulted in the reduction of the snow cover days.
The snow cover days in the Yarlungzangbo and Ganges also predominantly decreased, with 22.0% of the area decreasing and only 5.8% increasing in snow cover days, and the magnitude is -2.1 and 1.5 d/y, respectively. Unlike other basins where the increased and decreased snow cover are located in the same mountains, the increased snow in this region is mainly located in the middle and upper reaches of the Yarlungzangbo, mainly related to the increase in short-term snow cycles. The decreasing areas are mainly located in the Himalayas and Tanggula Mountains of this region. The areas of the decreased and increased longest SCDs are 11.4% and 5.6% (-0.5 vs 2.1 d/y), respectively and that of snow cycles are 26.7% and 5.4% (-0.2 vs 0.1n/y). The reduction of the snow cover days in these two regions is related to the decrease of the longest SCD, while the reduction in short-term snow cycles also plays a more important role.
The snowpack on the Tibetan Plateau not only provides an important freshwater resource for the surrounding region but its high albedo also governs the energy exchange of the ground–air system and thus influence climate change in Asia and globally. In recent years, the spatial and temporal resolutions of snow remote sensing data have been increasing, but the unique snow characteristics such as thin snow depth and high frequency of change on the Tibetan Plateau, as well as the complex and rugged land surfaces have limited their applicability in this region. This study comprehensively evaluated the applicability of five commonly used snow data, namely, MOD10A1, MYD10A1, IMS, AVHRR, and CSD on the Tibetan Plateau based on snow observations at 139 stations from 2000 to 2020. According to the evaluation of each snow data at different periods, two fusion strategies were developed and adopted to generate the Tibetan Plateau multi-source data fusion snow cover dataset from 2000 to 2021. The dataset with high spatial and temporal resolutions is completely cloud-free and have an overall accuracy of 92.7%.
The new data show that the annual snow cover days on the Tibetan Plateau is not only influenced by the largest SCD but is also controlled by the short-term snow cycles. The number of snow cycles is ∼20 times per year in most areas of the plateau, and over 35 times at higher elevations. The Amu Darya and Indus in the western part of the plateau have the longest average annual snow cover days, greater than 160 days, and the longest SCD accounts for more than 60% of the snow cover days. The Tarim, Lancang River, Nujiang River, Yarlungzangbo, and Ganges have more than 70 days of snow cover days, but more than 70% comes from short-term snow cycles lasting less than 5 days. Other areas including Hexi, Qaidam, TP inland areas, Yellow River, and Yangtze have short snow cover days of 60 days, and more than 80% comes from short-term snow cycles lasting less than 3 days. The areas of persistent, stable, unstable, and ephemeral snow covers on the Tibetan Plateau are 16.2%, 26.2%, 45.5% and 12.1%, respectively. The persistent snow cover is mainly distributed in the Indus and Amu Darya. Under the direct effect of the westerly, the persistent snow cover occur above 3,000 m in these two basins. In contrast, the other areas do not have persistent snow cover until at least 5,000 m or more. Stable snow cover is mainly distributed above 3,500 m in the Tarim and Yellow River, above 4,200 m of Yangtze, and above 5,300 m in the TP interior.
Over the last two decades, 23.0%, 17.4%, and 27.6% of the Tibetan Plateau have experienced a significant decrease in the snow cover days, the longest SCD, and the number of snow cycles, with the rate of −1.5 d/y, −0.4 d/y, and −0.2 n/y, respectively. In contrast, 4.9%, 5.8%, and 3.7% of the regions have a significant increase in the snow cover days, the longest SCD and the number of snow cycles, with the rate of 2.1 d/y, 2.5 d/y, and 0.1 n/y. All basins have a predominantly significant reduction in snow cover days, and the areas with the decrease are much greater than the increase. Compared to other basins, the Amu Darya and Indus in the northwest have the largest proportion of snow increase, while the Yangtze, Lancang River, and Nujiang River in the southeast have the largest proportion of decrease. As the altitude increases, both the area and magnitude of increasing and decreasing snowpacks increase. The significant reduction in the snow cover days on the Tibetan Plateau stems from the superimposed effect of the simultaneous reduction in the largest SCD and the short-term snow cycles, while the reductions in the Amu Darya and Indus mainly comes from the reduction in the short-term snow cycles. The significant increase of snow cover days in the Amu Darya, Indus, Tarim, and Hexi mainly comes from the increase of the longest SCD, and that in the Yellow River and Qaidam mainly comes from the increase in the short-term snow cycles. The significant increase is mainly distributed at the high-altitude area, and the area with increased snow is greater than that with decreased above 4,500 in the Amu Darya, Indus, Tarim, and Hexi or above 4,000 m in the Yellow River and Qaidam. This contrasting change in the snowpack on the Tibetan Plateau, which decreases in the southeast and increases in the northwest, with a large decrease at lower elevations and an increase at higher elevations, will bring new challenges to water resource management in the region.
The raw data supporting the conclusion of this article will be made available by the authors, without undue reservation.
YG: conceptualization, methodology, data curation, software, visualization, formal analysis, writing—original draft, writing—review and editing, and funding acquisition. HD: data processing, software, visualization, and formal analysis. YD: data curation, methodology, and formal analysis. NM: conceptualization and supervision. WW: writing—original draft and editing.
This work was supported by the Second Tibetan Plateau Scientific Expedition and Research (STEP) program (grant number 2019QZKK0201), the Natural Science Foundation of China (grant number 42171136), and the Basic Science Center for Tibetan Plateau Earth System (BSCTPES, NSFC grant number 41988101—03).
The authors would like to thank the Chinese Meteorological Administration (CMA) for providing snow observation information and data.
The authors declare that the research was conducted in the absence of any commercial or financial relationships that could be construed as a potential conflict of interest.
All claims expressed in this article are solely those of the authors and do not necessarily represent those of their affiliated organizations, or those of the publisher, the editors, and the reviewers. Any product that may be evaluated in this article, or claim that may be made by its manufacturer, is not guaranteed or endorsed by the publisher.
The Supplementary Material for this article can be found online at: https://www.frontiersin.org/articles/10.3389/feart.2022.1075988/full#supplementary-material
Brown, L. C., Howell, S. E. L., Mortin, J., and Derksen, C. (2014). Evaluation of the interactive multisensor snow and ice mapping system (IMS) for monitoring sea ice phenology. Remote Sens. Environ. 147, 65–78. doi:10.1016/j.rse.2014.02.012
Che, T., Li, X., Jin, R., Armstrong, R., and Zhang, T. (2008). Snow depth derived from passive microwave remote-sensing data in China. Ann. Glaciol. 49, 145–154. doi:10.3189/172756408787814690
Che, Z, Z., Jin, M., Zhang, X., Zhang, H., Niu, Y., and Dong, X. (2008). Effect of vegetation type on the ablation of snow cover in the qilian mountains. J. Glaciol. Geocryol. 30 (3), 392–397.
Chelamallu, H. P., Venkataraman, G., and Murti, M. V. R. (2013). Accuracy assessment of MODIS/Terra snow cover product for parts of Indian Himalayas. Geocarto Int. 29 (6), 592–608. doi:10.1080/10106049.2013.819041
Chen, L., Zhang, W., and Gao, H. (2022). Spatiotemporal dynamic characteristics of snow cover from 1980 to 2019 in the Three-River Source region and its response to climate change. J. Glaciol. Geocryol. 44 (1), 133–146.
Chiu, J., Paredes-Mesa, S., Lakhankar, T., Romanov, P., Krakauer, N., Khanbilvardi, R., et al. (2020). Intercomparison and validation of MIRS, MSPPS, and IMS snow cover products. Adv. Meteorology 2020, 1–10. doi:10.1155/2020/4532478
Chu, D., ZhaXi, D. Z., and CiDan, Y. Z. (2021). Analysis on applicability of NOAA IMS snow and ice products in snow cover monitoring over the Tibetan Plateau. J. Glaciol. Geocryol. 43 (6).
Dai, L., Che, T., Ding, Y., and Hao, X. (2017). Evaluation of snow cover and snow depth on the Qinghai–Tibetan Plateau derived from passive microwave remote sensing. Cryosphere 11 (4), 1933–1948. doi:10.5194/tc-11-1933-2017
Dai, L., Che, T., and Ding, Y. (2015). Inter-calibrating SMMR, SSM/I and SSMI/S data to improve the consistency of snow-depth products in China. Remote Sens. 7 (6), 7212–7230. doi:10.3390/rs70607212
Dietz, A. J., Kuenzer, C., and Conrad, C. (2013). Snow-cover variability in central Asia between 2000 and 2011 derived from improved MODIS daily snow-cover products. Int. J. Remote Sens. 34 (11), 3879–3902. doi:10.1080/01431161.2013.767480
Flanner, M. G., Shell, K. M., Barlage, M., Perovich, D. K., and Tschudi, M. A. (2011). Radiative forcing and albedo feedback from the Northern Hemisphere cryosphere between 1979 and 2008. Nat. Geosci. 4 (3), 151–155. doi:10.1038/ngeo1062
Gafurov, A., and Bardossy, A. (2009). Cloud removal methodology from MODIS snow cover product. Hydrol. Earth Syst. Sci. 13 (7), 1361–1373. doi:10.5194/hess-13-1361-2009
Gao, Y., Xie, H., Lu, N., Yao, T., and Liang, T. (2010). Toward advanced daily cloud-free snow cover and snow water equivalent products from Terra–Aqua MODIS and Aqua AMSR-E measurements. J. Hydrology 385 (1-4), 23–35. doi:10.1016/j.jhydrol.2010.01.022
Gyawali, D. R., and Bárdossy, A. (2022). Development and parameter estimation of snowmelt models using spatial snow-cover observations from MODIS. Hydrol. Earth Syst. Sci. 26 (12), 3055–3077. doi:10.5194/hess-26-3055-2022
Hall, D. K., Riggs, G. A., Salomonson, V. V., DiGirolamo, N. E., and Bayr, K. J. (2002). MODIS snow-cover products. Remote Sens. Environ. 83, 181–194. doi:10.1016/s0034-4257(02)00095-0
Hao, X., Huang, G., Che, T., Ji, W., Sun, X., Zhao, Q., et al. (2021). The NIEER AVHRR snow cover extent product over China – A long-term daily snow record for regional climate research. Earth Syst. Sci. Data 13 (10), 4711–4726. doi:10.5194/essd-13-4711-2021
Helfrich, S. R., McNamara, D., Ramsay, B. H., Baldwin, T., and Kasheta, T. (2007). Enhancements to, and forthcoming developments in the interactive multisensor snow and ice mapping system (IMS). Hydrol. Process. 21 (12), 1576–1586. doi:10.1002/hyp.6720
Henderson, G. R., Peings, Y., Furtado, J. C., and Kushner, P. J. (2018). Snow–atmosphere coupling in the northern Hemisphere. Nat. Clim. Chang. 8 (11), 954–963. doi:10.1038/s41558-018-0295-6
Hill, A. F., Rittger, K., Dendup, T., Tshering, D., and Painter, T. H. (2020). How important is meltwater to the chamkhar chhu headwaters of the Brahmaputra river? Front. Earth Sci. (Lausanne). 8. doi:10.3389/feart.2020.00081
Immerzeel, W. W., Droogers, P., de Jong, S. M., and Bierkens, M. F. P. (2009). Large-scale monitoring of snow cover and runoff simulation in Himalayan river basins using remote sensing. Remote Sens. Environ. 113 (1), 40–49. doi:10.1016/j.rse.2008.08.010
Ke, C., Li, P., and Wang, C. (1997). Variation trends of snow cover over the Tibetan plateau and their relations to temperature and precipitation. J. Glaciol. Geocryol. 19, 289–294.
Li, H., Zhong, X., Zheng, L., Hao, X., Wang, J., and Zhang, J. (2022). Classification of snow cover persistence across China. Water 14 (6), 933. doi:10.3390/w14060933
Liu, C., Li, Z., Zhang, P., Tian, B., Zhou, J., and Chen, Q. (2021). Variability of the snowline altitude in the eastern Tibetan Plateau from 1995 to 2016 using google Earth engine. J. Appl. Remote Sens. 15 (4), 048505. doi:10.1117/1.jrs.15.048505
Mattar, C., Fuster, R., and Perez, T. (2022). Application of a cloud removal algorithm for snow-covered areas from daily MODIS imagery over andes mountains. Atmosphere 13 (3), 392. doi:10.3390/atmos13030392
Merz, B., Vorogushyn, S., Kriegel, D., and Gafurov, A. (2013). Evaluation of remotely sensed snow cover product in Central Asia. Hydrology Res. 44 (3), 506–522. doi:10.2166/nh.2012.094
Mishra, P., Zaphu, V. V., Monica, N., Bhadra, A., and Bandyopadhyay, A. (2016). Accuracy assessment of MODIS fractional snow cover product for eastern himalayan catchment. J. Indian Soc. Remote Sens. 44 (6), 977–985. doi:10.1007/s12524-016-0548-7
Muhammad, S., and Thapa, A. (2021). Daily terra–aqua MODIS cloud-free snow and randolph glacier inventory 6.0 combined product (M*D10A1GL06) for high-mountain Asia between 2002 and 2019. Earth Syst. Sci. Data 13 (2), 767–776. doi:10.5194/essd-13-767-2021
Notarnicola, C. (2020). Hotspots of snow cover changes in global mountain regions over 2000–2018. Remote Sens. Environ. 243, 111781. doi:10.1016/j.rse.2020.111781
Painter, T. H., Rittger, K., McKenzie, C., Slaughter, P., Davis, R. E., and Dozier, J. (2009). Retrieval of subpixel snow covered area, grain size, and albedo from MODIS. Remote Sens. Environ. 113 (4), 868–879. doi:10.1016/j.rse.2009.01.001
Ramsay, B. H. (1998). The interactive multisensor snow and ice mapping system. Hydrol. Process. 12 (10-11), 1537–1546. doi:10.1002/(sici)1099-1085(199808/09)12:10/11<1537::aid-hyp679>3.0.co;2-a
Riggs, G., and Hall, D. (2020). Continuity of MODIS and VIIRS snow cover extent data products for development of an Earth science data record. Remote Sens. 12 (22), 3781. doi:10.3390/rs12223781
Rittger, K., Painter, T. H., and Dozier, J. (2013). Assessment of methods for mapping snow cover from MODIS. Adv. Water Resour. 51, 367–380. doi:10.1016/j.advwatres.2012.03.002
Smith, T., Bookhagen, B., and Rheinwalt, A. (2017). Spatiotemporal patterns of High Mountain Asia's snowmelt season identified with an automated snowmelt detection algorithm. Cryosphere 11 (5), 2329–2343. doi:10.5194/tc-11-2329-2017
Tang, Z., Wang, J., Li, H., and Yan, L. (2013). Spatiotemporal changes of snow cover over the Tibetan plateau based on cloud-removed moderate resolution imaging spectroradiometer fractional snow cover product from 2001 to 2011. J. Appl. Remote Sens. 7 (1), 073582. doi:10.1117/1.jrs.7.073582
Yang, Z., Da, W., and Chu, D. (2017). Spatiotemporal variations of snow cover on the Tibetan plateau over the last 15 years. Remote Sens. Technol. Appl. 32 (1), 27–36.
Yu, X. Q., Qiu, Y. B., Ruan, Y. J., Shi, L. J., and Laba, Z. M. (2017). Validation and comparison of binary cloudless snow products in high Asia. Remote Sens. Technol. Appl. 32, 37–48.
Zhang, H., Immerzeel, W. W., Zhang, F., de Kok, R. J., Chen, D., and Yan, W. (2022). Snow cover persistence reverses the altitudinal patterns of warming above and below 5000 m on the Tibetan Plateau. Sci. Total Environ. 803, 149889. doi:10.1016/j.scitotenv.2021.149889
Keywords: multi-source data fusion, contrasting snow change, snow cycle, the longest snow cover duration, Tibetan Plateau
Citation: Gao Y, Dong H, Dai Y, Mou N and Wei W (2023) Contrasting changes of snow cover between different regions of the Tibetan Plateau during the latest 21 years. Front. Earth Sci. 10:1075988. doi: 10.3389/feart.2022.1075988
Received: 21 October 2022; Accepted: 22 November 2022;
Published: 05 January 2023.
Edited by:
Chunqiao Song, Nanjing Institute of Geography and Limnology (CAS), ChinaCopyright © 2023 Gao, Dong, Dai, Mou and Wei. This is an open-access article distributed under the terms of the Creative Commons Attribution License (CC BY). The use, distribution or reproduction in other forums is permitted, provided the original author(s) and the copyright owner(s) are credited and that the original publication in this journal is cited, in accordance with accepted academic practice. No use, distribution or reproduction is permitted which does not comply with these terms.
*Correspondence: Yang Gao, eWFuZ2dhb0BpdHBjYXMuYWMuY24=
†These authors share first authorship
Disclaimer: All claims expressed in this article are solely those of the authors and do not necessarily represent those of their affiliated organizations, or those of the publisher, the editors and the reviewers. Any product that may be evaluated in this article or claim that may be made by its manufacturer is not guaranteed or endorsed by the publisher.
Research integrity at Frontiers
Learn more about the work of our research integrity team to safeguard the quality of each article we publish.