 Hong Zhang1
 Yong Huang
94% of researchers rate our articles as excellent or good
Learn more about the work of our research integrity team to safeguard the quality of each article we publish.
Find out more
ORIGINAL RESEARCH article
Front. Earth Sci., 04 January 2023
Sec. Atmospheric Science
Volume 10 - 2022 | https://doi.org/10.3389/feart.2022.1073885
This article is part of the Research TopicAtmospheric Physics, Atmospheric Environment, and Atmospheric Effects on Human HealthView all 12 articles
Wind data from air pollutant observation networks and meteorological stations are used to analyze the characteristics of river-land breeze near Tongling city (a main mining city in the Yangtze River Delta). The inhomogeneous distribution of pollutant matters near Tongling city due to river-land breeze is also investigated. Our results show the following conclusions. 1) The river breeze during the daytime is stronger than the land breeze at night. And the speed of river-land breeze is increased rapidly from 7:00 and arrived at the maximum at 12:00. After 15:00, the speed is slowed rapidly. 2) The river-land breeze in city area (east of Yangtze River, speed is .07 m/s) is weaker than the natural area (west of Yangtze River, speed is 0.18 m/s). Furthermore, the seasonal variations of breeze both in the west and east sides are different. In west side, the breeze is strongest in spring. And in the east side, the breeze is strongest in summer. 3) Under a weak breeze (≤0.45 m/s), the PM10 is moved by the breeze within the region and causes the heterogeneity. While with a strong breeze (>0.45 m/s), the PM10 is transported out of the region, and the PM10 concentration becomes homogenous. 4) The river breeze leads to a reduction of the pollutant concentration near the Yangtze River, but an increase in the city due to the transportation of pollutant particles from coast to city at daytime.
Weak river-land breezes caused spatial heterogeneity of PM10. And strong breezes produced spatial homogeneity.
The Yangtze River Delta (YRD) is one of the most important economic zones in China, including 26 cities in Shanghai, Jiangsu, Zhejiang and Anhui provinces. It is a region has not only heavy industries such as machinery industry, chemical industry, automobile manufacturing and mining, but also has agricultural products like wheat, rice and corn. It is also a hub of transportation. With the significant economic growth of the YRD, environmental problems become more and more prominent in that region. Hu et al. (2014) pointed out some atmospheric environmental problems including increase of particle concentration, more haze weather and the deterioration of air quality. Fu et al. (2013) also showed that the average emission intensities in the YRD for some air pollutants (SO2, NOX, PM2.5, PM10, NMVOCs and NH3) were 2–7 times higher than the national average value in 2010. The annual average concentrations of PM2.5 in the cities of Shanghai, Nanjing and Hangzhou in 2013 were 5–7 times higher than the World Health Organization (WHO) Air Quality Guidelines (Wang et al., 2014). These problems of air pollution may cause loss of both human health and Economic wealth (Wang et al., 2015). Therefore, the atmospheric environmental problem in the YRD is one of the most important issues that researchers should pay a close attention to.
Tongling city, a major mining city, is located in the west of YRD and near the Yangtze River. There are various industries, such as ore mining, metal smelting and Energy-Chemical industry. And the source of air pollution is a complicated problem in Tongling. In addition, complex topography (the Yangtze River, hills, cities, etc.) also creates special regional meteorological conditions. Particularly the specific geographic distribution of water and urban land use will have a certain effect on regional climate. Previous studies indicate that physical property differences between water and land may cause local atmospheric motion, form weather phenomenon with significant diurnal variation such as Sea-Land Breeze, land-lake breeze, and river-land wind (Avissar and Pielke, 1989; Oliveira and Fitzjarrald, 1993; Porson et al., 2007; Crosman and Horel, 2010; Crosman and Horel, 2012; Choi et al., 2015). Local atmospheric motion can change wind direction and speed, and thus influence the distribution of air pollutants in the area (Clappier et al., 2000; Melas et al., 2006). For example, air pollutant could be transported from coast to land due to the effect of sea breeze (Alexandra et al., 2016).
Despite that the spatial scale of river-land breeze is smaller (about 20 km) than sea breeze, it can bring remarkable influences on local weather and air quality (Wang et al., 2010). Silva Dias et al. (2004) studied the Amazon basin and found that river-land breeze could induce local convergence and divergence and create a local climate with distinct geographical features. The contrast between the wide surface of the Yangtze River and the land is prone to the formation of river-land breezes under a certain condition, which creates local climate regime and corresponding distribution features of atmospheric pollutant concentration. Therefore, in this study, we analyze river-land breeze and its influence on regional air pollution in Tongling city.
We analyze the characteristics of river-land breeze and the influence on distribution of PM10 in the Yangtze River Delta, China. The remainder of this paper is organized as follows: The study area, observations, and data quality control methods used are described in Section 2. We analyze the results in Section 3. The Discussion are given in Section 4 and the conclusions are given in Section 5.
In this study, we focus on Tongling city and the area surrounding it. The study region (117.5E-118E, 30.8–31.1N) is shown in Figure 1. In this domain, the Yangtze River passes through from south to north and is almost perpendicular to the latitude in all lines. Therefore, the river breeze caused by the difference of land and surface contrast is mainly in east-west direction. Observation data from all meteorological stations (total 22 stations) and air quality monitoring stations (total four stations) in study region are collected for analyzing river breeze and its influences on pollutant particles distribution. These four air quality monitoring stations are located at the ninth middle school (NS), the wastewater factory (WF), the fourth middle school (FS) and the road bureau (RB).
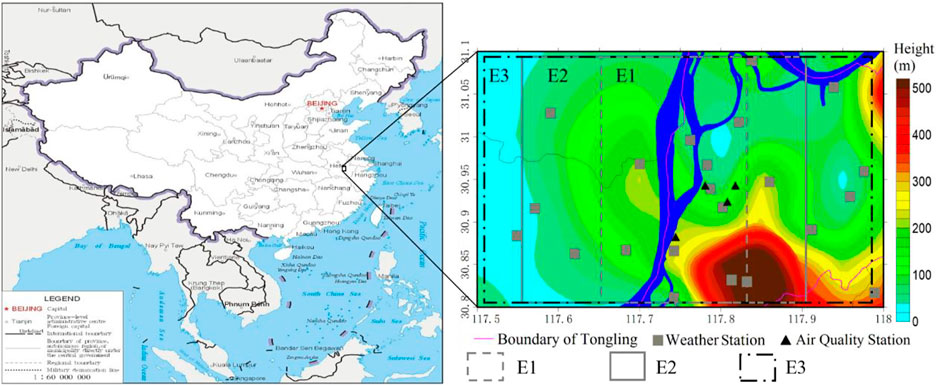
FIGURE 1. Map of the study region (squares are weather stations, and triangles are air quality stations, color shadow is altitude, blue is Yangtze River).
The data from air pollutant observation stations (national stations of Ministry of Ecology and Environment, PRC) and meteorological observation stations (regional stations of China Meteorological Administration) in the whole year of 2011 (observation experiment period in Tongling) are used in this study, include concentration of PM10, the wind speed and direction. The time frequency of these observation data is 1 h. Those concentration of PM10 were observed by the LGH-01B PM10 air particulate matter monitoring instrument (produced by Anhui Landun Photoelectron CO., LTD., Anhui, PRC). The wind speed was observed by the three-cup wind speed sensor (EL15-1A) and the wind direction was observed by the sensor of EL15-2A (produced by Zhonghuan TIG, Tianjin, PRC).
The data of PM10 are disposed according to the technical specifications of Ministry of Ecology and Environment, PRC (Technical Specifications for Installation and Acceptance of Continuous Automatic Monitoring System for Ambient Air Particulate Matter (PM10 and PM2.5), HJ 655–2013). And the supplemental quality control of all these datasets had been carried out before analysis. The primary purpose of quality control is to eliminate the outliers. However, it is also assumed 10% of air pollutant data are unreliable. The quality control aims to eliminate not only the outliers, but also those unreliable data. So, first step is to calculate its probability distribution, then, a threshold is obtained to eliminate those 10% data.
According to formulas (1), it is clear that total wind (
n is the number of weather stations in the study region,
As the environment background wind (
Environment background wind (
Diurnal variation of annual mean local deviated wind (
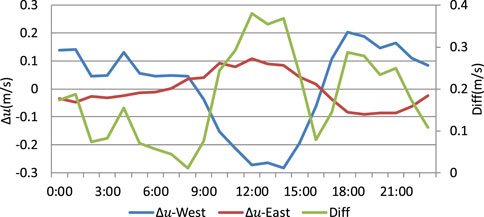
FIGURE 2. Diurnal variation of annual mean local deviated wind speed (
The diurnal variation of local deviated wind (
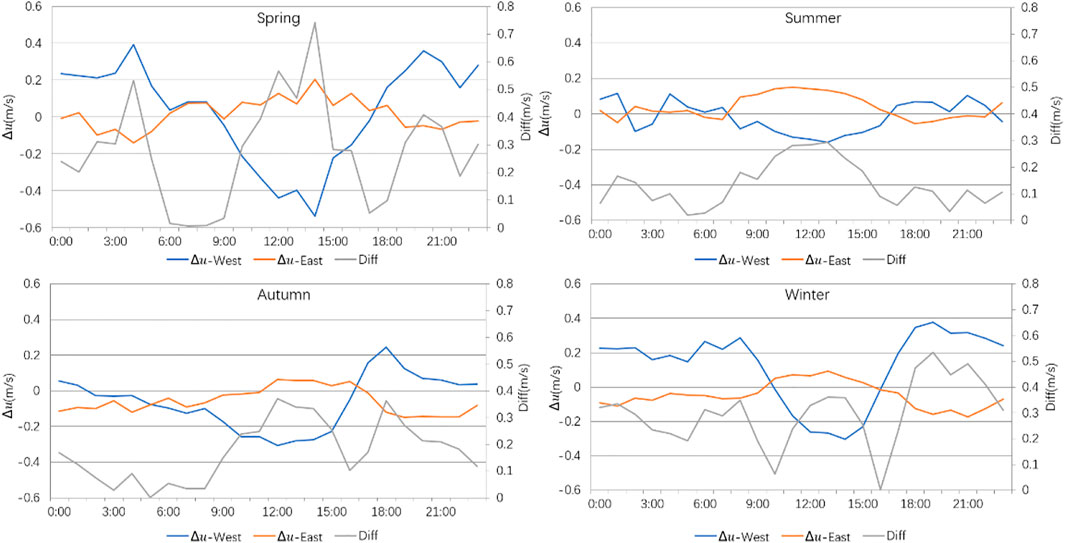
FIGURE 3. Diurnal variation of local deviated wind (
The mean local deviated wind speed and standard deviations are calculated during daytime (9:00–16:00) and nighttime (19:00–04:00). As shown in Table 1, the land breeze in the west side of Yangtze River is stronger than that in the east. The mean
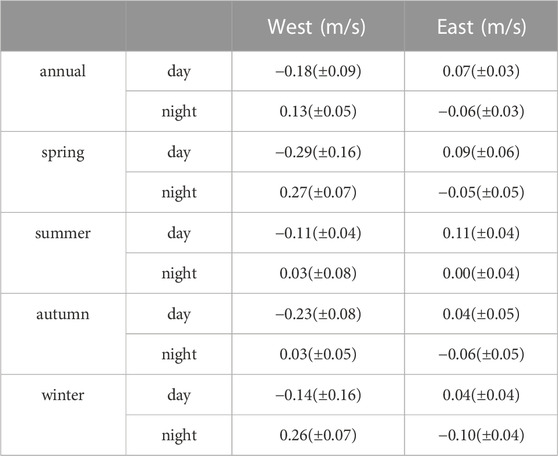
TABLE 1. The mean of local deviated wind
As shown in Figure 4, the results from this analysis support that easterly winds (land breezes) are dominant during nighttime, but westerly winds (river breezes) appear during 10:00–16:00, which has crucial impacts on dominant winds over Tongling. During the diurnal cycle, when the maximum occurs with westerly winds in the east and easterly winds in the west during 10:00–16:00, the river breezes are dominant winds; when the maximum occurs with westerly winds in the west and easterly winds in the east during 16:00–22:00, the land breezes are dominant winds. The difference is more significant in the daytime than nighttime.
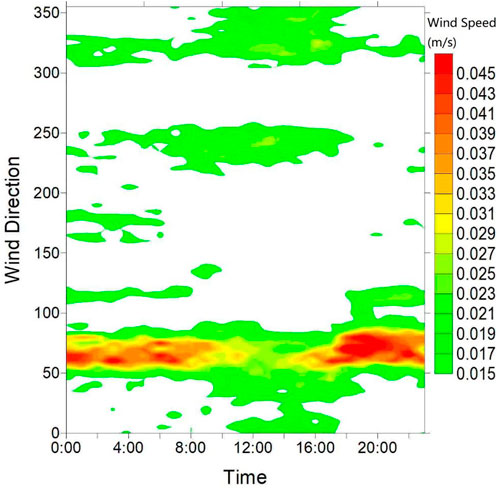
FIGURE 4. Diurnal variation of wind direction in east side of the Yangtze River.
The main cause of river-land breeze is the different heat capacity between river and land. Suppose Q (J/m2) is solar radiation flux, C is specific heat capacity of surface (land and water), dT represents the change of temperature due to radiation, and m indicates unit mass of atmosphere. Then the formula of solar radiation flux is as following:
Because specific heat capacity of land (denoted as CL) is smaller than that of water (denoted as CW), for same solar radiation, temperature change of water (denoted as dTW) is less than that of land (denoted as dTL). In the daytime, temperatures of both land and the Yangtze River rise because of solar radiation, but the land is heated much quicker than the river, resulting in warm land and cold water. In contrast, during the night, temperatures of both land and the Yangtze River decrease due to radiation cooling, but the land cools much quicker than the river, resulting in cold land and warm water. A pressure gradient is generated due to the temperature difference between the Yangtze River, which leads to airflow movement.
According to atmospheric state equation
Diurnal variation of the speed of
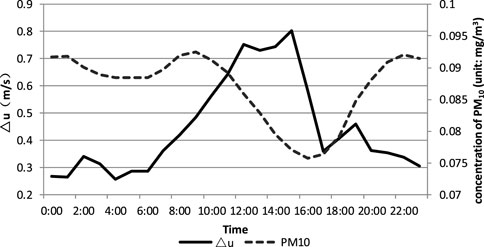
FIGURE 5. Diurnal variation of
Unlike the variation of PM10 concentration which is primarily determined by the meteorological conditions, the variation of the NO2 and SO2 concentrations is much more complicated and subjected to combined effects from multiple factors. Therefore, we use PM10 as a representative of air pollutant to study the impact of river-land breeze on its spatial distribution.
We first calculate the domain-averaged concentration of the PM10, then the PM10 anomalies at each observation station can be obtained by subtracting the averaged PM10 value from the observed PM10. Those anomalies reflect the inhomogeneity of the PM10 spatial distribution.
According to the diurnal variation of averaged PM10 concentration from four stations, the main period of reduced concentration is 9:00–16:00. During that period, the speed of
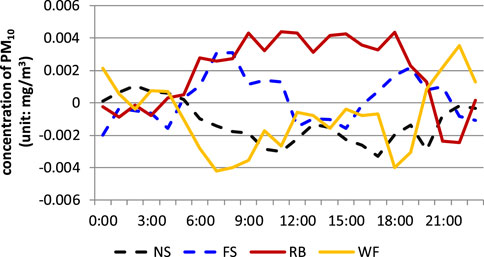
FIGURE 6. Diurnal variation of PM10 anomalies at individual stations.
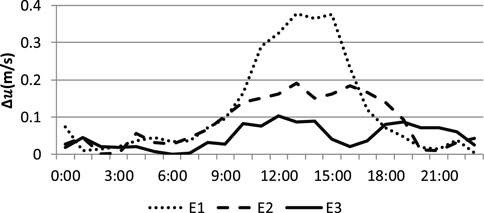
FIGURE 7. Diurnal variation of the local deviated wind speed (
The diurnal variation of pollutant concentration is also obvious in Figure 6. The anomalous PM10 concentration at those four stations gradually increase starting from 6:00 and decrease after 20:00. This period corresponds to the exact time frame when the local deviated winds are enhanced (Figure 7), indicating a strong correlation between the pollutant concentration and the local deviated winds. In addition, there are also remarkable diurnal variation for the differences of averaged
There are strong correlations about the diurnal variation of pollutant concentration between the stations. The correlation coefficient is -0.75 between stations NS and RB and -0.71 between stations WF and FS. The strong negative correlations between these two pairs of stations imply a plausible scenario that the pollutants are transported between stations: the concentration of pollutant in one observation point is increased, while the concentration of pollutant in the other point is decreased.
Figure 8 is the scatter diagram of local deviations of PM10 concentration (SD-PM10) and the speed of

FIGURE 8. Scatter diagram of the local deviations of PM10 concentration (SD-PM10) and the local deviated wind (
The above analysis shows: 1) river-land breeze causes strong local wind in the area near the Yangtze River and helps to spread the air pollutants, which results in a low concentration of pollutant in this area; 2) in the daytime, river breeze transports the pollutants away from the Yangtze River, leading to a negative correlation of the pollutant concentration between the areas close to and far away from the river. 3) Under a weak river breeze (
A river-land breeze is a regional meteorological phenomenon caused by the difference of heat capacity between water and land. As one of the major mining cities near the Yangtze River, Tongling is subjected to significant influences from the river-land breezes. The river-land breezes in Tongling have the following characteristics:
1) During the spring, the local deviated wind (river-land breeze) is more prominent, and the speed of breeze in daytime is stronger than the speed at night.
2) Although the dominant winds in Tongling are easterlies, they frequently turn to westerlies due to the influences of breezes.
3) The river-land wind component is large for area near the Yangtze River and small for those far from, and it exhibits a significant non-linear decreasing relation with the increase of the distance from Yangtze River.
Under the influence of the river-land breezes, the spatial distribution of PM10 concentration in Tongling has the following characteristics:
1) PM10 concentration is lower at the stations near the Yangtze River and higher at the stations far away. The discrepancies of concentration between different stations gradually increase after 6:00.
2) In the daytime, river breeze transports the pollutants away from the Yangtze River, leading to a negative correlation of the pollutant concentration between the areas close to and far away from the river.
The raw data supporting the conclusions of this article will be made available by the authors, without undue reservation.
For research articles with several authors, a short paragraph specifying their individual contributions must be provided. The following statements should be used “Conceptualization, HZ; methodology, YH; software, XW; validation, XH; formal analysis, SW; investigation YH; resources, HZ; data curation, YH; writing—original draft preparation, HZ; writing—review and editing, YH; visualization, YH; supervision, YH; project administration, HZ; funding acquisition, HZ. All authors have read and agreed to the published version of the manuscript. Authorship must be limited to those who have contributed substantially to the work reported.
The authors acknowledge support from the Natural Science Foundation of Anhui Province (2108085MD138), the National Key R&D Program (2018YFC0213806), and the Anhui Public Welfare Technology Application Research Linkage Project (1604f0804002). We acknowledge editors and reviewers for improving the language of the paper and for in-depth discussions. We would like to thank LetPub (www.letpub.com) for providing linguistic assistance during the preparation of this manuscript.
The authors declare that the research was conducted in the absence of any commercial or financial relationships that could be construed as a potential conflict of interest.
All claims expressed in this article are solely those of the authors and do not necessarily represent those of their affiliated organizations, or those of the publisher, the editors and the reviewers. Any product that may be evaluated in this article, or claim that may be made by its manufacturer, is not guaranteed or endorsed by the publisher.
Alexandra, M., Carla, G., Marta, C., Isabel, R., David, C., and Myriam, L. (2016). Investigating ozone high levels and the role of sea breeze on its transport. Atmos. Pollut. Res. 7 (2), 339–347. doi:10.1016/j.apr.2015.10.013
Avissar, R., and Pielke, R. A. (1989). A parameterization of heterogeneousl and surfaces for atmospheric numerical models and its impact on regional meteorology. Mon. Weather Rev. 117, 2113–2136. doi:10.1175/1520-0493(1989)117<2113:apohls>2.0.co;2
Choi, S-Y., Young-Hee, L., Cho, C., and Kim, K. R. (2015). Analysis of local wind induced by surface heterogeneity and sloping terrain near nakdong river, asia-pac. J. Atmos. Sci. 51 (3), 249–257. doi:10.1007/s13143-015-0075-4
Clappier, A., Martilla, A., Grossi, P., Thunis, P., Pasi, F., Krueger, B. C., et al. (2000). Effect of sea breeze on air pollution in the greater athens area. Part I: Numerical simulations and field observations. J. Appl. Meteorology 39 (4), 546–562. doi:10.1175/1520-0450(2000)039<0546:eosboa>2.0.co;2
Crosman, E. T., and Horel, J. D. (2010). Sea and lake breezes: A review of numerical studies. Boundary-Layer Meteorol. 137, 1–29. doi:10.1007/s10546-010-9517-9
Crosman, E. T., and Horel, J. D. (2012). Idealized large-eddy simulations of sea and lake breezes: Sensitivity to lake diameter, heat flux and stability. Boundary-Layer Meteorol. 144, 309–328. doi:10.1007/s10546-012-9721-x
Fu, X., Wang, S. X., Zhao, B., Xing, J., Cheng, Z., Liu, H., et al. (2013). Emission inventory of primary pollutants and chemical speciation in 2010 for the Yangtze River Delta region, China. Atmos. Environ. 70 (0), 39–50. doi:10.1016/j.atmosenv.2012.12.034
Hu, J., Wang, Y., Qi, Y., and Zhang, H. (2014). Spatial and temporal variability of PM2.5 and PM10 over the north China plain and the Yangtze River Delta, China. Atmos. Environ. 95, 598–609. doi:10.1016/j.atmosenv.2014.07.019
Melas, D., Kioustioukis, I., and Lazaridis, M. (2006). “The impact of sea breeze on air quality in the Athens area,” in Advances in air pollution modelling for environmental security. Editors L. Farago, K. Georgiev, and Á. Havasi (Netherlands: Springer), Vol. 54, 285–295.
Oliveira, A. P., and Fitzjarrald, D. R. (1993). The Amazon river breeze and the local boundary layer: I – observations. Bound. Layer. Meteorol. 63 (1–2), 141–162. doi:10.1007/bf00705380
Porson, A., Steyn, D. G., and Schayes, G. (2007). Sea-breeze scaling from numerical model simulations, Part I: Pure sea breezes. Boundary-Layer Meteorol. 122, 17–29. doi:10.1007/s10546-006-9090-4
Silva Dias, M. A. F., Silva Dias, P. L., Longo, M., Fitzjarrald, D. R., and Denning, A. S. (2004). river breeze circulation in eastern amazonia: Observations and modeling results. Theor. Appl. Climatol. 78, 111–121.
Wang, J., Wang, S., Scott, V. A., Zhao, B., Jang, C., Jiang, J., et al. (2015). Assessment of short-term PM2.5-related mortality due to different emission sources in the Yangtze River Delta, China. Atmos. Environ. 123, 440–448. doi:10.1016/j.atmosenv.2015.05.060
Wang, X-H., Lu, E., and Xiao, Y. (2010). River-land wind features in Yangtze River Ma'anshan Branch and countermeasures for air pollution. J. Central South Univ. Forestry& Technol. 30 (1), 120–124.
Keywords: river-land breeze, the distribution of air pollutant, inhomogeneity, PM10, Yangtze River Delta
Citation: Zhang H, Wang X, Hong X, Wang S and Huang Y (2023) Observational study of river-land breeze and its influence on distribution of PM10 concentrations over a main mining city in the Yangtze River Delta, China. Front. Earth Sci. 10:1073885. doi: 10.3389/feart.2022.1073885
Received: 19 October 2022; Accepted: 12 December 2022;
Published: 04 January 2023.
Edited by:
Duanyang Liu, Chinese Academy of Meteorological Sciences, ChinaReviewed by:
Chunsong Lu, Nanjing University of Information Science and Technology, ChinaCopyright © 2023 Zhang, Wang, Hong, Wang and Huang. This is an open-access article distributed under the terms of the Creative Commons Attribution License (CC BY). The use, distribution or reproduction in other forums is permitted, provided the original author(s) and the copyright owner(s) are credited and that the original publication in this journal is cited, in accordance with accepted academic practice. No use, distribution or reproduction is permitted which does not comply with these terms.
*Correspondence: Yong Huang, aHkxMjFfMjAwMEAxMjYuY29t
Disclaimer: All claims expressed in this article are solely those of the authors and do not necessarily represent those of their affiliated organizations, or those of the publisher, the editors and the reviewers. Any product that may be evaluated in this article or claim that may be made by its manufacturer is not guaranteed or endorsed by the publisher.
Research integrity at Frontiers
Learn more about the work of our research integrity team to safeguard the quality of each article we publish.