 Keran Li
 Jinmin Song
 Shun Xia
 Beiwei Luo
 Junke Wang
 Yong Zhong3
 Shan Ren
- 1State Key Laboratory of Oil and Gas Reservoir Geology and Exploitation, Chengdu University of Technology, Chengdu, China
- 2Research Institute of Petroleum Exploitation and Development, Beijing, China
- 3Sichuan Geophysical Company of CNPC Chuanqing Drilling Engineering Company Limited, Chengdu, China
Salt structures are crucial targets in oil and gas seismic exploitation so that one fast, automatic and accurate method is necessary for accelerating salt structure identification in the exploitation process. With the development of machine-learning algorithms, geophysical scientists adopt machine-learning models to solve problems. Most machine-learning models in geophysics require mass data in the model training. However, the number of seismic images is limited and the class-imbalance is often existed in actuality, causing the machine-learning algorithms to be difficult to apply in exploitation projects. To overcome the challenge of the seismic images’ volume, this work collects a two-dimensional (2D) seismic images dataset and trains several U-net models with the methods of inversion and multiple distillation. Moreover, self-distillation is introduced to boost the model’s performance. A test using a public seismic dataset and the case of salt detection in the Hith evaporite in southern United Arab Emirates and western Oman shows the distillation method is able to identify salt structures automatically and accurately, which has great potential for application in actual exploitation.
1 Introduction
Successful oil and gas explorations in the subsalt zone have made salt structures more attractive targets (Davison, 2009). A salt structure is a crystalline aggregate of the evaporite minerals halite, anhydrite, hydrated anhydrite, and gypsum, with other, non-evaporite minerals (Hudec and Jackson, 2007). Salt structures are a special type of diapir, which form by flow deformation of the evaporites under the actions of loading differences and buoyancy (Hudec and Jackson, 2006), gravity (Jackson and Talbot, 1986; Rowan et al., 2012), or regional tectonic stress (Brun and Fort, 2012, 2011; Pilcher et al., 2011). Salt structures have been deposited in cratonic basins, synrift basins, postrift passive margins, continental collision zones, and foreland basins (Jackson and Talbot, 1986; Hudec and Jackson, 2007, 2006). Besides the deposition and kinetic differences among the salt structures, they can be divided into allochthonous salt (Lehner, 1969; Watkins et al., 1975), salt sheets (Jackson, 1995; Hudec and Jackson, 2006; Talbot and Pohjola, 2009) and salt canopies (Talbot and Jackson, 1987; Jackson et al., 1994) based on geometric variations.
The compactness (Warren, 2006; Schreiber et al., 2007) and low permeability of the evaporite minerals (Liu et al., 2016) mean that the salt structures are highly correlated with the formation of structural reservoir systems (Seni and Jackson, 1983; Richardson et al., 2005). Complicated pore systems have been found in salt lithology, which are the basis for reservoirs (De Las Cuevas, 1997; Cinar et al., 2006; Loncke et al., 2006). Moreover, except for being traps, salt structures also facilitate hydrocarbon source generation and accumulation. Salt is a poor conductor of heat, so it can prevent the loss of heat in subsalt formations (Petersen and Lerche, 1996; Anissimov and Moscowsky, 1998). Concurrently, with the provided pressure from the overlying salt formation, the thermal evolution of organic matter is promoted (Mello et al., 1995; Petersen and Lerche, 1996; Nagihara, 2003). Based on improvement of the thermal evolution, the source rocks developed through the salt structures have excellent hydrocarbon-generating conditions. In addition, the abundant fault systems developed within the salt structures could be pathways for hydrocarbon migration (Demaison and Huizinga, 1991). With their gap layer development, potential for pore system development, and hydrocarbon generation and migration, salt structures are excellent oil and gas exploration targets.
Salt structure identification relies mainly on seismic data, gravity analysis, and well logging data. On seismic images, the geometrical, steep sides of the salt structure, seismic wave propagation and velocity pattern analyses are fundamental salt structure identification methods (Jones and Davison, 2014; Asgharzadeh et al., 2018; Shahbazi et al., 2020). Considering the physical property differences among the salt and the surrounding sediment layers, methods to classify salt structure boundaries have been adopted e.g., seismic attribution extraction (Di et al., 2019a; 2019b). Salt-structure detection has been aided by machine-learning methods development, including normalized full gradient machines (Soleimani et al., 2018), the oriented gradients histogram combined with support vector machines (Hosseini-Fard et al., 2022) and mostly, convolution neural networks (CNNs) (Di et al., 2018; Gramstad and Nickel, 2018; Karchevskiy et al., 2018). However, these methods require a considerable amount of seismic data to calculate the seismic attributes. Seismic data are limited in actual projects (belongs to few-shot task) and the quality cannot be guarantee, so the machine-learning algorithms are hard to build. In the field of computer vision, the knowledge distillation method has been adapted in the few-shot tasks (Wang et al., 2020). Chen et al., 2017 firstly introduced the knowledge distillation method in objects detection and proves the knowledge distillation could improve the performances of models. For the classification of the targets and the background, distillated knowledge from the targets and the background could even reach higher precision (Wang et al., 2022). Besides distilling the knowledge from pretrained state-of-the-art (SOTA) large models, Zhang et al., 2019 proposed the self-distillation method (named as “Be your own teacher”, shorten as “self-teacher”) to regularize the model training. The few-shot task in the salt structure identification is also noticed and attracts wide attention. To overcome the challenge of few-shot task, Sen et al., 2019 trained a U-net like encoder-decoder model with label perturbing strategy and the ensemble strategy. In recent years, semisupervised learning methods (SSL) are adopted in the salt structure identification to solve the small-sample problems. The framework of SSL depends mainly on U-net like encoder-decoder architectures with mixup method (Jia et al., 2022) and the multiview shifting (Sen et al., 2020). The SSL is the nowadays popular method for the salt structure identification.
To the best of our knowledge, this work firstly introduces the mechanisms of the target flip, multiple and self distillations. To exploit the effects of the knowledge distillation on the salt structure identifications and establish an algorithm with lower seismic data requirements, this study proposes a new workflow to identify salt structures on seismic images in an imbalanced image dataset. Our workflow attains high accuracy in several experiments. Based on the actual case, our workflow is suitable for use in practical oil and gas exploration.
2 Data and computing environment
To build the deep-learning model for salt identification, over 30,000 images are collected (the source about the images is in the Supplementary Material). The segmented labels are masked by the Labelme software (https://jameslahm.github.io/labelme/) on the Anaconda platform (https://www.anaconda.com/). After annotation and segmentation, the paired raw and masked images are resampled into 100×100 pixels by the Cut tool (Supplementary Material) on the PyCharm platform (https://www.jetbrains.com/pycharm/).
In this study, all algorithms are built on an accessible cloud service, Featurize virtual machines (https://featurize.cn/). The virtual machines access an NVIDIA RTX 3060 with a memory of 12 GB and Intel E5-2680 v4 central processing unit with six cores. All codes are operated on the Ubuntu 20.4 system, with CUDA v11.2 and PyTorch v1.10.
3 Methods
3.1 Task description
The image dataset for salt identification can be defined as:
where D is the total images. X is the total raw seismic images and Y is the total segmented seismic images.
Considering that the seismic images contain two classes, salt and nonsalt (marked as background), dataset D equals to:
Taking the form of Eq. 2 into Eq. 1, the dataset D can be defined as:
M and N are the number of the seismic images and the number of the background images. n equals M plus N.
Defining the
3.2 U-net model
The U-net model was proposed by Ronneberger et al. (2015) to segment medical images. The U-net model also has been widely used in geophysics–machine-learning combined research (Wager et al., 2013; Hu et al., 2019; He et al., 2022). In a U-net model, the network takes two-dimensional (2D) seismic images as input and the corresponding segmented labeled images as the output data. The U-net model consists of two almost symmetrical encoder–decoder paths. The U-net model schematic used in this work is shown in Figure 1, including convolution layers, residual connecting layers, the rectified linear unit (ReLu) (Xu et al., 2016), maxpooling layers, and up-sampling and dropout blocks. In the left-side down-sampling path, each layer consists of one convolution layer, a residual connecting layer, and a combination of the residual connecting layer and a Relu function. The interlayer is a maxpooling layer and dropout block (Wager et al., 2013). Via the fourth layer in the down-sampling path and the interlayer, the data flow enters the middle layer and is passed into the up-sampling path. The layers in the up-sampling path have similar architecture to the layers in the symmetrical down-sampling path; the difference is that the interlayer in the up-sampling path is a combination of an up-sampling layer and a dropout block. In this study, all U-net models in all stages share same architecture and hyper-parameters.
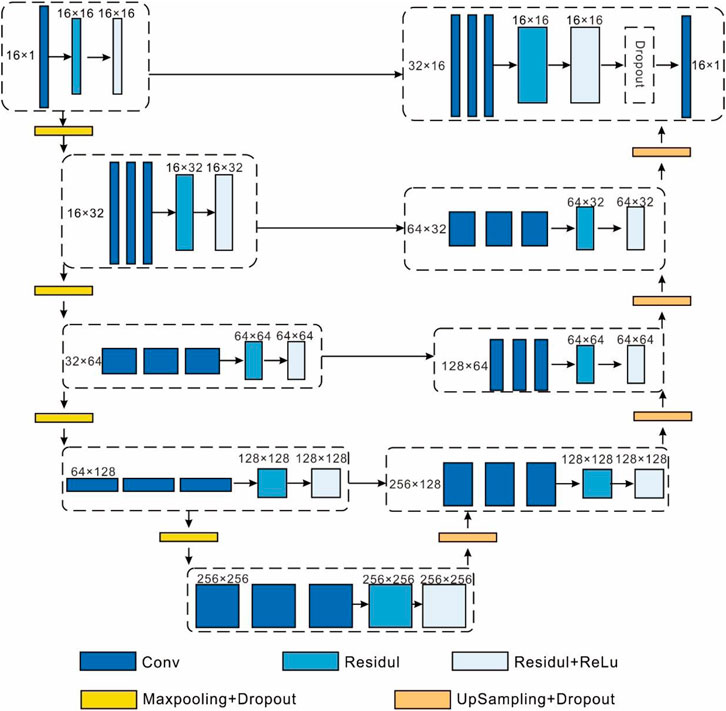
FIGURE 1. The structure of the U-net model.
3.3 Target flip
The collected and processed dataset has substantial class imbalances between salt and non-salt seismic images. The ratio of salt and non-salt images in the training datasets is approximately 1:30. To reduce the bias in the training datasets, a series of data augmentation methods is used before target flip, including flip, rotation, scaling, crop, translation, adding Gaussian noise, and the synthetic minority oversampling technique (SMOTE) (Chawla et al., 2002). After the augmentation, the ratio of salt and non-salt images reduces to approximately 1:10. In this ratio, a high risk of overfitting and losing the target salt still exists. In epoch I, for batch size S, the sampling process is sequential. To ensure at least one segmented image exists in batch size S, the ratio of the background and salt images would be:
Taking the actual ratio 1:10 into Eq. 5, the batch size S is 11. This batch size would reduce the model generalization. In image classification, S is usually 64 or even larger. Taking 64 into Eq. 5, the ratio of salt and background is 1:63. Too many background images (63 vs. 1) would trap the model in the features of the background instead of the salt.
To avoid uncontrollable feature mapping, we train a U-net model on the target flipped image datasets, aiming to build an expert model to classify the background around salt tectonics. Before target flipping, the target, salt (s) in the images is transferred into the background (b). During the transferring, the pixels can be represented as:
where P and Q are the length and width of the segmented salt images. For binarized and segmented salt images, the pixel of the salt, s and the pixel of the background, b can be replaced as 1and 0. Pixel can be replaced by:
The inversed image is given by:
With the target flip, the U-net model for identifying the non-salt part can be trained on datasets with more than 20000 images, which would yield high confidence.
3.4 Multiple distillation
Knowledge distillation (Figure 2) aims to compress the complex structure of models (Hinton et al., 2015). For a specific downstream task, unrelated knowledge from the complex model would be filtered by distillation (Lin et al., 2021). In a knowledge distillation algorithm, the complex model would the teacher model and the model trained by the special knowledge from the teacher model would be called the student model.
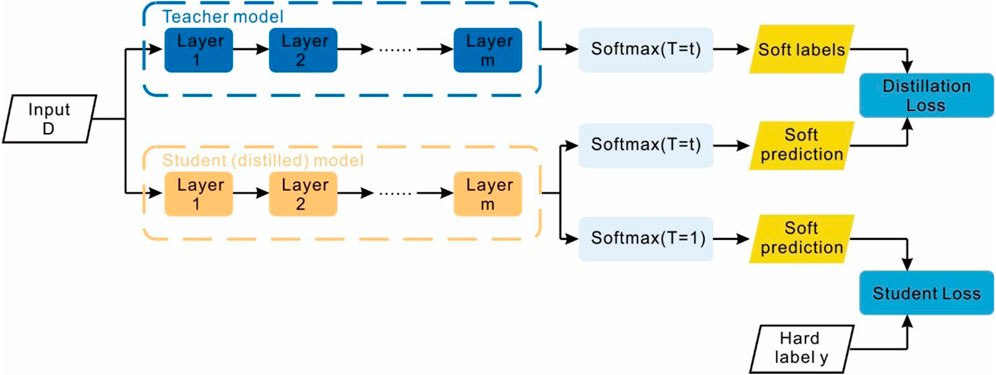
FIGURE 2. The knowledge distillation diagram (modified from https://nervanasystems.github.io/distiller/knowledge_distillation.html).
The multiple distillation is a stock of several knowledge distillation models from subsequent stages (Figure 3). For instance, in Figure 3, the blue dashed box and subsequent workflow, the stage 1 and 2 combine a distillation model to fully extract the background features and use them to assist in the salt feature mapping. During stage 1, the input data are the in flipped 2D seismic images. The target is the background. The input of stage 2 is the refined seismic images. The distilled probability of the stages except for the stage 1 is:
where z is the characteristic embedding matrix calculated by the U-net.
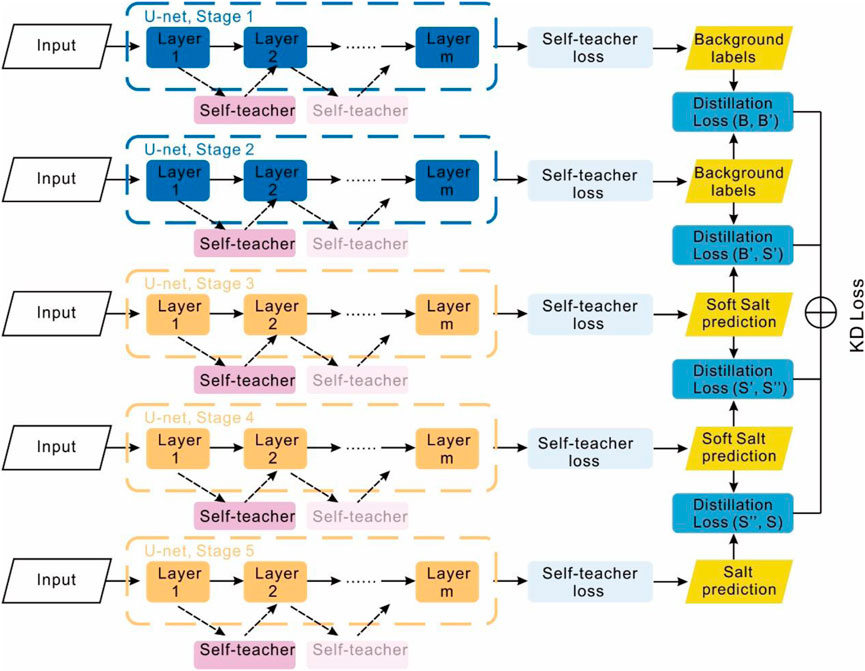
FIGURE 3. The diagram of the framework in this paper.
The task for the target detection is a binary classification. The distilled probability for the background can be transferred from Eq. 9, as:
The basic loss is calculated by the cross-entropy function:
For instance, taking Eq. 11 into the normal knowledge distillation loss between stages 1 and 2, the loss function comprises two losses, where the two learnable parameters α and β are introduced, the loss of stages 1 and 2 is:
In stage 3, the input data are the whole set of 2D seismic images D. The model from stage 2 becomes the teacher model for the stage 3 model. Like the distilled probability of the background, the distilled probability for the salt is:
However, stage 3 needs to avoid the background feature information. To amplify the influence of the background and reverse the probability distribution, the reciprocal is used in the logit function:
Stages 4 and 5 are similar to stage 2. The input data are the unreversed 2D seismic images Drefine-inverse and Drefine for stage 4 and the whole set of 2D seismic images D for stage 5. The distilled probability and distillation loss are the same as in Eqs 9–13.
3.5 Self-distillation
Self-distillation is a special situation for the distillation algorithm, where the teacher and student models are combined into one ensemble. Self-distillation adopts the information of the label to accelerate the model convergence (Zhang et al., 2019). In this work, we adopt the self-distillation block from Xu et al. (2020) and add self-distillation blocks among the layers in the U-net model to reduce the risk of class imbalance (Figure 3). The self-distillation block is a layer-series sliding average parameter estimate. The ith self-distillation works after the parameters are updated in the ith layer when the jth epoch is completed. During the parameter updating in the i+1st layer, the parameters θi from the ith layer would output a feature matrix (X, θ)i. The (X, θ)i from the self-distillation and parameters θi+1 from the i+1st layer would be combined to update θi+1. On the basis of the cross-entropy function, the self-distillation loss can be represented as:
3.6 Workflow
The workflow of this research follows these steps:
1) The dataset is processed via target flip firstly. The target is the background. After flipped, the dataset is fed to the U-net model in the stage 1 with the assistance of self-distillation during training.
2) When the training completes in the step 1, the flipped dataset starts to be sent into the U-net model with the self-distillation. During the training, the loss function is the distillation loss (Eq. 12) plus the self-distillation loss (Eq. 15).
3) In the step 3, the inputting dataset is the normal segmented images, where the target is the salt structure. The training process is similar to that in the step 2. The loss function contains the distillation loss (Eq. 14) and the self-distillation loss (Eq. 15). Differently, the distillation loss here should be replaced by Eq. 14, instead of Eq. 12. The aim is to guide the U-net model in the stage 3 avoiding extracting features of the background.
4) and (5) The step 4 and 5 are same. The normal dataset is fed into U-net models and the loss function is the distillation loss (Eq. 12) plus the self-distillation loss (Eq. 15).
The diagram of the workflow can be seen in Figure 4.
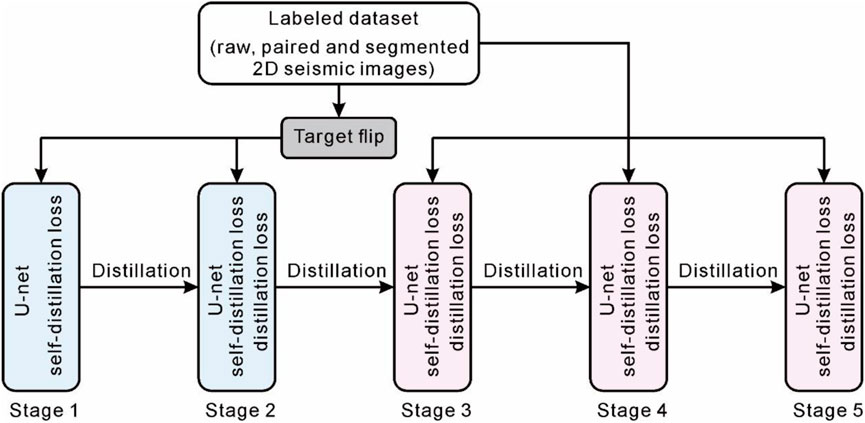
FIGURE 4. The diagram of the workflow.
3.6.1 Ultrascale salt reconstruction
The seismic images size of 100×100 pixels is far less than the size of the actual seismic images. For the training images, the identification of real seismic images is an ultrascale identification task. For the 100×100-pixel images, the model initializes with a starting point first, then samples the images, and forward calculates the possible label classifications. To identify the salt structures at ultrascale, the saved checkpoints from stage 5 are prepared first. Second, the Cut program shears the ultrascale seismic images into the size of 100×100 pixels. The cut images are sent to the model to predict the salt zones. Last, the predicted cut images are returned to the original size. The reconstruction algorithm in shown in Table 1.
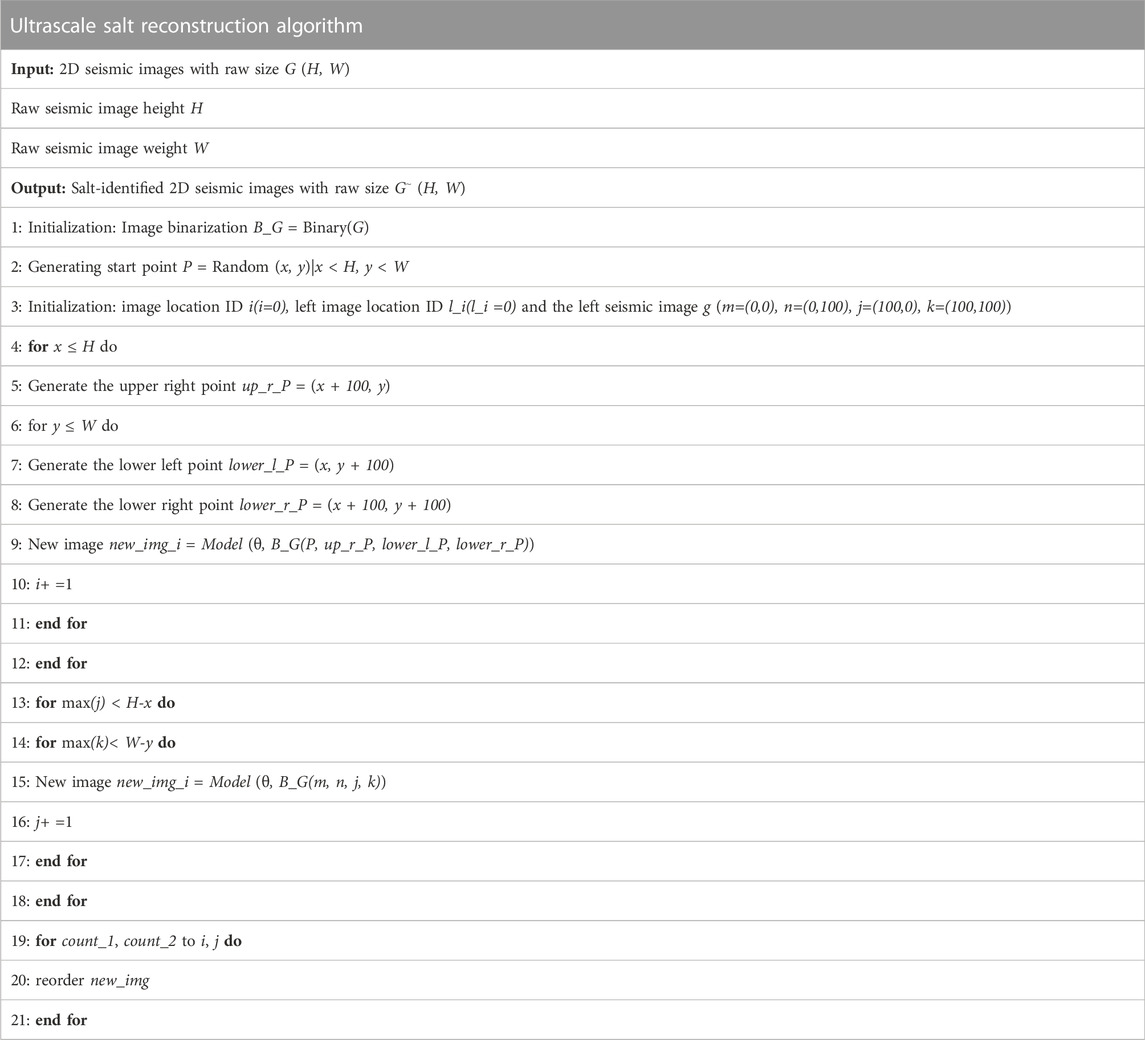
TABLE 1. The ultrascale salt reconstruction algorithm.
4 Results
4.1 Loss
The training process was conducted across 1,200 epochs (120 training batches) with the one-cycle method (Smith, 2018). Four distillations among five stages reach stability (Figure 5). The losses from the training and validation datasets dropped synchronously and reach close agreement after stabilizing, indicating that all distillation stages are not overfitting with the self-distillation (Figure 5). For the first distillation, the losses of the training and validation datasets decrease from 0.6 to 0.3 (Figure 5A). Receiving the distilled knowledge of the background, the loss curves start at 0.6 and drop to 0.1 in the steady state (Figure 5B). With the knowledge from the second and third distillations and the self-distillation blocks from the interlayer, the losses achieve 0.25 (Figure 5C) and 0.05 (Figure 5D).
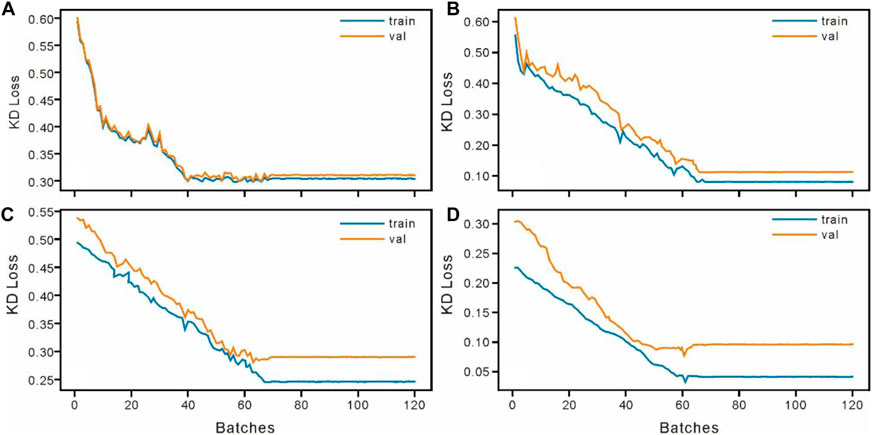
FIGURE 5. The distillation training and validation datasets (considering no bias in different stages, the parameters α and β in the distillation loss are set as 0.5. Each batch has 10 epochs) (A) Stage 1; (B) Stage 2; (C) Stage 3; (D) Stage 4.
4.2 Intersection over union
4.2.1 Stage 1
The U-net model detects the background regions in the 2D seismic images in stage 1 with the assistance of the self-distillation only. Visualization shows that the U-net model could roughly identify the background and has poor performance for border classification (Figure 6). The model determines several strong reflection zones in the seismic images as the background (green part, Figure 6). The average intersection over union (IoU) for stage 1 is 0.45 for the background detection, indicating that the U-net model precision in stage 1 is lower than 50%.
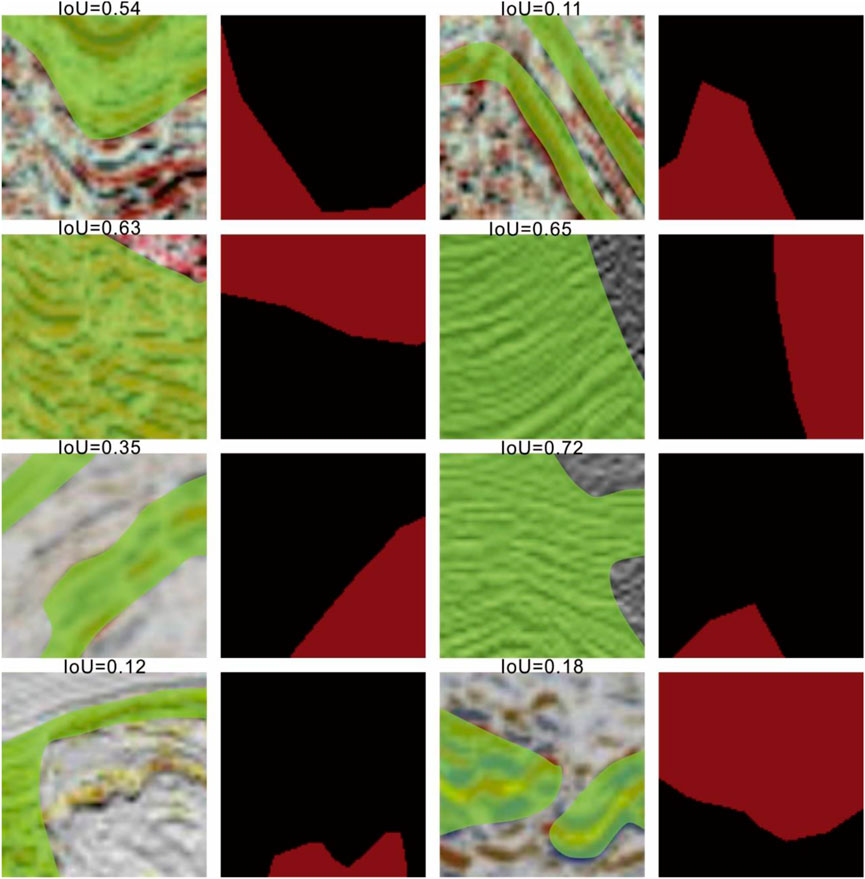
FIGURE 6. The stage 1 performance for background detection, with intersection over union (IoU) values (the green part is the background; in the segmented images, the red part is the salt structure and the black part is the background).
4.2.2 Stage 2
The average IoU for stage 2 improves to 0.85, indicating that the precision of the U-net model is close to 85%. With the distilled background knowledge from the model in stage 1, the background object identification performance improves by 40%, suggesting the distillation effectively enhances the background identification capability. Visualization (Figure 7) shows that the U-net model in stage 2 could identify a complex seismic reflection pattern instead of identifying a strong reflection as the background signal.
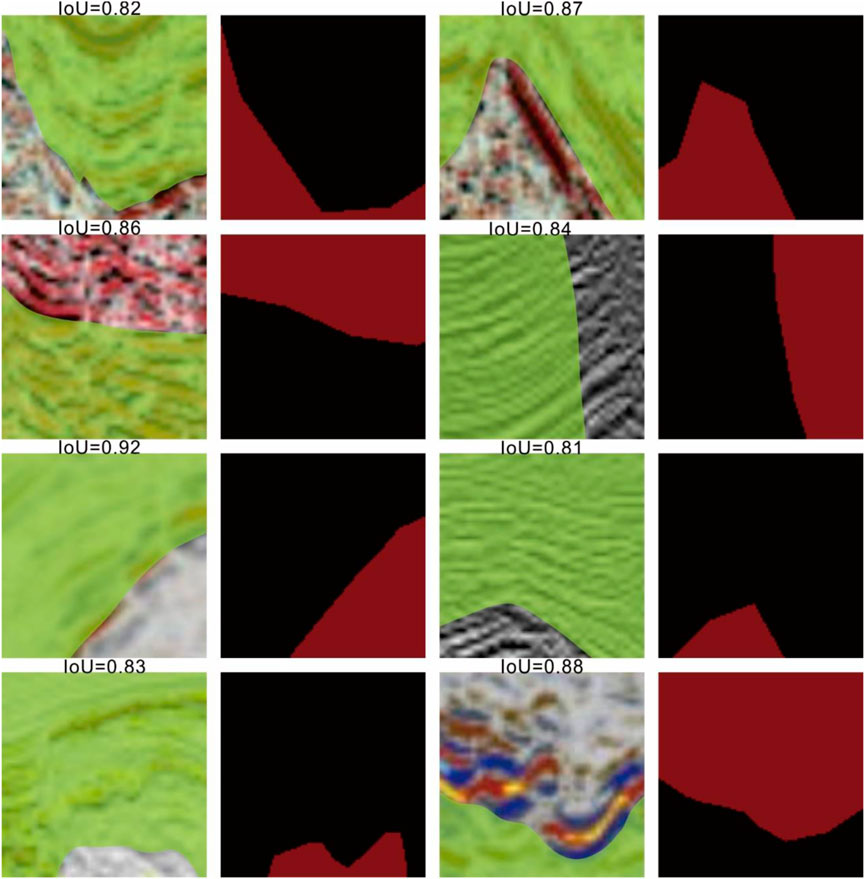
FIGURE 7. The stage 2 performance for background detection, with intersection over union (IoU) values (the green part is the background; in the segmented images, the red part is the salt structure and the black part is the background).
4.2.3 Stage 3
In stage 3, the model starts to process 2D seismic images for salt detection. With the distilled knowledge from stage 2, the model still has poor performance. The average IoU for stage 3 is 0.58. Visualization (Figure 8) shows that stage 3 could classify some simple patterns of the salt but performs poorly for complex patterns. The background zones are rarely regarded as salt, indicating the previous knowledge of the background effectively guides the model to extract the features of potential salt zones.
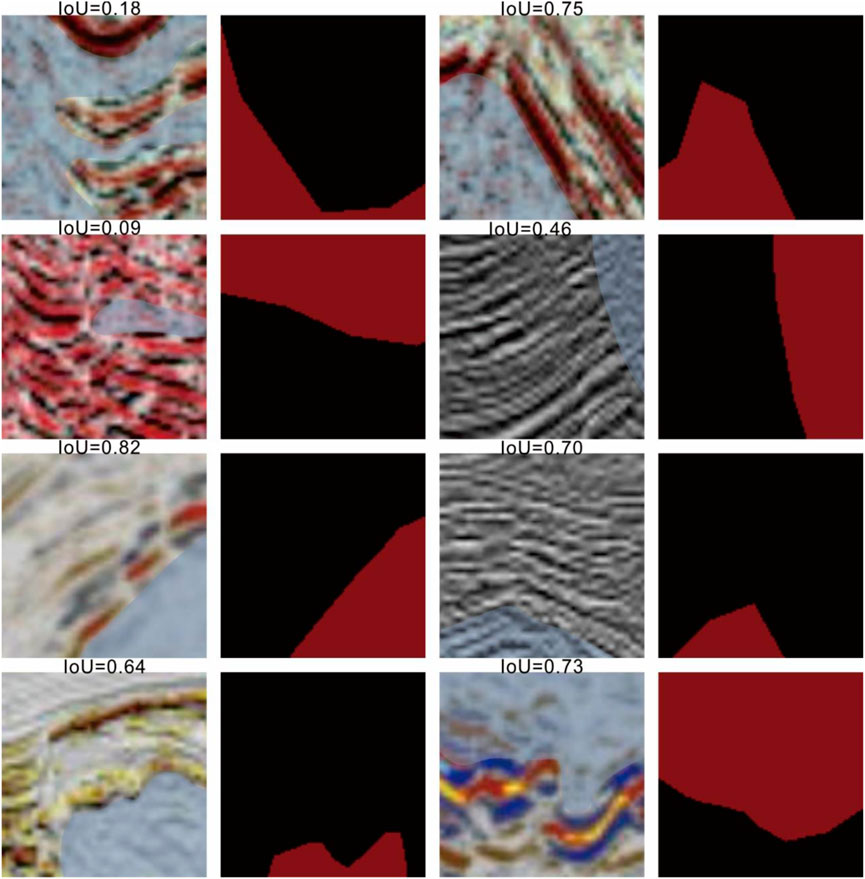
FIGURE 8. The stage 3 performance for salt detection, with intersection over union (IoU) values (the blue part is the salt structure; in the segmented images, the red part is the salt structure and the black part is the background).
4.2.4 Stage 4
In stage 4, the model has stronger capability for identifying salt with the distilled knowledge from stage 3. The average IoU reaches 0.81, meaning nearly 80% of the salt occurrences are identified in the seismic images. Compared with the visualization of the stage 3 (Figure 8), the visualization in stage 4 (Figure 9) shows that the model starts to pay attention to the inner weak reflections on the basis of the stage 3 information.
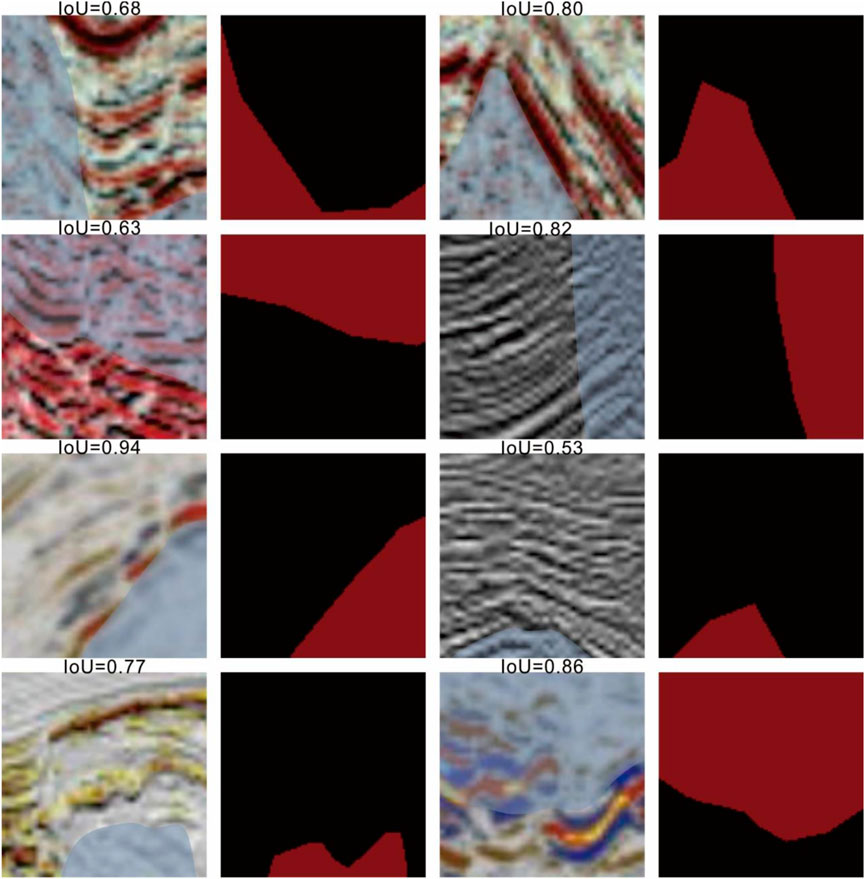
FIGURE 9. The stage 4 performance for salt detection, with intersection over union (IoU) values (the blue part is the salt structure; in the segmented images, the red part is the salt structure and the black part is the background).
4.2.5 Stage 5
The performance of the model in identifying complex patterns improved during stage 5. The average IoU is 0.95. The high areas of the intersection show that the model could identify salt with high accuracy. The visualization also proves that the model in stage 5 extracts the complex patterns of the salt (Figure 10).
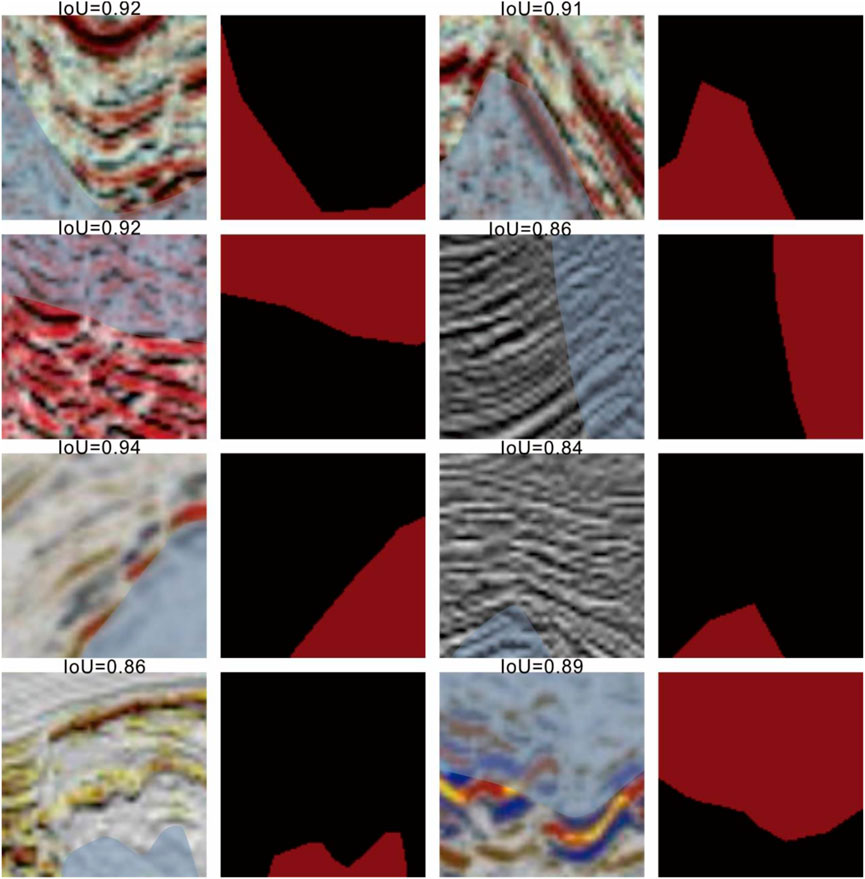
FIGURE 10. The stage 5 performance for salt detection, with intersection over union (IoU) values (the blue part is the salt structure; in the segmented images, the red part is the salt structure and the black part is the background).
4.2.6 Ultrascale salt identification
In this work, the input for ultrascale salt identification is the raw and unsegmented images with Gaussian noise. With the noise, the average IoU for the raw images is 0.92, which means 92% of the predicted potential salt zones are correctly identified. Figures 11A–F shows the high similarity between the labeled and algorithm-identified salt zones. The distilled model is robust for salt identification in the actual situation. More important, the identification results prove that the ultrascale salt reconstruction algorithm is feasible for application to actual seismic images.
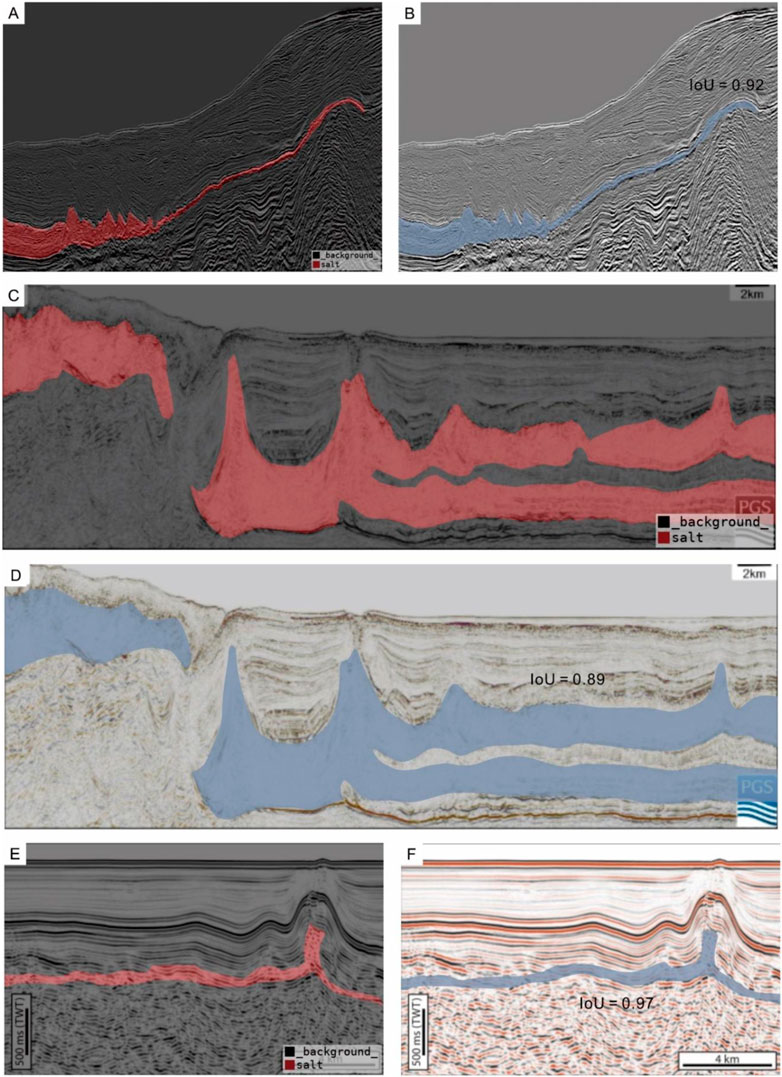
FIGURE 11. The ultrascale salt reconstruction algorithm performance for ultrascale salt identification (A) and (B) come from (Elfassi et al., 2019); (C) and (D) come from (Maunde and Alves, 2022); (E) and (F) come from (Soto et al., 2022).
TGS salt Identification challenge
The inverse multiple self-distillation model was used in a salt identification challenge (https://www.kaggle.com/competitions/tgs-salt-identification-challenge), a competition that was hosted by Kaggle. All images are actual seismic images that were interpreted by geophysical experts. The TGS salt identification challenge aimed to explore salt deposits and involved 4,000 segmented seismic images. Without any fine tuning, the average IoU of the datasets is 0.85. The model trained by the collected images accurately identified the salt (Figure 12). This accuracy ranks at approximately 300 in the TGS competition. To further compare the performance, we tested two more models. The first used the training file of the TGS datasets to fine-tune the pretrained model (stage5). The second used the inverse multiple distillation and self-distilled U-net framework to train a new model using the training file of the TGS datasets (model-2). Model-1 reaches an IoU of 0.88 while model-2 also reaches 0.88. A performance of 0.88 would rank at approximately 30 in the TGS competition, showing the framework could improve the salt identification.
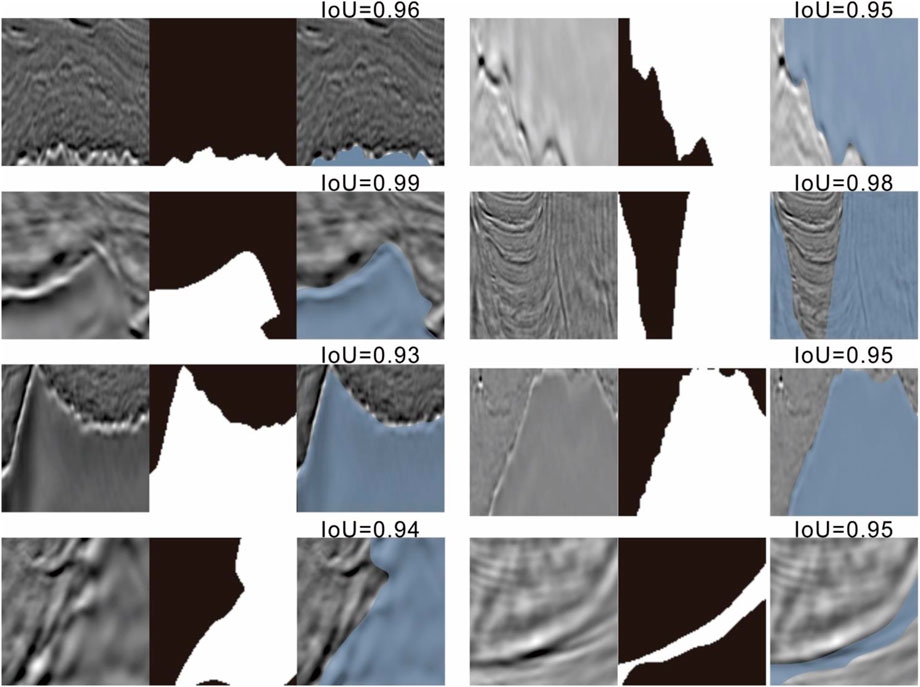
FIGURE 12. The algorithm performance on the TGS dataset (in each cell, from the left, mid to the right, are the raw seismic images, segmented labels and the predicted images. The predicted salt zone is the blue part).
5 Salt identification in the United Arab Emirates and Oman
We applied the trained U-net model to identify the salt structure in 2D seismic images from the Upper Jurassic petroleum-bearing system in the southern United Arab Emirates (U.A.E.) and western Oman (Figure 13). The 2D seismic data are limited and low quality. Moreover, because of the lack of stratigraphy and logging data, identifying the Jurassic salt with the conventional method is challenging.
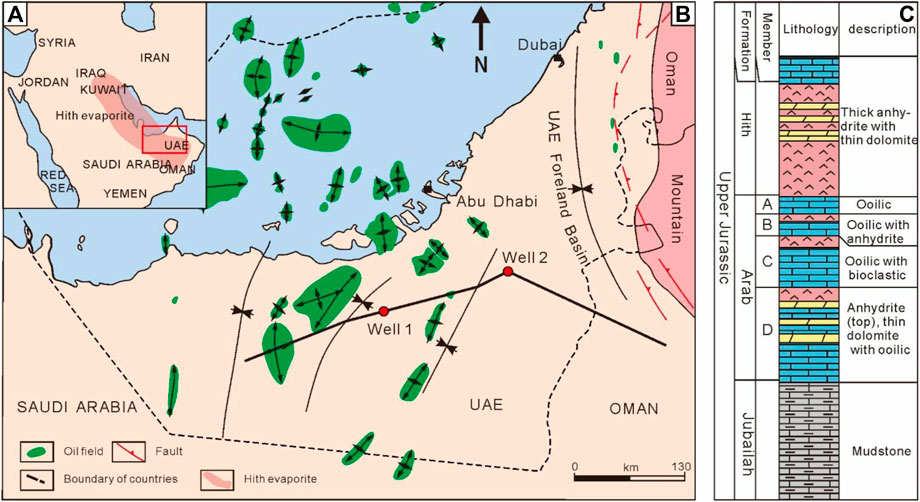
FIGURE 13. The location of the research area (A) the distribution of Hith evaporite comes from (Al-Husseini, 1997); The detail of the research area (B) The comprehensive stratigraphic histogram of the upper Jurassic in the western UAE (C) modified from (Al-Husseini, 1997; Ali and Farid, 2016)
The Hith Formation, which is the cap rock of the Jurassic petroleum-bearing system in the Persian Gulf basin, is composed of evaporite deposits (Martin, 2001; Haq and Al-Qahtani, 2005) (Figure 13C). In the research area, the Hith Formation pinches out in the southeastern U.A.E. (the foreland basin of the Oman mountain) and the contemporaneous deposits in western Oman vary into oolitic carbonates (Al-Husseini, 1997). Our well data indicate that the pinch-out line is located between well 1 and well 2 (Figure 13B) and we use the saved checkpoints from the stage 5 to predict the disappearance point in the seismic images.
The prediction process is the same as for the ultrascale salt identification. The model first selects a start point randomly and identifies the salt (orange parts) in a field of 100×100 pixels (Figure 14). Then the sheared images are reconstructed and output as an input image (Figure 15). Our model successfully predicts the Upper Jurassic Hith Formation. The results suggest that the pinch-out line develops closer to well 1.
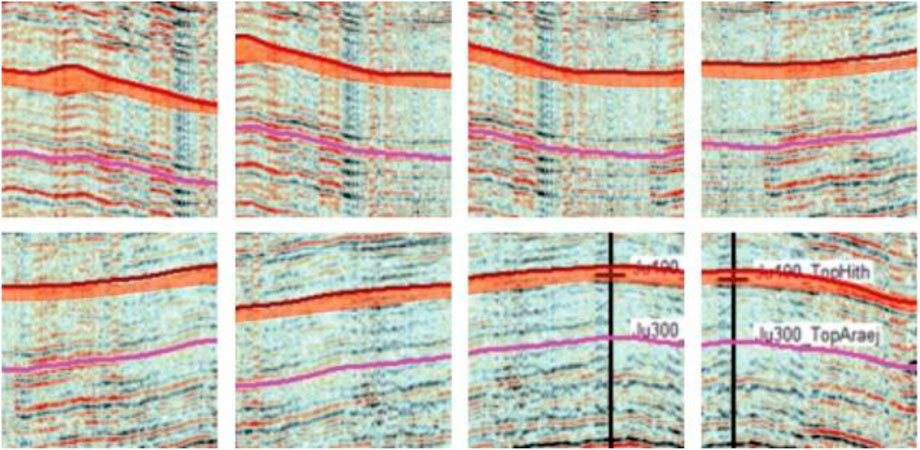
FIGURE 14. The salt identification in a field of 100×100 pixels (every image is the prediction by the model from stage 5; The orange part is the identified salt).
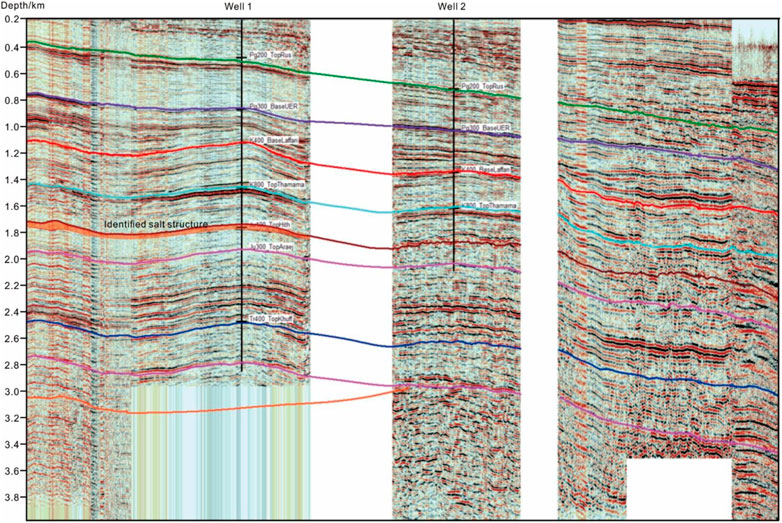
FIGURE 15. The salt identification in the sections of well 1 and well 2 (reconstructed by the ultrascale salt reconstruction algorithm; the location of this section is shown in Figure 13B).
6 Discussion
The workflow with, target flip, multiple distillation, and self-distillation has fair performance in the collected datasets, TGS salt identification challenge, and practical salt prediction. To analyze and evaluate the influence of different stages, target flip, multiple and self distillations in the complex model, ablation experiments are designed and the biases of different parts are summarized.
6.1 Target flip extracts features of the background
In our study, the target flip is to detect the features of the background. We hope the knowledge of the background (non-salt part) could be passed and facilitate the salt structure identification. To investigate the influence of the target flip, the two models to identify the background in the seismic images are dropped from stages 1 and 2. Without the model in stage 1, the losses in the training, validation, and test datasets increase to 0.62, 0.65, and 0.72 and the IoUs decrease to 0.21, 0.18, and 0.12, respectively, in the collected dataset (Figure 16A). After canceling the flip in stage 2, the losses in the training, validation, and test datasets increase to 0.68, 0.59, and 0.77 and the IoUs decrease to 0.18, 0.17, and 0.10, respectively, which are similar to the performances without inversion in stage 1 (Figure 16A). Also, the two stages are dropped simultaneously. The losses in the training, validation, and test datasets increase to 0.68, 0.69, and 0.80 and the IoUs decrease to 0.18, 0.18, and 0.09 in the collected dataset (Figure 16A). The increasing loss and dropping IoU prove the significance of the stages 1 and 2. The flips in stages 1 and 2 successfully extract the feature of non-salt part in the seismic images and passed to the down-streaming identification of salt structure. In addition, Figure 16A shows the stage 2 benefits more for the salt structure objection than the stage 1. Without the target flip and the distillation between the U-nets of the stages 1 and 2, the performance of the models to identify the salt structure would substantially reduce. The IoU reduction because of the dropping of the stage 1 and 2 indicates the target flip and consequent continuous U-nets from the stages 1 and 2 effectively extract the features of the background. From the feature maps in Figure 17A,F,G, the heat maps show the regions from the background are activated in the stages 1 and 2, approving the background regions are successfully identified firstly.
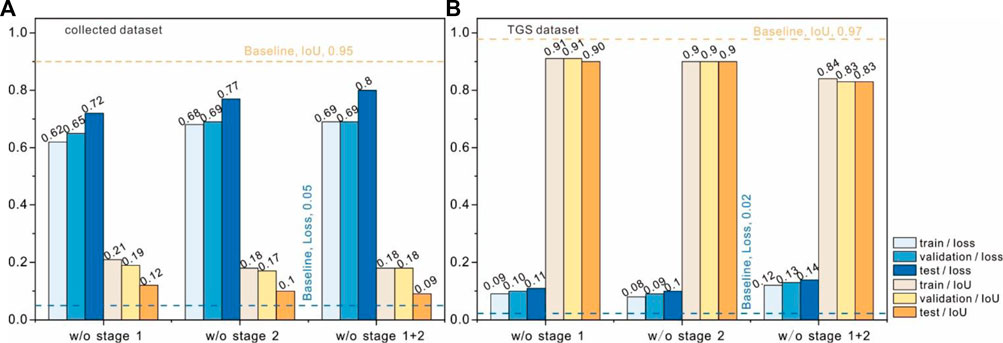
FIGURE 16. The performance of models without inversion (A) collected dataset; (B) TGS dataset.
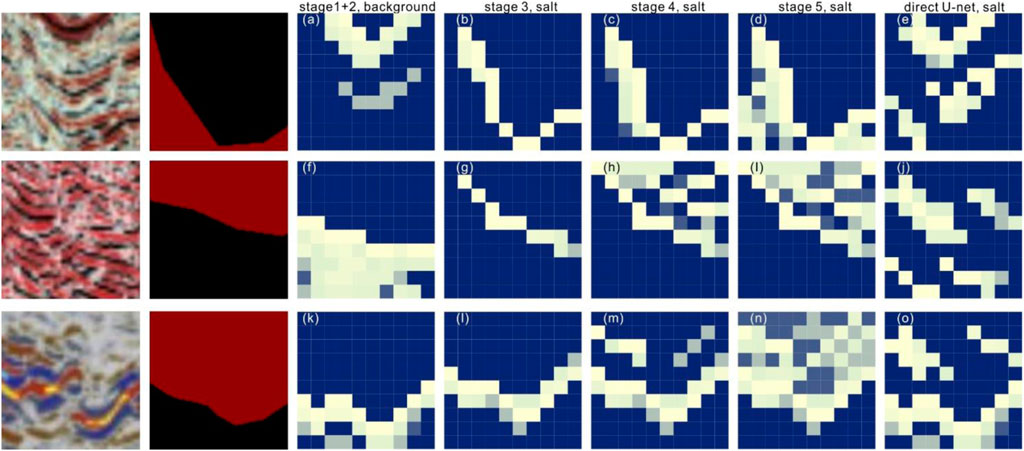
FIGURE 17. The obtained feature maps (from left to right, every column refers to the feature maps from different stage). Each line represents the feature map from one 2D seismic image and corresponding label; each column represents the same stage.
Moreover, the flip-dropped model is also evaluated in the TGS datasets. Without the flip, the performance of the model deteriorates. The loss rises by approximately 0.08 and the IoU falls by approximately 0.07 (Figure 16B). The difference in the performance is caused by the quality of the datasets. The collected dataset is directly cropped from articles (Supplementary Material) so that many images only contain background, without salt tectonics. However, the TGS datasets are selected and data-cleaned so that almost no background-only images exist in the datasets. Practically, the collected datasets are more likely close to the seismic data gathered in the actual projects. The cleaned datasets cause the volume to decrease and result in a loss of capability for model training. Although only limited improvement is gained after the target flip in the well-cleaned dataset, flips obviously improves the model’s performance in the uncleaned dataset, which is meaningful for actual applications when facing expensive data collection.
In summary, target flip improves the model’s performance when the datasets are extremely class imbalanced, which is meaningful for the actual exploitation that lacks enough salt images to complete the supervised learning. With simple flipping, feature extraction by U-nets, and information transportation by multiple distillations (details can be seen in Section 6.2), the few-shot task could be solved by semisupervised learning. The stages 1 and 2 effectively utilize the detected background information to guide the later stages to avoid the background region.
6.2 Multiple distillations transport knowledge of background and salt structures
Knowledge distillation is capable to transport the features of specific zones in the seismic images from the upstream tasks and guide the downstream image classification task (Hinton et al., 2015). In the salt identification task, the upstream identification model extracts the background features and uses this knowledge to avoid the background and identify the salt structures. With the background feature map, the loss would not decrease to zero when the input image does not contain the salt, so the gradient disappearance is avoided. The feature maps of the end-to-end, direct U-net indicate that for imbalanced datasets, models without distillation are easily trapped in the strong reflection features (Figures 17J,O). With the distilled knowledge of the background (Figures 17A,F,K), the sequential U-net models avoid extracting the background features (Figures 17B–D,G–I,L–N). With the previous distilled knowledge, the model in stage 3 could locate the salt structure boundary (Figures 17B,G,L). After receiving the boundary and background information, models in stages 4 and 5 identify the salt with high accuracy (Figures 17C,D,H,I,M,N). The feature maps suggest the process of the target flip and multiple distillations successfully guide the U-net models to extract salt structures from the imbalanced dataset. During the knowledge transporting process, the key is the distillation between the stages 2 and 3. As mentioned in Section 3.4, Eq. (14), the weights of activated regions extracted by the distillated U-nets on the target flipped datasets are divided by one. At the same time, the weights of the target regions, the salt structure, reach relatively high via division because the regions of the salt structure are inactivated (weights are relatively low). The reciprocal in the distillation between the stages 2 and 3 guides and steers the lateral U-net in feature mapping. In addition, the three horizontal figures in Figure 17 also display the variation of activated regions among the multiple distillations. Firstly, the stages 1 and 2 activate the boundary and some inner regions of the background (Figures 17A,F,K). In the stage 3, the distillated knowledge of the background become the prompt for the salt structure identification and the U-net model pays attention to the boundary of the salt structure (Figures 17B,G,L). Similarly, the multiple distillation in the stage 4 receives the prompt from distillated knowledge from the stage 3 so that the U-net model in the stage 4 activates the inner regions of the salt structure (Figures 17C,G,M). Lastly, the U-net model in the stage 5 detects the feature of the salt structure on the basis of the stage 4 and pays more attention on details of the salt structure (Figures 17D,H,N).
6.3 Self-distillations accelerate model convergence
The self-distillation mechanism reduces the influence of gradient disappearance and overfitting (Zhang et al., 2019). To investigate the influence of the self-distillation, the self-distillation blocks are dropped in the model. Results show that without the self-distillation, the losses increase during the different stages and the loss increases to 0.18 in stage 5, which is three times of the loss with the self-distillation blocks (Figure 18A). Meanwhile, the average gradient of each layer shows that the self-distillation mechanism benefits the training by increasing the gradient (Figure 18B). Higher gradients reduce the overfitting and accelerates the fitting process.
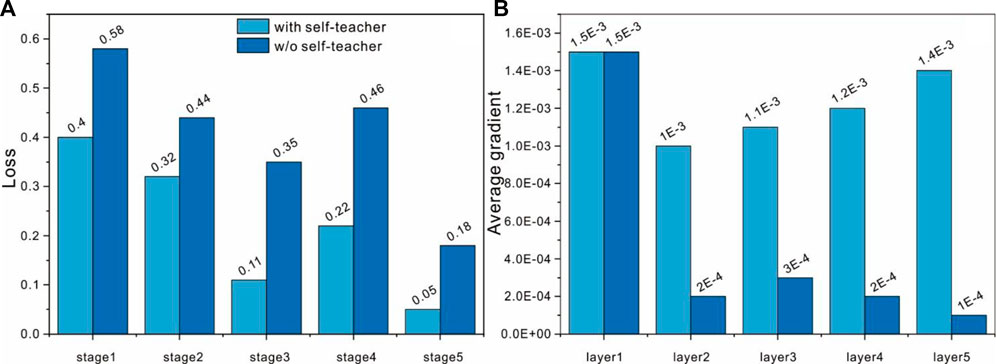
FIGURE 18. The variations of the average gradient among stages (A) collected dataset; (B) TGS dataset.
6.4 Limitations and future directions
The multiple and self distillation model shows substantial precision in the identification of salt structures. The most significant advance with the new work flow is to switch the target of the seismic images from the salt structure to the background, which solves the gradient disappearance issue and avoids the U-net model getting trapped in the strong reflection features. However, two pivotal aspects require improvements.
First, the time cost for training the model is high. The multiple and self distillations model uses the image flip to complete the data augmentation, distillation to pass along the extracted features to aid the training of the model in the next stage, and self-distillation to increase the gradient of the layers in the models. For one U-net model, the training time cost is 1 h and 45 min at each stage. With five stages, the time cost would be 8 h and 45 min. Compared with end-to-end models, the structure of the inverse multiple self-distillation model is complex. One possible solution for reducing the complexity of the model and using the background features is multi-task learning. With a reasonable joint loss function, one framework would identify the background and the salt structure simultaneously. We have tried to use a summation of the two tasks (identifying the background and identifying the salt) with different scale factors but the IoU for detecting the salt is far from the IoU of the inverse multiple self-distillation model. To realize the construction of an end-to-end model that uses the information of the background in seismic images to train the models, it will be necessary to build a new loss function.
Furthermore, the time cost is also too high for the deduction in the ultraresolution seismic images. In practice, the models are required to react instantly when deployed on the equipment. However, the inverse multiple self-distillation model would take several minutes to identify salt on images with thousands of pixels. Two methods may solve the problem and accelerate the inference process. One way is to use the end-to-end framework to train models. Another is to improve the quality of the dataset by expanding the scale of the sampling images.
Second, the multiple and self distillations model mislabels some complex seismic images. A salt structure would develop with faults. When there are more than two or three faults, the reflection pattern disrupts the model classification and the model would mislabel a fault as salt. To solve this problem, more seismic images which contain both salt and faults should be collected in the dataset.
In the future, we will combine the multitask learning framework with self/knowledge distillation to improve the salt identification performance of the models. In addition, we would continue to add images to the dataset and clean the dataset so that models can extract salt features at additional scales. Meanwhile, considering the challenge of collecting seismic images that contain both salt and multiple faults, simulations of salt and faults would be added to the dataset.
7 Conclusion
This study has successfully developed a workflow with several U-net models, a flipping method, and multiple distillation and self distillation blocks. The results show the promising potential of machine-learning applications to actual salt identification via a test of the TGS salt identification challenge and an actual case of evaporite detection in the Jurassic Hith Formation in the southern U.A.E. and western Oman.
Furthermore, by flipping the segmented target, the model overcomes the overfitting and mode collision in the training of the imbalanced dataset. The self/multiple distillation enables the model to find the rare salt zones from the sequences of the salt and the background boundary, the inner weak reflection zones, and the edge weak reflection zones. The multiple-stage training strategy is fit for the imbalanced seismic images and could also be fit for actual exploitation.
In addition, the current limitations of this workflow are the misidentification of the salt images with complex fault systems and the prediction time. In the future, we will introduce more complex fault images in the dataset and use the multitask learning framework to build an end-to-end model to improve prediction efficiency.
Data availability statement
The original contributions presented in the study are included in the article/Supplementary Material, further inquiries can be directed to the corresponding author.
Author contributions
KL: Conceptualization, methodology, writing—original draft, data curation, writing—review and editing. JS: Conceptualization, writing—review and editing. SX: Conceptualization, data curation, writing—review and editing. BL: Geophysics procession, conceptualization, writing—review and editing. JW: Data curation, writing—review and editing. YZ: Geophysics procession, writing—review and editing. SR: Data curation, writing—review and editing.
Funding
The study was supported by funding from the National Natural Science Foundation of China (41872150).
Acknowledgments
Thanks the great help from the officer of Featurize (https://featurize.cn/) in remote virtual machines building. Thank the two reviewers for their valuable comments.
Conflict of interest
YZ was employed by Sichuan Geophysical Company of CNPC Chuanqing Drilling Engineering Company Limited.
The remaining authors declare that the research was conducted in the absence of any commercial or financial relationships that could be construed as a potential conflict of interest.
Publisher’s note
All claims expressed in this article are solely those of the authors and do not necessarily represent those of their affiliated organizations, or those of the publisher, the editors and the reviewers. Any product that may be evaluated in this article, or claim that may be made by its manufacturer, is not guaranteed or endorsed by the publisher.
Supplementary material
The Supplementary Material for this article can be found online at: https://www.frontiersin.org/articles/10.3389/feart.2022.1071637/full#supplementary-material
References
Al-Husseini, M. I. (1997). Jurassic sequence stratigraphy of the western and southern arabian Gulf. GeoArabia 2, 361–382. doi:10.2113/geoarabia0204361
Ali, M. Y., and Farid, A. (2016). Cretaceous – neogene structural evolution of Se abu dhabi, united Arab Emirates. J. Petroleum Geol. 39, 221–245. doi:10.1111/jpg.12644
Anissimov, L., and Moscowsky, G. (1998). Predicting hydrocarbon accumulations below deep Permian salt in the Pricaspian Basin; the use of shallow geochemical indicators. Pet. Geosci. 4, 1–6. doi:10.1144/petgeo.4.1.1
Asgharzadeh, M. F., Hashemi, H., and von Frese, R. R. (2018). Comprehensive gravitational modeling of the vertical cylindrical prism by Gauss–Legendre quadrature integration. Geophys. J. Int. 212, 591–611. doi:10.1093/gji/ggx413
Brun, J.-P., and Fort, X. (2011). Salt tectonics at passive margins: Geology versus models. Mar. Petroleum Geol. 28, 1123–1145. doi:10.1016/j.marpetgeo.2011.03.004
Brun, J.-P., and Fort, X. (2012). Salt tectonics at passive margins: Geology versus models – Reply. Mar. Petroleum Geol. 37, 195–208. doi:10.1016/j.marpetgeo.2012.04.008
Chawla, N. V., Bowyer, K. W., Hall, L. O., and Kegelmeyer, W. P. (2002). SMOTE: Synthetic minority over-sampling technique. J. Artif. Intell. Res. 16, 321–357. doi:10.1613/jair.953
Chen, G., Choi, W., Yu, X., Han, T., and Chandraker, M. (2017). “Learning efficient object detection models with knowledge distillation,” in Advances in neural information processing systems. Editors I. Guyon, U. V. Luxburg, S. Bengio, H. Wallach, R. Fergus, S. Vishwanathanet al. (Curran Associates, Inc).
Cinar, Y., Pusch, G., and Reitenbach, V. (2006). Petrophysical and capillary properties of compacted salt. Transp. Porous Media 64, 199–228. doi:10.1007/s11242-005-2848-1
Davison, I. (2009). Faulting and fluid flow through salt. J. Geol. Soc. Lond. 166, 205–216. doi:10.1144/0016-76492008-064
De Las Cuevas, C. (1997). Pore structure characterization in rock salt. Eng. Geol. 47, 17–30. doi:10.1016/S0013-7952(96)00116-0
Demaison, G., and Huizinga, B. J. (1991). Genetic classification of petroleum Systems1. Am. Assoc. Pet. Geol. Bull. 75, 1626–1643. doi:10.1306/0C9B29BB-1710-11D7-8645000102C1865D
Di, H., Gao, D., and AlRegib, G. (2019a). Developing a seismic texture analysis neural network for machine-aided seismic pattern recognition and classification. Geophys. J. Int. 218, 1262–1275. doi:10.1093/gji/ggz226
Di, H., Shafiq, M. A., Wang, Z., and AlRegib, G. (2019b). Improving seismic fault detection by super-attribute-based classification. Interpretation 7, SE251–SE267. doi:10.1190/INT-2018-0188.1
Di, H., Wang, Z., and AlRegib, G. (2018). “Deep Convolutional Neural Networks for Seismic Salt-Body Delineation,” in *Adapted from extended abstract based on oral presentation given at AAPG 2018 Annual Convention and Exhibition, Salt Lake City, Utah, United States, May 20–23, 2018.
Elfassi, Y., Gvirtzman, Z., Katz, O., and Aharonov, E. (2019). Chronology of post-Messinian faulting along the Levant continental margin and its implications for salt tectonics. Mar. Petroleum Geol. 109, 574–588. doi:10.1016/j.marpetgeo.2019.05.032
Gramstad, O., and Nickel, M. (2018). “Automated interpretation of top and base salt using deep-convolutional networks,” in SEG technical program expanded abstracts 2018, SEG technical program expanded abstracts (204B, Anaheim Convention Center: Society of Exploration Geophysicists), 1956–1960. doi:10.1190/segam2018-2996306.1
Haq, B. U., and Al-Qahtani, A. M. (2005). Phanerozoic cycles of sea-level change on the Arabian Platform. GeoArabia 10, 127–160. doi:10.2113/geoarabia1002127
He, T., Wu, B., and Zhu, X. (2022). Seismic data consecutively missing trace interpolation based on multistage neural network training process. IEEE Geosci. Remote Sens. Lett. 19, 1–5. doi:10.1109/LGRS.2021.3089585
Hinton, G. E., Vinyals, O., and Dean, J. (2015). Distilling the knowledge in a neural network. ArXiv. Available at: https://arxiv.org/abs/1503.02531 .
Hosseini-Fard, E., Roshandel-Kahoo, A., Soleimani-Monfared, M., Khayer, K., and Ahmadi-Fard, A. R. (2022). Automatic seismic image segmentation by introducing a novel strategy in histogram of oriented gradients. J. Petroleum Sci. Eng. 209, 109971. doi:10.1016/j.petrol.2021.109971
Hu, L., Zheng, X., Duan, Y., Yan, X., Hu, Y., and Zhang, X. (2019). First-arrival picking with a U-net convolutional network. Geophysics 84, U45–U57. doi:10.1190/geo2018-0688.1
Hudec, M. R., and Jackson, M. P. A. (2006). Advance of allochthonous salt sheets in passive margins and orogens. Am. Assoc. Pet. Geol. Bull. 90, 1535–1564. doi:10.1306/05080605143
Hudec, M. R., and Jackson, M. P. A. (2007). Terra infirma: Understanding salt tectonics. Earth-Science Rev. 82, 1–28. doi:10.1016/j.earscirev.2007.01.001
Jackson, M. P. A. (1995). “Retrospective salt tectonics,” in Salt tectonics: A global perspective. Editors M. P. A. Jackson, D. G. Roberts, and S. Snelson (American Association of Petroleum Geologists) 65, 0. doi:10.1306/M65604C1
Jackson, M. P. A., and Talbot, C. J. (1986). External shapes, strain rates, and dynamics of salt structures. GSA Bull. 97. 3052–3323. doi:10.1130/0016-7606(1986)97<305
Jackson, M. P. A., Vendeville, B. C., and Schultz-Ela, D. D. (1994). Structural dynamics of salt systems. Annu. Rev. Earth Planet. Sci. 22, 93–117. doi:10.1146/annurev.ea.22.050194.000521
Jia, L., Sen, S., and Mallick, S. (2022). Improvement of generalization capability of 2D salt segmentation via iterative semisupervised learning. Interpretation 10, T213–T222. doi:10.1190/INT-2021-0089.1
Jones, I. F., and Davison, I. (2014). Seismic imaging in and around salt bodies. Interpretation 2, SL1–SL20. SL1–SL20. doi:10.1190/INT-2014-0033.1
Karchevskiy, M., Ashrapov, I., and Kozinkin, L. (2018). Automatic salt deposits segmentation: A deep learning approach. ArXiv. Available at: https://arxiv.org/abs/1812.01429.
Lehner, P. (1969). Salt tectonics and pleistocene stratigraphy on continental slope of northern Gulf of Mexico. Am. Assoc. Pet. Geol. Bull. 53, 2431–2479. doi:10.1306/5D25C967-16C1-11D7-8645000102C1865D
Lin, Y., Wang, C., Chang, C.-Y., and Sun, H. (2021). An efficient framework for counting pedestrians crossing a line using low-cost devices: The benefits of distilling the knowledge in a neural network. Multimed. Tools Appl. 80, 4037–4051. doi:10.1007/s11042-020-09276-9
Liu, W., Muhammad, N., Chen, J., Spiers, C. J., Peach, C. J., Deyi, J., et al. (2016). Investigation on the permeability characteristics of bedded salt rocks and the tightness of natural gas caverns in such formations. J. Nat. Gas Sci. Eng. 35, 468–482. doi:10.1016/j.jngse.2016.07.072
Loncke, L., Gaullier, V., Mascle, J., Vendeville, B., and Camera, L. (2006). The Nile deep-sea fan: An example of interacting sedimentation, salt tectonics, and inherited subsalt paleotopographic features. Mar. Petroleum Geol. 23, 297–315. doi:10.1016/j.marpetgeo.2006.01.001
Martin, A. Z. (2001). Late permian to holocene paleofacies evolution of the arabian plate and its hydrocarbon occurrences. GeoArabia 6, 445–504. doi:10.2113/geoarabia0603445
Maunde, A., and Alves, T. M. (2022). Effect of tectonic inversion on supra-salt fault geometry and reactivation histories in the Southern North Sea. Mar. Petroleum Geol. 135, 105401. doi:10.1016/j.marpetgeo.2021.105401
Mello, U. T., Karner, G. D., and Anderson, R. N. (1995). Role of salt in restraining the maturation of subsalt source rocks. Mar. Petroleum Geol. 12, 697–716. doi:10.1016/0264-8172(95)93596-V
Nagihara, S. (2003). Three-dimensional inverse modeling of the refractive heat-flow anomaly associated with salt diapirism. Am. Assoc. Pet. Geol. Bull. 87, 1207–1222. doi:10.1306/02100301109
Petersen, K. L., and Lerche, I. (1996). Temperature dependence of thermal anomalies near evolving salt structures: Importance for reducing exploration risk. Geol. Soc. Lond. Spec. Publ. 100, 275–290. doi:10.1144/gsl.sp.1996.100.01.18
Pilcher, R. S., Kilsdonk, B., and Trude, J. (2011). Primary basins and their boundaries in the deep-water northern Gulf of Mexico: Origin, trap types, and petroleum system implications. Am. Assoc. Pet. Geol. Bull. 95, 219–240. doi:10.1306/06301010004
Richardson, N. J., Underhill, J. R., and Lewis, G. (2005). The role of evaporite mobility in modifying subsidence patterns during normal fault growth and linkage, Halten Terrace, Mid-Norway. Basin Res. 17, 203–223. doi:10.1111/j.1365-2117.2005.00250.x
Ronneberger, O., Fischer, P., and Brox, T. (2015). “U-Net: Convolutional networks for biomedical image segmentation,” in Medical image computing and computer-assisted intervention – miccai 2015. Editors N. Navab, J. Hornegger, W. M. Wells, and A. F. Frangi (Cham: Springer International Publishing), 234
Rowan, M. G., Peel, F. J., Vendeville, B. C., and Gaullier, V. (2012). Salt tectonics at passive margins: Geology versus models – Discussion. Mar. Petroleum Geol. 37, 184–194. doi:10.1016/j.marpetgeo.2012.04.007
Schreiber, B. C., Lugli, S., and Bąbel, M. (2007). Evaporites through space and time. Geological Society of London. doi:10.1144/SP285
Sen, S., Kainkaryam, S., Ong, C., and Sharma, A. (2019). Regularization strategies for deep-learning-based salt model building. Interpretation 7, T911–T922. doi:10.1190/INT-2018-0229.1
Sen, S., Kainkaryam, S., Ong, C., and Sharma, A. (2020). SaltNet: A production-scale deep learning pipeline for automated salt model building. Lead. Edge 39, 195–203. doi:10.1190/tle39030195.1
Seni, S. J., and Jackson, M. P. A. (1983). Evolution of salt structures, east Texas diapir province, Part 2: Patterns and rates of halokinesis. Am. Assoc. Pet. Geol. Bull. 67, 1245–1274. doi:10.1306/03B5B736-16D1-11D7-8645000102C1865D
Shahbazi, A., Monfared, M. S., Thiruchelvam, V., Ka Fei, T., and Babasafari, A. A. (2020). Integration of knowledge-based seismic inversion and sedimentological investigations for heterogeneous reservoir. J. Asian Earth Sci. 202, 104541. doi:10.1016/j.jseaes.2020.104541
Smith, L. N. (2018). A disciplined approach to neural network hyper-parameters: Part 1 - learning rate, batch size, momentum, and weight decay. ArXiv, 09820. Available at: https://arxiv.org/abs/1803.09820.
Soleimani, M., Aghajani, H., and Heydari-Nejad, S. (2018). Salt dome boundary detection in seismic image via resolution enhancement by the improved NFG method. Acta Geod. geophys. 53, 463–478. doi:10.1007/s40328-018-0222-3
Soto, J. I., Déverchère, J., Hudec, M. R., Medaouri, M., Badji, R., Gaullier, V., et al. (2022). Crustal structures and salt tectonics on the margins of the Western Algerian Basin (Mediterranean Region). Mar. Petroleum Geol. 144, 105820. doi:10.1016/j.marpetgeo.2022.105820
Talbot, C. J., and Jackson, M. P. A. (1987). Internal kinematics of salt diapirs. Am. Assoc. Pet. Geol. Bull. 71, 1068–1093. doi:10.1306/703C7DF9-1707-11D7-8645000102C1865D
Talbot, C. J., and Pohjola, V. (2009). Subaerial salt extrusions in Iran as analogues of ice sheets, streams and glaciers. Earth-Science Rev. 97, 155–183. doi:10.1016/j.earscirev.2009.09.004
Wager, S., Wang, S., and Liang, P. S. (2013). “Dropout training as adaptive regularization: NIPS'13,” in Proceedings of the 26th International Conference on Neural Information Processing Systems 1, 351–359.
Wang, D., Li, Y., Wang, L., and Gong, B. (2020). “Neural networks are more productive teachers than human raters: Active mixup for data-efficient knowledge distillation from a blackbox model,” in 2020 IEEE/CVF conference on computer vision and pattern recognition (CVPR). Presented at the 2020 IEEE/CVF conference on computer vision and pattern recognition (CVPR), 1495–1504. doi:10.1109/CVPR42600.2020.00157
J. K. Warren (Editor) (2006). “Oil and gas associations,” Evaporites: Sediments, resources and hydrocarbons (Berlin, Heidelberg: Springer Berlin Heidelberg), 705–789. doi:10.1007/3-540-32344-9_10
Watkins, J. S., Worzel, J. L., Houston, M. H., Ewing, M., and Sinton, J. B. (1975). Deep seismic reflection results from the Gulf of Mexico: Part I. Science 187, 834–836. doi:10.1126/science.187.4179.834
Xu, L., Choy, C. -S., and Li, Y. -W. (2016). “Deep sparse rectifier neural networks for speech denoising,” in 2016 IEEE International Workshop on Acoustic Signal Enhancement (IWAENC), 1–5. doi:10.1109/IWAENC.2016.7602891
Xu, Y., Qiu, X., Zhou, L., and Huang, X. (2020). Improving BERT fine-tuning via self-ensemble and self-distillation. ArXiv. Available at: https://arxiv.org/abs/2002.10345.
Zhang, J., Song, A., Gao, J., and Bao, K. Ma (2019). “Be your own teacher: Improve the performance of convolutional neural networks via self distillation,” in 2019 IEEE/CVF International Conference on Computer Vision (ICCV). Presented at the 2019 IEEE/CVF International Conference on Computer Vision (ICCV), 3712–3721. doi:10.1109/ICCV.2019.00381
Keywords: salt structure, U-net, target flip, multiple distillation, self-distillation
Citation: Li K, Song J, Xia S, Luo B, Wang J, Zhong Y and Ren S (2023) Salt structure identification based on U-net model with target flip, multiple distillation and self-distillation methods. Front. Earth Sci. 10:1071637. doi: 10.3389/feart.2022.1071637
Received: 16 October 2022; Accepted: 28 November 2022;
Published: 04 January 2023.
Edited by:
Michael Zhdanov, The University of Utah, United StatesReviewed by:
Jiajia Zhangjia, China University of Petroleum, ChinaXiaoyue Cao, Yangtze University, China
Copyright © 2023 Li, Song, Xia, Luo, Wang, Zhong and Ren. This is an open-access article distributed under the terms of the Creative Commons Attribution License (CC BY). The use, distribution or reproduction in other forums is permitted, provided the original author(s) and the copyright owner(s) are credited and that the original publication in this journal is cited, in accordance with accepted academic practice. No use, distribution or reproduction is permitted which does not comply with these terms.
*Correspondence: Jinmin Song, c29uZ2ppbm1pbkBzb2h1LmNvbQ==