 Isamara de Mendonça Silva1,2*
 Deusdedit Monteiro Medeiros2,3*
 Meiry Sayuri Sakamoto4*
 João Bosco Verçosa Leal Jr5*
 David Mendes1,3*
 Tercio Ambrizzi6*
- 1Climate Sciences Post-Graduate Program, Federal University of Rio Grande do Norte, Natal, RN, Brazil
- 2Atmospheric Research Laboratory, Federal University of Rio Grande do Norte, Natal, RN, Brazil
- 3Aerospace Engineering Post-Graduate Program, Federal University of Rio Grande do Norte, Natal, RN, Brazil
- 4Research Institute for Meteorology and Water Resources, Fortaleza, CE, Brazil
- 5Department of Physics, Ceará State University, Fortaleza, CE, Brazil
- 6Institute of Astronomy, Geophysics and Atmospheric Sciences, University of São Paulo, Cidade Universitária, São Paulo, SP, Brazil
A regional investigation of precipitation extremes could help the local authorities to develop strategies against potential climatic disasters, especially in regions of large climate vulnerability. In this context, this study focused on the homogeneity and trend analysis of eleven extreme precipitation indices from a daily rainfall dataset of rain gauges of the state of Ceará, located in the north of Northeast Brazil, from 1974 to 2018 at annual and seasonal time scales. The data were first submitted to gap-filling and quality control processes. Homogeneity, trend, and correlation coefficient were performed subsequently. Homogeneity results showed that most of the precipitation series were classified as “useful.” Significant break years in the series agreed well with moderate and very strong El Niño and La Niña events, suggesting a further investigation of this possible connection. Wet and dry day precipitation indices mainly indicated a decrease in the rainfall regime and an increase in dry days, mainly in the central-eastern, northwestern, and southern regions of the Ceará, especially during the annual time scale and the rainy season. The Locally Weighted Scatterplot Smoothing (LOWESS) curve showed changes in almost all series during the 1980s and 1990s, coinciding with the homogeneity breaks and years of severe droughts that strongly hit the region. Correlation coefficients were strong and significant between rainfall total index and the other precipitation indices.
1 Introduction
The state of Ceará is located in the north of Northeast Brazil (NEB), bordering the Atlantic Ocean to the North. This region has a predominantly semi-arid climate and is considered the most populated dry area in the world (Marengo et al., 2017, 2018). Besides, family farming is prevalent and highly vulnerable to natural disasters in the Ceará (Oliveira, 2019). The climate in the NEB shows large interannual variability related mainly to precipitation, presenting years extremely dry and other extremely rainy (Costa et al., 2020; Silva et al., 2020). The NEB is also characterized by extreme events, where recurrent and severe droughts stand out (Marengo et al., 2018; Oliveira, 2019). Droughts can compromise irrigation, agriculture, and primary uses of water, including hydropower and industry, and hence the wellbeing of residents (Marengo et al., 2018). These issues could substantially impact the environmental and socioeconomic factors of the NEB, where the scarcity of perennial water resources and the growing risk of desertification are a hallmark. According to Marengo and Bernasconi, (2015), combining some processes as rainfall variability, land degradation, and desertification could make NEB one of the world’s regions most vulnerable to climate change. Therefore, understanding the extreme precipitation is important in the context of anticipated global climate change, especially in vulnerable regions like the NEB.
According to the Intergovernmental Panel on Climate Change (IPCC, 2012), the climate-related extreme events will be more intense and recurrent in the following decades, projecting an increased frequency of drought, flooding and heat stress events for the rest of the century, with many adverse effects, which goes beyond the impacts due to changes in the average variables. A decrease in rainfall is also expected in most tropical and subtropical regions, while an increase in precipitation is predicted in the mid-latitudes (IPCC, 2014). Recent studies showed that significant increases in temperature and decreases in precipitation are predicted for NEB for the second half of this century, resulting possibly in more intense and recurrent droughts (Marengo et al., 2017, 2018). The most recent drought that lasted for five straight years, causing several impacts on the regional economy and society of the NEB, was an example of what could happen to the region in the future (Brito et al., 2018). A better comprehension of the recent climate-related extreme events over the NEB and how this might affect the region regarding water resources, food production, income, and livelihoods provide beneficial results to guide the decision-makers. Precipitation times series could supply vital information about climate change and variability, trends, and meteorological patterns. However, non-climatic factors may bias the conclusions of climate and hydrological research, hiding the actual climate patterns and signals (Costa and Soares, 2009) and producing inhomogeneity in the volume, frequency, and intensity of rainy days. Therefore, the homogeneity usually is tested in key variables such as extreme precipitation indices (Wijngaard et al., 2003; Vicente-Serrano et al., 2010; Hänsel et al., 2016). The World Meteorological Organization (WMO, 2011) advises carefully evaluating data for the impacts of the inhomogeneities in the climatological dataset. The reliability of climatological data needs to be tested prior to performing deeper analysis to avoid ambiguous trend results (Hänsel et al., 2016). A few homogeneity analyses were performed on Brazil’s climatological time series, such as a study that assessed the homogeneity of the climatological series for the state of Minas Gerais (Roziane et al., 2012). In another study, the homogeneity of a meteorological station in the Metropolitan Region of São Paulo in terms of the effects of changing instruments and urbanization was analyzed, where the potential break years were identified due to changes in instruments, and then to urbanization (Sugahara et al., 2012). Hänsel et al. (2016) examined the homogeneity and climatic variability of the temperature and precipitation series in the nine capitals of NEB, finding a relation between the inhomogeneities and both extreme events and climate anomalies. Therefore, the analysis of the homogeneity of the climatic series is an essential step before any climate study.
Analysis of precipitation trends is needed and essential for studying the impacts of climate changes and for water resources planning and management (Haigh, 2004). Studies on trends of extreme precipitation on a global and continental-scale have increased considerably (Pal and Al-Tabbaa, 2011; Huerta and Lavado-Casimiro, 2020). Moreover, a global or continental analysis of historical climate data is less than useful for planning at a local scale (Taxak et al., 2014). Regional or local studies on extreme precipitation may be more practical to help authorities develop adaptation strategies to mitigate possible disasters, as suggested by Li et al. (2018). In addition to that, there exist related studies on trend analysis of precipitation in the NEB region. Oliveira et al. (2014) calculate the climatology and trend of both frequency and intensity of heavy, weak, and normal rainfall events, identifying a negative trend regarding the number of episodes and a positive trend in daily rainfall, using quantile technique and Mann-Kendall non-parametric test, respectively. Subsequently, Oliveira et al. (2017) apply a similar approach in the NEB sub-regions, verifying only decreasing trends in the northern semiarid, favoring the occurrence of dry periods in this sub-region. Both studies mentioned above encountered a relationship between extreme rainfall events and La Niña and El Niño occurrences. In particular, recent research has focused on evaluating indices of climate extremes of temperature and precipitation over the NEB at the regional and sub-regional scale, showing a reduction in the total annual precipitation and the frequency of rainy days, and finding an increase in heat waves, using the Mann-Kendall test (Costa et al., 2020). Guerreiro et al. (2013) analyze the monthly rainfall trend for Ceará from 1974 to 2009, finding a trend for the dry months to become drier and for a decrease in rainfall intensity.
This study aims to evaluate the quality of daily precipitation series in Ceará and assess their suitability for examining the changes in the extreme precipitation indices. A daily precipitation dataset with 84 rain gauges from 1974 to 2018 is then subject to fill gaps and the quality control process. Subsequently, the possible influences of interannual climate variability on the identified breakpoints in the homogeneity analysis are discussed. The interannual spatial-temporal changes of eleven extreme precipitation indices are investigated, as well as the correlation between these indexes. All analyzes were performed at the annual and seasonal scales. The paper proceeds as follows: Section 2 describes the materials and methods, Section 3 describes the results and discussion, and Section 4 summarizes the findings.
2 Materials and methods
2.1 Study area and dataset
The state of Ceará is located in the semiarid region of the NEB, and it borders the Atlantic Ocean on the North and has a total area of 148.826 km2. Figure 1 illustrates two maps of the state of Ceará presenting the target station locations. Besides, Figure 1A shows the actual elevation above mean sea level, and Figure 1B exhibits the rain gauge locations and surrounding stations. The high spatial density of stations and the variation of this density between the areas are also observed (Figure 1B). The original database used in this work was provided by the Meteorology and Water Resources Foundation of Ceará (Fundação Cearense de Meteorologia e Recursos Hídricos—FUNCEME), available at http://www.funceme.br/produtos/script/chuvas/Download_de_series_historicas/DownloadChuvasPublico.php. The precipitation data have been recorded in the state of Ceará since 1973, following the recommendations of the WMO. The data are collected daily at 1000 UTC (at 0700 Ceará standard time) by volunteers, who have been trained periodically by FUNCEME.
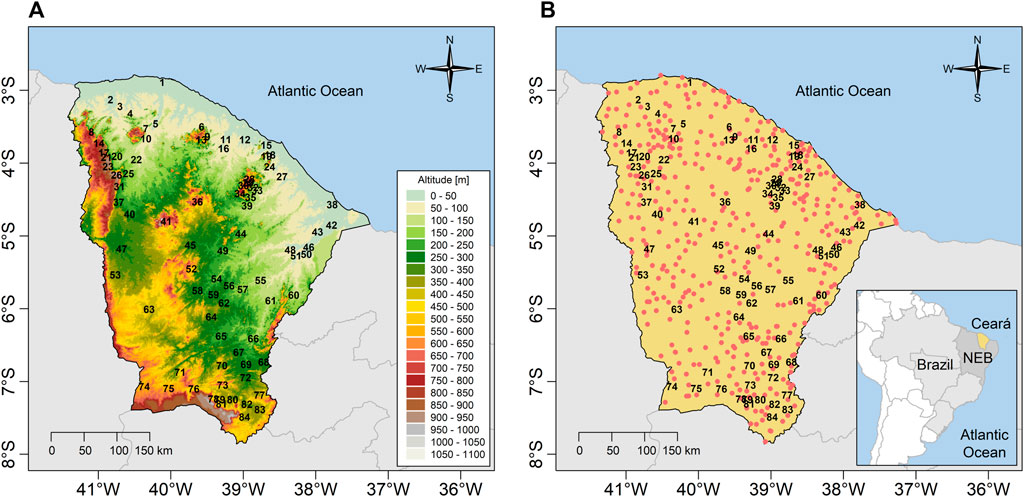
FIGURE 1. (A) Altitude map of the state of Ceará and (B) rain gauge locations and surrounding stations in the study area. The numbers of the target stations are also shown on both maps and the red points are related to the surrounding stations.
A total of 784 rain gauges recorded between the period 1973–2018 were used in this study. The stations with less than 6 years of full data were also refused, so that 523 stations were chosen. Moreover, as only three stations had data from 1973, this year was excluded from the analysis. Stations with data from 1974 to 2018 and stations with less than 5% of missing data were the criteria used to select the target stations in this study. The other rain gauge was defined as surrounding stations, which were used for gap filling and subjected to a quality control process of the target stations. In this context, 84 target stations were selected for the analysis of homogeneity and trend, and 439 rain gauges were chosen as the surrounding stations (Figure 1B). Missing values for the 84 target stations ranged from 0% to 2.05%. On average, approximately 88% of the missing values in these stations were found in the dry season. As this is a period with almost no rain, volunteers probably did not collect the data at times. In addition, the missing values on average are well distributed over the days of the week. The maximum number of consecutive days without data at the target stations ranged from 0 to 197 days, with an average of approximately 39 days.
The cumulative annual rainfall of the Ceará ranged from 540 to 1668 mm during the period of study (Supplementary Figure S1A in the supporting information). We defined the rainy season as January to June for each year due to the high density of cumulated rainfall in these months. Supplementary Figure S1B (in the supporting information) shows that the precipitation in the rainy season ranged from 470 to 1529 mm. On the other hand, we defined the dry season as the 6 months from July through December for each year, based on the low density of accumulated rainfall concentrated in these months. Hänsel et al. (2016) used the same definition for the rainy and dry seasons in the northern sector of NEB. Supplementary Figure S1C (in the supporting information) shows that the precipitation in the dry season ranged from 33 to 300 mm. Additionally, a pooled analysis of altitude (Figure 1A) and cumulative rainfall (Supplementary Figures S1A–C in the supporting information) maps showed that the greatest cumulative precipitations were verified in the central-north region and mountain areas of the state. The large interannual variability is one of the main characteristics of the climate in the NEB and is, therefore, one of the essential features of the rainfall distribution over Ceará. The Intertropical Convergence Zone (ITCZ) is the main atmospheric system that influences the weather and climate in the NEB (Uvo, 1989). It affects mainly the rainfall regime in the north sector of the NEB. Furthermore, the upper-tropospheric cyclonic vortices, tropical squall lines, and sea breezes contribute to the climate variability of the region (Molion and Bernardo, 2002; Ferreira and Mello, 2005; Teixeira, 2008). The climate in the NEB also lies under the influence of the Pacific and Atlantic Oceans (Moura and Shukla, 1981; Aragão, 1986, 1990; Uvo et al., 1998; Kayano and Andreoli, 2006; Teixeira, 2008; Andreoli and Kayano, 2009; Silva et al., 2020).
2.2 Missing data and quality control
The missing values are inevitable in the climate databases and are caused by the temporary absence of observers, equipment failure, infrequent calibration of sensors, among others (Kashani and Dinpashoh, 2012). Therefore, filling in gaps plays an important role in solving this problem in climate studies. The estimation of missing values is the first step of the climatological, hydrological analysis, and environmental studies, according to Kanda et al. (2018). The second step is to perform the quality control process to identify any erroneous and questionable values in the database. Most of these errors are due to exceptionally high or low spurious values, as well as the inclusion of false zeros (Viney and Bates, 2004; Vicente-Serrano et al., 2010; Domonkos, 2015). Therefore, the gap-filling and quality control procedures were carried out in this work before analyzing homogeneity and trends.
The distance threshold between the target stations and their surrounding gauges is called the influence radius. Thus, in the present work, the influence radius of 50 km was chosen based on the density of stations and the average correlation between pairs of observatories, considering that data from surrounding stations were at least 30% complete and coincident with the target station. Other authors used an influence radius of 50 km to complete the dataset (Barrios et al., 2018; Estévez et al., 2018; Bellido-Jiménez et al., 2021). A similar approach was performed by Vicente-Serrano et al. (2010), however, using an influence radius of 15 km. Furthermore, the density of stations in this influence radius ranged from 3 to 23 surrounding gauges per target station. Xia et al. (1999) suggest that a maximum of five closest weather stations results in a better estimate of the missing data. Therefore, following the above considerations, a minimum of 3 and a maximum of 5 surrounding sites per target station was chosen, and the inverse distance weighting, which takes into account the distance between two stations as a weighting factor, was used to estimate the missing data to conduct this research. This approach is considered the most popular method used by climatologists due to its easy applicability (Hubbard, 1994; Xia et al., 1999; Kanda et al., 2018).
Comparing daily values among neighboring observatories is the best approach to detect possible mistakes in precipitation series, as suggested by Vicente-Serrano et al. (2010). Thus, a series of percentiles were created for each reconstructed precipitation series by converting zero values into zero percentiles and replacing the other precipitation values for their corresponding percentiles. The applied methodology was based on the difference between the target station percentile and the average of the percentiles of surrounding stations. In the case of the zero percentile, if the difference between the target station percentile and the average of the percentiles of surrounding stations exceeded the 50th percentile unit threshold, the target station value was then substituted by the value of the nearest surrounding station. In the case of the 99th percentile, if the difference between the target station percentile and the average of the percentiles of surrounding stations exceeded the 70th (60th) percentile in the rain (dry) season, the target station value was then substituted by the value of the nearest surrounding station. In the case of the below 99th percentile, if the difference between the target station percentile and the average of the percentiles of surrounding stations exceeded the 80th (70th) percentile in the rain (dry) season, the target station value was then substituted by the value of the nearest surrounding station.
To verify if the probability distribution of the extreme precipitation values of the target station was affected by the quality control process, the L-coefficients of skewness and kurtosis of the partial duration series (PDS) were used. The PDS are series constituted of extreme values that exceed a pre-determined threshold value. Therefore, the extreme values were separated, and PDS were calculated for each series before and after quality control. The 90th, 95th, and 99th percentile threshold values were chosen for creating the PDS. For more details about the methodology, see Vicente-Serrano et al. (2010).
2.3 Homogeneity and trend analysis
The homogeneity evaluation of the precipitation series was carried out through the Standard Normal Homogeneity Test (SNHT) for a single break (Alexanderson, 1986), the Buishand range test (Buishand, 1982), the Pettitt test (Pettitt, 1979), and the Von Neumann ratio test (Von Neumann, 1941). These statistical tests are traditional in analyzing the homogeneity in monthly and annual series (Hänsel et al., 2016). The four tests must accept the null hypothesis that the annual values of the tested variable are independent and identically distributed, i.e., the time series is homogeneous. The alternative hypothesis considers that there is a break in the time series, indicating a date or just a break, depending on the test used. A change in the series exists when a break occurs, but the break year may differ by a few years. Hänsel et al. (2016) affirmed that the tests do not always identify the break years correctly, suggesting that breaks that vary only by about 1–4 years should be pooled.
The Pettitt, the Buishand range, and the SNHT assume under the alternative hypothesis that a stepwise shift in the mean occurs. Beyond that, these tests are location-specific because they can identify the break year (Wijngaard et al., 2003). The Pettitt and the Buishand tests are more accurate in locating a break year in the middle of the time series (Hawkins, 1977), while the SNHT detects the breaks at the beginning and the end of the series better than other tests (Martínez et al., 2009). Also, the SNHT and the Buishand range test are more sensitive to outliers than the Pettitt test since the former tests assume that the values are normally distributed. In contrast, the latter is founded on the ranks of the elements of the series. Conversely, the Von Neumann ratio test assumes under the alternative hypothesis that the series is not randomly distributed and given no information about the year of the break (Wijngaard et al., 2003). For further details about the homogeneity tests see Hänsel et al. (2016) and Wijngaard et al. (2003).
The application of homogeneity tests in the raw data series does not separate actual climate variability from non-climatic factors at the level of the rain gauge. In general, this problem can be solved by comparing target stations with neighboring reference stations, testing the difference between target stations and reference stations (Peterson and Easterling, 1994; Vicente-Serrano et al., 2010). Besides, a target station and its neighboring stations are expected to respond in the same way to climatic variations. This approach may detect smaller non-climatic issues hidden by the region’s large climatic variability. Therefore, the radius of influence was increased to 86 km relative to the target station. The average of a maximum of five nearest neighboring stations within this radius was used to create the reference series.
The four homogeneity tests were applied in the difference between target stations and reference stations of a set of variables at the annual time scale calculated from daily precipitation data. The same approach was also computed for the rainy and dry seasons, as suggested by Hänsel et al. (2016). Table 1 presented a total of 11 extreme precipitation indices, creating a uniform perspective on observed changes in weather and climate extremes. They are coming from WMO (WMO; Klein Tank et al., 2009) and the European Climate Assessment and Dataset (ECA and D, 2013). The extreme precipitation indices were adapted for the study region following Hänsel et al. (2016). Non-climatic factors could produce inhomogeneity in the volume, frequency, and intensity of rainy days; therefore, the homogeneity needs to be tested (Viney and Bates, 2004; Vicente-Serrano et al., 2010). The wet day counts series quickly detects breaks rather than annual precipitation amounts because the day count variables have lower variability (Wijngaard et al., 2003; Vicente-Serrano et al., 2010). Thus, the key indices used for the homogeneity analysis were RR, RX, DD, and DPX (see Table 1 for definitions). An issue encountered in precipitation data is the under-reporting of small amounts, which may have little influence on RR but may affect DD and other extreme indices. It is unnecessary to apply the homogeneity analysis to all indices described in Table 1 because it is unlikely, for example, that the R50 will provide any additional information to the R20 and R30.
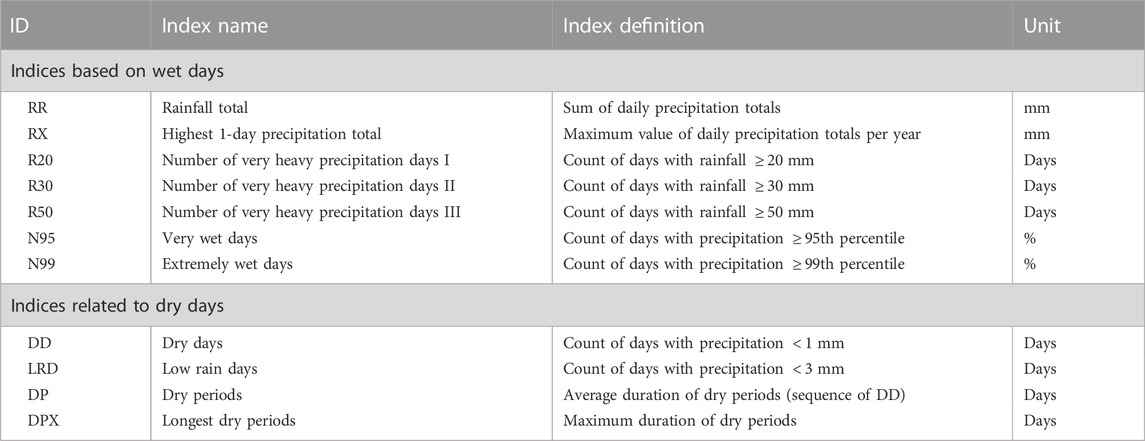
TABLE 1. Description of precipitation indices based on wet and dry days.
The approach adopted by Wijngaard et al. (2003) and Hänsel et al. (2016) was employed for the analysis of the homogeneity of the precipitation series, depending on the number of tests rejecting the null hypothesis of a homogeneous dataset for a significance level of 1%. Therefore, the four tests were condensed into three classes, i.e., “useful” (U), “doubtful” (D), and “suspect” (S), which are:
Class U: none or one test rejects the null hypothesis at the 1% level. It implies no indications of inhomogeneity, and the series seems to be sufficiently homogeneous for climate trend evaluations.
Class D: two tests reject the null hypothesis at the 1% level. It implies indications of inhomogeneity, and the trend analysis should be regarded very carefully and critically.
Class S: three or four tests reject the null hypothesis at the 1% level. It implies that the signal of inhomogeneity is present, exceeding the inter-annual standard deviation of the tested variable series. The trend analysis should not be used.
The homogeneity results and the evaluation of the target station’s series usefulness were combined, taking a similar approach applied by Hänsel et al. (2016). Hence, we used the RR, RX, DD, and DPX indices for annual time scales and rainy and dry seasons, resulting in a total of twelve series per target station. The aim was to integrate homogeneity with trend analysis to understand changes in the climate indices. Therefore, if at least nine of the twelve series were classified as class U, and the other three series were not all classified as S, in the homogeneity analysis, the target station was classified as class “1-useful” (1U). When five indices were classified as class U, the target station was regarded as class “1-doubtful” (1D). Lastly, when less than five variables were classified as class U, the target station was sorted as class “1-suspect” (1S).
The trend analysis of all climate indices was executed using the Mann-Kendall test (Kendall, 1975) and the Sen’s Slope Estimator test (Sen, 1968) for annual time scales and rainy and dry seasons. The null hypothesis of the Mann-Kendal test is that the variables are independent and identically distributed, and the alternative hypothesis is that the variables follow a monotonic trend. In this way, Sen’s Slope Estimator is a non-parametric statistical test used to calculate the magnitude of the slope of a trend (i.e., the linear rate change) and the corresponding intercept for univariate time series. Thus, the trend is assumed to be
3 Results and discussion
In Section 2.2, we describe the missing data filled method. In that case, the dry season presented approximately 88% of the missing data before the target stations were reconstructed. Subsequently, the quality control was performed using the approach based on comparisons of daily data among the surrounding stations. The quality control showed that, on average, 0.92% of data were replaced, ranging from 0.17% to 2.04%. These replacements corresponded, on average, 64.64% of false zeros. These percentages are similar to those reported in other studies (Reek et al., 1992; Feng et al., 2004; Vicente-Serrano et al., 2010). After the target stations were reconstructed, on average, 81.5% of the replaced values were found in the rainy season. These above results suggest a good gap-filling performance. They highlight that the dry season in the Ceará is extremely dry (Supplementary Figure S1). This fact may contribute to the low erroneous or questionable records entered during the gap-filling and quality control processes. Moreover, the replaced values on average are well distributed over the days of the week.
The relationship between the skewness and kurtosis of the precipitation series before and after the quality control process of the target stations is showed in Figure 2. The linear behavior was mainly highlighted for the 90th and 95th percentiles values, showing an optimal coefficient of determination
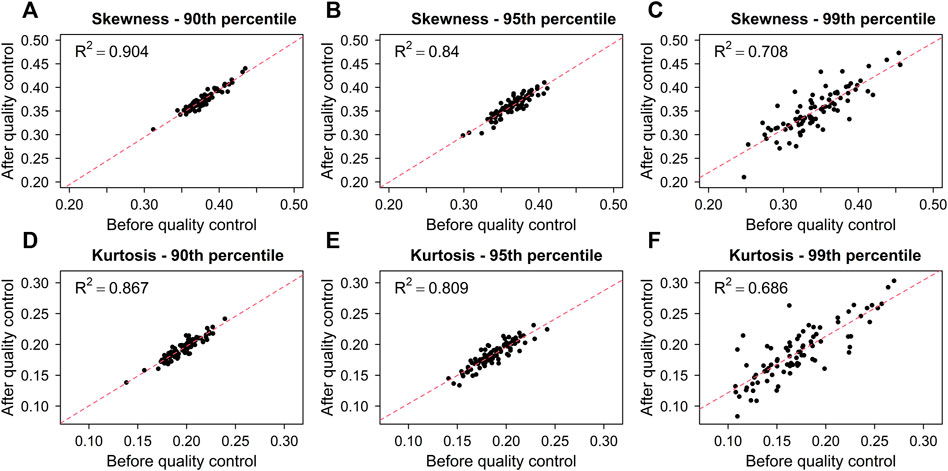
FIGURE 2. Relationship between the L-coefficients of skewness (A-C) and kurtosis (D-E) in the partial duration series at the 90th, 95th and 99th percentiles before and after quality control process from 1974 to 2018. The red dashed line represents the simple linear regression.
3.1 Homogeneity analysis
Homogeneity tests were applied for the 1008 series, so the percentage of testing series that presented at least one significant break was 26.79%. For the RR, RX, DD, and DPX, the percentage of series with significant breaks in the homogeneity computation were 5.06%, 4.17%, 12.9%, and 4.66%, respectively. The result of the DD presented the highest percentage of break referring to the number of dry days, followed by the RR related to the precipitation amounts. The RX and DPX outcome showed the lowest percentages of break relating to the maximum value of daily precipitation totals per year and maximum duration of dry periods, respectively. It seems that the indices associated with the accumulation of dry and wet days are more sensitive to breaks of homogeneity than the relating to the maximum value of wet and dry days.
The percentage of series that presented breaks associated with the Pettitt, Buishand, Von Neumann tests and the SNHT were 6.75%, 6.94%, 14.58%, and 15.58%, respectively. Among the series that presented a significant break, SNHT was responsible for 58.15%, followed by the Von Neumann test at 54.44%, the Buishand test at 25.93%, and the Pettitt test at 25.19%. The annual time detected 37.78% of breaks with significant values concerning the time scale, whereas the rainy season identified 32.96%, and the dry season encountered 29.26%. The homogeneity results are influenced by the variables tested, the homogeneity tests used, and the significant level (Hänsel et al., 2016). The SNHT and Von Neumann seemed to quickly find discontinuities in the series, while the Buishand and Pettitt tests showed similar percentages. The performance of the tests was consistent with the literature, such that the SNHT showed the highest number of breaks at the extremes of the series. In contrast, the Buishand and Pettitt tests identified the highest number of breaks in the middle of the series.
Figure 3 shows the percentage of series with break years related to the SNHT and Pettitt and Buishand tests for the RR, RX, DD, and DPX, and the percentage of the total breaks. Figure 3 also shows the El Niño and La Niña events computed from the Oceanic Niño Index (ONI) (NOAA 2019a, b). The ONI is the running 3-month mean SST anomaly for the Niño 3.4 region (i.e., 5°N-5°S, 120°-170°W). The events are defined as five consecutive overlapping 3-month periods at ≥+0.5 anomaly for El Niño and at ≤−0.5 anomaly for La Niña. The threshold is further broken down into weak (0.5–0.9), moderate (1.0–1.4), strong (1.5–1.9) and very strong (≥2.0) events. The DD and DPX seem to be more sensitive to a break of homogeneity than the RR and RX. The break years that showed a higher percentage have demonstrated good agreement with the La Niña events in 1988–1989 (strong), 1995–1996 (moderate), 1998–2000 (strong), 2007–2008 (strong), and 2008–2009 (weak), as well as with the El Niño years in 1991–1992 (strong), 1997–1998 (very strong), and 2009–2010 (moderate) (Figures 3A,C,E). In general, the years with the highest number of breaks seem to be associated with La Niña and El Niño conditions with moderate to very strong intensities. On the other hand, some break years were very difficult to decide if it was due to climatic factors or if the non-homogeneity of the series is real, for example, the years 1981, 1990, and 1993. A high number of breaks were found at the beginning of the series, mainly during 1974–1980, also in agreement with the La Niña events in 1973–1976 (weak/strong) and El Niño events in 1973–1977 (weak) (Figure 3). These breaks were related only to the SNHT, which is more sensitive to breaks at the extremes of the series. Hence, it is essential to apply different homogeneity tests that are sensitive to different breaks in a series.
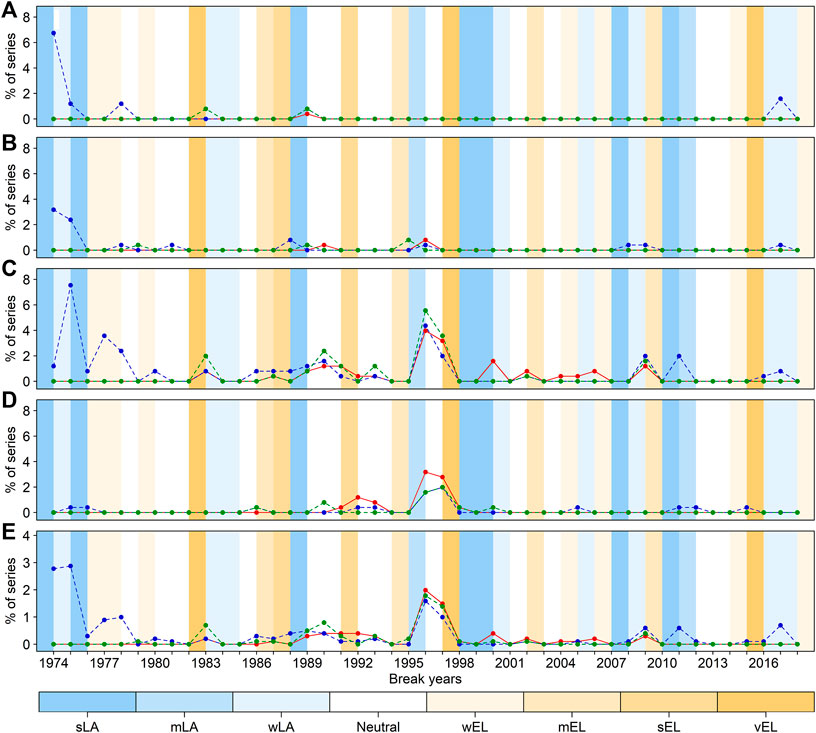
FIGURE 3. Percentage of series with break years related to (A) RR, (B) RX, (C) DD, (D) DPX, and (E) Total for the Pettitt test (red line), Standard normal homogeneity test SNHT (blue line) and Buishand test (green line) from 1974 to 2018. The bluish colors refer to the La Niña (LA) events, and the yellowish ones refer to the El Niño (EL) events, with weak (w), moderate (m), strong (s), and very strong (v) intensities.
The 1990s presented 45.12% of the homogeneity breaks statistically significant at a 5% significance level, followed by the 1970s and 1980s with 26.94% and 13.13%, respectively. Therefore, the tests presented a few percentages of inhomogeneous series, and the breaks detected seem to be related to the La Niña and El Niño events. The connection between the breaks found in the precipitation indices and El Niño events over the NEB was found by Haylock et al. (2006) and Hänsel et al. (2016). This connection could be associated with the large interannual variability of annual rainfall, particularly in the El Niño Southern Oscillation (ENSO)-dominated dry regions of South America (Haylock et al., 2006; Hänsel et al., 2016). However, the number of breaks decreased after the 1990s, even though El Niño and La Niña events, suggesting that these phenomena cannot be entirely responsible for the breaks. Other phenomena may contribute to the breaks, including non-climatic factors. Unfortunately, we cannot further examine the non-climatic breakpoints because the metadata of rain gauges is unavailable. Nevertheless, almost all break years occurred similarly in many target stations. According to Hänsel et al. (2016), the non-climatic alterations are unlikely to co-occur in many target stations.
Until now, no series had been deleted from the database. Supplementary Table S1 (in the supporting information) show the break years identified by the homogeneity tests for the precipitation indices and the classification of the homogeneity (useful (U), doubtful (D), and suspect (S)), calculated from the rain gauges of the state of Ceará, during the annual time scale and rainy and dry seasons. Besides, it presents a qualitative evaluation of the usefulness of precipitation, where the series were classified as 1-useful (1U), 1-doubtful (1D), and 1-suspect (1S). According to the qualitative criterion of the precipitation usefulness, nine target stations were classified as 1D, i.e., observatories 12, 17, 18, 21, 29, 34, 51, 73, and 75 (Supplementary Table S1). From what was discussed earlier, we have decided to remove these nine target stations from the database. It is preferred to discard some doubtful stations but hold the remaining high-quality data for subsequent climatic studies. Therefore, 75 observatories remained for trend analysis of the extreme precipitation indices.
3.2 Trend analysis
Tables 2–4 (in the supporting information) show the Mann-Kendall (
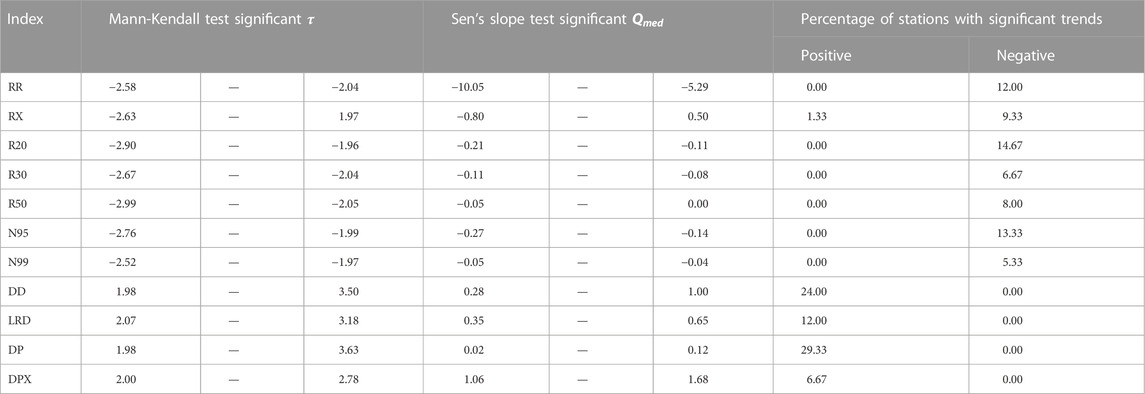
TABLE 2. Mann-Kendall (τ) and Sen’s slope estimator (
Results in the annual time scale presented only positive values in the dry day indices ranging from 0.02 to 1.88, and magnitudes relatively accentuated in the dry days indices. For example, the DD varies from 0.28 to 1 day/year, and LRD ranges from 0.35 to 0.65 days/year (Table 2). The DPX and DP described the maximum and average duration of the dry days, where the former ranged from 1.06 to 1.68 days/year, and the latter varied from 0.02 to 0.12 days/year. Furthermore, the magnitude of the trends associated with the maximum duration of the dry days is far more pronounced than in trends related to the average duration of the dry days. These results may suggest an increase in dry days and perhaps an increase in their duration in the annual period. The DP (29.33%), DD (24%), LRD (12%), and DPX (6.67%) presented the highest percentage of stations with significant trends (in brackets) in the annual time scale, bigger than wet day indices (Table 2).
The pattern of results in the rainy season was very similar to the outcomes in the annual time scale, showing a significant negative trend in the wet day indices and a significant positive trend in the dry day indices for all target stations (Tables 2, 3). The RR slopes ranged from −10.55 to −4.1 mm/year, and the RX slopes varied from −0.83 to −0.4 mm/year in the stations with significant trends (Table 3). These results show evidence of a possible reduction of precipitation during the rainy season of the Ceará, which agrees with the results that we have previously discussed. The following indices and the respective percentage of stations with significant trends (in brackets) were R20 (22.67%), RR (17.33%), N95 (14.67%), R30 (10.67%), RX (9.33%), N99 (6.67%), and R50 (5.33%) (Table 3).
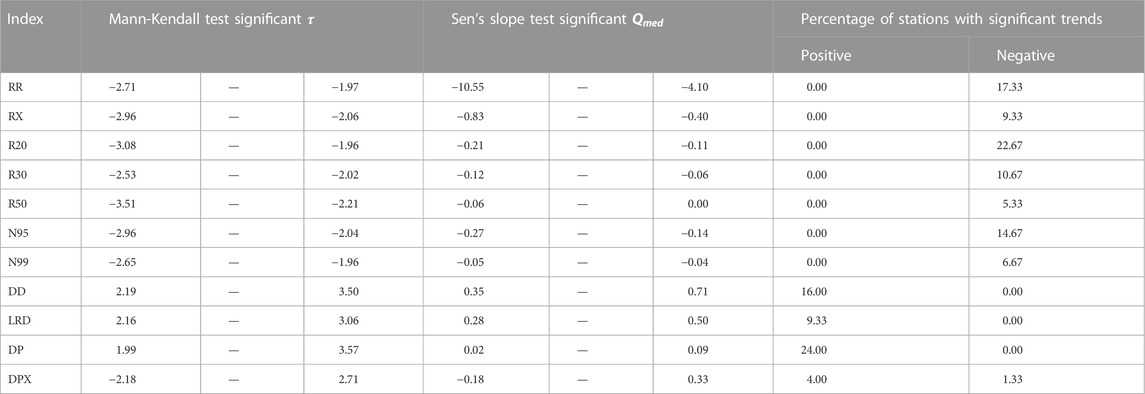
TABLE 3. Mann-Kendall (τ) and Sen’s slope estimator (
The percentage of stations that showed a positive and significant trend for DD in the rainy season was 16%, with slopes ranging from 0.35 to 0.71 days/year (Table 3). The DP had slopes varying between 0.02 and 0.09 days/year and happened in 24% of stations with significant trends. The percentage of stations that exhibited a positive and significant trend for the LRD was 9.33%, with slopes between 0.28 and 0.5 days/year. The DPX showed positive and negative significant trends in 4% and 1.33% of the stations, and slopes between −0.18 and 0.33 days/year, respectively. In general, these finds above were similar to those in the annual period, except for the DPX (Tables 2, 3).
In the dry season, a few targets stations showed decreasing and increasing significant trends in the series of the RR and RX (Table 4). The RR had slopes ranging from −0.93 mm/year to 0.85 mm/year, and the RX presented slopes varying between −0.14 mm/year and 0.54 mm/year, showing values considerably less than those in the annual and rainy time scales (Tables 2, 3). The other wet day indices also had significant trends, but the slope values were equal to zero. This result was expected because the dry season in Ceará is extremely dry. The slopes of the dry day indices varied from −0.15 to 1.85, presenting similarities to the annual and rainy periods (Tables 2, 4). Additionally, the percentages of stations with significant trends were very low for the wet day indices, ranging from 1.33% to 6.67% for negative and positive trends. The DD presented 20% of the series with a significant trend, with 10.67% positive and 9.33% negative. The LRD showed respectively positive and negative significant trends in 8% and 2.67% of the stations. Finally, the DP and DPX showed 5.33% and 12% positive trends, respectively (Table 4).
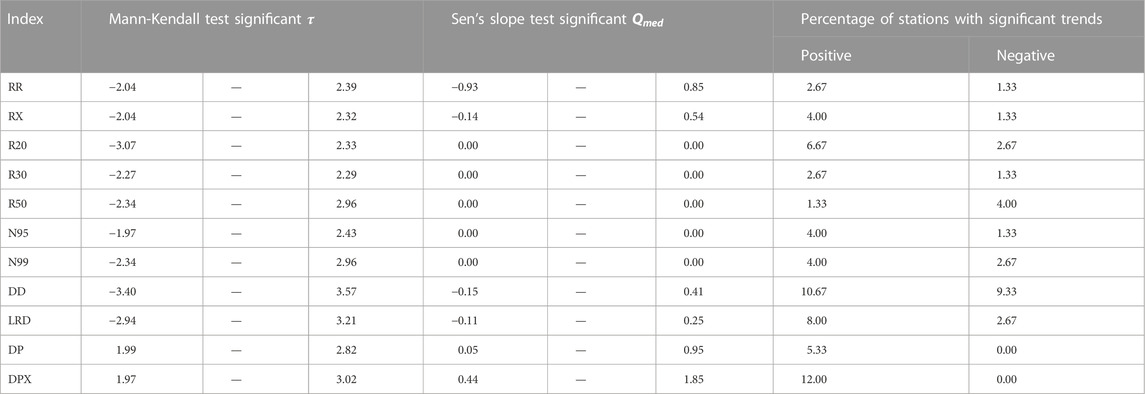
TABLE 4. Mann-Kendall (τ) and Sen’s slope estimator (
Concerning the sum of all series for all indices, the total percentage of the series with a significant trend at the 5% significance level was 11.28%, with 5.58% for negative and 5.7% for positive trends. During the annual period, the percentage of the series with a significant trend was 12.97%, and with positive and negative trends was 6.67% and 6.3%, respectively. During the rainy season, the percentage of the series with a significant trend was 4.85% for a positive trend and 8% for a negative trend, totaling 12.85% of the series. Similarly, the total percentage of the series with a significant trend was 8% during the dry season. The percentage of the series with a positive and a negative was 5.58% and 2.42%, respectively.
Figure 4 shows the Locally Weighted Scatterplot Smoothing (LOWESS) regression curves and the linear regression of the average of precipitation indices for the annual time scales. The LOWESS regression reduces the local fluctuations in the series and identifies patterns over time (Taxak et al., 2014). A pattern change was verified in the LOWESS curve in the middle of the series mainly between the 1980s and 1990s, highlighting the RX, DP and DPX (Figures 4B,J,K). Although the result did not show a statistically significant, a slight decrease trend was observed in the linear regression for the wet day indices and a slight increase trend for the dry day indices. Figure 5 presents LOWESS regression curves and the linear regression of the average of precipitation indices for the rainy season. It can be seen that the rainy season has followed similar patterns of changes and trends to the annual period (Figure 4), except for the DPX (Figure 5K). This result may indicate a possible reduction of rainfall and an increase in drought in the Ceará during the annual and rainy periods. Furthermore, this outcome agrees with the founding in Tables 2, 3.
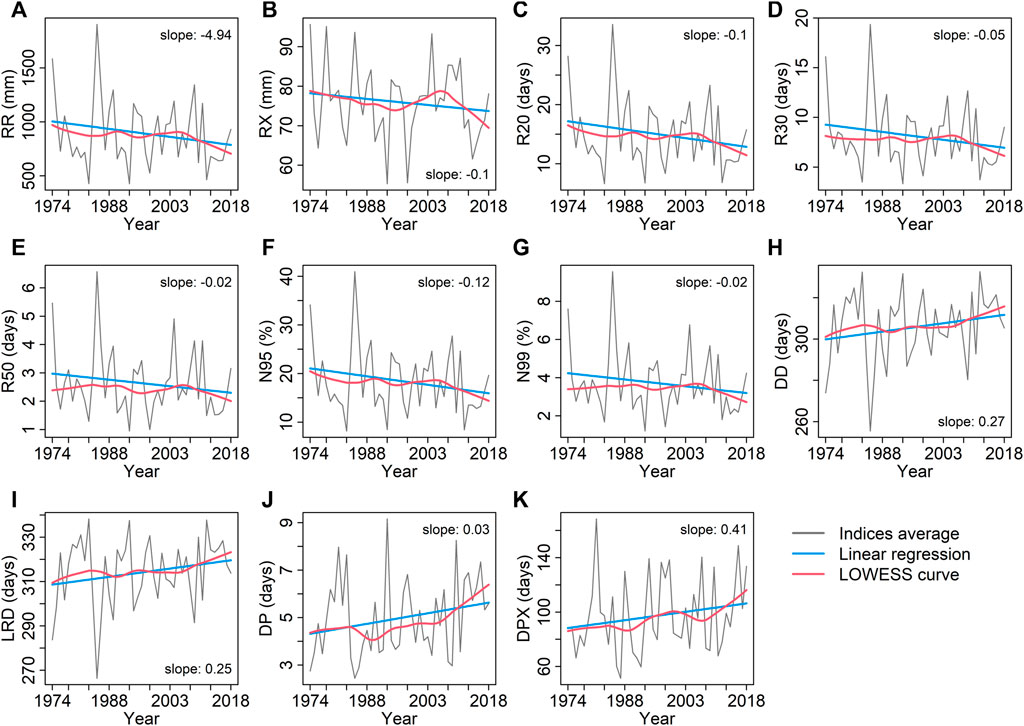
FIGURE 4. LOWESS curve (red line) and linear regression (blue line) related to (A) RR, (B) RX, (C) R20, (D) R30, (E) R50, (F) N95, (G) N99, (H) DD, (I) LRD, (J) DP and (K) DPX of target stations during the annual period from 1974 to 2018. The number refers to a slope of linear regression. The * symbol indicates the slope was significant at the 5% level.
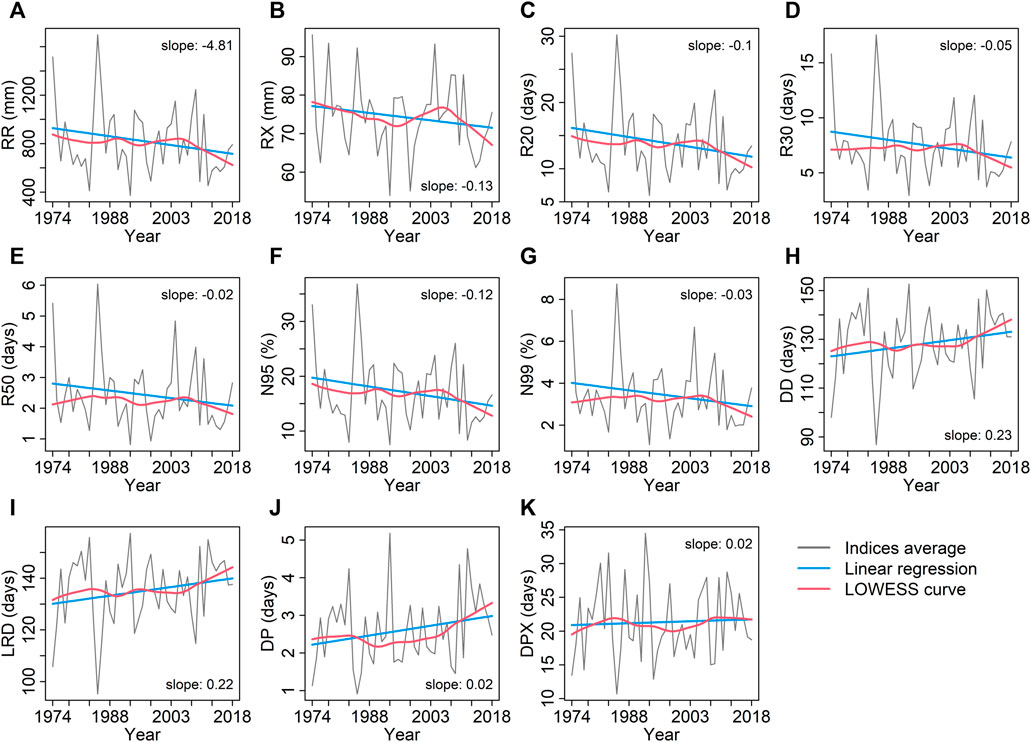
FIGURE 5. LOWESS curve (red line) and linear regression (blue line) related to (A) RR, (B) RX, (C) R20, (D) R30, (E) R50, (F) N95, (G) N99, (H) DD, (I) LRD, (J) DP and (K) DPX of target stations during the rainy season from 1974 to 2018. The number refers to a slope of linear regression. The * symbol indicates the slope was significant at the 5% level.
Figure 6 show the LOWESS regression curves and the linear regression of the average of precipitation indices for the dry season. A pattern change was verified in the LOWESS curve in the middle of the series, mainly between the 1980s and 1990s. The wet day indices based on a threshold did not show a trend (Figures 6C–G). Although the result was not statistically significant, a slight decrease trend was observed in the RR and a slight increasing trend in the RX (Figures 6A,B). The DD and LRD did not show a trend (Figures 6H,I), whereas the DP and DPX present a slight increase trend (Figures 6J,K). This result may indicate a possible increase of drouth duration in the Ceará during the dry season.
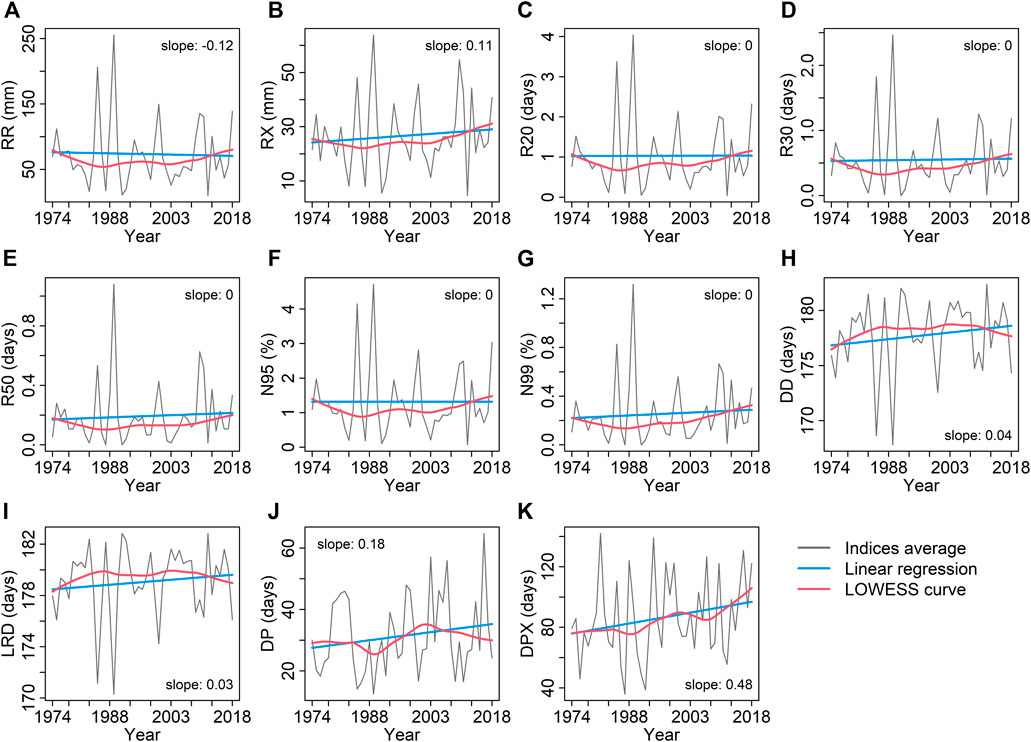
FIGURE 6. LOWESS curve (red line) and linear regression (blue line) related to (A) RR, (B) RX, (C) R20, (D) R30, (E) R50, (F) N95, (G) N99, (H) DD, (I) LRD, (J) DP and (K) DPX of target stations during the dry season from 1974 to 2018. The number refers to a slope of linear regression. The * symbol indicates the slope was significant at the 5% level.
The changes pattern mainly in the 1980s and 1990s (Figures 4–6) coincide with significant break years found in the homogeneity analysis and with La Niña and El Niño events discussed earlier (Figure 3). Besides, the drought years in these decades were severe and caused significant socioeconomic problems in the NEB, especially in the 1990s. According to Marengo and Bernasconi (2015) and Marengo et al. (2017), a drought affected the NEB in 1986–1987, but with less intensity. In 1993, a very severe drought was connected at least partially to the unusual ENSO conditions. In 1997–1998, a drought severely affected crop production in the region and treated the local food supply. A drought began in 2012, reaching its highest intensity in 2012–2013 and continuing to a lesser degree in 2015.
The spatial distribution of the direction and magnitude of the trend by the Mann-Kendall and Sen’s tests for the precipitation indices during the annual and seasonal time scales are shown in Figure 7. Almost all target stations showed a decreasing trend related to the wet day indices during annual and rainy periods. The spatial distribution was similar for the RR, RX, R20, R30, R50, N95, and N99 during the annual time scale and rainy season. (Figures 7A–G). Most of the significant trends showed a decrease in precipitation indices distributed in the northwestern, central-eastern, and southern regions of Ceará. Additionally, higher values of magnitudes were found in the RR related to the annual and rainy periods, suggesting a reduction of the annual cumulative precipitation mainly in the southeast sector of the Ceará. At least one station showed a decreasing trend for the wet day indices in the dry season in the northern, northeastern and central regions. During the dry season, a few cases in the northwestern region saw increasing and significant trends for the RR, RX, R20, R30, and N95. Furthermore, increasing and significant trends were observed for the RX, R20, R30, R50, and N99 in the southern sector.
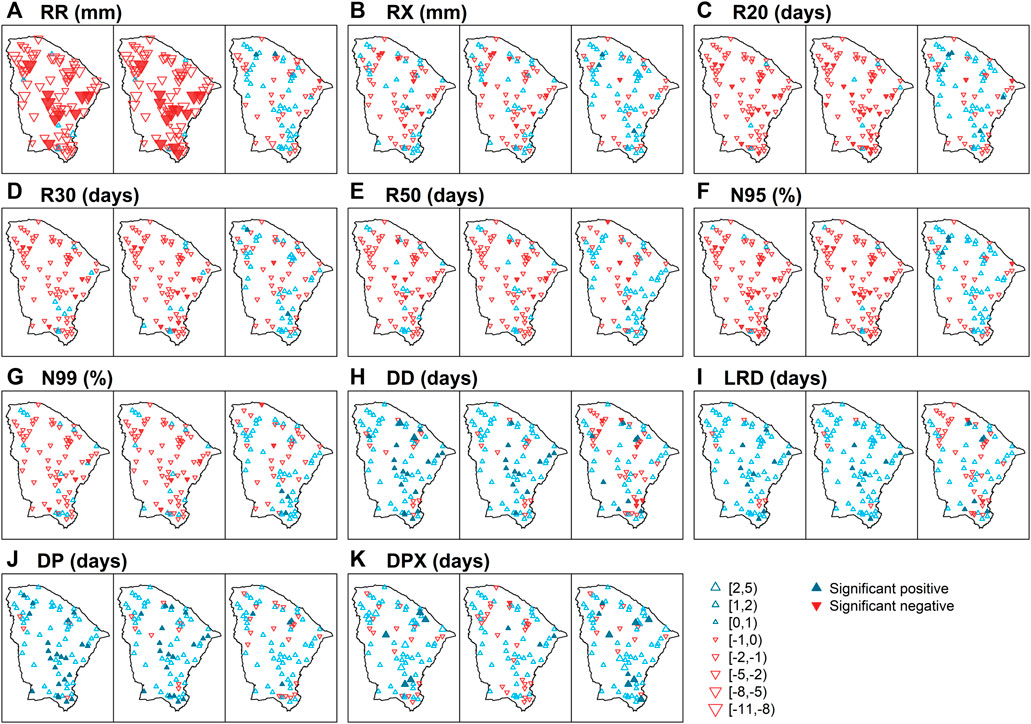
FIGURE 7. Spatial distribution related to (A) RR, (B) RX, (C) R20, (D) R30, (E) R50, (F) N95, (G) N99, (H) DD, (I) LRD, (J) DP and (K) DPX of target stations with the increasing (blue), decreasing (red) of the trends by the Mann-Kendall test and magnitude by the Sen test during the annual period (AN - left), rainy season (RS - center) and dry season (DS - right) from 1974 to 2018. Full triangles correspond to trends with statistical significance at the 5% level.
The dry day indices showed the most increased trends during the annual and rainy periods (Figures 7H–K). Significant increase trends were observed in the central-northern, southern, and central-eastern regions for the DD and DP during the annual time scale and rainy season. Additionally, significant increase (decrease) trends were identified in the DD in the northern, northwestern, central-north, and southern (northern, northwestern, and southeastern) regions during the dry season. The DP presented only significant and increasing trends during the dry season for target stations located in the northern and southern sectors of the state. The LRD exhibited significant and increasing trends in the northern, southern, and central-eastern regions during the annual time scale and in the southern and central-eastern during the rainy season. Furthermore, the LRD showed significant increase (decrease) trends in the northwestern, northern, and southern (northern and southeastern) sectors during the dry season. The DPX presented significant increase trends during the annual period, and rainy and dry seasons, for target stations located in the northern, northwestern, and southeastern regions. For this index, the only exception was a significant decrease trend in the target station number 6 located in the north of the Ceará during the rainy season (Figure 7K). Besides that, the DPX showed the highest trend magnitudes compared to the other dry indices.
A high number of target stations showed significant and decreasing trends regarding the wet day indices in the central-eastern, northwest, and southern regions of Ceará during the annual period and rainy season. Besides that, most of the significant trends showed decrease conditions concerning the wet day indices in the Ceará. The dry day indices showed a high concentration of significant and increasing trends in the stations in the same regions cited above during annual and seasonal time scales. Some studies have suggested a decrease in precipitation and an increase in the number of dry days in the NEB (Marengo and Bernasconi, 2015; Marengo et al., 2017, 2018; Brito et al., 2018). According to Marengo et al. (2017), there is a prospect of an increase in rainfall reductions, frequency and length of dry spells, and droughts in future climates in NEB. Skansi et al. (2013) identified significant and decreasing trends in the dry day indices in NEB, and its results did not present significant trends for the wet day indices. However, none of the weather stations analyzed is located in the Ceará. Furthermore, they assessed the period from 1969 to 2009, which may contribute to these results. Guerreiro et al. (2013) confirm our results, identifying a decreasing trend in precipitation and their intensity in the Ceará and showing that the dry months become dryer. Costa et al. (2020) also agree with our findings, verifying that precipitation variable trends over the NEB showed significant and increasing trends concerning the dry day indices in most weather stations in Ceará. Oliveira et al. (2014) found that La Niña and El Niño occurrences modulated heavy rainfall events. In general, they showed a negative trend for the number of extreme events in the NEB. The results described above could indicate a decline in the rainfall regime in the state of Ceará, mainly in the central-eastern, northwestern, and southern regions, concerning the spatial distribution of target stations with significant trends.
3.3 Correlation analysis
The percentage of target stations with the average of the Pearson correlation coefficients at the 5% significance level between precipitation indices during all periods is shown in Figure 8. The correlation coefficients between the dry day indices and the wet day indices were negative, evidencing the linear inverse relationship between these two weather conditions. The correlation coefficients between just the dry day indices and between just the wet day indices were all positive, during the annual period (Figure 8A). A strong and positive correlation was verified between the RR and the other wet day indices, except the RX. Moreover, the correlation between the RR and the dry day indices was strong and negative, mainly with DD, LRD, and DP. Unlike the other indices, the RX and DPX exhibited a weak correlation with almost all indices (Figure 8A). The DPX presented a positive and moderate significant correlation with DD and DP. In general, the percentage of stations with a significant correlation for the DPX was small (Figure 8A).
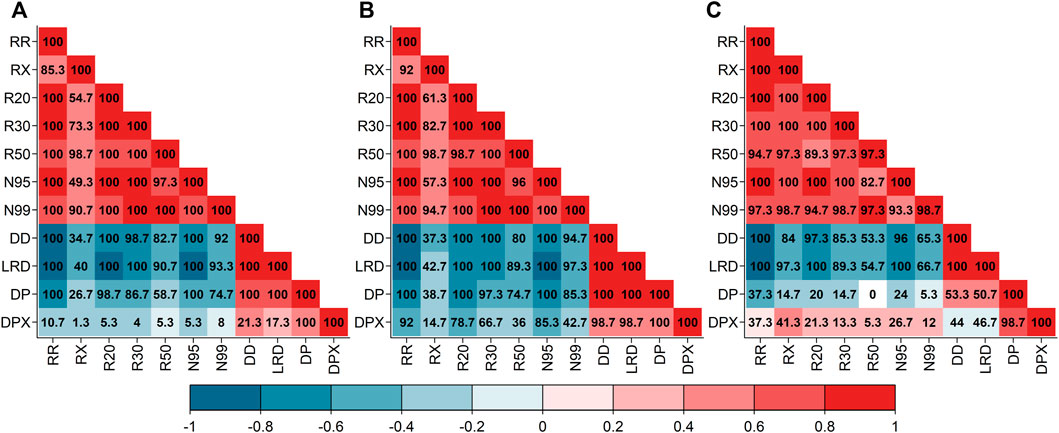
FIGURE 8. Percentage of target stations (inside the squares) with the average of the Pearson correlation coefficients at the 5% significant level between precipitation indices during the (A) annual period, (B) rainy season and (C) dry season from 1974 to 2018.
The percentage of target stations with the average of the Pearson correlation coefficients during the rainy season is presented in Figure 8B. Almost all the RR series showed a strong correlation with precipitation indices in the rainy season, except with the RX. In general, a high percentage of the series was significant during the rainy season and the wet day variables were moderately or strongly correlated with the other indices (Figure 8B). Besides, the correlation coefficients between the dry day indices and between the wet day indices were all positive. In contrast, the correlation coefficients between the dry day indices and the wet day indices were negative. The precipitation indices also seem to cause changes in the RR possibly but do not seem to influence the RX during the rainy season. In turn, the RX exhibited a moderate and negative correlation with the DD and LRD. The DPX presented moderate and negative correlations with RR, R20, and N95 and weak and negative (moderate and positive) correlations with RX, R30, R50, and N99 (DD, LRD, and DP). On the whole, the wet day variables associated with a threshold value were moderately or strongly correlated with the other indices, where a high percentage of the series was significant.
The positive correlation between the wet variables was generally moderate and strong during the dry season (Figure 8C), just as happened during the annual and rainy periods (Figures 8A, B). Besides, the correlation coefficients between the wet day indices and the dry day indices were negative, except between the wet day variables and positive DPX. The correlation coefficients between the dry day indices and the wet day indices were strong and positive. The DPX exhibited a weak and positive correlation with the DD and a weak and negative correlation with the LRD. Finally, the wet day variables were moderately or strongly correlated with the other indices on the whole (Figure 8C).
The strong and significant correlation coefficients between the RR and the other indices reflect the changes in total precipitation over Ceará, observed in the high magnitude and significant decreasing trends in the RR, as shown in Figure 7A and Tables 2–4 (in support information). Hence, the RR could be used to characterize the rainfall regime in the Ceará. Moreover, the RX corresponds to a single day of the year when precipitation is the maximum value, showing low correlation coefficient values between the RX and the other indices. This outcome indicates that the precipitation associated with the RX was either atypical or corresponds to an outlier. The percentages of target stations with significant correlation coefficients for the RX were high, suggesting that the corresponding precipitation events were atypical and therefore did not produce a linear relationship with the other indices. Thus, the RX could describe the atypical heavy rainfall regime in the Ceará. In turn, the DP corresponds to the average of dry period duration of the year. During the rainy season, the DP presented a significant relationship with indices related to moderate precipitation, which could be used to characterize drought regimes within the rainy season in the Ceará.
4 Conclusion
The homogeneity and trend of eleven precipitation indices were investigated in the state of Ceará during the annual and seasonal time scales from 1974 to 2018. The precipitation indices were calculated from a database with 84 rain gauges after gap-filling of missing data and a rigorous process of quality control. The homogeneity evaluation was performed by the standard normal homogeneity test (SNHT) for a single break, the Buishand range test, the Pettitt test, and the Von Neumann ratio test. The series were classified as “useful,” “doubtful,” and “suspect” based on the number of homogeneity tests that reject the null hypothesis for a significance level of 1%. Besides, a qualitative interpretation of the homogenization of precipitation series was also performed. The trend analysis was carried out through the non-parametric Mann-Kendall and Sen’s methods. The Pearson correlation coefficients between the precipitation indices were also examined. Therefore, the main conclusions of this study can be summarized as follows:
• Most precipitation series were statistically classified as “useful.” The break years were quite similar regarding the time scale. We highlight that many of the break years in the precipitation series coincided with the El Niño and La Niña events. Therefore, the analysis of homogeneity combined with the quality control process carried out in this paper could improve the quality and reinforce the credibility of the dataset.
• There are significant trends in all precipitation indices towards annual and seasonal periods in the state of Ceará. The wet day indices and dry day indices showed predominately decreasing and increasing trends, respectively. These findings, especially during the annual and rainy periods, suggest a reduction in rainfall and an increase in dry days. Concerning the spatial distribution of the trend, all regions of the Ceará showed more than one variable with a significant trend, except the central-west sector, possibly because the density of stations is low in this region.
• A changing pattern is observed on the LOWESS curve in almost all series during the 1980s and 1990s, coinciding with the break years of the homogeneity carried out by tests. These outcomes agree well with El Niño and La Niña events and may indicate a decline in the rainfall regime in the state of Ceará. These periods also coincide with years of severe drought that strongly hit the NEB.
• Almost all precipitation indices seemed to induce changes in the RR, as noted in the strong and significant correlation coefficients between this index and other variables, affecting possibly the magnitude values of the decreasing trend of the RR. The correlation coefficients between the RX and DPX and the other indices were almost null. The correlation coefficients between the DP and the other indices were moderate and strong in the annual period and rainy season. Thus, RR can be used to characterize the rainfall regime in the Ceará. The DP can indicate the average drought duration in the annual period and rainy season. The RX can describe a typical heavy rainfall in a single day.
The 45-year time series of a daily dataset from 75 rain gauges of the state of Ceará generated in the study is a source of consistent and quality data that can be the basis for the most diverse studies on the weather and climate in the NEB semi-arid. Future studies from this database can impact several sectors, such as water resources, agriculture, health, and others. The results of this research can mainly contribute to a greater understanding of the seasonal and annual variability in precipitation regimes of the Ceará. As a concluding remark, we suggest further studies to deeply examine the association between the precipitation indices and the climate patterns that influence the weather and climate in this region.
Data availability statement
Publicly available datasets were analyzed in this study. This data can be found here: http://funceme.br/app-calendario/reconstructed-precipitation-ceara.
Author contributions
Material preparation, data collection and analysis were performed by IS. The first draft of the manuscript was written by IS and DM and all authors commented on previous versions of the manuscript. All authors contributed to the study conception and design. All authors read and approved the final manuscript.
Acknowledgments
IS would like to thank the Coordination for the Improvement of Higher Education Personnel (CAPES) for her graduate degree scholarship. The authors would like to extend their deepest gratitude to the School of Science and Technology (ECT), the Pro-Rectory of Postgraduate Studies of the Federal University of Rio Grande do Norte for the support and assistance with this project (PPG/UFRN), and the Meteorology and Water Resources Foundation of Ceará (FUNCEME).
Conflict of interest
The authors declare that the research was conducted in the absence of any commercial or financial relationships that could be construed as a potential conflict of interest.
Publisher’s note
All claims expressed in this article are solely those of the authors and do not necessarily represent those of their affiliated organizations, or those of the publisher, the editors and the reviewers. Any product that may be evaluated in this article, or claim that may be made by its manufacturer, is not guaranteed or endorsed by the publisher.
Supplementary material
The Supplementary Material for this article can be found online at: https://www.frontiersin.org/articles/10.3389/feart.2022.1071128/full#supplementary-material
SUPPLEMENTARY TABLE S1 | Analysis of the homogeneity of the precipitation indices during the annual period (AN), rainy season (RN), and dry season (DS) from 1974 to 2018.
SUPPLEMENTARY FIGURE S1 | (A) Cumulative rainfall map of the State of Ceará for the annual, (B) rainy and (C) dry periods from 1974 to 2018.
SUPPLEMENTARY FIGURE S2 | Relationship between the L-coefficients of skewness (A-C) and kurtosis (D-E) in the partial duration series at the 1th, 5th, and 10th percentiles before and after the quality control process from 1974 to 2018. The red dashed line represents the simple linear regression.
References
Alexanderson, H. (1986). A homogeneity test applied to precipitation data. J. Climatol. 6, 661–675. doi:10.1002/joc.3370060607
Andreoli, R. V., and Kayano, M. T. (2009). “O clima da região Nordeste do Brasil,” in Tempo e Clima do Brasil, 1. Editors I. F. A. Cavalcanti, N. J. Ferreira, M. G. A. J. Silva, and M. A. F. Silva Dias (São Paulo: Oficina de Textos), 213–233.
Aragão, J. O. R. (1986). A general circulation model investigation of the atmospheric response to El Niño, NCAR/CT-100. PhD Thesis.
Aragão, J. O. R. (1990). Fatos sobre o fenômeno de El Niño e sua relação com as secas no Nordeste do Brasil. Bol. Soc. Bras. Meteorol. 14 (1), 2–8.
Barrios, A., Trincado, G., and Garreaud, R. (2018). Alternative approaches for estimating missing climate data: Application to monthly precipitation records in south-central Chile. For. Ecosyst. 5, 28–10. doi:10.1186/s40663-018-0147-x
Bellido-Jiménez, J. A., Gualda, J. E., and García-Marín, A. P. (2021). Assessing machine learning models for gap filling daily rainfall series in a semiarid region of Spain. Atmosphere 12, 1158. doi:10.3390/atmos12091158
Brito, S. S. B., Cunha, A. P. M. A., Cunningham, C. C., Alvalá, R. C., Marengo, J. A., and Carvalho, M. A. (2018). Frequency, duration and severity of drought in the Semiarid Northeast Brazil region. Int. J. Climatol. 38, 517–529. doi:10.1002/joc.5225
Buishand, T. (1982). Some methods for testing the homogeneity of rainfall records. J. Hydrology 58, 11–27. doi:10.1016/0022-1694(82)90066-X
Costa, A. C., and Soares, A. (2009). Homogenization of climate data: Review and new perspectives using geostatistics. Math. Geosci. 41, 291–305. doi:10.1007/s11004-008-9203-3
Costa, R. L., Baptista, G. M. M., Gomes, H. B., Silva, F. D. S., Júnior, R. L. R., Salvador, M. A., et al. (2020). Analysis of climate extremes indices over northeast Brazil from 1961 to 2014. Weather Clim. Extrem. 28, 100254–100321. doi:10.1016/j.wace.2020.100254
Domonkos, P., and Coll, J. (2015). Homogenisation of temperature and precipitation time series with ACMANT3: Method description and efficiency tests. Int. J. Climatol. 122, 1910–1921. doi:10.1002/joc.4822
ECA and D (2013). European climate assessment & data set (ECA&D) algorithm theoretical basis document (ATBD). De Bilt, Netherlands: Royal Netherlands Meteorological Institute KNMI. Version 10.7 Available at: http://www.ecad.eu/documents/atbd.pdf.
Estévez, J., Gavilán, P., and García-Marín, A. P. (2018). Spatial regression test for ensuring temperature data quality in southern Spain. Theor. Appl. Climatol. 131, 309–318. doi:10.1007/s00704-016-1982-8
Feng, S., Hu, Q., and Qian, W. (2004). Quality control of daily meteorological data in China, 1951–2000: A new dataset. Int. J. Climatol. 24, 853–870. doi:10.1002/joc.1047
Ferreira, A. G., and Mello, N. G. S. (2005). Principais sistemas atmosféricos atuantes sobre a região nordeste do brasil e a influência dos oceanos pacífico e atlântico no clima da região. ABClima. 1 (1), 15–28. doi:10.5380/abclima.v1i1.25215
IPCC (Intergovernmental Panel on Climate Change) (2012). “Managing the risks of extreme events and disasters to advance climate change adaptation,” in A special report of working groups I and II of the intergovernmental Panel on climate change. Editors C. B. Field, V. Barros, T. F. Stocker, D. Qin, D. J. Dokken, K. L. Ebiet al. (Cambridge: Cambridge University Press), 582.
IPCC (Intergovernmental Panel on Climate Change) (2014). “Climate change 2014: Impacts, adaptation, and vulnerability. Part A: Global and sectoral aspects,” in Contribution of working group II to the fifth assessment report of the intergovernmental Panel on climate change. Editors C. B. Field, V. R. Barros, D. J. Dokken, K. J. Mach, M. D. Mastrandrea, T. E. Biliret al. (Cambridge: Cambridge University Press), 1132.
Gilbert, R. O. (1987). Statistical methods for environmental pollution monitoring. New York: John Wiley & Sons.
Guerreiro, M. J. S., Andrade, E. M., Abreu, I., and Lajinha, T. (2013). Long-term variation of precipitation indices in Ceará state, northeast Brazil. Int. J. Climatol. 33, 2929–2939. doi:10.1002/joc.3645
Haigh, M. J. (2004). Sustainable management of headwater resources: The nairobi 'headwater' declaration (2002) and beyond. Asian J. Water, Environ. Pollut. 1 (1-2), 17–28. Available at: http://www.iospress.nl/html/09729860.htm.
Hänsel, S., Medeiros, D. M., Matschullat, J., Petta, R. A., and Silva, I. M. (2016). Assessing homogeneity and climate variability of temperature and precipitation series in the capitals of North-Eastern Brazil. Front. Earth Sci. 4, 1–21. doi:10.3389/feart.2016.00029
Hawkins, D. M. (1977). Testing a sequence of observations for a shift in location. J. Am. Stat. Assoc. 72, 180–186. doi:10.1080/01621459.1977.10479935
Haylock, M. R., Peterson, T. C., Alves, L. M., Ambrizzi, T., Anunciação, Y. M. T., Baez, J., et al. (2006). Trends in total and extreme south American rainfall in 1960–2000 and links with sea surface temperature. J. Clim. 19, 1490–1512. doi:10.1175/JCLI3695.1
Hubbard, K. G. (1994). Spatial variability of daily weather variables in the high plains of the USA. Agric. For. Meteorology 68, 29–41. doi:10.1016/0168-1923(94)90067-1
Huerta, A., and Lavado-Casimiro, W. (2020). Trends and variability of precipitation extremes in the Peruvian Altiplano (1971–2013). Int. J. Climatol. 41, 513–528. doi:10.1002/joc.6635
Kanda, N., Negi, H. S., Rishi, M. S., and Shekhar, M. S. (2018). Performance of various techniques in estimating missing climatological data over snowbound mountainous areas of Karakoram Himalaya. Mater. Apps. 25, 337–349. doi:10.1002/met.1699
Kashani, M. H., and Dinpashoh, Y. (2012). Evaluation of efficiency of different estimation methods for missing climatological data. Stoch. Environ. Res. Risk Assess. 26, 59–71. doi:10.1007/s00477-011-0536-y
Kayano, M. T., and Andreoli, R. V. (2006). Relationships between rainfall anomalies over northeastern Brazil and the El niño–southern oscillation. J. Geophys. Res. 111, D13101. doi:10.1029/2005JD006142
Klein Tank, A. M., Zwiers, F. W., and Zhang, X. (2009). Guidelines on analysis of extremes in a changing climate in support of informed decisions for adaptation. Geneva: WMO.
Li, X., Wang, X., and Babovic, V. (2018). Analysis of variability and trends of precipitation extremes in Singapore during 1980–2013. Int. J. Climatol. 38, 125–141. doi:10.1002/joc.5165
Marengo, J. A., Alves, L. M., and Alvala, R. C. S. (2018). “Climatic characteristics of the 2010-2016 drought in the semiarid Northeast Brazil region,” in Annals of the Brazilian academy of sciences, 1973–1985. doi:10.1590/0001-3765201720170206
Marengo, J. A., and Bernasconi, M. (2015). Regional differences in aridity/drought conditions over northeast Brazil: Present state and future projections. Clim. Change 129, 103–115. doi:10.1007/s10584-014-1310-1
Marengo, J. A., Torres, R. R., and Alves, L. M. (2017). Drought in northeast Brazil — Past , present , and future. Theor. Appl. Climatol. 129, 1189–1200. doi:10.1007/s00704-016-1840-8
Martínez, M. D., Serra, C., Burgueno, A., and Lana, X. (2009). Time trends of daily maximum and minimum temperatures in Catalonia (ne Spain) for the period 1975-2004. Int. J. Climatol. 30, 267–290. doi:10.1002/joc.1884
Molion, L. C. B., and Bernardo, S. O. (2002). Uma revisão da dinâmica das chuvas no nordeste brasileiro. Rev. Bras. Meteorol. 17, 1–10. Available at: http://www.rbmet.org.br/port/revista/revista_artigo.php?id_artigo=548.
Moura, A. D., and Shukla, J. (1981). On the dynamics of droughts in northeast Brazil: Observations, theory and numerical experiments with a general circulation model. J. Atmos. Sci. 38 (12), 2653–2675. doi:10.1175/1520-0469(1981)038<2653:otdodi>2.0.co;2
NOAA (National Oceanic and Atmospheric Administration) (2019b). Cold and warm episodes by season. Available at: https://origin.cpc.ncep.noaa.gov/products/analysis_monitoring/ensostuff/ONI_v5.php.
NOAA (National Oceanic and Atmospheric Administration) (2019a). Nino regions. Available at: https://www.cpc.ncep.noaa.gov/products/analysis_monitoring/ensostuff/nino_regions.shtml.
Oliveira, P. T., Santos e Silva, C. M., and Lima, K. C. (2017). Climatology and trend analysis of extreme precipitation in subregions of Northeast Brazil. Theor. Appl. Climatol. 130, 77–90. doi:10.1007/s00704-016-1865-z
Oliveira, P. T., Silva, C. M. S., and Lima, K. C. (2014). Linear trend of occurrence and intensity of heavy rainfall events on Northeast Brazil. Atmos. Sci. Lett. 15, 172–177. doi:10.1002/asl2.484
Oliveira, V. H. (2019). Natural disasters and economic growth in Northeast Brazil: Evidence from municipal economies of the Ceará State. Envir. Dev. Econ. 24 (3), 271–293. doi:10.1017/S1355770X18000517
Pal, I., and Al-Tabbaa, A. (2011). Monsoon rainfall extreme indices and tendencies from 1954–2003 in Kerala, India. Clim. Change 106, 407–419. doi:10.1007/s10584-011-0044-6
Peterson, T. C., and Easterling, D. R. (1994). Creation of homogeneous composite climatological reference series. Int. J. Climatol. 14, 671–679. doi:10.1002/joc.3370140606
Pettitt, A. (1979). A non-parametric approach to the change-point problem. Appl. Stat. 28, 126–135. doi:10.2307/2346729
Reek, T., Doty, S. R., and Owen, T. W. (1992). A deterministic approach to the validation of historical daily temperature and precipitation data from the cooperative network. Bull. Am. Meteorol. Soc. 73, 753–762. doi:10.1175/1520-0477(1992)073<0753:adattv>2.0.co;2
Roziane, S. S., Gilbeto, C. S., Robson, A. O., and Gabriel, M. A. (2012). Homogeneidade de séries climatológicas em Minas Gerais. Rev. Bras. Eng. Agric. Ambient. 16, 1338–1345. doi:10.1590/S1415-43662012001200011
Sen, P. K. (1968). Estimates of the regression coefficient based on Kendall's tau. J. Am. Stat. Assoc. 63, 1379–1389. doi:10.1080/01621459.1968.10480934
Silva, I. M., Medeiros, D. M., and Mesquita, M. S. (2020). Investigating teleconnection patterns associated with the rainy season of the northern northeast Brazil using a hidden Markov model. Clim. Dyn. 55, 2075–2088. doi:10.1007/s00382-020-05374-4
Skansi, M., Brunet, M., Sigró, J., Aguilar, E., Groening, J. A. A., Bentancur, O. J., et al. (2013). Warming and wetting signals emerging from analysis of changes in climate extreme indices over South America. Glob. Planet. Change 100, 295–307. doi:10.1016/j.gloplacha.2012.11.004
Sugahara, S., da Rocha, R. P., Ynoue, R. Y., and da Silveira, R. B. (2012). Homogeneity assessment of a station climate series (1933–2005) in the metropolitan area of São Paulo: Instruments change and urbanization effects. Theor. Appl. Climatol. 107, 361–374. doi:10.1007/s00704-011-0485-x
Taxak, A. K., Murumkar, A. R., and Arya, D. S. (2014). Long term spatial and temporal rainfall trends and homogeneity analysis in Wainganga basin, Central India. Weather Clim. Extrem. 4, 50–61. doi:10.1016/j.wace.2014.04.005
Teixeira, R. F. B. (2008). O fenômeno da brisa e sua relação com a chuva sobre Fortaleza-CE. Rev. Bras. Meteorol. 23 (3), 282–291. doi:10.1590/S0102-77862008000300003
Uvo, C. B., Repelli, C. A., Zebiak, S. E., and Kushnir, Y. (1998). The relationships between tropical Pacific and Atlantic SST and Northeast Brazil monthly precipitation. J. Clim. 11, 551–562. doi:10.1175/1520-0442(1998)011<0551:trbtpa>2.0.co;2
Uvo, C. R. B. (1989). A Zona de Convergência Intertropical (ZCIT) e sua relação com a precipitação da região norte do Nordeste Brasileiro. Brazil: National Institute for Space Research.
Vicente-Serrano, S. M., Beguería, S., López-Moreno, J., García-Vera, M. A., and Stepanek, P. (2010). A complete daily precipitation database for northeast Spain: Reconstruction, quality control, and homogeneity. Int. J. Climatol. 30, 1146–1163. doi:10.1002/joc.1850
Viney, N. R., and Bates, B. C. (2004). It never rains on sunday: The prevalence and implications of untagged multi-day rainfall accumulations in the Australian high-quality data set. Int. J. Climatol. 24, 1171–1192. doi:10.1002/joc.1053
Von Neumann, J. (1941). Distribution of the ratio of the mean square successive difference to the variance. Ann. Math. Stat. 12, 367–395. doi:10.1214/aoms/1177731677
Wijngaard, J. B., Klein Tank, A. M. G., and Können, G. P. (2003). Homogeneity of 20th century European daily temperature and precipitation series. Int. J. Climatol. 23, 679–692. doi:10.1002/joc.906
WMO (World Meteorological Organization) (2011). Guide to climatological practices. Geneva: WMO No. 100WMO.
Keywords: precipitation, extreme indices, Northeast Brazil, data quality, homogeneity, trend analysis
Citation: Silva IdM, Medeiros DM, Sakamoto MS, Leal JBV, Mendes D and Ambrizzi T (2022) Evaluating homogeneity and trends in extreme daily precipitation indices in a semiarid region of Brazil. Front. Earth Sci. 10:1071128. doi: 10.3389/feart.2022.1071128
Received: 15 October 2022; Accepted: 24 November 2022;
Published: 20 December 2022.
Edited by:
Chenghai Wang, Lanzhou University, ChinaCopyright © 2022 Silva, Medeiros, Sakamoto, Leal, Mendes and Ambrizzi. This is an open-access article distributed under the terms of the Creative Commons Attribution License (CC BY). The use, distribution or reproduction in other forums is permitted, provided the original author(s) and the copyright owner(s) are credited and that the original publication in this journal is cited, in accordance with accepted academic practice. No use, distribution or reproduction is permitted which does not comply with these terms.
*Correspondence: Isamara de Mendonça Silva, aXNhbWFyYS5tZW5kb25jYS5zQGdtYWlsLmNvbQ==; Deusdedit Monteiro Medeiros, a2FsYnJhbW9uZEBnbWFpbC5jb20= Meiry Sayuri Sakamoto, bWVpcnlAZnVuY2VtZS5icg==; João Bosco Verçosa Leal Jr, Ym9zY28ubGVhbEB1ZWNlLmJy; David Mendes, ZGF2aWQubWVuZGVzMjJAZ21haWwuY29t; Tercio Ambrizzi, dGVyY2lvLmFtYnJpenppQGlhZy51c3AuYnI=