 Meiyan Wang1,2
 Wei Wang
- 1Country College of Construction Engineering, Jilin University, Changchun, China
- 2Department of Civil Engineering, Shandong Vocational College of Science and Technology, Weifang, China
- 3School of Civil Engineering, Changchun Institute of Technology, Changchun, China
The pebble formation formed by weathered quartzite and granite is usually of high strength, strong permeability and poor self stability, which brings great difficulties to shield tunneling. It is necessary to adjust the tunneling parameters at any time to prevent the consequences of instability of the tunnel face, loss of stratum and surface settlement caused by the imbalance of the soil bin pressure. GA algorithm is embedded into PSO algorithm for parameter optimization, and grey theory is combined to establish the prediction model of soil chamber pressure based on grey least square support vector machine, which can solve the problem of difficult control of tunneling parameters in pebble stratum formed by weathered quartzite and granite. Research indicates: GA-PSO-GLSSVM chamber Earth pressure prediction model enhances the EPB chamber Earth pressure forecast accuracy in complicated strata by integrating the global search capability of the GA algorithm, the quick convergence of the PSO algorithm, and the anti-disturbance capability of the GM model. The GA-PSO-GLSSVM model has high goodness-of-fit and accuracy compared with other prediction models. This model can successfully prevent the a series of undesirable consequences such as destabilization of the palm surface, missing strata and settlement due to ground surface due to pressure imbalance in the soil chamber pressure. The research results can provide reference for EPB shield tunneling parameter control in Grade V surrounding rock.
Introduction
Because of its broad applications and little influence on the environment, Earth Pressure Balance shield (EPB) is frequently utilized in the building of subway tunnels. The operational status of the shield technique must frequently be reflected by the tunneling parameters since it is a closed process. In order to successfully manage ground settlement, ensure the stability of the tunnel face, reduce cutting tool loss, and keep the shield in a favorable position, it is important to choose the right tunneling parameters. The shield tunneling parameters must also be modified and optimized in real time when geological conditions change during the tunneling process in order to guarantee the shield is tunneled securely and effectively. Once the tunneling parameters are improperly controlled, it is very easy to cause accidents such as ground subsidence and building collapse, as illustrated in Figure 1. Therefore, how to accurately predict and control the tunneling parameters has always been the research focus in the field of shield tunnel construction technology (Pan et al., 2022). At present, many scholars have studied the variation laws and theoretical calculations of cutter head torque, shield thrust, grouting pressure, tunneling speed and other parameters under different geological conditions during EPB shield tunneling, and established mathematical and physical models to predict tunneling parameters according to Hooke’s law (Jie et al., 2017; Wei et al., 2017; Yang et al., 2017; Zhao et al., 2017; Boukhari, 2020; Cao et al., 2020; Gao et al., 2020; Al-Habahbeh, 2022; Lu et al., 2022; Lyu et al., 2022). Although these models can reflect the analytical relationship between tunneling parameters, shield tunneling is a complex and changing process, and the stratum it crosses is actually a non-uniform and discontinuous non-linear elastomer. Therefore, this kind of prediction model has certain limitations in engineering applicability.
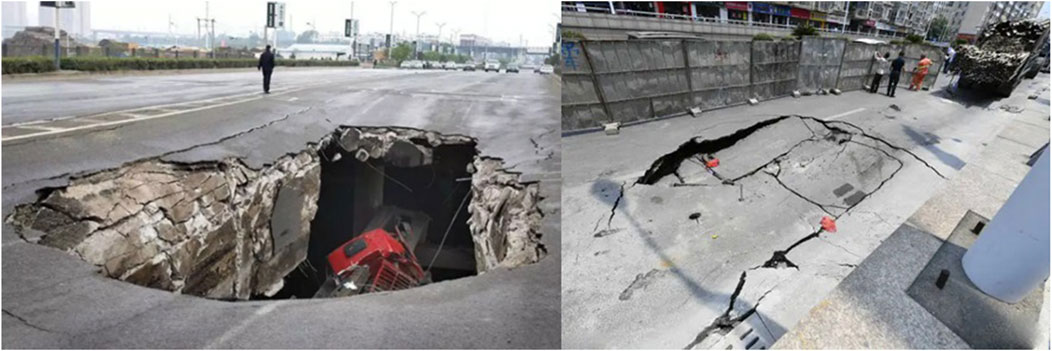
FIGURE 1. Ground subsidence caused by shield construction.
With the rapid development of big data and artificial intelligence technology in recent years, deep learning algorithms such as big data statistical analysis (Sekiya et al., 2022; Wu et al., 2022), BP neural network (Zhou et al., 2015; Cachim and Bezuijen, 2019; Wang et al., 2022a), genetic algorithm (GA) (Ahangari et al., 2015), support vector machine (SVM) (Wang et al., 2013; Wang et al., 2022b), random forest (RF) (Zhou et al., 2017; Ge et al., 2022), particle swarm optimization (PSO) (Liu et al., 2018; Elbaz et al., 2022) have been applied in the prediction of shield tunneling parameters. The rudiment of the concept of deep learning is the deep belief network (DBN) proposed by Hinton in 2006. This method adopts unsupervised layer by layer training to improve the depth of network training, and has achieved good application results. It is considered to be one of the most potential deep learning algorithms after unsupervised learning. The research above shows that the accuracy of the prediction model established by these intelligent algorithms is significantly higher than that of the mathematical physical model, which has important application value for EPB shield tunneling under different geological conditions. The most crucial factor in ensuring the normal tunneling of the EPB shield machine is the Earth pressure inside the chamber. There have been studies done on the prediction model of the Earth pressure within the chamber, and Shangguan (2011) established the mapping link between the Earth pressure inside the chamber and controllable elements such propulsion speed. Based on a genetic algorithm, Li and Cao (2012) projected the pressure of the soil. There are currently two basic approaches for building a prediction model for the Earth pressure within a chamber using tunneling parameters. According to Hooke’s rule of conservation of excavation and dumping volume of soil, one is to develop a mathematical model of the Earth pressure in chamber prediction (Liu et al., 2022). The alternative way is to construct a prediction model of the Earth pressure in a chamber based on tunneling characteristics identified during the tunneling process using neural networks and other more intelligent methods (Shi et al., 2008; Liu et al., 2011). The instability of the tunnel face and loss of strata caused by the imbalance of Earth pressure in the chamber will have a number of unfavorable effects, including the elevation and settling of the ground surface. The coupling action of tunneling parameters such as cutter head torque, screw conveyor speed, shield thrust, grouting pressure, etc. Results in the dumping efficiency of the shield machine during the tunneling process. The dumping efficiency is influenced by the mechanical and physical parameters of the formation, which change over time.
Sandy pebble stratum usually has high permeability, loose structure, and extremely low cohesion, and its overall stability is generally poor. During shield tunneling, it is bound to change the stress state of the stratum near the excavation face, causing stratum loss, and in serious cases, it will lead to large ground subsidence and building damage, causing great difficulty to shield construction. Because the Earth pressure in chamber of EPB shield is often a nonlinear mapping relationship with other tunneling parameters, it is difficult to determine the functional relationship between the Earth pressure in chamber and other tunneling parameters by polynomial fitting. In view of this, this study integrated the GA algorithm into the PSO algorithm for parameter optimization, thoroughly examined the characteristics of large interaction and strong coupling effect between shield tunneling parameters combined with Grey theory, established a prediction model of soil pressure based on Grey Least Square Support Vector Machine (GLSSVM), the validity and reliability of the prediction model are confirmed through the sand gravel shield tunnel section project of Chengdu metro line 17, using the actual monitoring data as the training and test samples of the prediction model, which serves as a reference for the EPB shield tunneling parameter control in sandy gravel stratum.
Materials and methods
Mechanism and influencing factors of surface subsidence in sandy pebble stratum
During shield construction in sandy pebble stratum, due to the jacking and extrusion of shield machine and the shear friction between shield shell and soil, the equilibrium state of stratum is disturbed and destroyed, the soil particles move, and the initial stress of stratum changes and redistributes, causing stratum loss. The ground loss Vs is calculated as follows:
where, Vs is ground loss in m2, Vsˊ is ground loss ratio in % and r0 is outer diameter in m.
The loss of sandy gravel stratum caused by shield tunneling is usually the sum of the loss of excavation face, the periphery of shield machine and the tail of shield. When the shield top thrust is extruded during shield tunneling, the soil moves sideways and loosens up in a specific area in front of the excavation face, which is what causes the formation loss at the excavation face, as illustrated in Figure 2. Because the sand pebble stratum contains a lot of pebbles and they are strong, the cutter head and shield machine’s props frequently sustain significant wear. Additionally, when the cutter is replaced or the machine pauses when it runs into significant frontal obstructions, stratum loss occurs. During tunneling, the shield machine will produce varying degrees of friction, shear and extrusion with the surrounding sand pebbles, and a certain thickness of shear disturbance area will be formed around the shield, within which the soil mass will move and cause formation loss, as shown in Figure 3. Additionally, the gap between the outer diameter of the cutter head and the outside circumference of the shield shell and the overbreak of the shield brought on by the attitude adjustment during the tunneling of the shield machine would both result in the loss of the sandy gravel layer. At the shield’s tail, there is a small opening between the segment lining ring and the tunnel excavation wall. Deep soil disturbance and formation loss will result from the soil disturbed by friction shear moving to this gap. Because the sandy gravel stratum has such wide pores and a high permeability coefficient, grouting cannot be done effectively, which will impact the stability of the sandy gravel stratum tunnel later on.
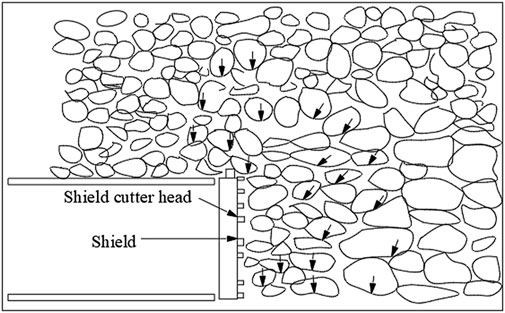
FIGURE 2. Mechanism of stratum loss during shield excavation.
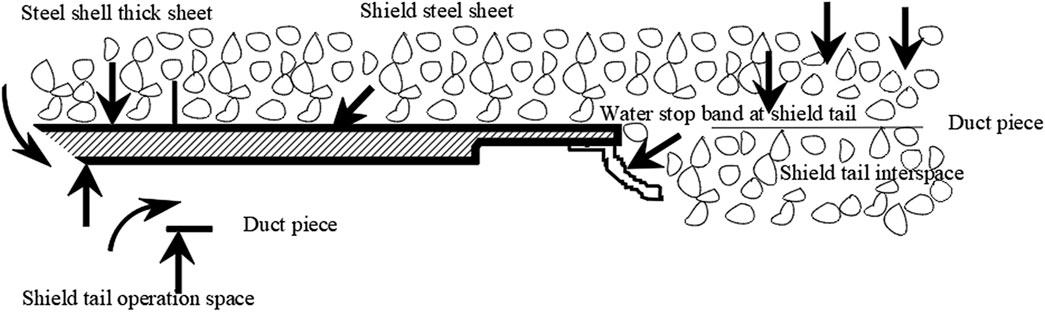
FIGURE 3. Mechanism of stratum loss around shield shell.
According to the settlement mechanism, the stress state of the excavation surface, the gap between the soil and the shield shell, the over break caused by deviation correction, the grouting pressure at the tail of the shield and other influencing factors are related to the control of the shield construction parameters, mainly including the pressure of the Earth bunker, the tunneling speed, the total thrust of the shield, the torque and speed of the cutter head, the grouting pressure and amount in the same step, and the posture offset of the shield. The working pressure in the soil bin is not always consistent with the real situation due to the weak flow plasticity of sand and gravel, which will impair the stability of the excavation surface and, in severe circumstances, cause surface settlement and collapse. Large stones can easily remain in the soil bin during slag discharge or migrate about, which can impact the shield machine’s ability to maintain its position and attitude. The shield machine’s inability to go forward once obstructed will have an impact on the stability of the excavation surface. Another important aspect impacting surface settlement is the shield tunnel’s depth, which influences whether or not a pressure arch can be built on top of the tunnel to limit soil particle movement and minimize disturbance.
GA-PSO-GLSSVM prediction model for the Earth pressure in chamber in sandy pebble stratum
Based on deep learning algorithm based on statistical learning theory, LSSVM replaces quadratic programming optimization in support vector machine by solving linear equations. LSSVM model is an adaptive model, which can change the empirical risk from the first power to the second power, and replace inequality constraints with equality constraints (Lin et al., 2014; Zhang et al., 2022). Compared with the traditional support vector machine, its advantage is to improve the solution speed and simplify the complex calculation. GLSSVM model is based on LSSVM and Grey theory GM (1.1) to accumulate the original data, and then get new sequence data that is less affected by disturbance factors and has stronger regularity. The specific modeling process is as follows:
1) Original data sequence:
Where,
2) Cumulative preprocessing data sequence by GM(1.1):
3) The high-dimensional feature space description of the data sequence obtained from the previous learning sample set in the LSSVM model:
4) Linear functional relationship:
Where, A (xi, yi) (i =1, 2, … , n) is learning sample set, xi∈Rn is learning sample, yi∈R is corresponding output prediction sample, w is weight vector, J (w, b, e) is loss function, γ is fault tolerant coefficient, ei is error, φ(x) is mapping function and b is offset.
The Lagrangian operator is applied to optimize w and e, and the Lagrangian function is established:
Where, αi is Lagrange multiplier, and the differential solution of Eq.4 is carried out. The linear equations are obtained according to the optimal conditions of KKT (Karush Kuhn Tucker):
Where, y= [y1, y2, … , yi]T, E = [1, 1, … , 1]T, α=[α1, α2, … , αi]T, Q is kernel function for nonlinear mapping, which Qij = K (xi, xj), i, j =(1, 2, … , n), and I is identity matrix. The regression model of LSSVM is obtained by solving the equations:
Through calculation, the predicted value of the cumulative sequence is obtained: yn+k (k = 1, 2, … , n). The prediction model of the original data sequence is obtained by progressive reduction:
Parameter optimization by PSO-GA
The choice of kernel function has an important impact on the accuracy and accuracy of the prediction results of GLSSVM regression model. GLSSVM regression model usually uses Gaussian radial basis kernel function K (xi, xj) to analyze nonlinear sample data, as follow:
In order to correctly predict unknown data without a priori reference value, the fault-tolerant penalty coefficient of kernel function must be γ and kernel parameters σ2 adjust the two parameters. At present, GA and PSO algorithms are commonly used for parameter optimization, but neither of them can guarantee the optimal solution. If the operator of GA algorithm is embedded into PSO algorithm, and the GA algorithm with excellent change ability is added to the memory ability of PSO algorithm, the whole population can converge rapidly towards the global optimization (Huang et al., 2022). Suppose a group of particles in D-dimensional space, each particle corresponds to a position X and velocity V that can characterize its attributes. When the dth particle swarm iteration is updated, the iteration of motion velocity Vi and motion position Xi of particle i is updated as follows:
Where, ω is inertia weight, i =(1, 2, … , m), d =(1, 2, … , D), and m is number of particles, D is search dimension, c1 and c2 are acceleration factors, and their values determine the optimization time, which is usually positive, pBesti is optimal position of particle i, r1 and r2 are random constants between [0, 1].
The value of the inertia weight ω has a direct impact on both the global and local optimization outcomes. The inertia weight is determined as follows to better balance the local and global search capabilities:
Where,
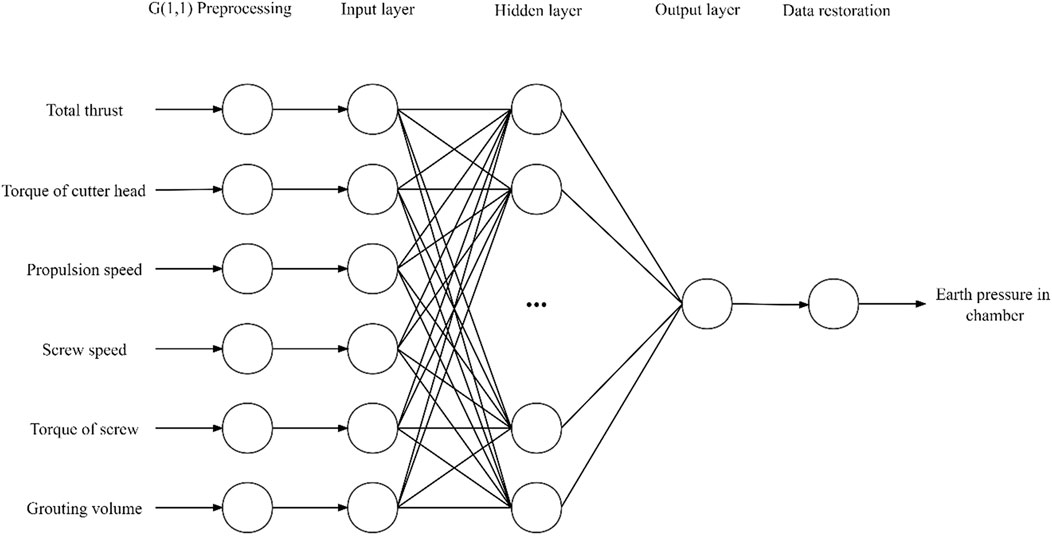
FIGURE 4. Topological structure diagram of prediction model for the Earth pressure in chamber.
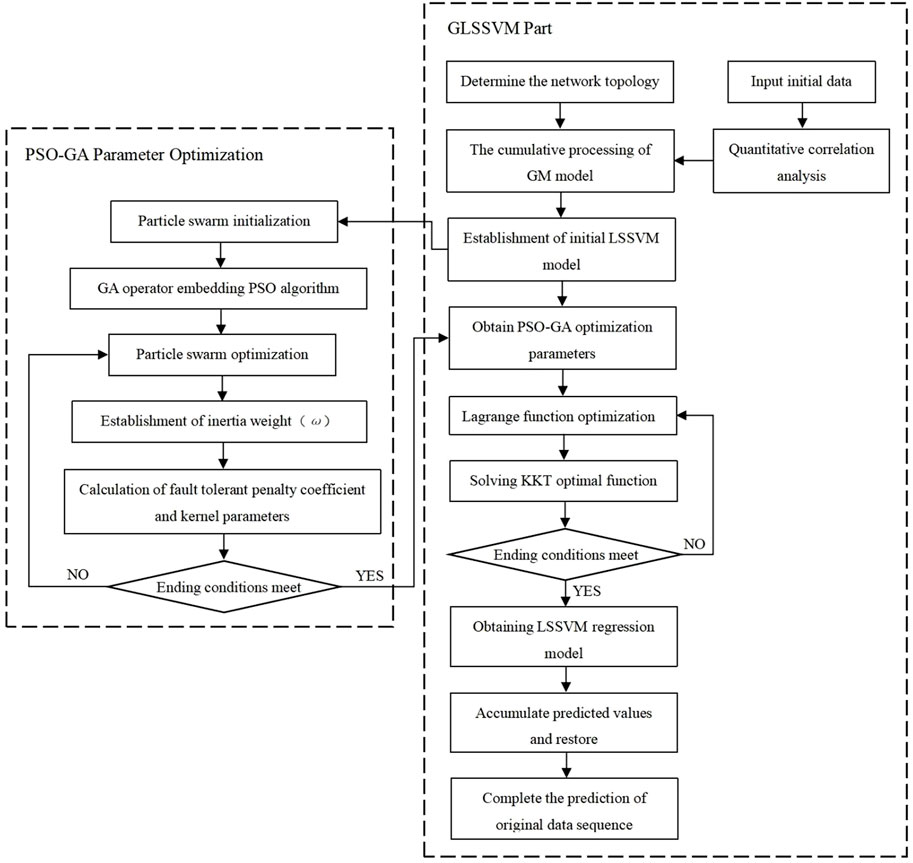
FIGURE 5. Prediction process of GLSSVM-PSO-GA prediction model.
Performance evaluation of prediction model
The key to build the GA-PSO-GLSSVM bunker pressure prediction model is to choose which tunneling parameters are the input variables to predict the bunker pressure. According to the EPB shield’s affecting elements, there is a strong correlation between Earth bunker pressure and the total thrust, cutter head torque, cutter head speed, propulsion speed, screw machine speed, grouting volume, and grouting pressure (Liu et al., 2010; Yu et al., 2020; Shen et al., 2022). However, under different geological conditions, the relationship between bunker pressure and tunneling parameters is also quite different. It is necessary to determine the tunneling parameters as input variables through correlation analysis according to the actual engineering conditions, and build the bunker pressure prediction model. The correlation between the soil pressure within the chamber and different tunneling parameters is quantitatively described in this study using the Pearson correlation coefficient (PCC):
where, v is Pearson correlation coefficient, Y and Z are parameters to be analyzed and p is number of data groups.
The mean absolute error (MAE), root mean square error (RMSE), coefficient of determination (R2), and relative error (MAPE) can be used to calculate the discrepancy data and the actual monitoring data in order to assess the accuracy of the prediction model. The prediction result of the prediction model is more accurate and the prediction impact is stronger if the value of the two error indicators approaches 0. The Earth pressure in chamber prediction model’s topological structure, prediction method, and model validity test are as follows:
where,
Results and discussion
Project overview
The starting point of the tunnel between the fifth municipal hospital station and Fengxi station in Chengdu Metro Line 17 is located at the intersection of the north section of Fengxi Avenue and Xifeng street. It is arranged along the north-south direction of Fengxi Avenue, and double track tunneling is accomplished using an Earth pressure balancing shield machine. The left line tunnel is 1610.186 m long, the right line tunnel is 1611.485 m long, and each of the left and right lines uses a separate EPB shield machine. In this segment, the tunnel mostly travels through dense pebble soil layer. The tunnel’s minimum plane curve radius is 450 m, and its longitudinal slope gradient is 10.063‰. The tunnel’s inner diameter is 7500 mm, its outer diameter is 8300 mm, the top of the tunnel is buried at a minimum depth of approximately 9.5 m and a maximum depth of about 20 m in this section. The mechanical properties of the sandy gravel strata are exceedingly complicated, and it exhibits low cohesion and a big gap between its particles. Shield machine tunneling disturbs the stratum significantly, hence it is important to precisely manage the tunneling parameters. During shield tunneling, one set of monitoring data can be obtained for each ring of excavation. The data set is composed of total thrust, cutter head torque, propulsion speed, screw machine speed, screw machine torque, grouting volume and soil pressure. According to the actual monitoring data, there are 1033 groups of data in this section, and a total of 900 groups of data from 101–1000 rings are taken for statistical analysis. In Table 1, the statistical distribution is displayed.

TABLE 1. Statistical distribution of shield machine parameters in shield section.
A total of 635 groups of data from 220 to 855 rings are selected for research. Because the shield parameters do not reflect the general conditions of normal tunneling due to the fact that the shield attitude has not yet been adjusted to the normal position at the beginning of shield tunneling, and also during the shield exit., as shown in Figure 6, and the distribution of the Earth pressure in chamber is shown in Figure 7.
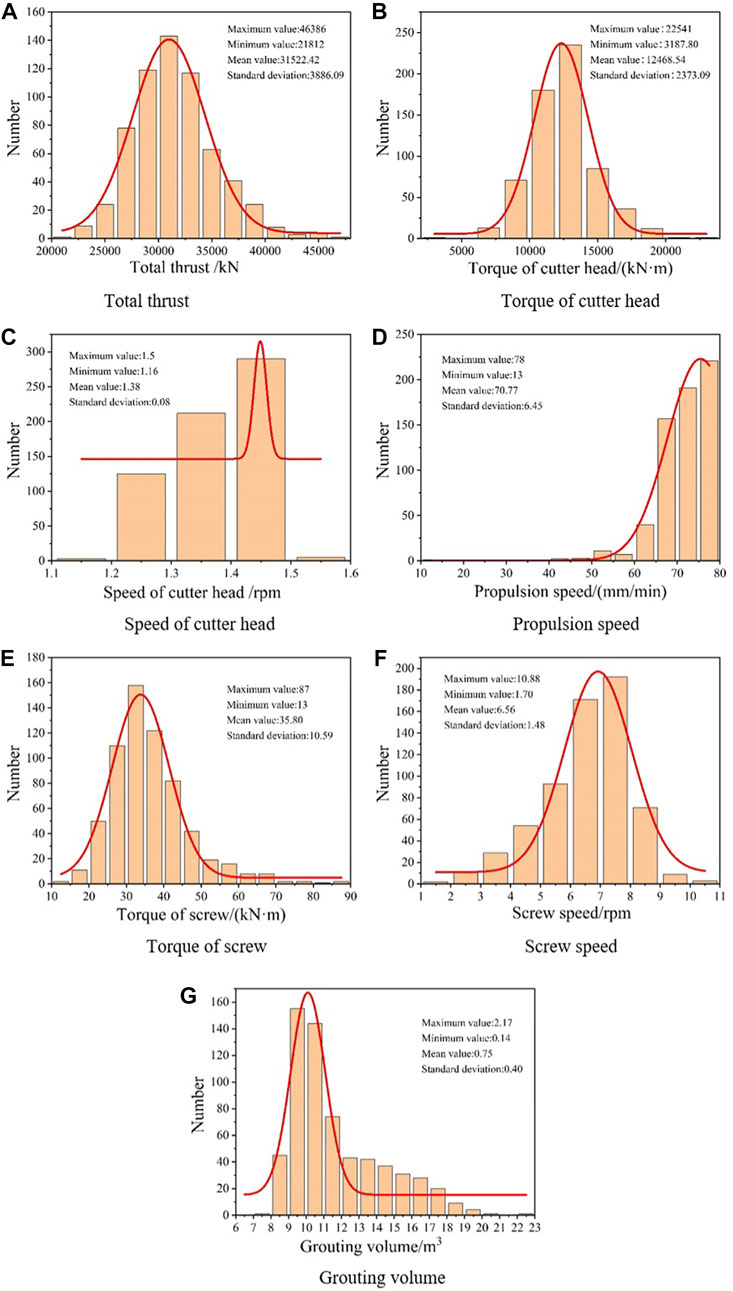
FIGURE 6. Normal distribution of shield machine parameters.
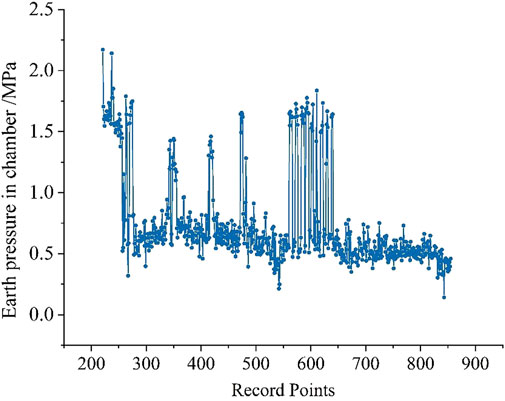
FIGURE 7. Distribution of the Earth pressure in chamber in sample data.
Correlation analysis of tunneling parameters
The association between the soil pressure inside the chamber and different tunneling parameters is expressed by the Pearson correlation coefficient, and the results of Pearson correlation coefficient is shown in Table 2. The calculations show that the Earth pressure within the chamber is positively correlated with the speed of the cutter head, the propulsion speed, the torque of the screw, and the grouting volume and negatively correlated with the total thrust, the cutter head torque, and the screw speed.
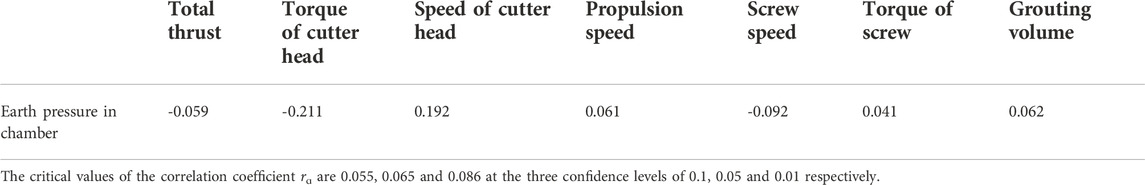
TABLE 2. Pearson correlation coefficient between chamber Earth pressure and excavation parameters.
Test the calculated correlation coefficient according to requirement that the two factors are at the confidence level ɑ when |r|≥rɑ. The following correlation shows that screw speed, torque, and cutter head speed are all significantly correlated with Earth pressure in the chamber at the level of 0.01, while total thrust, propulsion speed, and grouting volume are significantly correlated at the level of 0.1, and the correlation between screw torque and Earth pressure in the chamber is negligible. Therefore, the cutter head torque, speed, screw speed, grouting volume, propulsion speed, and total thrust are the input variables for the prediction model for the Earth pressure in the chamber.
Establishment of prediction model
The training set consists of the first 535 of the 635 groups of data, while the test set consists of the last 100. GM (1.1) model accumulation preprocessing is performed on the learning sample set data, and GLSSVM model is established. The crossover operator and genetic operator of GA algorithm are embedded in PSO algorithm, and the fault-tolerant penalty coefficient of GLSSVM model kernel function is calculated γ and kernel parameters σ2 optimize. The population size is 30, the number of iterations is 300, the crossover rate is 0.6, the variation rate is 0.1, the value range for the two optimization parameters is [0.01, 1000], and the maximum and lowest values of the inertia weight are 0.9 and 0.4, respectively. Local search capability and global search capability c1=c2 =1.49445. GA-GLSSVM, PSO-GLSSVM and GA-PSO-LSSVM are used to predict and analyze the data set respectively. The change law of fitness MSE is shown in Figure 8.
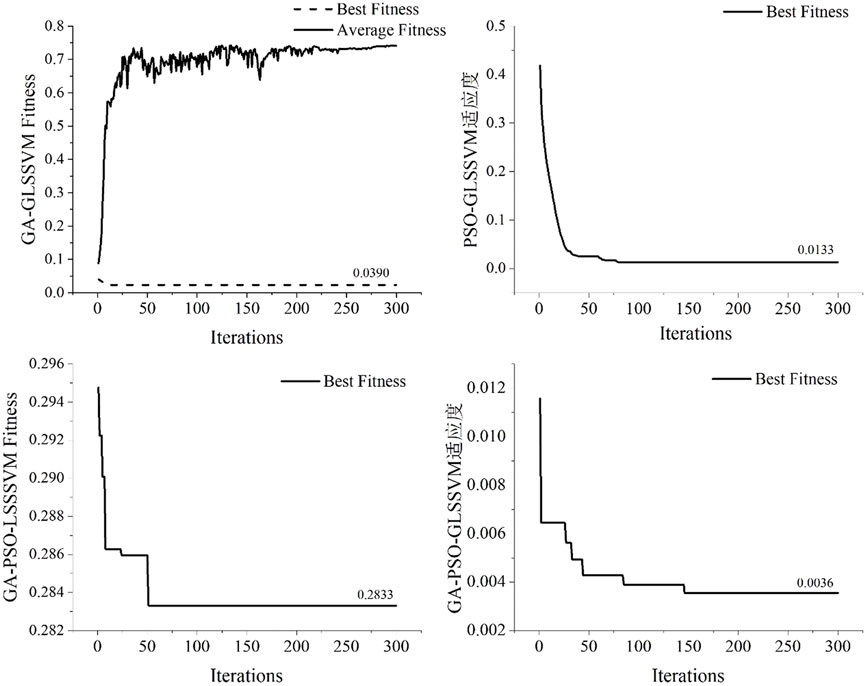
FIGURE 8. The fitness changes of different algorithms.
According to the fitness curves of each model, GA-GLSSVM model has stronger global search ability and PSO-GLSSVM model has faster convergence speed. Embedding GA operator into PSO algorithm can not only realize the global optimization advantage of GA algorithm, but also give play to the advantage of PSO to accelerate the convergence speed and improve the goodness of fit of the model. When calculating the fitness, the Grey theory GM (1,1) is used to accumulate the original data, and the new sequence data with less influence of disturbance factors and stronger regularity can be obtained. Gray superposition can significantly increase the model’s prediction accuracy when compared to GA-PSO-LSSVM and GA-PSO-GLSSVM. The optimal parameter combinations of different models is shown in Table 3.
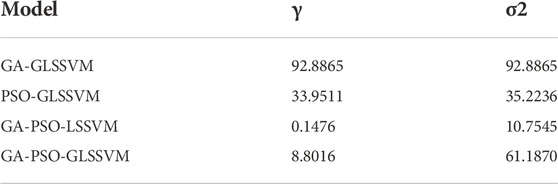
TABLE 3. Optimal parameter combinations of different models.
Analysis and comparison of prediction results
The optimized parameters of each model are brought into LSSVM model for prediction and analysis. The data accumulated by GM (1,1) model will get the accumulated sequence prediction value, and the prediction value is restored, that is, the original data and the prediction data. The predictions’ outcomes are displayed in Figure 9.
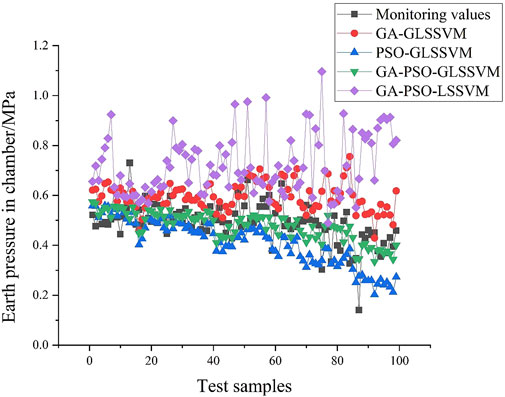
FIGURE 9. Comparison of prediction effects of different models.
When compared, it can be seen that the PSO-GLSSVM model’s prediction data is comparatively steady and fluctuates only little, although the predicted result is lower than the actual value. The GA -GLSSVM prediction results fluctuate relatively large in the late stage, and the prediction results are larger than the actual value. The benefits of the aforementioned two models are taken into consideration in the GA-PSO-GLSSVM model, and the forecast outcomes are quite similar to the actual values. The GA-PSO-LSSVM model’s predictions have low accuracy and great volatility. After removing certain huge data points from the learning sample set, the distribution of the remaining 524 data is displayed in Figure 10 to demonstrate the model’s correctness.
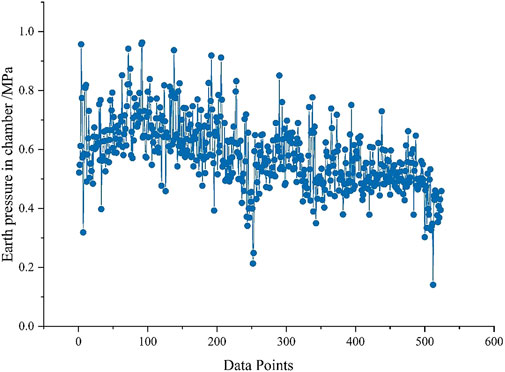
FIGURE 10. Excluding the data with large fluctuations of chamber Earth pressure.
In order to further verify the effectiveness of the anti-volatility capability of the GA-PSO-GLSSVM model and to illustrate the shortcomings of the GA-PSO-LSSVM model with weak anti-volatility capability, the prediction results of the GA-PSO-LSSVM model before and after removing the volatile data are compared here. Make the model parameters unchanged, take the first 424 data as the training set and the last 100 data as the test samples for GA-PSO-LSSVM prediction, and the results are shown in Figure 11.
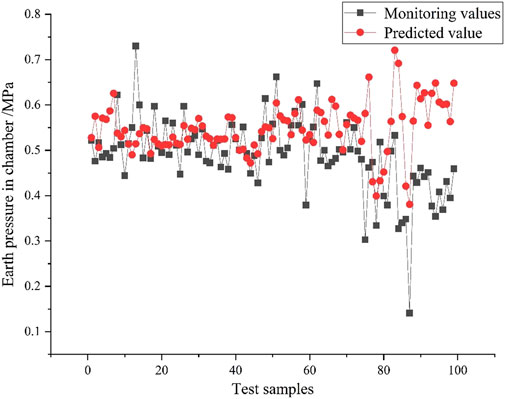
FIGURE 11. The prediction effect of GA-PSO-LSSVM model after eliminating the data with large fluctuation.
After excluding certain big values, the model’s prediction data have less fluctuation and are more accurate when compared to the GA-PSO-LSSVM prediction results in Figure 9. For the original data samples, GM (1.1) accumulation processing of the sample data in GA-PSO- GLSSVM model can effectively reduce the impact of the fluctuation of the original data and improve the prediction accuracy.
Due to its strong water permeability and poor self stability, sandy pebble stratum is easy to cause stratum loss when disturbed. Therefore, there are many factors affecting the pressure of the soil during the excavation process, especially when encountering large-size pebbles or poor slag discharge, it is easy to cause abnormal fluctuations in the pressure of the soil. Through comparison study, it can be found that the GA-GLSSVM, PSO-GLSSVM, and GA-PSO-LSSVM initial prediction accuracy and effect are all rather excellent. The difference between the projected value of the soil pressure in the chamber and the observed value is significant when encountering fluctuating data. As can be observed, the prediction model’s learning effect is negatively impacted by the quick shift in the tunneling scenario, which significantly reduces forecast accuracy. The GA-PSO-GLSSVM model weakens the influence of data fluctuation on the prediction model, and it has significant applicability to predict the pressure parameters of EPB shield in complex strata such as sand and gravel.
Error analysis
The root mean square error (RMSE), mean absolute error (MAE), mean absolute percentage error (MAPE), and the coefficient of decision (R2) are used as assessment indicators to assess the accuracy of the prediction model in order to further examine the model’s dependability and accuracy. Table 4 displays a comparison of each model’s prediction accuracy. The GA-PSO-GLSSVM model has superior stability, fitting accuracy, and result accuracy than other models. As can be shown, the GA-PSO-GLSSVM algorithm predicts the Earth pressure in the EPB shield chamber accurately, and the effect of the prediction after GM (1.1) pretreatment is superior to that of the conventional prediction model.
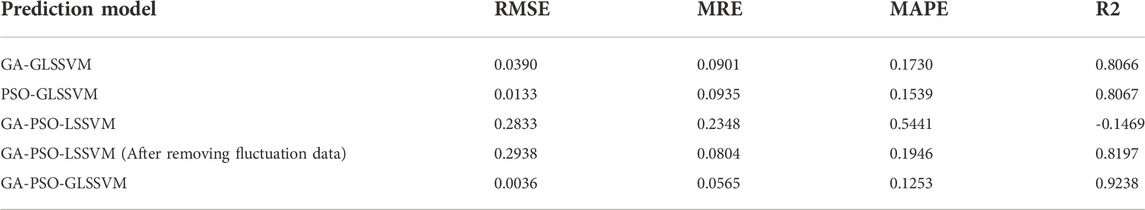
TABLE 4. Comparison of prediction accuracy of each model.
Conclusion
The GA operator is embedded into the PSO model to optimize the parameter optimization process of the data. This approach combines the GA algorithm’s global search capability with the PSO algorithm’s benefits of quick convergence, avoids the parameter optimization falling into the local optimal solution, and speeds up the operation efficiency. At the same time, GM (1,1) model is introduced into LSSVM model to eliminate the impact of data fluctuation on the prediction model and improve the accuracy of prediction model for the Earth pressure in chamber by GA-PSO-GLSSVM.
Compared with the prediction results of GA-GLSSVM, PSO-GLSSVM, GA-PSO-LSSVM and GA-PSO-GLSSVM, the prediction results of GA-PSO-GLSSVM model are more stable. Compared with the other three models, the root mean square error, average relative error, average absolute percentage error and resolvable coefficient are significantly better than other models, and the prediction accuracy is higher.
Through six tunneling parameters including total thrust, torque of cutter head, propulsion speed, speed of screw, torque of screw and grouting volume, the Earth pressure in chamber of shield tunneling is predicted by using GA-PSO-GLSSVM model. The actual monitoring data is used as the training and test samples of the prediction model to confirm its efficacy and dependability. This model can successfully prevent the instability of the tunnel face and the loss of stratum caused by the imbalance of soil pressure, which in turn cause a series of adverse consequences such as surface settlement, and serves as a reference for the control of EPB shield tunneling parameters in sandy gravel stratum.
Data availability statement
The original contributions presented in the study are included in the article/supplementary materials, further inquiries can be directed to the corresponding author.
Author contributions
MW is the writer and makes most of all the analysis. DZ is the tutor of MW. YL is the project leader. WW makes the monitor analysis. XW edits program.
Funding
This article is supported by: “2022 Project of Science and Technology Development Plan of Jilin Province” Research on safety early warning and settlement sensitivity classification and division of subway sections based on Remote sensing and GIS (No.20220203058SF).
Conflict of interest
The authors declare that the research was conducted in the absence of any commercial or financial relationships that could be construed as a potential conflict of interest.
Publisher’s note
All claims expressed in this article are solely those of the authors and do not necessarily represent those of their affiliated organizations, or those of the publisher, the editors and the reviewers. Any product that may be evaluated in this article, or claim that may be made by its manufacturer, is not guaranteed or endorsed by the publisher.
References
Ahangari, K., Moeinossadat, S. R., and Behnia, D. (2015). Estimation of tunnelling-induced settlement by modern intelligent methods. Soils Found. 55 (4), 737–748. doi:10.1016/j.sandf.2015.06.006
Al-Habahbeh, O. M. (2022). Sustainable design of an artificial lake in Jafer basin based on gravity flow. Math. Model. Eng. Problems 9 (1), 101–110. doi:10.18280/mmep.090113
Boukhari, Y. (2020). Application and comparison of machine learning algorithms for predicting mass loss of cement raw materials due to decarbonation process. Rev. d'Intelligence Artif. 34 (4), 403–411. doi:10.18280/ria.340404
Cachim, P., and Bezuijen, A. (2019). Modelling the torque with artificial neural networks on a tunnel boring machine. KSCE J. Civ. Eng. 23 (10), 4529–4537. doi:10.1007/s12205-019-0302-0
Cao, X. P., Zhang, Y. P., and Zhang, Y. R. (2020). Anti-seismic effect of the shock absorption layer in tunnel. Int. J. Saf. Secur. Eng. 10 (1), 41–47. doi:10.18280/ijsse.100106
Elbaz, K., Yan, T., Zhou, A., and Shen, S. L. (2022). Deep learning analysis for energy consumption of shield tunneling machine drive system. Tunn. Undergr. Space Technol. 123, 104405. Article ID 104405. doi:10.1016/j.tust.2022.104405
Gao, F., Lv, S., Zhang, C. Y., Zhang, P., Guo, Z. G., Ma, Q. Y., et al. (2020). Discrete- and finite-element analysis on the tunneling safety of pipe jacking machine in coal rock formation. Int. J. Heat Technol. 38 (4), 801–807. doi:10.18280/ijht.380405
Ge, S., Gao, W., Cui, S., Chen, X., and Wang, S. (2022). Safety prediction of shield tunnel construction using deep belief network and whale optimization algorithm. Automation Constr. 142, 104488. Article ID 104488. doi:10.1016/j.autcon.2022.104488
Huang, H., Chang, J., Zhang, D., Zhang, J., Wu, H., and Li, G. (2022). Machine learning-based automatic control of tunneling posture of shield machine. J. Rock Mech. Geotechnical Eng. 14 (4), 1153–1164. doi:10.1016/j.jrmge.2022.06.001
Jie, L., Fu, K., Guo, J., Zhang, Z., and Xu, M. (2017). Establishment and optimization of a driving speed model for shield tunnelling in mixed ground. Mod. Tunn. Technol. 54 (3), 142–147. doi:10.13807/j.cnki.mtt.2017.03.020
Li, S. J., and Cao, L. J. (2012). Pressure control model on soil chamber of shield machine and its parameter identification. J. China Coal Soc. 37 (2), 206–210. doi:10.13225/j.cnki.jccs.2012.02.006
Lin, N., Li, W. D., Zhang, W. C., and Yang, J. J. (2014). Deformation prediction of deep foundation pit with least square support vector machine. J. Liaoning Tech. Univ. Nat. Sci. 33 (11), 1471–1474. doi:10.3969/j.issn.1008-0562.2014.11.007
Liu, J., Shi, C., Gong, C., Lei, M., Wang, Z., Peng, Z., et al. (2022). Investigation of ultimate bearing capacity of shield tunnel based on concrete damage model. Tunn. Undergr. Space Technol. 125, 104510. Article ID 104510. doi:10.1016/j.tust.2022.104510
Liu, X. Y., Cheng, S., and Liu, R. X. (2010). Modeling and simulation on Earth pressure control for shield tunnelling. J. China Coal Soc. 35 (4), 575–579. doi:10.13225/j.cnki.jccs.2010.04.033
Liu, X. Y., Shao, C., Ma, H. F., and Liu, R. (2011). Optimal Earth pressure balance control for shield tunneling based on LS-SVM and PSO. Automation Constr. 20 (4), 321–327. doi:10.1016/j.autcon.2010.11.002
Liu, X. Y., Xu, S., Zhang, K. J., and Cao, Y. M. (2018). Optimization control for soil pressure balance of shield based on heuristic dynamic programming. J. Dalian Univ. Technol. 58 (5), 526–532. doi:10.7511/dllgxb201805013
Lu, P., Yuan, D., Jin, D., Luo, W., and Liu, M. (2022). Centrifugal model tests on the structural response of the shield tunnel when constructing cross passages by mechanical methods. Tunn. Undergr. Space Technol. 128, 104621. Article ID 104621. doi:10.1016/j.tust.2022.104621
Lyu, H. M., Shen, S. L., Zhou, A., and Yin, Z. Y. (2022). Assessment of safety status of shield tunnelling using operational parameters with enhanced SPA. Tunn. Undergr. Space Technol. 123, 104428. Article ID 104428. doi:10.1016/j.tust.2022.104428
Pan, H., Tong, L., Wang, Z., and Yang, T. (2022). Effects of deep soil mixing on existing shield tunnels in soft soil ground. Undergr. Space 7 (4), 724–733. doi:10.1016/j.undsp.2021.12.004
Sekiya, H., Masuda, K., Nagakura, S., and Inuzuka, S. (2022). Determination of shield tunnel deformation under train load using MEMS accelerometers. Tunn. Undergr. Space Technol. 126, 104535. Article ID 104535. doi:10.1016/j.tust.2022.104535
Shangguan, Z. C. (2011). Mechanism model and experimental investigation of chamber Pressure control for earth pressure balance shield. Dalian: Dalian University of Technology, 19–30.
Shen, Y., Ling, J., Wang, W., Zhu, H., and Yan, Z. (2022). 3D numerical investigation on response of shield tunnel under combined effects of fire and structural loading. Tunn. Undergr. Space Technol. 128, 104659. Article ID 104659. doi:10.1016/j.tust.2022.104659
Shi, H., Gong, G. F., Yang, H. Y., and Su, J. X. (2008). Control model of Earth pressure balance for shield tunnelling. J. China Coal Soc. 33 (3), 343–346. doi:10.3321/j.issn:0253-9993.2008.03.024
Wang, F., Gou, B. C., and Qin, Y. W. (2013). Modeling tunneling-induced ground surface settlement development using a wavelet smooth relevance vector machine. Comput. Geotechnics 54, 125–132. doi:10.1016/j.compgeo.2013.07.004
Wang, S., Wang, Y., Lin, Z., Song, Z., Wang, X., and Peng, X. (2022a). Analysis of the influence of the thickness insufficiency in secondary lining on the mechanical properties of double-layer lining of shield tunnel. Eng. Fail. Anal. 141, 106663. Article ID 106663. doi:10.1016/j.engfailanal.2022.106663
Wang, S., Zhou, Z., Liu, P., Yang, Z., Pan, Q., and Chen, W. (2022b). On the critical particle size of soil with clogging potential in shield tunneling. J. Rock Mech. Geotechnical Eng. Available online 11 June 2022. doi:10.1016/j.jrmge.2022.05.010
Wei, X. J., Wang, F. Y., and Ding, Z. (2017). Analysis of torque of shield cutter head and its influence on surface deformation in soft soil region. J. Cent. South Univ. Sci. Technol. 49, 1491–1497. doi:10.11817/j.issn.1672-7207.2018.06.023
Wu, T., Gao, Y., and Zhou, Y. (2022). Application of a novel grouting material for prereinforcement of shield tunnelling adjacent to existing piles in a soft soil area. Tunn. Undergr. Space Technol. 128, 104646. Article ID 104646. doi:10.1016/j.tust.2022.104646
Yang, Y., Tan, Z. S., Peng, B., Li, J. P., and Wang, G. (2017). Study on optimization boring parameters of Earth pressure balance shield in water-soaked round gravel strata. China Civ. Eng. J. 50 (S1), 94–98. doi:10.15951/j.tmgcxb.2017.s1.017
Yu, H. J., Mooney, M., and Bezuijen, A. (2020). A simplified excavation chamber pressure model for EPBM tunneling. Tunn. Undergr. Space Technol. 103, 103457. Article ID 103457. doi:10.1016/j.tust.2020.103457
Zhang, S., Cheng, X., Qi, L., and Zhou, X. (2022). Face stability analysis of large diameter shield tunnel in soft clay considering high water pressure seepage. Ocean. Eng. 253, 111283. Article ID 111283. doi:10.1016/j.oceaneng.2022.111283
Zhao, B. J., Zhou, J. J., Tan, Z. S., and Li, T. (2017). Variation of shield boring parameters and correlation analysis in mixed ground. Chin. Civ. Eng. J. 50 (S1), 140–144. doi:10.15951/j.tmgcxb.2017.s1.025
Zhou, C. Z., Yang, J. S., and Mou, Y. T. (2015). BP Neural network prediction method for ground surface settlement caused by shield tunneling in soft layer down laid on hard layer in Nanchang. J. Disaster Prev. Mitig. Eng. 35 (4), 556. doi:10.13409/j.cnki.jdpme.2015.04.023
Keywords: sandy cobble stratum, weathered quartzite and granite, grade V surrounding rock, earth pressure balance shield, in chamber earth pressure, grey least square support vector machine, particle swarm optimization, genetic algorithm
Citation: Wang M, Zhao D, Lv Y, Wang W and Wang X (2023) Prediction method of shield tunneling parameters in pebble stratum formed by weathered granite and quartzite. Front. Earth Sci. 10:1069924. doi: 10.3389/feart.2022.1069924
Received: 14 October 2022; Accepted: 07 November 2022;
Published: 18 January 2023.
Edited by:
Hongtu Zhang, Henan Polytechnic University, ChinaReviewed by:
Tong Yang, China University of Mining and Technology, Beijing, ChinaBotao Li, Xi’an University of Science and Technology, China
Weiyong Lu, Luliang University, China
Copyright © 2023 Wang, Zhao, Lv, Wang and Wang. This is an open-access article distributed under the terms of the Creative Commons Attribution License (CC BY). The use, distribution or reproduction in other forums is permitted, provided the original author(s) and the copyright owner(s) are credited and that the original publication in this journal is cited, in accordance with accepted academic practice. No use, distribution or reproduction is permitted which does not comply with these terms.
*Correspondence: Wei Wang, MDIxNTA1MUBjY2l0LmVkdS5jbg==