 Shuai Zhang
 Runhai Yang1*
- 1Kunming Earthquake Prediction Research Institute, Yunnan Earthquake Agency, Kunming, Yunnan, China
- 2Department of Earth and Space Sciences, Southern University of Science and Technology, Shenzhen, Guangzhou, China
Prospective discrimination of rock instability and fracture is a key problem in mining, slope stability, earthquake triggering, and other research fields. Through the rock fracture experiment, scientists put forward the load unload response ratio (referred to as LURR) to detect the non-linear deformation process of the strain stress curve, judge the degree of rock damage and instability fracture, which is accepted worldwide and has been widely used in seismic risk assessment. But, the extraction of response parameters (including strain, energy, well water level, etc.) are faced with many difficulties in actual observation, which makes the application of results uncertain. In this paper, the change of relative wave velocity is proposed as the loading unloading response parameter. Through rock mechanics experiments, a prospective discrimination method of rock instability and fracture process is constructed. The change characteristics of the LURR in the process of rock instability and fracture under stress are studied, the experiment result show that: when approaching the main fracture, the LURR calculated by taking the transverse strain energy as the response quantity obviously rises and fall back, the acoustic emission energy release rate and event rate are close to exponential acceleration process; The LURR by taking the change of relative wave velocity as the response parameter, first decreases, then fluctuates near zero, and rapidly decreases to below zero when it reaches the critical failure. The change combination of the above parameters’ response ratio can effectively judge the process of rock deformation, instability and fracture under stress. Moreover, this study of the load unload response ratio which takes the change of relative wave velocity as the response parameter, makes up the deficiency of the traditional load unload response ratio method in judging the rock instability of the medium under stress.
1 Introduction
Study on the process of rock instability and fracture is the core content of rock mechanic. Reveal the evolution process of rock instability and fracture is of great significance to the prediction of dynamic disasters of rock mass, such as: earthquake mechanism, stability of roadway engineering, mining and slope instability. In order to reveal the seismic physical process, many scholars have carried out a large number of experimental studies on rock instability by using different observation measures and different observation conditions, exploring the process of rock instability and fracture under different loading modes, many results of predicting the precursor characteristics of rock instability and fracture have been obtained (Ma et al., 2019; Kwiatek G et al., 2014; Yamashita F et al., 2021; Ma et al., 2022a; Ma et al., 2022b; Li and Ma, 2021; Chen et al., 2009; Lei et al., 2000).
However, the preparation process of the rock instability and fracture is extremely complicated, but its physical essence lies in the deformation, instability and fracture process of the medium. Just because the rock instability prediction is extremely complicated and difficult, it is necessary to vigorously look for physical parameters that can essentially reflect the instability process. At the same time, it must be physically related to the local instability and rupture of the medium (Yin et al., 1994; Yin et al., 1995). The theory of loading and unloading response ratio that can quantitatively describe the damage degree and instability failure of rock, and is often used to detect the deformation stage before the peak value of strain stress curve (Yin, 1987). Yin et al. (2004) and Wang (1998) tested a large number of earthquake cases on the variation law of loading and unloading response ratio before moderate earthquakes, and the results showed that more than 80% of the earthquake cases had loading and unloading response ratios significantly greater than 1 before earthquakes, so it can be applied to earthquake prediction (Liu et al., 2012). With the development of more than 30 years, it has been widely used in the field of earthquake prediction. Many scholars use different geophysical parameters as responses, and have carried out a large number of experimental studies at different scales, including physical mechanism, experimental studies, numerical simulation and earthquake prediction practice (Yu, 2004; Yu et al., 2006; Yu et al., 2010; Yin et al., 2013; Yin et al., 2002; Zhang H et al., 2005a; Zhang W et al., 2006a; Zhang Y et al., 2006b), and made a series of progress. Experiments and numerical simulations also confirm the correctness of the theory of loading-unloading response ratio (Yin et al., 1995; Zhang et al., 2013). But, in the actual field observation, it is difficult to measure the stress and strain of the block, so it is equally difficult to measure the deformation modulus during loading and unloading (Yin et al., 2017). The response change based on magnitude energy depends heavily on seismic activity, and many earthquake source faults are locked for a long time, so it is impossible to obtain the relevant response from seismic activity itself (Lei and Wang, 2022). Moreover, the response based on other geophysical parameters (water level, temperature, etc.) is limited by the scale of observation and the density of observation points, so it is difficult to apply it to field regional scale observation.
Therefore, it is an important research direction to develop the loading/unloading response ratio method with the wave velocity change rate as the response. Considering the impenetrability of the Earth’s interior and the observation problem of regional scale. Because, among the information parameters of seismic waves, the seismic wave velocity is the most accurate and reliable parameter, the measurement method is relatively mature. A large number of laboratory experiments show that the wave velocity of rocks will change with the change of stress (Birch, 1990; Nur et al., 1971). It increases with the increase of wave velocity pressure and is related to loading and unloading cycles (Yang and Shi, 2004). Therefore, the continuous and accurate measurement of wave velocity can be used as a “stress meter” to reflect the state change of stress field in underground media. After years of development, the observation method based on wave velocity measurement has been preliminarily applied and developed in the laboratory ultrasonic scale observation research (Yang et al., 2020; Song et al., 2012). Xie et al. (2017) even obtained the observation accuracy of relative wave velocity change as high as 10–6 by using the observation method of coda interference. Moreover, more importantly, it can be used to monitor the change of medium wave velocity at field scale. For example, the air gun seismic source detection technology in land water has the characteristics of environmental protection, high repeatability, etc. It can spread hundreds of kilometers through superposition, and the measurement accuracy of relative wave velocity change is 10–4∼10–3. It can observe diurnal and semidiurnal changes caused by atmospheric pressure or solid tide. This high-precision wave velocity measurement provides a reliable technical means for responding to the state and change of weak stress field in underground media (Wang et al., 2016).
Based on the active ultrasonic source, this paper carried out experimental research before and after rock fracture under cyclic loading. An important highlight of the paper is that developed the new LURR could make up for the lack of general LURR, and has theoretical significance for the study of earthquake prediction methods since instability of fault occurs after the peak point of strain-stress curve. At the same time, it is possible to use the wave velocity change under small stress disturbance to detect the stability of rock or engineering structure in the future, which shows a potential engineering significance of the results of this paper.
2 Experiment introduction
2.1 Experimental system
The system includes: loading and unloading operation system, signal excitation system, acoustic emission waveform acquisition system and strain acquisition system as shown in Figure 1. In the experiment, CTM microcomputer servo-controlled hydraulic universal testing machine of Institute of Geology, Seismological Bureau of China was used, with a maximum loading capacity of 1000 kN. The signal generator continuously excited two sinusoidal signals (100 s/s) with an interval of 10 m, a transmission frequency of 100 KHz, a voltage of 2 Vpp and a preamplifier of 40 dB, which were amplified to 40 V by a power amplifier (Yang et al., 2020). The AE probe model is RS-2A, its frequency range is 50–400 KHz, and its center frequency is 150 KHz. The AE waveform acquisition system with 16 AE probes is used for recording. The AD conversion resolution is 16 Bit, the sampling frequency is 3MHz, and the sampling frequency of LB-V multi-channel digital strain gauge is 100 Hz.
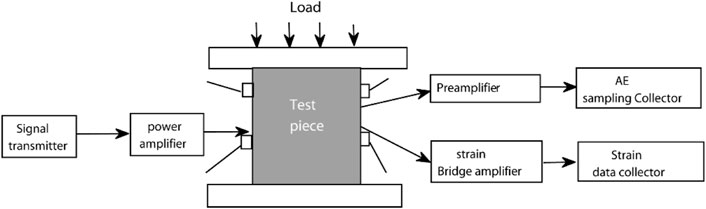
FIGURE 1. Schematic diagram of experimental system.
Before loading, the clocks of the press operating system, acoustic emission data acquisition and strain observation system should be networked and synchronized to avoid the clock error affecting the calculation accuracy of the subsequent wave velocity change. The signal generator continuously excites two sinusoidal signals, which are amplified to 40Vpp by a power amplifier. The received signals are recorded in a 16-bit precision data collector at a sampling rate of 3 m/s, and the time length of the received waveform is 10 m. Each probe has 969 s continuous seismic records, and there are 3 million sampling points in 1s data. In this paper, the data is processed according to the data format with a time resolution of 1 s.
2.2 Sample and observation system
Granite samples with pre-cracks are used in the experiment. The sample size is 99.48 mm × 98.04 mm × 146.50 mm, as shown in Figure 2. The physical and mechanical properties of marble materials are as follows: compressive strength is 162 MPa, Young’s modulus is 72.7 GMa, Poisson’s ratio is 0.21, p-wave velocity is 5 km/s. The specimen is oblique cut in echelon in 45° axial direction, and macro fault zone is prefabricated for rock specimen by mechanical cutting method to simulate the geometric structure of tensile echelon fault. The cutting tool is a high-speed electric cutting machine. The upper fault is about 5.3 cm, and the lower fault is about 5.0 cm, all of which are cut through. The wheel blade of the cutting machine is an ultra-thin diamond saw blade. The width of the fault zone is about 3 mm and the depth of the fault zone is about 42 mm. The prepared sample is mixed with 1:1 gypsum and water and then filled into the crack to simulate the fault zone with low strength. It is placed for 24 h for the test after solidification. The test rock samples are processed according to the international rock mechanics test method.
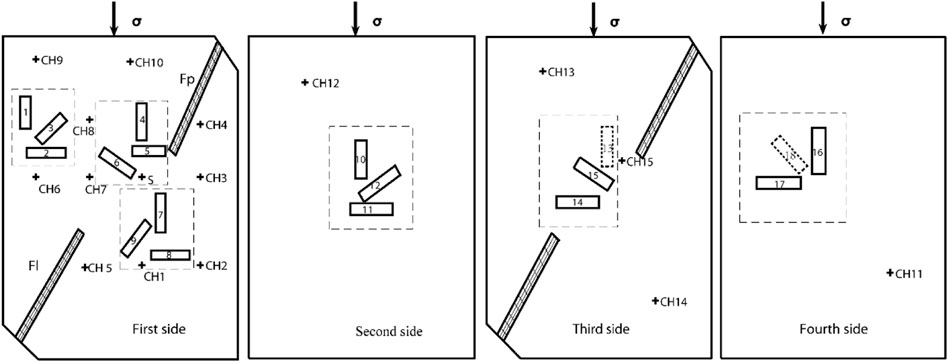
FIGURE 2. Sample model and observation system.
The experimental system consists of 13 piezoelectric ceramic sensors (AE probe CH3-CH16) and one excitation probe (S) to excite ultrasonic waves. Piezoelectric ceramic sensors (14 AE probes in total, as shown in Figure 2) are installed on the rock samples. Nine red five-pointed probes are distributed on the first surface, one purple five-pointed probe is distributed on the second surface, three black five-pointed probes are distributed on the third surface, and one green five-pointed probe is distributed on the fourth surface. The center dot S is the position of the excitation probe. Before installation, wipe the contact surface between the probe and the rock with paper towel dipped in absolute ethanol to remove the dust on the sample surface. Apply honey evenly on the contact surface of the probe with the rock to ensure the coupling. The active excitation system is excited by double-pulse sine wave, and the acoustic emission data acquisition system is used to continuously record the active excitation ultrasonic wave and acoustic emission waveform. At the same time, six groups of strain gauges are deployed on the four surfaces of the rock sample, and each group includes longitudinal, transverse and oblique strain records. The strain data acquisition system is used to record the strain, and the whole process of rock failure is recorded by strain gauges.
2.3 Experimental process
The rock pattern is fixed on the servo-controlled hydraulic universal testing machine, and the loading system is used for cyclic loading and unloading at the loading speed of 2 kn/s and the unloading speed of−2 kn/s. As shown in Figure 3, there are eight stages of cyclic loading and unloading, with each loading lasting about 80 s (the first loading lasting 100 s) and unloading lasting about 40 s. The whole cycle loading time lasts for 960 s. According to the empirical formula (p=F/S), in the first stage, the stress drops by 20.5 MPa in the loading section and 8 MPa in the unloading section. And the stress drops in the subsequent loading and unloading sections (2–7) are 16.4 and 8.2 MPa respectively. This loading method can simulate the effect of the tidal force of the Sun and the Moon, and the correlation of its response can be used as the response of the loading and unloading stages, respectively, and the sample reaches shear failure in the last stage of (∼78 MPa) loading.
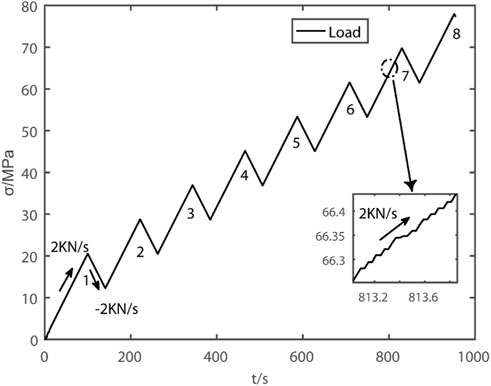
FIGURE 3. Loading and unloading curve.
3 Theory and results
3.1 Loading and unloading response ratio theory
The theory of loading and unloading response ratio describes the evolution process of earthquakes with the Y value of loading and unloading response ratio in source areas, and the Y value can quantitatively measure the source process of the medium in source areas to a certain extent, so it is possible to predict earthquakes (Mora et al., 2002).
The theoretical principle is as follows: Assuming that the system is loaded and unloaded,
In Eq. 1: E represents seismic energy, and “+”and “-”represent loading and unloading, respectively (Liu and Yin, 2013). M is a constant between 0 and 1. When m=1, it means energy, m=1/2, it means energy Benioff strain, and m=1/3 or 2/3, it means the line scale and plane scale of the source area. M=0 indicates the earthquake frequency.
3.2 Strain energy response results
The stress-strain relationship (curve) shows the whole process of rock failure, as shown in Figure 4. At the initial stage of rock loading, the cracks in the rock closed elastically, and the strain curve showed strong consistency with the stress loading and unloading curve, and the strain increased linearly with the stress. When the extreme stress reaches ∼65 MPa, the main crack occurs, and the strain gauge 5 records the occurrence time of the main crack to ∼810 s, and the main crack occurs near the bottom area of the precast crack Fp, which is mainly because the sensitivity of axial stiffness to crack initiation and penetration is weaker than the non-linear lateral deformation (Zhang et al., 2017), and the stress accumulation of the precast crack structure is concentrated and the brittleness is weak. At the same time, the rock cracks spread unsteadily along the transverse direction, and the strain curve suddenly changes abnormally, and the deformation is large, which indicates that the occurrence time of the main rock fracture can be defined at this time.
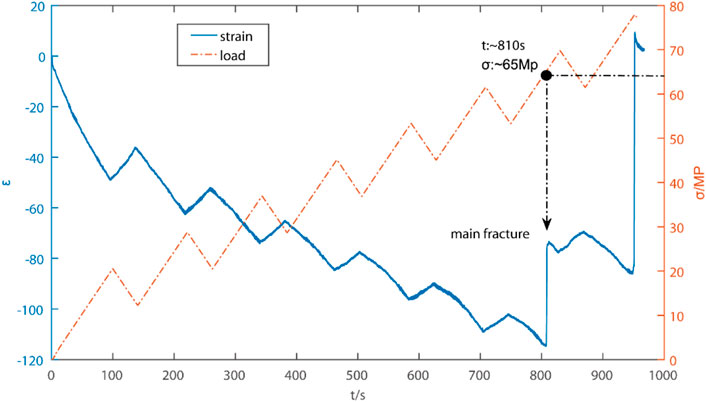
FIGURE 4. Strain-stress curve.
Although the loading and unloading time in this paper is different, when the response quantity takes the average strain energy of each loading and unloading interval, it accords with the loading and unloading theory (Yin, 2004; Wang et al., 2004). Firstly, taking the strain energy as the response quantity, the Y value of the loading and unloading ratio response in all directions is calculated. As shown in Figures 5A–C. It is found that the loading and unloading curves basically coincide with the strain curves in the low stress stage, especially in the elastic stage, so the Y value of the loading and unloading response ratio is approximately 1. However, as the extreme stress approaches, more strain energy will be converted into permanent deformation of rock every time it is unloaded. Moreover, this change is getting bigger and bigger. Therefore, with approaching the extreme stress, before the main fracture occurs, the loading and unloading response ratios of strain gauges 5 and 14 near the rock bridge area are obviously inconsistent, and the values of the loading and unloading response ratios are obviously increased and decreased, indicating that the initiation and penetration of rock cracks mainly extend along the vertical axis. At the same time, the time series of the loading and unloading response ratio of the rock increased obviously before it became unstable, and the loading and unloading response ratio was abnormal. Before the rock was fundamentally damaged, the loading and unloading response ratio in many directions showed synchronous response.
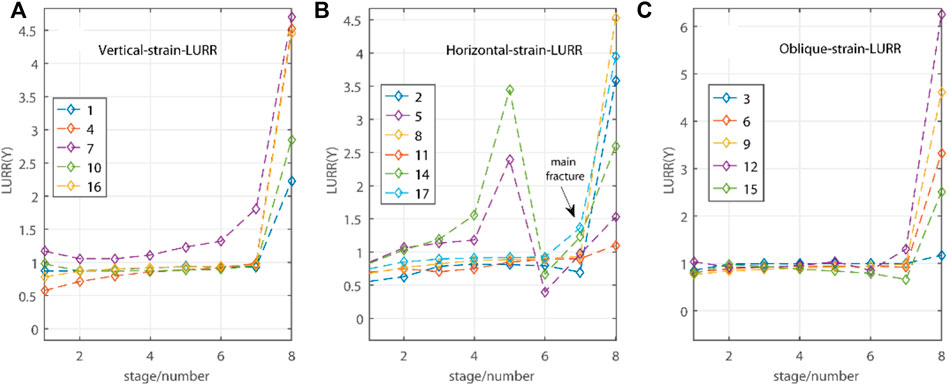
FIGURE 5. Load unload response ratio of strain energy in three directions (A–C).
3.3 Acoustic emission response results
Studying the evolution law of acoustic emission activities can characterize the whole process of rock damage and instability. Acoustic emission testing is a method to study the evolution process of rock damage from meso-fracture scale (Zhang H et al., 2005b). During the test process, the micro-fracture signal inside the rock was recorded by acoustic emission monitoring system, and the variation law of acoustic emission characteristic parameters was obtained by post-processing. The records of acoustic emission event release rate and acoustic emission energy release rate in the experimental process are shown in Figures 6A, B. The results show that in the initial loading stage, there are very few acoustic emission events in the rock, and only a few acoustic emission events occur when the stress reaches about 10 MPa. At this time, acoustic emission phenomena occur at intervals, and the event rate and energy release rate are low. When the stress exceeds 28 MPa, the AE event rate gradually increases, but it is far less than that near the peak value. The AE events generated at this time are mostly due to the collision and friction between particles radiating elastic waves during the initial micro-crack closing process under external load. When the stress increases to 40 MPa, the AE event rate increases rapidly, and the first peak appears. Here, the stress is regarded as the crack initiation stress, and the AE event propagation rate gradually increases linearly. At this time, the crack is still in a stable propagation stage. When the stress reaches 60 MPa, the main fracture occurs, and the AE event rate increases non-linearly. At this time, the AE event rate has developed rapidly at a certain rate.
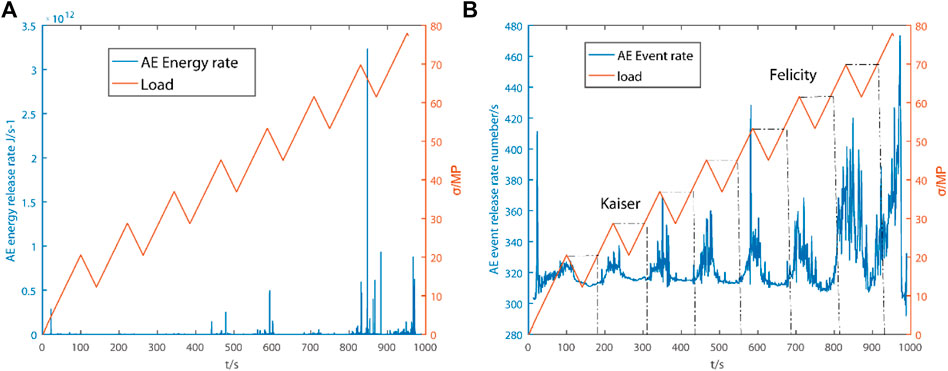
FIGURE 6. AE energy release rate (A) and event release rate (B).
When rock is subjected to repeated loading and unloading experiments, only when the load reaches the previous maximum load will obvious acoustic emission occur. This “memory” phenomenon of materials is called Kaiser effect (Kaiser, 1950). The loading and unloading stages in this paper meet Kaiser effect law from 1 to 4. Subsequently, the Kaiser effect was also confirmed in the compression experiments of sandstone and quartzite (Goodman, 1963). The discovery of Kaiser effect provides a new method to solve the problem of medium damage estimation in rock mechanics. However, when there is damage inside the rock, when the load is less than the highest stress level experienced in the previous period, the acoustic emission begins to increase significantly. This phenomenon is called Felicity effect (Fowler, 1986), as shown in Figures 6A, B. Felicity effect appears in the acoustic emission activity in the 5–8 stages, which indicates that with the continuous accumulation of stress, the rock has been damaged, and the acoustic emission activity has obviously intensified.
The energy of acoustic emission events recorded in the experiment reflects the elastic energy released when microcracks in rocks are generated or expanded. Therefore, by analyzing the acoustic emission energy, we can study the evolution law of elastic energy release of rocks. Let the energy of acoustic emission events recorded in the time
Where:
As shown in Figure 7, the energy release law of acoustic emission and the cumulative law of acoustic emission events are in good agreement with the cumulative law of the number of events. At the initial loading stage, the energy release of acoustic emission in rock is relatively stable, and the closer the energy release is to the linear process, the energy release does not obviously accelerate. When the time reaches about 400 s, the release degree of acoustic emission energy is obviously enhanced, and the inside of the rock changes dramatically. The inside of the rock is in the process of initial microcracks closing under external load, and the mutual collision and friction between particles are intensified. When the time reaches about 810 s, the rock is in a high stress state, and the main rock fracture occurs, and the AE energy release is closer to the exponential acceleration process. The changes of the above acoustic emission characteristic parameters are directly related to the development and evolution of the internal damage of rocks, and the sudden increase of energy and events can be used as precursors of the catastrophic failure of rocks.
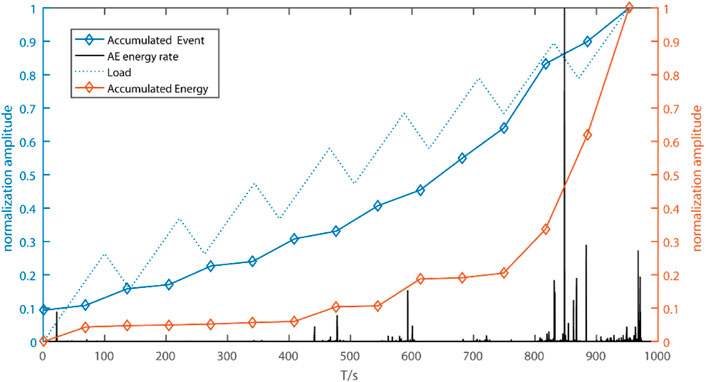
FIGURE 7. Acoustic emission energy release and cumulative event rate.
Meanwhile, according to the loading and unloading theory, any geophysical quantity that can reflect the instability process of the system can be taken as the response quantity (Yin et al., 2013). In seismology, the energy E of seismic waves and its related quantities are often used as response quantities, because they can directly carry the media information of the source area. In the experiment, a large number of acoustic emission events were recorded during loading and unloading. According to Eq. 1, take m =1, that is, use energy as the response, and get the change of Y value of loading and unloading response ratio with time, as shown in Figure 8.
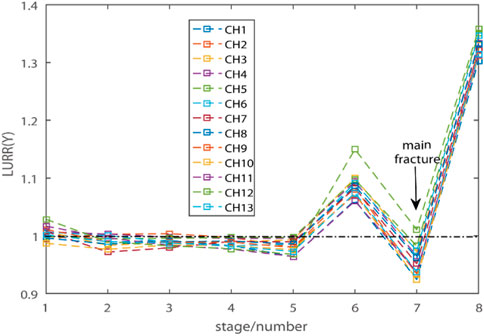
FIGURE 8. change of energy loading and unloading response ratio.
From the experimental results, the loading and unloading response ratios of all channels reflect basically the same law, that is, when the load level is low and the damage degree of rock is small, the value of loading and unloading response ratio Y fluctuates around 1, and the rock is relatively stable. When the load level is high and close to the critical load of main fracture, the value of loading and unloading response ratio Y increases briefly, and the damage degree of rock is large. Then, the value of loading and unloading response ratio Y decreased briefly, and the main rupture occurred during the decline of loading and unloading response ratio. When the critical load is reached or exceeded, and before the rock is fundamentally damaged, the degree of rock damage is greater, and the value of the loading and unloading response ratio Y will increase sharply. The above experimental results are consistent with the discussion on the relationship between material failure, earthquake occurrence and critical sensitivity in statistical meso-damage mechanics (Bai et al., 2004; Zhang et al., 2004). At the same time, these results also show that the loading and unloading response ratio Y can be used as an important precursor to reflect rock instability and earthquake occurrence.
3.4 LURR based on wave velocity change
3.4.1 Principle of methods
According to the theory of loading and unloading response ratio, it can be known that the loading and unloading response ratio Y is a parameter that can quantitatively reflect the approaching instability degree of non-linear system, and it can be defined as
Equation 4:
Equation 5:
The accuracy of wave velocity measurement is the key to construct the loading and unloading response observation method with the relative wave velocity change as the response quantity, and the high-precision wave velocity measurement results can better respond to the stress state and change in the rock medium (Wang et al., 2020). Assuming that the time delay is caused by the relative velocity that changes uniformly in space, the relative wave velocity change in the medium can be expressed as:
In Eq. 6, v represents the wave velocity in the medium, dv represents the wave velocity change in the medium, dt represents the arrival time difference of some coda windows, and t represents the arrival time difference. By measuring the linear change relationship of the arrival time difference with time at different times, the wave velocity change in the medium can be obtained. The specific steps are as follows:
Assuming that the ultrasonic coda signal received by the probe is sum before and after, two active ultrasonic coda excitations are
When a certain value
The waveform analysis
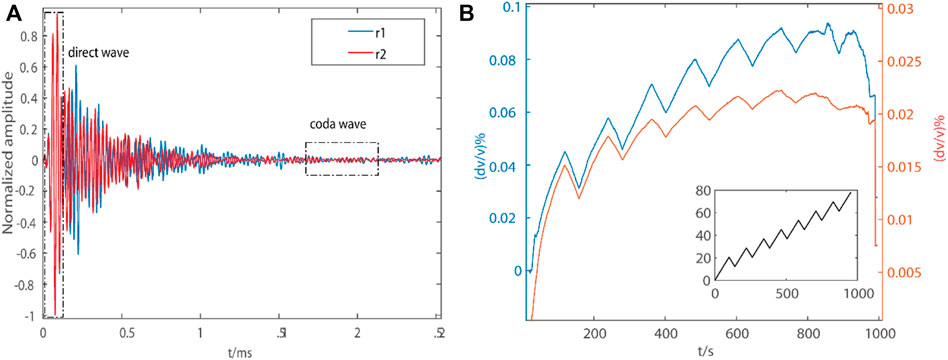
FIGURE 9. measurement window (A) and change of average relative wave velocity (B).
Through the wave velocity measurement method, the average direct wave velocity and the relative variation of the wake wave velocity of 13 AE sensors are obtained as shown in Figure 9B. It is found that the two wave velocity curves are in good agreement with the loading curve, and the relative change of the direct wave velocity is obviously higher than that of the coda wave. As the stress increases, the increase of relative wave velocity decreases. After the main rupture, the wave velocity decreased obviously, but the decrease was small. When the critical load is reached, the change of relative wave velocity decreases in a cliff-like way.
3.4.2 Calculation results
The least square method (LSQ) is used to fit the K value. As shown in Figures 10A–H. The calculation results of the K value of the relationship between the relative wave velocity change and the stress quantitative change show that there is a high linear relationship in the initial stage of loading. The wave velocity increases with the increase of stress. The relative wave velocity change rate decreases with the increase of stress (K value), and the K+ value of the loading interval is slightly higher than the K- value of unloading, as shown in Table 1. As the stress increases, new cracks are generated in the rock, and the damage degree increases. When unloading, some cracks open with the stress decreasing, which leads to the wave velocity in the unloading process being smaller than that in the loading process. When the stress reaches ∼50 MPa, the rock is damaged, and the change of K value in each loading and unloading interval is obviously inconsistent. A large number of cracks enter the compaction stage, and the wave velocity during unloading is larger than that during loading, and the K value during loading is lower than that during unloading. With the continuous loading of the stress, the increase of the wave velocity began to decrease from ∼68 MPa, and the variation trend of the average wave velocity curve was inconsistent with that of the stress curve, showing a discrete stage deviating from linearity. This is mainly because after loading to the damage stress, the microcracks continue to increase, the microcracks gradually penetrate, and the expansion of rock samples accelerates, which leads to the rapid decline of wave velocity and amplitude. This feature can be regarded as a sign of approaching the main fracture. So, the change of wave velocity during repeated loading can be used as an evaluation method of rock damage.
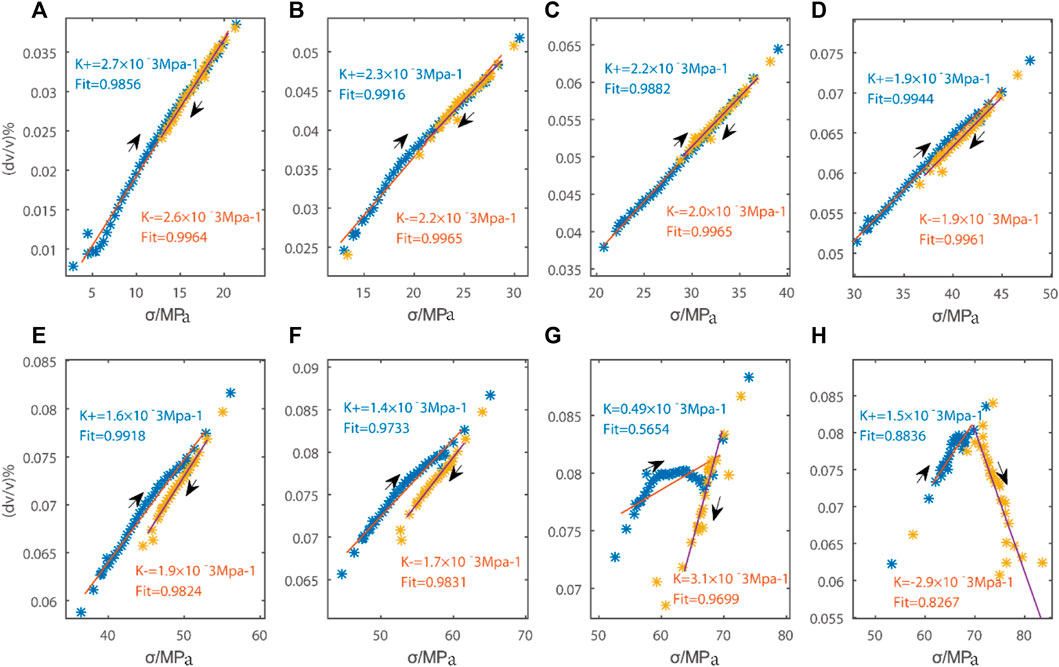
FIGURE 10. Rate of change of direct wave velocity in each loading and unloading stage (A–H).
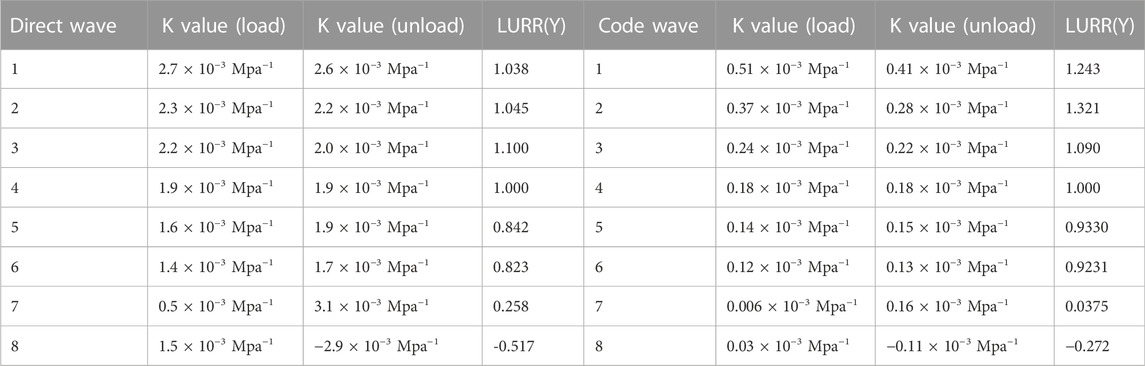
TABLE 1. Parameter changes at different stages.
As shown in Figures 11A–H, the calculation result of the K value of the quantitative relationship between the relative wave velocity change of the wake wave and the stress shows that the curve is highly consistent with that of the direct wave. But there are some differences between them. In the initial loading elastic stage, due to the compression closure of the initial micro-cracks, the wave velocity increases with the increase of stress, but the increasing amplitude gradually decreases. This is because with the increase of stress, the closing degree of the initial micro-cracks gradually increases, and the closing degree of the micro-cracks decreases under the same stress increment, which leads to the decrease of the increasing amplitude of the wave velocity. When the crack closing stress reaches ∼60 MPa, the relative wave velocity basically reaches the peak, and the relative wave velocity changes by 2.3%. The increase of wave velocity decreases significantly faster than the direct wave, mainly because the coda wave is more sensitive to the change of the medium after multiple reflections and refractions in the medium. Moreover, it can also be observed from Figure 7 in this paper, the acoustic emission events at this stage begin to increase and the energy release intensifies. It can be seen that in a certain period of time, the fault has been in an unstable stage. Compared with the wave velocity change in the initial stage, the wave velocity change of rock medium is obviously abnormal at this stage, and the relationship between the wave velocity change and the stress change is obviously deviated from the non-linear state. With the continuous accumulation of stress and reaching the stress peak value of ∼70 MPa, the fault enters the sub-instability stage, at which time the observation accuracy can reach 2.9125 × 10⁻⁸, and the wave velocity change suddenly drops. The wave velocity change curve and the stress loading curve show a linear negative correlation, that is, when loading, the wave velocity change decreases, indicating that they are in a strongly discrete non-linear state. At this time, the value of k is −2.9 × 10⁻³ Mpa–1, which means that the change of relative wave velocity at this time shows a cliff-like decline with the increase of stress.
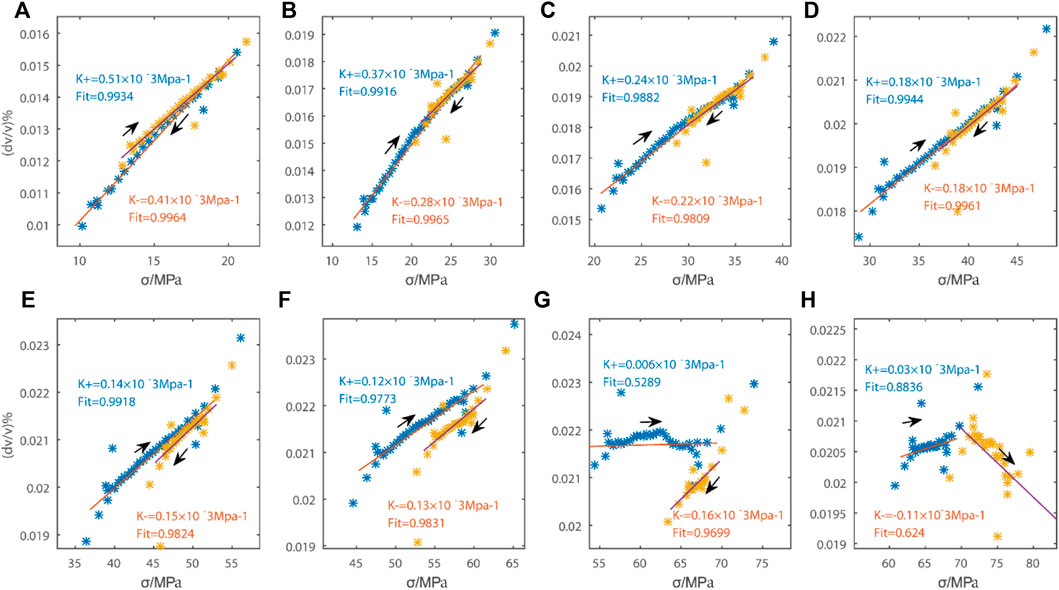
FIGURE 11. Change rate of coda wave velocity in each loading and unloading stage (A–H).
According to Figure 12A of the relationship between average wave velocity change and stress, it is observed that in the elastic stage, the wave velocity change and stress can keep a good linear relationship, and the accumulation and release of stress are relatively stable. In the damage stage, the relationship between stress and relative wave velocity is in a non-linear state before the main fracture occurs and the internal damage of rock occurs. In the stage of rock instability, the stress is negatively correlated with the change of relative wave velocity, that is, when the stress increases, the wave velocity decreases in a cliff-like manner, which reflects the drastic changes in the medium at the later stage of loading, which can be used as an important precursor before rock fracture.
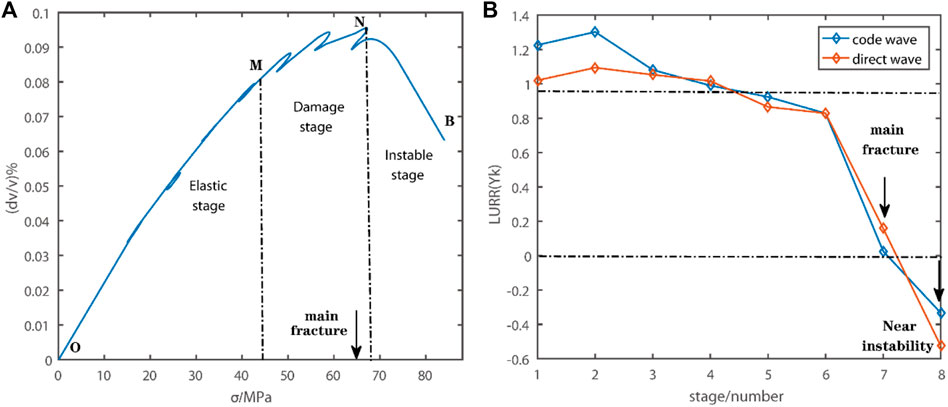
FIGURE 12. Relationship between relative wave velocity change and stress (A) and LURR of direct wave and coda wave (B).
According to the loading and unloading theory and the theoretical formula with relative wave velocity as the response, the loading and unloading response ratios of the two wave velocities are calculated respectively. Figure 12B shows the changes of LURR with the relative wave velocity changes of the direct wave and the code wave as the response during the rupture incubation process. In the initial stage, the response ratio of loading and unloading is close to 1. As the main rupture approaches, the corresponding ratio of loading and unloading fluctuates around zero, and decreases rapidly and becomes negative, then the main rupture comes. The results show that when the rock approaches the main fracture, the response ratio of loading and unloading decreases sharply, and then there is a minimum value, and even a negative value when the rock is unstable, the result is more consistent with the loading and unloading obtained in response to the P-wave travel time in the process of rock fracture preparation (Xu et al., 2002). Therefore, this feature can be regarded as a sign of rock near instability fracture.
4 Discussion
Whether the response ratio is negative or not is related to the stress state at the lowest point of the stress cycle after the peak value. The degree of bearing capacity reduction or energy release. The stress at the lowest point is larger, and its response wave velocity variation is larger than the wave velocity variation corresponding to the highest stress. When the bearing capacity decreases or the energy release exceeds the energy reduced by external force unloading, the response ratio will be negative. When the stress at the lowest point is smaller, the response wave velocity variation is smaller than the wave velocity variation corresponding to the highest stress, the bearing capacity decreases or the energy release is less than the energy reduced by external force unloading, then the response ratio may not be negative, but it may be the smallest. Therefore, the minimum value (even negative value) after the rapid decrease of loading and unloading response ratio can be used as a sign of approaching instability and rupture.
5 Conclusion
The experimental study of rock instability and fracture under cyclic loading was carried out, and the following conclusions were obtained:
When the cyclic loading reaches the 7th stage, the loading time reaches ∼810 s, and the stress reaches ∼65 MPa, the main fracture occurs. The main fracture point is near the bottom area of Fp, which is mainly caused by the concentrated stress accumulation and weak brittleness in the pre-crack position. With the approach of main rupture, the response ratio of loading and unloading calculated by taking transverse strain energy as the response quantity increases and decreases obviously. Before the occurrence of main fracture, the rock is relatively stable, the value of loading and unloading response ratio Y fluctuates around 1. When the load level is high, close to the critical load of the main fracture, the Y value of the loading and unloading response ratio rises briefly and then falls back, the main fracture occurs during the falling of the loading and unloading response ratio. When the load level is high and exceeds the critical load, and before the rock is fundamentally failure, the value of the loading-unloading response ratio Y will increase sharply, the energy release of acoustic emission is closer to the exponential acceleration process. The sudden increase of energy/event can be used as a precursor to the catastrophic failure of rock. Based on the results of constructing the loading and unloading response ratio in response to the change of relative wave velocity, it is found that the corresponding loading and unloading ratio fluctuates around zero as the main rupture approaches. When the critical load (∼68 MPa) is reached, it decreases rapidly and becomes negative before the rock fundamentally failure, which is consistent with the change pattern of the wave velocity ratio in the process of fracture incubation. This feature can be regarded as a sign of approaching instability.
Data availability statement
The original contributions presented in the study are included in the article/supplementary material, further inquiries can be directed to the corresponding author.
Author contributions
SZ: Participation, conceptualization, data processing, writing—original, draft, visualization. RH: Methodology, participation, guide experiment, discussion. JQ: Participation, data processing. YZ: Participation, data processing. JZ: Discussion.
Funding
This study was Supported jointly by the Open Fund of the State Key Laboratory of Seismic Dynamics (LED 2016B06), the National Natural Science Foundation (41574059, 41174043, 42104060), Key Research and Development Plan of Yunnan Province (No. 202203AC100003), Sichuan Science and Technology Program (2020YJ0184), Innovation team of Yunnan earthquake agency for “research on earthquake mechanism and earthquake-generating environment”.
Acknowledgments
We sincerely thank the reviewers and the editor for providing useful comments and suggestions, which greatly improved the quality of this manuscript. Nan Song took part in the whole process of the experiment, and thanks Associate Professor Peixun Liu, Yanshuang Guo and Guoqiang Chen for their strong support and guidance during the implementation of the experiment.
Conflict of interest
The authors declare that the research was conducted in the absence of any commercial or financial relationships that could be construed as a potential conflict of interest.
Publisher’s note
All claims expressed in this article are solely those of the authors and do not necessarily represent those of their affiliated organizations, or those of the publisher, the editors and the reviewers. Any product that may be evaluated in this article, or claim that may be made by its manufacturer, is not guaranteed or endorsed by the publisher.
References
Bai, Y., Jia, Z., Zhang, X., Ke, F., and Xia, M. (2004). Long-range stress redistribution resulting from damage in heterogeneous media. Pure Appl. Geophys. 161 (9-10), 1841–1852. doi:10.1007/s00024-004-2535-0
Birch, F. (1990). The velocity of compressional waves in rocks to 10 kilobars:1. J. Geophys. Res. 65 (4), 1083–1102. doi:10.1029/JZ065i004p01083
Chen, S. Y., Liu, L. Q., Liu, P. X., Ma, J., and Chen, G. (2009). Theoretical and experimental study on relationship between stress strain and temperature variation. Sci. China (Ser D) 52 (11), 1825–1834. doi:10.1007/s11430-009-0183-z
Fowler, T. J. (1986). Experience with acoustic emission monitoring of chemical process industry vessels, in Proceedings of the Eight International Acoustic Emission Symposium, Tokyo: Progress AE III, 150–162.
Goodman, R. E. (1963). Subaudible noise during compression of rocks. Geol. Soc. Amer. Bull. 74 (3), 487. doi:10.1130/0016-7606(1963)74
Kaiser, J. (1950). An investigation into the occurrence of noises in tensile tests or a study of acoustic phenomena in tensile tests. Munich, Germany: Tech. Hosch.
Kwiatek, G., Goebel, T., and Dresen, G. (2014). Seismic moment tensor and b value variations over successive seismic cycles in laboratory stick-slip experiments. Geophys. Res. Lett. 41 (1), 5838–5846. doi:10.1002/2014GL060159
Lei, X., Kusunose, K., Rao, M., and Satoh, T. (2000). Quasi-static fault growth and cracking in homogeneous brittle rock under triaxial compression using acoustic emission monitoring. J. Geophys. Res. Solid Earth 105 (B3), 6127–6139. doi:10.1029/1999jb900385
Lei, X. L., and Wang, G. M. (2022). Is clustered seismicity an indicator of regional stress? Insights from earthquake sequences in yongning-luguhu faulted basin, southwest China. Earthq. Res. Adv. 2 (3), 100138. doi:10.1016/j.eqrea.2022.100138
Li, Q., Ma, D., Yandong, Z., Yong, L., and Yingjian, M. (2021).Insights into controlling factors of pore structure and hydraulic properties of broken rock mass in a geothermal reservoir. Lithosphere, 2022, 3887832. doi:10.2113/2022/3887832
Liu, Y., and Yin, X. C. (2013). A plate model for the damage of a crustal block induced by earthquake and the new definition for the load/unload response ratio. Earth Sci. Front. 20 (6), 067–072.
Liu, Y., Yin, X. C., Yuan, S., and Zhang, L. P. (2012). Exploration study of dimension analysis applying to earthquake prediction. Chin. J. Geophys. 55 (9), 3043–3050. doi:10.6038/j.issn.0001-5733.2012.09.022
Ma, D., Duan, H., Zhang, J., Liu, X., and Li, Z. (2022b). Numerical simulation of water-silt inrush hazard of fault rock: A three-phase flow model. Rock Mech. Rock Eng. 12, 5163–5182. doi:10.1007/s00603-022-02878-9
Ma, D., Duan, H., and Zhang, J. (2022a). Solid grain migration on hydraulic properties of fault rocks in underground mining tunnel: Radial seepage experiments and verification of permeability prediction. Tunn. Undergr. Space Technol. 126, 104525. doi:10.1016/j.tust.2022.104525
Ma, D., Wang, J., Cai, X., Ma, X., Zhang, J., Zhou, Z., et al. (2019). Effects of height/diameter ratio on failure and damage properties of granite under coupled bending and splitting deformation. Eng. Fract. Mech. 220, 106640. doi:10.1016/j.engfracmech.2019.106640
Mora, P., Wang, Y. C., Yin, X. C., and Place, D. (2002). Simulation of the load-unload response ratio and critical sensitivity in the lattice solid model. Pure Appl. Geophys. 159, 2525–2536. doi:10.1007/978-3-0348-8197-5_18
Nur, A. (1971). Effects of stress on velocity anisotropy in rocks with cracks. J. Geophys. Res. 76 (8), 2022–2034. doi:10.1029/JB076i008p02022
Song, L. L., Ge, H. K., Guo, Z. W., and Wang, X. Q. (2012). Experimental study of variation of media properties monitoring using multiple scattering waves. Chin. J. Rock Mech. Eng. 31 (04), 713–722. doi:10.3969/j.issn.1000-6915.2012.04.009
Wang, B. S., Li, X. B., Liu, Z. F., Yang, J., and Yang, R. H. (2016). The source and observation system of binchuan earthquake signal transmitting seismic station and its preliminary observation results. Earthq. Res. China 30 (3), 316–325.
Wang, B. S., Yang, W., Wang, W. T., Yang, J., Li, X., and Ye, B. (2020). Diurnal and semidiurnal P-and S-wave velocity changes measured using an air gun source. J. Geophys. Res. Solid Earth 125 (1). doi:10.1029/2019JB018218
Wang, Y. C., Mora, P., Yin, C., and David, P. (2004). Statistical tests of load-unload response ratio signals by lattice solid model: implication to tidal triggering and earthquake prediction. Pure Appl. Geophys. 161 (9-10), 1829–1839. doi:10.1007/s00024-004-2534-1
Wang, Y. C. (1998). The simulation of rock experiment on load/unload response ratio earthquake prediction. Earthq. Res. China 14 (02), 28–32. doi:10.1088/0256-307X/15/11/025
Xie, F., Ren, Y. Q., and Wang, B. S. (2017). Observation of stick-slips on a 1.5 m-long granite fault using ultrasonic coda waves. J. Geophys. 60 (04), 1470–1478. doi:10.ssss/j.issn.0001-5733.2017.4.019
Xu, Z. Y., Yang, R. H., Wang, B., Zhao, J. m., Wang, Y. y., and Mei, S. r. (2002). Physical meaning and prediction efficiency of the load/unload response ratio of rocks in strain-weakening phase before failure. Acta Seismol. Sin. 24 (1), 47–55. doi:10.1007/s11589-002-0046-6
Yamashita, F., Fukuyama, E., Xu, S., Kawakata, H., Mizoguchi, K., and Takizawa, S. (2021). Two end-member earthquake preparations illuminated by foreshock activity on a meter-scale laboratory fault. Nat. Commun. 12 (1), 4302–4311. doi:10.1038/s41467-021-24625-4
Yang, H. F., and Shi, X. J. (2004). Experimental research on wave velocity under axial pressure. Prog. Geophys. 19 (2), 481–485. doi:10.3969/j.issn.1004-2903.2004.02.043
Yang, H. M., Chen, S. Y., Liu, P. X., Guo, Y. S., Zhuo, Y. Q., and Qi, W. B. (2020). Exeperimental study on the changes of ultrasonic coda wave and acoustic emission during rock loading and deformation. Seismol. Geol. 42 (3), 715–731. doi:10.3969/j.issn.02534967.2020.03.012
Yin, X. C., Chen, X. Z., Song, Z. P., and Yin, C. (1995). A new approach to earthquake prediction-the load/unload response ratio (LURR) theory. Pure Appl. Geophys. 145 (3), 701–715. doi:10.1007/bf00879596
Yin, X. C., Chen, X. Z., Song, Z. P., and Yin, C. (1994). The load-unload response ratio theory and its application to earth-quake prediction. J. Earthq. Predict. Res. 3 (3), 325–333.
Yin, X. C., Chen, X. Z., Wang, Y. C., Bai, Y., and Wang, H. (2000). Development of a new approach to earthquake prediction: Load/Unload Response Ratio(LURR) theory. Pure Appl. Geophys. 1 57 (11-12), 2365–2383. doi:10.1007/PL00001088
Yin, X. C., Liu, Y., Mora, P., Yuan, S., and Zhang, L. p. (2013). New progress in LURR: Integrating with the dimensional method. Pure Appl. Geophys. 170 (1), 229–236. doi:10.1007/s00024-012-0453-0
Yin, X. C., Liu, Y., Zhang, L. P., Li, W. J., Yuan, S., and Zhang, X. T. (2017). LURR anomaly, prediction and tracking of large earthquakes in the pan-southwestern region. Earthquake 37 (04), 37–49. doi:10.3969/j.issn.1000-3274.2017.04.004
Yin, X. C., Mora, P., Peng, K. Y. T., Wang, Y. C., and Weatherley, D. (2002). Load-unload response ratio and accelerating moment/energy release critical region scaling and earthquake prediction. Pure Appl. Geophys. 159 (10), 2511–2523. doi:10.1007/s00024-002-8745-4
Yin, X. C., Yu, H. Z., Kukshenko, V., Xu, Z. Y., Wu, Z., Li, M., et al. (2004). Load-unload response ratio (LURR), accelerating moment/energy release (AM/ER) and state vector saltation as precursors to failure of rock specimens. Pure Appl. Geophys. 161 (11-12). doi:10.1007/s00024-004-2572-8
Yu, H. Z., Cheng, J., and Wan, Y. G. (2010). Load-unload response ratio and stress accumulation model before large earthquake. Acta Seismol. Sin. 32 (5), 517–528. doi:10.3969/j.issn.0253-3782.2010.05.002
Yu, H. Z. (2004). Experimental research on pre-cursors of brittle heterogeneous media and earthquake prediction methods. Beijing, China: Institute of Mechanics, Chinese Academy of Science.
Yu, H. Z., Shen, Z. K., Wan, Y. G., Zhu, Q. Y., and Yin, X. c. (2006). Increasing critical sensitivity of the load/unload response Ratio before large earthquakes with identified stress accumulation pattern. Tectonophysics 428 (1-4), 87–94. doi:10.1016/j.tecto.2006.09.006
Zhang, G. K., Li, H. B., Xia, X., Chen, Q. Y., Liu, J. S., and Huang, Z. H. (2017). Experiment study on acoustic emission and wave propagation in granite under uniaxial compression. Chin. J. Rock Mech. Eng. 36 (05), 1133–1144. doi:10.13722/j.cnki.jrme.2017.0849
Zhang, H. H., Yan, Y. D., Yu, H. Z., and Yin, X. C. (2005b). Experimental study of rock failure precursor using simulated tide stress-load/unload response ratio (LURR) and accelerating energy release (AER). Chin. J. Rock Mech. Eng. 24 (17), 3172–3179.
Zhang, H. H., Yin, X. C., and Liang, N. G. (2005a). Statistic study of LURR anomaly temporal scale before moderately strong earthquakes on the Chinese mainland. Earthq. Res. China 21 (4), 486–495. doi:10.3969/j.issn.1001-4683.2005.04.005
Zhang, J. C. (2014). “The study of media changes caused by the reservoir storage with coda wave interferometry,” in Institude of earthquake science (Beijing, China: China Earthquake Administration).
Zhang, L. P., Yu, H. Z., and Yin, X. C. (2013). Failure potential evaluation in engineering experiments using load/unload response ratio method. Pure Appl. Geophys. 170 (1-2), 237–245. doi:10.1007/s00024-011-0370-7
Zhang, W. J., Chen, Y. M., and Zhan, L. T. (2006a). Loading/Unloading response ratio theory applied in predicting deep-seated landslides triggering. Eng. Geol. 82 (4), 234–240. doi:10.1016/j.enggeo.2005.11.005
Zhang, X. H., Xu, X., Wang, H., Xia, M., Ke, F., and Bai, Y. (2004). Critical sensitivity in driven nonlinear threshold systems. Pure Appl. Geophys. 161 (9-10), 1931–1944. doi:10.1007/s00024-004-2540-3
Keywords: rock experiment, cyclic loading, instability fracture, measurement of wave velocity, loading and unloading response ratio
Citation: Zhang S, Yang R, Tan J, Zhang Y and Jiang J (2023) The evolution characteristics of rock fracture instability under cyclic loading on the basis of the enhanced LURR. Front. Earth Sci. 10:1069046. doi: 10.3389/feart.2022.1069046
Received: 13 October 2022; Accepted: 09 December 2022;
Published: 30 January 2023.
Edited by:
Fuqiong Huang, China Earthquake Networks Center, ChinaReviewed by:
Dan Ma, China University of Mining and Technology, ChinaShunyun Chen, China Earthquake Administration, China
Copyright © 2023 Zhang, Yang, Tan, Zhang and Jiang. This is an open-access article distributed under the terms of the Creative Commons Attribution License (CC BY). The use, distribution or reproduction in other forums is permitted, provided the original author(s) and the copyright owner(s) are credited and that the original publication in this journal is cited, in accordance with accepted academic practice. No use, distribution or reproduction is permitted which does not comply with these terms.
*Correspondence: Runhai Yang, cnVuaGFpeWFuZ0AxNjMuY29t