 Yi Zou
 Lirong Zhu2†
 Yanhu He
94% of researchers rate our articles as excellent or good
Learn more about the work of our research integrity team to safeguard the quality of each article we publish.
Find out more
ORIGINAL RESEARCH article
Front. Earth Sci., 18 January 2023
Sec. Hydrosphere
Volume 10 - 2022 | https://doi.org/10.3389/feart.2022.1066828
This article is part of the Research TopicUrban Flooding under a Changing EnvironmentView all 5 articles
The traditional drought and flood analysis method had not fully considered the proportion analysis of different drought and flood grades in the historical years of each rainfall station. This made results unconvincing and made it difficult to deeply understand the characteristics and applicability of various methods. Based on the daily rainfall data of 88 stations in Hainan Island from 1970 to 2019, the China-Z index and the Standardized Precipitation Index (SPI) were used to compare and analyze the spatial and temporal distribution characteristics of droughts and floods from three different time scales (flood season, non-flood season and the whole year). The results showed that both SPI and China-Z index can well reflect the actual drought and flood situations in Hainan Island. The analysis of the proportions of different drought and flood grades in the historical years of each rainfall station and regional historical drought and flood statistics suggested that the China-Z index had a better indication effect than SPI on the extreme drought and flood grades. The alternation of drought and flood between different eras were obvious. Hainan Island generally presented an east-west reverse drought-flood variation trend, as well as a north-south reverse drought-flood variation trend. The drought and flood in the central mountainous area of Hainan Island had been relatively stable. The distribution pattern of drought and flood had a good spatial consistency in the three periods. On the whole, Hainan Island had shown a trend of flood in the east and drought in the west in the past 50 years.
Drought, flood, hail, low temperature, and frost are the main types of agrometeorological disasters globally (Xu and Tang, 2021). Extreme hydrological events, such as drought and flood, are climate natural disasters that require special attention because of their greater impact on agriculture (Tirivarombo et al., 2018). Climate change is an important driver of flood and drought changes (Pei et al., 2013). Compared with floods, drought disasters develop slowly and are only recognized when people feel their effects (Vicente-Serrano and L´opez-Moreno, 2005). Floods have always plagued people, and the large expense has been invested in flood control. Drought and flood disasters will have a heavy impact on the development of agricultural production. In 1995 and 2015, about 2.3 and 1.1 billion people, were respectively affected by floods and droughts of varying degrees globally (Ward et al., 2020). Accurately identifying the changing laws of droughts and floods is very important for disaster prevention and control.
Defining the meaning and determining the index of drought and flood are the most critical issues in the study of drought and flood. The drought and flood index can clearly, simply and quantitatively evaluate the main characteristics of droughts and floods such as intensity, duration and spatial extent (Wu et al., 2001). Standardized Precipitation Index (SPI) calculations take into account only precipitation, which is simple, stable and widely used. The SPI was developed to monitor drought conditions in Colorado, the United States. Since 1995, the China-Z index (precipitation Z index) is adopted by the National Climate Center of China as a standard for analyzing and determining droughts and floods in a certain period (Zou et al., 2005). Scholars disagree on whether the SPI and China-Z indices have similar findings and which index is more responsive to regional drought and flood conditions (Yuan and Zhou, 2004; Mahmoudi et al., 2019; Zeybekoğlu and Aktürk, 2021). It is necessary to select China Z index commonly used in China and SPI commonly used in the world for comparative analysis, and select drought and flood monitoring index suitable for a region (Schipper and Smakhtin, 2008).
Many scholars have used a variety of methods and indices to study regional drought and flood disasters. Some studies only focus on a single index to study drought and flood disasters. For example, the China-Z index and wavelet analysis methods were used to analyze the multi-time-scale correlations between drought and flood index, annual runoff and the North Atlantic Oscillation (NAO) in the Tarim River headwaters in the past 50 years (Gao et al., 2017). The temporal and spatial distribution characteristics of typical annual droughts and floods in the Huai River Basin were analyzed by using IDW, P-III curve and SPI (Yan et al., 2014). Some studies have also conducted a comparative analysis of drought and flood indices including SPI and China-Z index (Jain et al., 2015). SPI, China-Z index and Z-Score (statistical Z-score) were used to study the drought and flood disasters in four regions of China from 1951 to 1998 (Wu et al., 2001). Their results showed that China-Z index and Z-Score provided SPI-like results on all time scales. Moreover, compared with SPI, the calculation of China-Z index and Z-Score is simpler. Mahmoudi et al. (2019) assessed the sensitivity of the drought index, a comparative analysis of 7 different drought indices including SPI and China-Z index was carried out. The results point out the China-Z index shows better matching. Although the SPI shows appropriate performance, the reliability of the results was not high. Overall, there are a variety of indices used to monitor drought and flood disasters and manage their risk. However, most of the previous studies used a single method to calculate the drought and flood index values, and lack of comparative study of several calculation methods (Wu et al., 2021; Zuo et al., 2022). This makes the results unconvincing and difficult to deeply understand the characteristics and applicability of various methods. Therefore, it is necessary to use different indices to compare and analyze the drought and flood disasters in the same study area.
The research on drought and flood index has achieved relatively rich results (Abiodun et al., 2022; Zhang and Wang, 2022). Drought and flood indices such as Palmer Drought Index (PDSI), China-Z index and SPI are widely used in drought and flood research in different regions (Xu et al., 2015; Zeybekoğlu and Aktürk, 2021). Although some studies have compared and analyzed the results of several methods, they have not fully considered the proportional analysis of different drought and flood grades in the historical years of each rainfall station (Adnan et al., 2017; Mahmoudi et al., 2019). This cannot guarantee the accuracy of drought and flood disaster assessment. In addition, other studies seldom combine the regional historical drought and flood statistics when conducting drought and flood analysis, resulting in greater uncertainty in the grade of drought and flood and its prediction.
Tropical regions have unique climatic and geographical features, but only a few scholars have conducted drought and flood studies in this region. Zhang et al. (2017) used the analytic hierarchy process and entropy method, combined with the disaster risk assessment model to analyze the drought and flood disasters in Hainan Island. It provides scientific guidance for reducing the risk of peppers suffering from major meteorological disasters. However, it has not been compared and verified by the drought and flood index. SPI and Mann-Kendall trend analysis were used to better assess the long-term meteorological drought intensity, frequency and variation trends in East Africa from 1920 to 2016 (Kalisa et al., 2020). Harishnaika et al. (2022) used SPI to analyze droughts in the Kolar and Chikkaballapura districts of Karnataka, results showed that droughts occurred frequently in specific years and seasons.
Few studies have compared and analyzed different drought and flood indexes in tropical China (Zhang et al., 2017). Yuan and Zhou (2004) pointed out that the China-Z index is closely related to the spatial and temporal distribution characteristics of precipitation, and the sensitivity to droughts and floods varies in different regions and at different times of the year. Moreover, few studies consider the influence of the unique geographical location and climatic conditions in tropical regions on drought and flood for flood season and non-flood season. Therefore, comparing the two methods of SPI and China-Z index and select the index that can better reflect the actual situation of local disasters in drought and flood research deserves further study. The flood season in Hainan Island is the most concentrated period affected by tropical cyclones. From the perspective of time scale, selecting the three time periods of flood season (May-October), non-flood season (November-April) and the whole year (January to December) to analyze drought and flood can better consider the climate and geographical characteristics of Hainan Island. The length of the flood season, the amount of precipitation and the intensity of the precipitation during the flood season directly affect the occurrence of disasters such as more floods and less droughts, which in turn affects agricultural production.
Therefore, this study uses the existing daily precipitation data to compare and analyze the application of the SPI and the China-Z index in identifying the spatial and temporal distribution characteristics of droughts and floods in Hainan Island. ArcGIS spatial analysis technology and Empirical Orthogonal Function (EOF) have been used to study the historical drought and flood disasters at different time scales (flood season, non-flood season and the whole year). The goals of this study were: 1) to use the China-Z index and the SPI to compare and determine more appropriate drought and flood index by analyzing the proportion of different drought and flood grades in the historical years of each rainfall station. 2) to analyze the temporal and spatial distribution of drought and flood in the flood season, non-flood season and the whole year in Hainan Island by using the EOF analysis and statistical methods. The study further revealed the temporal and spatial evolution characteristics and changing trends of droughts and floods in Hainan Island, which were of great significance to the agricultural development. Our study can provide a reference for the monitoring of drought and flood disasters in other tropical island regions.
Hainan Island (18°09'∼20°10′N, 108°37'∼111°03′E) is located in the northwestern part of the South China Sea, on the northern edge of tropical Asia (Lin et al., 2021). Its area is about 33,900 km2, adjacent to Qiongzhou Strait and Beibu Gulf waters. Hainan Island is characterized by a radial water system, mainly originating from the high-altitude mountainous areas in the central part (Zhang et al., 2020). The terrain of the island gradually rises from the coast to the inland from the plain to the rolling hills and mountains (Wong et al., 2021). The three major rivers in Hainan Island are Nandu River, Changhua River and Wanquan River (Wu et al., 2017). Hainan Island has a tropical maritime climate with no cold winters and an annual average temperature between 22.8–25.8°C (Zhang et al., 2013). Its dry and wet seasons are obvious. The climate zone can be divided into humid, semi-humid and semi-arid regions, with annual rainfall ranging from 1,500 to 2,500 mm.
Hainan Island is an important area for studying tropical climate and environmental changes (Yao et al., 2008). At present, the area of agricultural land is 2.97*104 km2, accounting for 83.8% of the total land area. The development of agriculture is limited by the amount of water. In recent decades, the runoff and sediment flow of the three major rivers in Hainan Island has decreased due to human activities such as farmland irrigation, dam construction and estuary dredging (Yang et al., 2013). Agricultural production in Hainan Island such as rubber and tropical fruits is a globally important source. However, droughts and floods have had a huge impact on tropical agricultural production. It is of great significance to the agriculture of Hainan Island to analyze the spatial and temporal distribution characteristics of drought and flood disasters.
In order to characterize the occurrence degree of drought and flood and better reflect its distribution, 88 rainfall stations (complete with no missing daily rainfall data) were selected that relatively evenly distributed throughout Hainan Island from 1970 to 2019 (Figure 1). The above rainfall station data is provided by the Hydrological and Water Resources Survey Bureau of Hainan Province. China-Z index can better characterize the spatial distribution pattern of droughts and floods (Ju et al., 1998; He et al., 2014). The analytical effect of China-Z index is closely related to the deviation coefficient, the larger the deviation coefficient is, the better the analytical result of China-Z index is, and the more it can reflect the degree of drought and flood (Ju et al., 1998). By normalizing the precipitation data, the Person-III distribution is transformed into a standard normal distribution with China-Z index as a scalar (Wu et al., 2001). The formulas for calculating the China-Z index are as follows (Ju et al., 1998).
in the formulas, σ is the standard deviation of the precipitation series, n is the number of observations, φi is the standard variable, and Cs is the deviation coefficient.
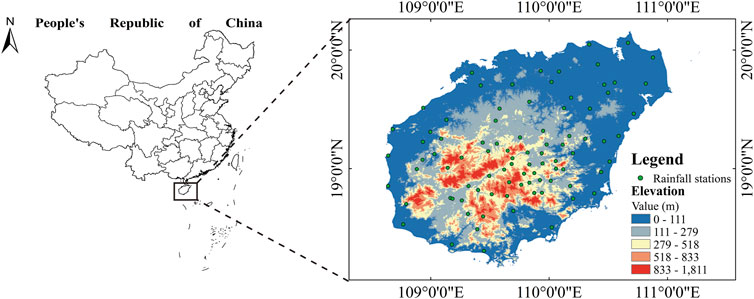
FIGURE 1. Geographical location, elevation and rainfall stations distribution of Hainan Island.
The Standardized Precipitation Index was developed to monitor drought conditions in Colorado, the United States (McKee et al., 1993). It has an important feature that cannot be achieved by the other typical drought-flood index. It can be used to detect drought and flood periods on different time scales (Wu et al., 2001). Moreover, it is sensitive to changes in drought and flood, and can eliminate the differences in the spatial and temporal distribution of precipitation. But the calculation of SPI requires no missing data in the time series. The length of the data records is required to be at least 30 years. In order to obtain the cumulative probability, this method fits the precipitation data series into a gamma probability density function, and then normalizes it to obtain the SPI value (Tirivarombo et al., 2018; Bouaziz et al., 2021). The SPI value can be calculated as follows:
In the above formulas, H(x) is the cumulative probability, c0=2.515517; c1=0.802853; c2=0.010328; d1=1.432788; d2=0.189269; d3=0.001308. The drought-flood grade values of China-Z index and SPI are shown in Table 1 (McKee et al., 1993; Ju et al., 1998; Hayes et al., 1999).
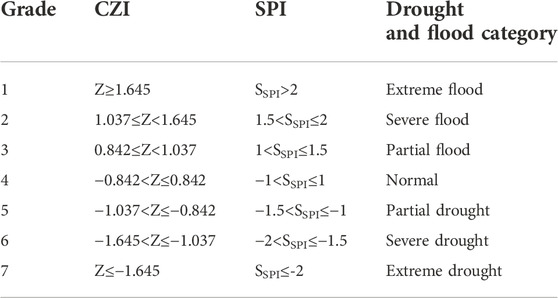
TABLE 1. China-Z index and SPI drought and flood grade classification.
Empirical Orthogonal Function analysis (EOF), also known as Principal Component Analysis. It was first proposed by Lorenz in 1956 (Lorenz, 1956). It is a data decomposition method that uses a series of orthogonal basis functions and correlation coefficients to represent the original data. It is used to study the temporal variability of large-scale data, and is one of the preferred methods for analyzing the main components of temporal and spatial changes in the meteorological field (Li et al., 2018). It transforms observations of potentially correlated variables into a set of mutually orthogonal variables. With this transformation defined, the first EOF will explain the largest variability in the dataset, with each subsequent EOF accounting for a lower proportion (Zhou et al., 2019). The variables of the EOF field X generally have three forms: the original variable field, the abnormal field of the original variable and the normalized field of the original variable. For detailed calculation steps, please refer to (Duan et al., 2016).
Mann-Kendall trend test (Mann, 1945; Kannel et al., 2007) has been widely used to assess the significance of trends in time series of climatological, meteorological and hydrological data (Kisi and Ay, 2014). The standard normality test statistic is ZS. In this study, significance levels α = 0.1, α = 0.05 and α = 0.01 were used. If 1.96>|ZS|≥1.28, a 10% level of significance is reached. If 2.576>|ZS|≥1.96, a 5% level of significance is reached. If |ZS|≥2.576, then a 1% level of significance is reached.
The China-Z-index and SPI values were first calculated uniformly for each month of each year for 50 years, and then divided into the corresponding time ranges of flood, non-flood, and year-round periods for further analysis. And according to Table 1, the drought and flood grades for each station of Hainan Island were classified. Based on the drought and flood grades for a single station, the ratio of the number of stations for each drought and flood grade to the total number of stations in Hainan Island was calculated and compared, and the actual drought and flood conditions were analyzed accordingly. Due to space limitations, the results of the two methods on the ratio of the number of stations to the total number of stations under each drought and flood grade in the past 50 years are not shown in the text.
In order to compare the difference between SPI and China-Z index in the drought and flood grades. The difference in the ratio of the number of stations under various drought and flood grades to the total number of stations in Hainan Island is called the degree of difference. The results show that, in terms of the whole year, for the seven drought-flood grades obtained by the SPI and China-Z index respectively in the past 50 years, the ratio of each grade stations to the total stations is not much different. There is a certain degree of difference between the two methods in the division of the same drought/flood grade in different periods (flood season, non-flood season and the whole year) and different drought/flood grades in the same time period. In terms of different time periods, the degree of difference between the drought and flood grades in the flood season and the non-flood season is relatively large, and the difference in the whole year is small. For a certain drought-flood grade, the degree of difference between extreme flood, extreme drought, severe flood and severe drought is greater than that of near normal, partial flood and partial drought. This may be related to the frequency of occurrence of each grade of drought and flood. Compared with other drought-flood grades, extreme drought-flood grades are more numerous and the annual occurrence frequency is unstable, and the degree of difference is large. Overall, the two methods of SPI and China-Z index have little difference in the classification of drought and flood in Hainan Island, and the calculation results have good consistency.
The two methods are also consistent in responding to the alternating drought and flood events. In the past 50 years, the alternation of drought and flood in Hainan Island is obvious, and the extreme floods years obtained by the two methods are more than extreme drought years. In the 1970s, the alternation of drought and flood was obvious based on China-Z index. The 1980s was a drought period, with 3 years of severe drought and 3 years of extreme drought. In the 1990s, except for three normal years, drought and flood alternated in other years. There was flood in the first 2 years of the 2000s, 6 years of drought in the mid-to-late 2000s, and flood in the last 2 years. In this era, the 4-year drought obtained by the SPI was different from the 6-year drought obtained by the China-Z index, but the overall change was the same. In the 2010s, it was a flood period, with 6 years of extreme flood. It can be seen that the alternation of drought and flood in Hainan Island is complex, and it is more common to change from drought to flood or from flood to drought. Therefore, it is imperative to prevent flood after droughts and prevent droughts after floods.
The proportion of the 88 stations that belong to 7 drought-flood grades in the extreme flood years in flood season, extreme flood years in the whole year, and extreme drought years during non-flood season were obtained, respectively (Tables 2–4). Two methods were used to screen the classification results of drought and flood grades of each station in different periods from 1970 to 2019, and the specific years in the tables were obtained. It can be seen that the number of years with extreme flood throughout the year is more than in the years with extreme flood during flood season and extreme drought in non-flood season. Moreover, the extreme flood years during the flood season overlapped with the extreme flood years in the whole year for as much as 5 years. It shows that the flood season and the whole year have good consistency in the classification of extreme drought and flood. On the whole, for the extreme flood in the same year (level 1), the number of stations calculated by China-Z index is more than SPI in the two periods of extreme flood years in flood season and extreme flood years in the whole year. This is particularly evident in the flood season. However, for the same year of severe flood (level 2), the proportion of SPI stations were higher than that of the China-Z index. It is worth noting that in the 5-year overlap between the extreme flood years in the flood season and extreme flood years in the whole year, both have the same value for 2 years. Although in the calculation of the number of stations in extreme drought years in non-flood seasons, the SPI exceeds the China-Z index. However, the China-Z index screened out more accurate years than the SPI in all three time periods and is in line with the historical record year. The China-Z index has good sensitivity for the identification of extreme drought and extreme flood years in the classification of extreme droughts and floods in Hainan Island (Wu et al., 2001; He et al., 2014).

TABLE 2. Comparison of station ratio in extreme flood years in flood season (%).

TABLE 3. Comparison of station ratio in extreme floods year in the whole year (%).
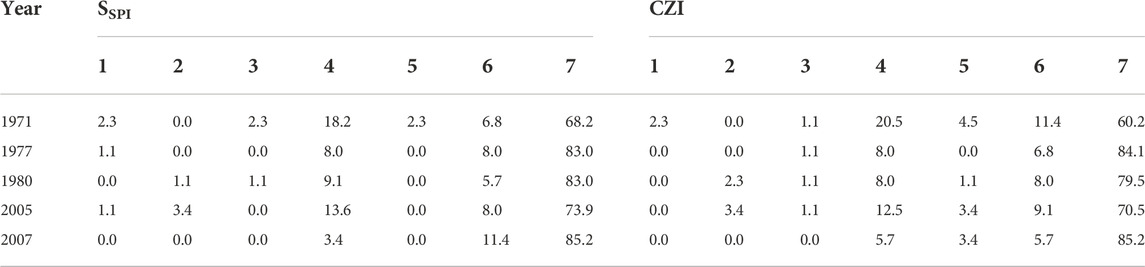
TABLE 4. Comparison of station ratio in extreme drought years in non-flood season (%).
The coefficient of variation can better reflect the stability of precipitation. In this study, the coefficient of variation of each station in the past 50 years was calculated. In order to reflect the characteristics of drought and flood, the average precipitation of Hainan Island over the past 50 years was also calculated and compared with the annual variation coefficient. Spatial distribution of annual average rainfall (Figure 2) and coefficient of variation (Figure 3) were obtained by IDW spatial interpolation. On the whole, the rainfall gradually decreased outward from the high-value (2,429–3,274 mm) areas distributed in Qiongzhong, Wanning and Qionghai City. The areas with less precipitation are mainly located along the western coast (1,161–1,584 mm). Changjiang, Danzhou and Dongfang City in the western coast all have high value distributions of coefficients of variation ranging from 0.74 to 0.87. Therefore, the inter-annual variability in precipitation is large in this region, and the probability of drought and flood is high. The coefficient of variation is small in most areas of Hainan Island except for the east and west coasts, ranging from 0.54 to 0.67. Precipitation is usually in the range of 1,607–2,131 mm. The central region has large rainfall, small inter-annual variation and good stability. It is worth noting that the distribution of high-value areas of precipitation (2,429–3,274 mm) is similar to that of high-value areas of the coefficient of variation (0.79–1.15). These areas have high precipitation and a large coefficient of variation. The regional inter-annual variation is small, the stability is poor, and the probability of droughts and floods is high. Most of the above-mentioned areas with high probability of drought and flood are located in coastal agricultural planting areas. Drought and flood disasters will threaten the growth of crops.
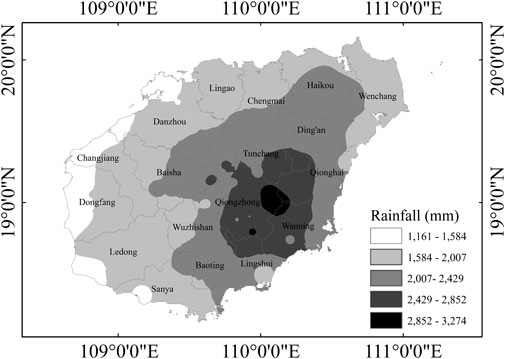
FIGURE 2. Spatial distribution of annual average rainfall in Hainan Island.
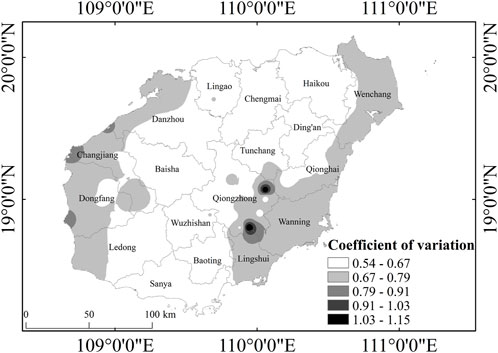
FIGURE 3. Spatial distribution of coefficient of variation in Hainan Island.
An EOF analysis was carried out on the China-Z index of 88 stations in three periods of flood season, non-flood season and the whole year (Figure 4). It can quantitatively describe the spatial distribution characteristics of droughts and floods in the past 50 years and can reveal the complexity of the spatial distribution of droughts and floods in Hainan Island. The North criterion test (North et al., 1982) found that the first four modes in both flood season and non-flood season have passed the North test. But on the annual time scale, only the first three modes passed the North test. Therefore, in order to better analyze the spatial distribution characteristics of droughts and floods in the three time periods, the first three modes were selected uniformly for analysis. During the flood season, the first three eigenvectors of Hainan Island accounted for 61.44% of the total variance. The first eigenvector field accounts for 46.97% of the total variance and is a uniform positive distribution. This reflects that the spatial distribution of drought and flood has an overall consistent change trend. The high-value areas are distributed in Wanning on the eastern coast, and gradually decrease outward from the whole. The low-value areas are mainly located in the western coastal areas of Ledong, Danzhou and other places, and there are also scattered distributions in the central mountainous areas. The second eigenvector field accounts for 8.63% of the total variance. The northern and southern parts of Hainan Island have opposite variation characteristics. There are negative values distributions in the areas above the central part of Hainan Island. The positive value gradually decreases outward with Baoting as the center. It shows the opposite trend of drought and flood in north and south. The third eigenvector field accounts for 5.84% of the total variance, and the east and west showed opposite drought and flood changes.
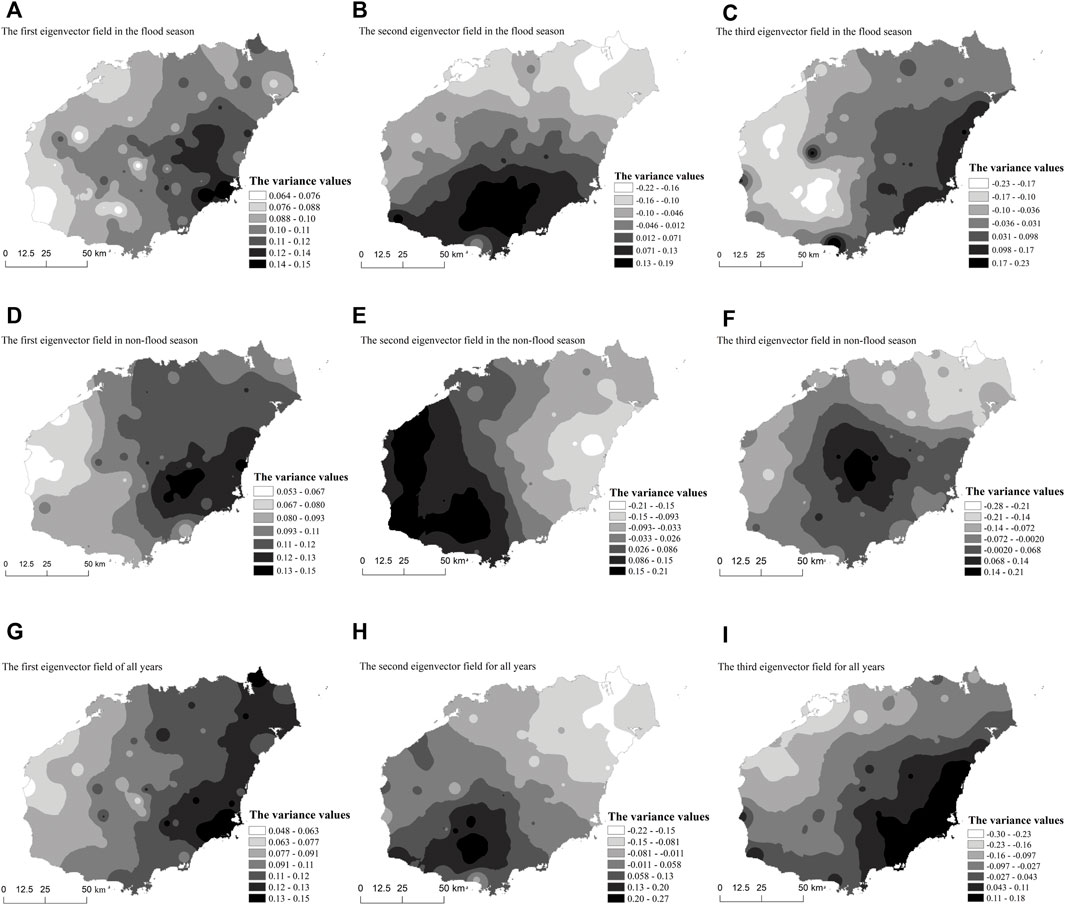
FIGURE 4. Spatial distribution of EOFs of the first three eigenvector fields in the flood season (A–C), non-flood season (D–F) and the whole year (G–I) in Hainan Island.
The first three eigenvectors of Hainan Island in non-flood season accounted for 67.67% of the total variance. The first eigenvector field accounts for 54.55% of the total variance, with a uniform positive distribution. The value gradually increases from the western coastal area to the eastern area. The high-value regional center is located in Qiongzhong. The second eigenvector field accounts for 8.04% of the total variance, and its distribution shows a decreasing trend from southwest to east. It reflects that there are still differences in the spatial distribution of droughts and floods in the eastern and southwestern regions of Hainan Island during non-flood season. High values are concentrated in Changjiang, Dongfang, Ledong and Sanya, while low values are distributed in Qiongzhong and Wanning. The third eigenvector field accounted for 5.07% of the total variance, and the high value gradually decreased to the southwest and northeast from Qiongzhong as the center. The low value is most distributed in Haikou. This is similar to the undulating terrain features of Hainan Island, indicating that rainfall is affected by terrain, which affects the occurrence of droughts and floods.
The top three eigenvectors of Hainan Island accounted for 64.54% of the total variance in the whole year. The first eigenvector field accounts for 51.32% of the total variance and is a consistent positive distribution. High values are mainly distributed in the eastern coastal area. Similar to the first characteristic field in the flood season, Wanning has a maximum value. From the eastern coast to Dongfang City and the Changjiang County, the high-value areas show a decreasing trend. The second eigenvector field accounts for 8.05% of the total variance. The main trend is that the high value gradually decreases from the junction of Wuzhishan, Baoting and Ledong to the northernmost area of Haikou in the northeast. Similar to the trend of the second eigenvector field in the flood season, it reflects the difference of the north-south reverse change. The third eigenvector field accounts for 5.17% of the total variance. Lingshui, Wanning, and Qionghai are densely distributed areas with high values, which gradually decreases towards the northwest coast of Danzhou. The opposite trend of change from the east coast to the northwest coast is formed.
Since the China-Z index can better reflect the situation in historical drought and flood. The Mann-Kendall trend test was performed on the flood season, non-flood season and annual drought and flood grades of each station in the past 50 years based on the China-Z index. This results in a 50-year trend value for all stations in the three periods. IDW spatial interpolation was performed on the trend values, with negative values representing a drought trend and the positive values representing a humid trend. Further analysis of the temporal and spatial variation characteristics of drought and flood grades in Hainan Island is shown in Figure 5. During the flood season, almost all areas of Hainan Island are in a situation where the trend of drought and flood is not obvious. The distribution of the drought trend belt is relatively small, and only distributed in scattered points along the central region. The humid trend belt spreads to a small part of Lingshui, Ledong and Sanya with Baoting as the center. In addition, it also has obvious distribution in Lingao, Chengmai and Ding’an, and the distribution range in Qiongzhong is relatively small. During the non-flood season, there is only a drought trend belt of 34.34 km2 in the coastal area of Sanya. There are many areas where the humid trend belt reaches the 0.1 significance test, and it is distributed from the west coast to parts of the central, southern and eastern parts. The regions reaching the 0.05 and 0.01 trend significance tests are close to each other and are more concentrated in the central region. In the whole year, it is evident that relatively broad areas display a non-significant trend. The drought trend belts in the whole year almost coincide with the drought trend belts in the non-flood season, with an area of 30.99 km2. The humid trend belts in the whole year are mostly distributed in the central mountainous area. All three time periods have a distribution of humid trend belts in the area centered in Baoting.
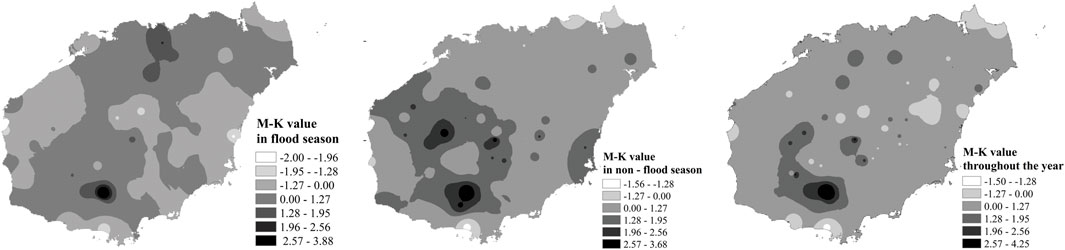
FIGURE 5. Spatial and temporal distribution of drought and flood trends in Hainan Island.
China-Z index and Standardized Precipitation Index have shown good results in the classification of drought and flood in different regions. There is not only one method that can be used to classify the grade of drought and flood in a certain area. This study compares China-Z index and SPI, which are widely used in China’s domestic drought-flood index to indicate the grading of drought and flood in Hainan Island. And it is found that, compared with SPI, China-Z index does have a good indication effect on the classification of drought and flood in Hainan Island. According to the China Meteorological Disasters Ceremony Hainan (Wen and Wu, 2008) records, in 1977 Hainan Island occurred since the liberation of the longest, most extensive, the most seriously affected drought disaster. In 2005, another large area of four-season continuous drought occurred across the island. Both of these years have been classified as non-flood season extreme drought years in Table 4. And they were screened out by China-Z Index and SPI at the same time. However, in 1983, droughts occurred widely in 19 cities and counties on the island, and in 1987, droughts occurred in 11 cities and counties in the whole island in autumn, winter and spring. When screening the extreme drought years in the non-flood season, these 2 years were only screened out by the China-Z index.
According to the records of the Chinese Meteorological Disaster Ceremony Hainan (Wen and Wu, 2008), flood disasters occurred in different temporal and spatial in 1978, 1990, 1997 and 2000 respectively. The above-mentioned years all existed in the results of screening the years with extreme flood throughout the year. Among them, 1978 is the overlapping year of extreme flood year throughout the year and extreme flood year during the flood season. In the screening of years with severe floods during the flood season, only the China-Z index screened out the year 1990. In the screening process of these two periods, only the China-Z index screened out the year 2000. In summary, the classification of drought and flood in this study is in good agreement with the actual disaster situation. This is because parameters such as deviation coefficient and criterion variable (Eq. 4) are involved in the calculation process of China-Z index (He et al., 2014). It can better take into account the temporal and spatial distribution of rainfall (Yuan and Zhou, 2004). For extreme precipitation, the larger the deviation coefficient, the better the analysis effect of China-Z index, and the better it can reflect the degree of extreme drought and flood.
By comparing the temporal and spatial distribution of the coefficient of variation and the annual average precipitation from 1970 to 2019, the areas with a high probability of drought and flood were analyzed. In conclusion, Changjiang, Danzhou and Dongfang have a higher probability of drought. Wanning, Qiongzhong, and Baoting are more prone to floods. The coastal areas of Hainan Island are mostly urban agglomerations, with low terrain and dense population. Once a flood occurs, it is easy to induce the problem of urban waterlogging. The drought-prone area is located in the west of Hainan Island, which is affected by the dual influence of terrain and rainfall, posing a threat to agricultural production and domestic water.
The cause analysis of the high probability area of drought and flood is as follows: 1) It can be seen that the coefficient of variation of precipitation in Changjiang is between 0.79 and 0.91, the precipitation is less, the spatial and temporal distribution is uneven, and there is seasonal water shortage (Figures 2, 3). Meteorological statistics show that the annual average precipitation in Changjiang is 1,345.5 mm. It is much lower than the average annual precipitation in Hainan, and the seasonal contradiction between supply and demand is particularly prominent. The regional distribution of precipitation is obvious, with Yuetian Town as the boundary, there is little precipitation in the western coastal areas, and sufficient precipitation in the eastern mountainous areas (Li et al., 2019). In addition, the Wuzhishan Mountains affect the atmospheric circulation, the western part is dry and less rainy, and the evaporation is greater than the precipitation. 2) Danzhou and Dongfang were also influenced by the Wuzhishan Mountains in the middle. Among them, Danzhou is blocked by mountains, leeward, and adjacent to Gulf. The wind speeds are high, which increases evaporation. Dongfang has a large population and little precipitation, and the contradiction between supply and demand is prominent. The average annual precipitation is 1,100 mm, and the evaporation is 2,000 mm. To sum up, Changjiang, Danzhou and Dongfang regions have large coefficients of variation, less precipitation, large inter-annual variability, and a high probability of drought. 3) Wanning is affected by topography, and many places are low-lying. In the urban area of Wancheng, the flooding phenomenon is the most prominent. Coupled with the inversion of the small sea in its area, the low-lying areas were flooded, resulting in waterlogging and stagnant water disasters. In addition, it is sometimes susceptible to the influence of the easterly jet stream, cold air and tropical depression, etc., causing it to continue to rain heavily. 4) Qiongzhong is high in the southwest and low in the northeast. It has a developed water system and many mountain peaks. It is affected by the southeast wind direction, and the precipitation is deposited in the northeast and southeast regions. In the above-mentioned areas, there is more precipitation, and the coefficient of variation is too large, even between 1.03 and 1.15, so the probability of flooding is high.
By analyzing the spatial distribution of the first three eigenvector fields of the EOF during the flood season, non-flood season and the whole year in Hainan Island. It can be seen that there is a north-south reverse change difference and an east-west reverse change difference. The variance values are higher in the south and east, and lower in the north and west. 1) The reason for the opposite changes of drought and flood in the east and west are as follows: Typhoons are an important cause of floods in Hainan Island. The eastern part of Hainan Island is a high-incidence area for typhoons to land. Meteorological forecasters from Hainan Provincial Meteorological Bureau counted the number of typhoons that made landfall in different typhoon landfall areas. From 1950 to 2011, there were 145 typhoons in Hainan Island, including 116 in the east, 48 in Wenchang, 27 in Qionghai and 41 in Wanning (Zhao et al., 2019). The reason from the analysis of the typhoon’s path is that Hainan Island is on the westward moving path of the tropical cyclone in the Northwest Pacific (Liu and Wang, 2016). Typhoons mostly form in the ocean near the Philippines, which is close to the South China Sea. And mostly move to the northwest, after driving straight into the South China Sea, it is the first to enter the eastern part of Hainan Island. In terms of topography, the western part of Hainan Island is located on the leeward slope of the southeast monsoon. Therefore, during the year, there is less rain in the west. On the contrary, the east is the windward slope, and the eastern part has more precipitation than the western part. Therefore, floods often occur in the east, but droughts rarely occur, and the degree of drought and flood changes is large. The western region has always been in a relatively dry climate. 2) There are obvious regional differences in the climate between southern and northern Hainan Island. Hainan Island is affected by the southeast monsoon from the Pacific Ocean and the southwest monsoon from the Indian Ocean in summer, and the northeast monsoon from inland in winter. The difference between the monsoon in the flood season and the non-flood season caused by climate change, coupled with the influence of the central mountain range, the north and south droughts and floods show opposite trends. In addition, the central region is relatively rich in precipitation, but has good water retention capacity and has been in a relatively stable state.
Targeted prevention and control suggestions are put forward for the above-mentioned areas with more droughts and floods. (1) Changjiang suffers from frequent droughts, but it has Changhua River, Zhubi River, Shilu Reservoir and Daguangba Reservoir. Therefore, the water storage capacity can be improved by connecting the water system, thereby alleviating the uneven distribution of water resources in time and space. (2) The governance of Xiaohai Lake in Wanning is imminent. The hydrodynamic force of Xiaohai Lake should be restored and strengthened, ponds should be returned to lakes, and the capacity of urban and rural flood control and drainage should be improved. (3) For the floods in Qiongzhong, soil and water conservation should be strengthened, water storage capacity should be improved, and more vegetation with strong water conservation capacity should be planted. (4) For typhoon-prone areas, it is necessary to do a good job in the supervision of water conservancy projects, dredging river channels, constructing flood diversion channels, and building flood storage and detention areas. Meanwhile, for crops such as rice and vegetables, preventive measures should be taken before typhoons and rainstorms.
Based on the daily rainfall data of 88 stations in Hainan Island from 1970 to 2019, two methods of SPI and China-Z index were used to compare the classification of flood season, non-flood season and annual drought and flood grades. In addition, the proportion of different drought and flood grades in the historical years of each rainfall station was analyzed. The temporal and spatial evolution characteristics and changing trends of droughts and floods in Hainan Island in the past 50 years were also discussed using the coefficient of variation and EOF analysis, and the following main conclusions were drawn:
(1) The difference between the drought and flood grades obtained by the two methods (SPI and China-Z index) in the flood season, non-flood season and the whole year are small, and both can well reflect the historical drought and flood conditions in Hainan Island.
(2) The China-Z index has good sensitivity for the identification of extreme drought and extreme flood years in the classification of extreme droughts and floods in Hainan Island. The classification results of China-Z index are consistent with historical disaster statistics.
(3) In the past 50 years, the alternation of drought and flood has been obvious in different years. In general, there are more flood years than drought years. Droughts in Changjiang, Danzhou and Dongfang are more likely to occur. The Wanning, Qiongzhong and Baoting have a higher chance of flooding. This is consistent with the reverse trend of drought and flood in the east and west through EOF analysis. In addition, there is a reverse trend of drought and flood in the north and south.
(4) The first three eigenvectors of Hainan Island in the flood, non-flood and the whole year periods accounted for 61.44%, 67.67% and 64.54% of the total variance of the respective periods. The location of drought trend belt in the non-flood season is similar to that of the annual drought trend belt. The regions that reached the 0.05 and 0.01 trend significance tests have a concentrated distribution in the central region. In Baoting, the humid trend belts reached a significance level of 0.01 for all three periods.
The original contributions presented in the study are included in the article/supplementary material, further inquiries can be directed to the corresponding author.
All authors contributed to the study conception and design. Material preparation, data collection and analysis were performed by YZ, LZ, YH, YL, XL, and CY. LZ designed the content and ideas of the research. YZ and XL calculated the data and analysed the results. YL provided data resources. YH and CY revised and improved the quality of the research. All authors commented on previous versions of the manuscript. All authors read and approved the final manuscript.
Financial support provided by the project from Natural Science Foundation of Hainan (Grant No. ZDYF2022SHFZ060, 421RC489), the National Natural Science Foundation of China (Grant Nos. 52069006, 51569009, 51979043).
The authors declare that the research was conducted in the absence of any commercial or financial relationships that could be construed as a potential conflict of interest.
All claims expressed in this article are solely those of the authors and do not necessarily represent those of their affiliated organizations, or those of the publisher, the editors and the reviewers. Any product that may be evaluated in this article, or claim that may be made by its manufacturer, is not guaranteed or endorsed by the publisher.
Abiodun, B. J., Kalumba, A. M., and Ekundayo, O. Y. (2022). Global quantitative and qualitative assessment of drought research from 1861 to 2019. Int. J. Disaster Risk Reduct. 70.
Adnan, S., Ullah, K., Shuanglin, L., Gao, S., Khan, A. H., and Mahmood, R. (2017). Comparison of various drought indices to monitor drought status in Pakistan. Clim. Dyn. 51 (5-6), 1885–1899. doi:10.1007/s00382-017-3987-0
Bouaziz, M., Medhioub, E., and Csaplovisc, E. (2021). A machine learning model for drought tracking and forecasting using remote precipitation data and a standardized precipitation index from arid regions. J. Arid. Environ. 189, 104478. doi:10.1016/j.jaridenv.2021.104478
Dai, M., Huang, S. Z., Huang, Q., Zheng, X. D., Su, X. L., Leng, G. Y., et al. (2022). Propagation characteristics and mechanism from meteorological to agricultural drought in various seasons. Glob. Planet. Change 610. doi:10.1016/j.jhydrol.2022.127897
Duan, X. W., Gu, Z. J., Li, Y. G., and Xu, H. J. (2016). The spatiotemporal patterns of rainfall erosivity in Yunnan Province, southwest China: An analysis of empirical orthogonal functions. Glob. Planet Change 144, 82–93. doi:10.1016/j.gloplacha.2016.07.011
Gao, H., Long, A., Deng, X., and Ling, H. (2017). The multi-time-scale correlations for drought–flood index to runoff and North Atlantic Oscillation in the headstreams of Tarim River, Xinjiang, China. Hydrol. Res. 48 (1), 253–264. doi:10.2166/nh.2016.166
Harishnaika, N., Ahmed, S. A., Kumar, S., and Arpitha, M. (2022). Computation of the spatio-temporal extent of rainfall and long-term meteorological drought assessment using standardized precipitation index over Kolar and Chikkaballapura districts, Karnataka during 1951-2019, 27. doi:10.1016/j.rsase.2022.100768Remote Sens. Appl. Soc. Environ.
Hayes, M. J., Svoboda, M. D., Wiihite, D. A., and Vanyarkho, O. V. (1999). Monitoring the 1996 drought using the standardized precipitation index. Bull. Am. Meteorol. Soc. 80, 429–438. doi:10.1175/1520-0477
He, Y. H., Chen, X. H., Lin, K. R., and Wu, X. Q. (2014). Characteristic of the spatio-temporal distribution of droughts and floods in the Dongjiang basin in recent 50 Years. Sci. Geogr. Sin. 34 (11), 1391–1398. doi:10.13249/j.cnki.sgs.2014.11.011
Jain, V. K., Pandey, R. P., Jain, M. K., and Byun, H.-R. (2015). Comparison of drought indices for appraisal of drought characteristics in the Ken River Basin. Weather Clim. Extrem. 8, 1–11. doi:10.1016/j.wace.2015.05.002
Ju, X. S., Z, X. K., and Z, Q. (1998). The method of the climatic drought-flood index and its analysis. J. Nat. Disasters 7 (3), 51–57.
Kalisa, W., Zhang, J. H., Igbawua, T., Ujoh, F., Ebohon, O. J., Namugize, J. N., et al. (2020). Spatio-temporal analysis of drought and return periods over the East African region using Standardized Precipitation Index from 1920 to 2016. Agric. Water Manag. 237, 106195. doi:10.1016/j.agwat.2020.106195
Kannel, P. R., Lee, S., Kanel, S. R., Khan, S. P., and Lee, Y. S. (2007). Spatial-temporal variation and comparative assessment of water qualities of urban river system: A case study of the river Bagmati (Nepal). Environ. Monit. Assess. 129 (1-3), 433–459. doi:10.1007/s10661-006-9375-6
Kisi, O., and Ay, M. (2014). Comparison of Mann–Kendall and innovative trend method for water quality parameters of the Kizilirmak River, Turkey. J. Hydrol. X 513, 362–375. doi:10.1016/j.jhydrol.2014.03.005
Li, J., Ye, Q., Li, F., and Chen, Y. (2019). A cloud-resolving simulation study of monthly-scale autumn precipitation on Hainan Island: The effects of three categories of Graupel on rainfall. Atmos. Res. 220, 92–108. doi:10.1016/j.atmosres.2019.01.008
Li, Q. Z., Chen, P., Sun, L. L., and Ma, X. P. (2018). A global weighted mean temperature model based on empirical orthogonal function analysis. Adv. Space Res. 61 (6), 1398–1411. doi:10.1016/j.asr.2017.12.031
Lin, S., Chen, L., Peng, W., Yu, J., He, J., and Jiang, H. (2021). Temperature and historical land connectivity jointly shape the floristic relationship between Hainan Island and the neighbouring landmasses. Sci. Total Environ. 769, 144629. doi:10.1016/j.scitotenv.2020.144629
Liu, D., and Wang, X. (2016). The influence of ENSO on typhoon activity in the Northwest Pacific. Technol. Innov. Appl. (26), 13–14.
Lorenz, E. N. J. s. r. (1956). Empirical orthogonal functions and statistical Weather prediction. Cambridge: Massachusetts Institute of Technology, Department of Meteorology.
Mahmoudi, P., Rigi, A., and Kamak, M. M. (2019). Evaluating the sensitivity of precipitation-based drought indices to different lengths of record. J. Hydrol. X 579 (2019), 124181–124192. doi:10.1016/j.jhydrol.2019.124181
Mann, H. B. (1945). Nonparametric tests against trend. Econometrica 13 (3), 245–259. doi:10.2307/1907187
McKee, T. B., Doesken, N. J., and Kleist, J. (1993). “The relationship of drought fequency and duration to time scales,” in Proceedings of the 8th Conference on Applied Climatology, California, 179–184.
North, G. R., Bell, T. L., Cahalan, F. R., and Moeng, F. J. (1982). Sampling Errors in the Estimation of empirical orthogonal functions. Mon. Weather Rev. 110 (7), 699–706. doi:10.1175/1520-0493
Pei, Y. S., Jiang, G. Q., and Zhai, J. Q. (2013). Theoretical framework of drought evolution driving mechanism and the key problems. Hydrol. Earth Syst. Sci. 24 (3), 449–456. doi:10.5194/hess-9-523-2005
Schipper, E. L. F., and Smakhtin, V. U. (2008). Droughts: The impact of semantics and perceptions. Water Policy 10 (2), 131–143. doi:10.2166/wp.2008.036
Tirivarombo, S., Osupile, D., and Eliasson, P. (2018). Drought monitoring and analysis: Standardised precipitation Evapotranspiration index (SPEI) and Standardised precipitation index (SPI). Phys. Chem. Earth Parts A/B/C 106, 1–10. doi:10.1016/j.pce.2018.07.001
Vicente-Serrano, S. M., and L´opez-Moreno, J. I. (2005). Hydrological response to different time scales of climatological drought: An evaluation of the standardized precipitation index in a mountainous Mediterranean basin. Hydrol. Earth Syst. Sci. 9, 523–533.
Ward, P. J., de Ruiter, M. C., Mård, J., Schröter, K., Van Loon, A., Veldkamp, T., et al. (2020). The need to integrate flood and drought disaster risk reduction strategies. Water Secur. 11, 100070. doi:10.1016/j.wasec.2020.100070
Wen, K. G., and Wu, Y. J. (2008). China meteorological disasters Ceremony Hainan. Beijing: Meteorological Press.
Wong, M. H. G., Mo, Y. N., and Chan, B. P. L. (2021). Past, present and future of the globally endangered Eld's deer (Rucervus eldii) on Hainan Island, China. Glob. Ecol. Conserv. 26, e01505. doi:10.1016/j.gecco.2021
Wu, H., Hayes, M. J., Weiss, A., and Hu, Q. (2001). An evaluation of the standardized precipitation index, the China-Z index and the statistical Z-score. Int. J. Climatol. 21 (6), 745–758. doi:10.1002/joc.658
Wu, L. B., Fu, P. Q., Xu, L. Q., Wei, Y. Y., Zhou, X., Li, Y. L., et al. (2017). Changes in the source of sedimentary organic matter in the marginal sea sediments of Eastern Hainan Island in response to human activities during the past 200 years. Quat. Int. 440, 150–159. doi:10.1016/j.quaint.2016.07.007
Wu, X. H., Zhou, J. Q., Yu, H. Y., Liu, D. Y., Xie, K., Chen, Y. Q., et al. (2021). The development of a Hybrid wavelet-ARIMA-LSTM model for precipitation amounts and drought analysis. Atmosphere 12 (1), 74. doi:10.3390/atmos12010074
Xu, K., Yang, D., Yang, H., Li, Z., Qin, Y., and Shen, Y. (2015). Spatio-temporal variation of drought in China during 1961–2012: A climatic perspective. J. Hydrol. X 526, 253–264. doi:10.1016/j.jhydrol.2014.09.047
Xu, X., and Tang, Q. (2021). Spatiotemporal variations in damages to cropland from agrometeorological disasters in mainland China during 1978-2018. Sci. Total Environ. 785, 147247. doi:10.1016/j.scitotenv.2021.147247
Yan, D. H., Han, D. M., Wang, G., Yuan, Y., Hu, Y., and Fang, H. Y. (2014). The evolution analysis of flood and drought in Huai River Basin of China based on monthly precipitation characteristics. Nat. Hazards (Dordr) 73 (2), 849–858. doi:10.1007/s11069-014-1109-4
Yang, Z. H., Jia, J. J., Wang, X. K., and Gao, J. H. (2013). Characteristics and variations of water and sediment fluxes into the sea of the top three rivers of Hainan in recent 50 years. Bull. Mar. Sci. 32 (1), 92–99.
Yao, Y. F., Bera, S., Ferguson, D. K., Mosbrugger, V., Paudayal, K. N., Jin, J. H., et al. (2008). Reconstruction of paleovegetation and paleoclimate in the Early and Middle Eocene, Hainan island, China. Clim. Change 92 (1-2), 169–189. doi:10.1007/s10584-008-9457-2
Yuan, W. P., and Zhou, G. S. (2004). Comparison between standardized precipitation index and Z-index in China. Chin. J. Plant Ecol. 28 (4), 523–529. doi:10.17521/cjpe.2004.0071
Zeybekoğlu, U., and Aktürk, G. (2021). A comparison of the China-Z index (CZI) and the standardized precipitation index (SPI) for drought assessment in the Hirfanli dam basin in central Turkey. Arab. J. Geosci. 14 (24), 2731. doi:10.1007/s12517-021-09095-8
Zhang, J., Wang, D. R., Jennerjahn, T., and Dsikowitzky, L. (2013). Land–sea interactions at the East Coast of Hainan island, south China sea: A synthesis. Cont. Shelf Res. 57, 132–142. doi:10.1016/j.csr.2013.01.004
Zhang, L., Huo, Z. G., Zhang, L. Z., and Huang, D. P. (2017). Integrated risk assessment of major meteorological disasters with Paprika pepper in Hainan Province. J. Trop. Meteorol. 23 (3), 334–344. doi:10.16555/j.1006-8775.2017.03.010
Zhang, M., and Wang, J. L. (2022). Global flood disaster research Graph analysis based on Literature Mining. Appl. Sci. (Basel). 12 (6), 3066. doi:10.3390/app12063066
Zhang, P., Ruan, H. M., Dai, P. D., Zhao, L. R., and Zhang, J. B. (2020). Spatiotemporal river flux and composition of nutrients affecting adjacent coastal water quality in Hainan Island, China. J. Hydrol. X 591, 125293–125302. doi:10.1016/j.jhydrol.2020.125293
Zhao, Y., Yang, J., Yin, Y., Zhao, H., He, J., and Zhang, H. (2019). Research on remote sensing monitoring of zirconium-titanium sand mine exploitation and strategies of ecological restoration on the eastern beach of Hainan Island. Remote Sens. Land Resour. 31 (4), 143–150. doi:10.6046/gtzyyg.2019.04.19
Zhou, L. F., Meng, Y. B., and Abbaspour, K. C. (2019). A new framework for multi-site stochastic rainfall generator based on empirical orthogonal function analysis and Hilbert-Huang transform. J. Hydrol. X 575, 730–742. doi:10.1016/j.jhydrol.2019.05.047
Zou, X., Zhai, P., and Zhang, Q. (2005). Variations in droughts over China: 1951-2003. Geophys. Res. Lett. 32 (4). doi:10.1029/2004gl021853
Keywords: droughts and floods, Hainan Island, China-Z index, Standardized precipitation index, empirical orthogonal function analysis, spatial and temporal distribution pattern
Citation: Zou Y, Zhu L, He Y, Lin Y, Liang X and Ye C (2023) Comparative study on appropriate drought and flood index selection in a tropical farming island in China. Front. Earth Sci. 10:1066828. doi: 10.3389/feart.2022.1066828
Received: 11 October 2022; Accepted: 02 November 2022;
Published: 18 January 2023.
Edited by:
Zhaoli Wang, South China University of Technology, ChinaCopyright © 2023 Zou, Zhu, He, Lin, Liang and Ye. This is an open-access article distributed under the terms of the Creative Commons Attribution License (CC BY). The use, distribution or reproduction in other forums is permitted, provided the original author(s) and the copyright owner(s) are credited and that the original publication in this journal is cited, in accordance with accepted academic practice. No use, distribution or reproduction is permitted which does not comply with these terms.
*Correspondence: Changqing Ye, eWVjaGFuZ3FpbmcyMDAxQGhvdG1haWwuY29t
†These authors have contributed equally to this work
Disclaimer: All claims expressed in this article are solely those of the authors and do not necessarily represent those of their affiliated organizations, or those of the publisher, the editors and the reviewers. Any product that may be evaluated in this article or claim that may be made by its manufacturer is not guaranteed or endorsed by the publisher.
Research integrity at Frontiers
Learn more about the work of our research integrity team to safeguard the quality of each article we publish.