 Daqing Zhan1,2
 Miao Li
 Shuying Zang
- 1College of Geographical Science, Harbin Normal University, Harbin, China
- 2Heilongjiang Province Key Laboratory of Geographical Environment Monitoring and Spatial Information Service in Cold Regions, Harbin, China
Active layer thickness (ALT) of permafrost changes significantly under the combined influence of human activities and climate warming, which has a significant impact on the ecological environment, hydrology, and engineering construction in cold regions. The spatial differentiation of Active layer thickness and its influencing factors have become one of the hot topics in the field of cryopedology in recent years, but there are few studies in the Da Hinggan Ling Prefecture (DHLP). In this study, the Stefan equation was used to simulate the Active layer thickness in the Da Hinggan Ling Prefecture, and the factor detection and interaction detection functions of geodetector were used to analyze the factors affecting the spatial differentiation of Active layer thickness from both natural and humanity aspects. The results showed that Active layer thickness in the Da Hinggan Ling Prefecture ranges from 58.82 cm to 212.55 cm, the determinant coefficient R2, MAE, RMSE between simulation results and the sampling points data were 0.86, 11.25 (cm) and 13.25 (cm), respectively. Lower Active layer thickness values are mainly distributed higher elevations in the west, which are dominated by forest (average ALT: 136.94 cm) and wetlands (average ALT: 71.88 cm), while the higher values are distributed on cultivated land (average ALT: 170.35 cm) and construction land (average ALT: 176.49 cm) in the southeast. Among the influencing factors, elevation is significantly negatively correlated with ALT. followed by summer mean LST, SLHF and snow depth. NDVI and SM has the strong explanation power for the spatial differentiation of ALT in factor detection. Regarding interactions, the explanatory power of slope ∩ snow depth is the highest of 0.83, followed by the elevation ∩ distance to settlements. The results can provide reference for the formulation of ecological environmental protection and engineering construction policies in cold regions.
1 Introduction
Permafrost generally refers to rock and soil that has been frozen for two or more years under the surface. It is the product of the energy exchange between the lithosphere and the atmosphere (Schuur et al., 2008; Hu et al., 2017). ALT refers to the thickness of the soil layer over permafrost that thaws in summer and freezes in winter (Wu and Zhang 2010). Changes in ALT are mainly due to the process of land-air exchange, and this is the most active factor affecting the ecological environment in cold regions. The transformation of water and ice, water migration, and water-heat transport process in the freezing and thawing process of the active layer will change land-air, water-heat, and transport characteristics (Zhang and Wu 2012). Therefore, the variation of ALT affects the biological, physical, and geochemical processes involved in the hydrology and ecosystems of a permafrost region. Importantly, as ALT increases, carbon stored in permafrost is released into the atmosphere in the form of greenhouse gases, which further affects regional or global climate change (Cheng et al., 2019). Under the trend of global warming, the thermal state of the DHLP is unstable. The spatial differentiation of ALT and its influencing factors are one of the important contents of regional permafrost research, which is very important for the analysis and detection of climate change.
According to the IPCC report, the global average temperature will increase at a rate of 0.3°C/10a in the middle of the 21st century, and the increase may be greater in high latitude and high altitude regions (Serreze et al., 2000; Chapin et al., 2005; Hinzman et al., 2005; Screen and Simmonds 2010; Jeong et al., 2012). In recent years, the variation of ALT in permafrost regions has attracted extensive research attention. The seasonal variation of ALT mainly depends on climate, elevation, SM, latitude, topographic characteristics, and underlying surface properties (You et al., 2018). Lü et al. (2007) investigated ALT in the Huzhong National Nature Reserve in the Da Hinggan Mountains and analyzed the influencing factors of the active layer above the permafrost. The results showed that there is a complex relationship between ALT and many environmental factors such as terrain conditions, soil water content, and different biological communities. Hou et al. (2010) studied the variation of ALT in the Da Hinggan Mountains permafrost area under fire disturbance and found that ALT in the burned area was significantly larger than that in the unburned area. He et al. (2018) studied the freezing and thawing process of the active layer in the Nanweng’he River National Nature Reserve of the Da Hinggan Mountains in northeast China, and the results showed that the freezing-thawing process was greatly affected by soil water content and vegetation. Bai et al. (2018) studied the spatio-temporal variation of ALT in the northeast coniferous forest area from 2000 to 2015, and found that ALT in the study area varied from 1.18 m to 1.3 m. In total, there are few research studies on the permafrost active layer in the DHLP. A lot of research studies have been carried out on the active layer of the Qinghai-Tibet Plateau, mainly focusing on the simulation of the ALT distribution (Li et al., 2012; Zhang et al., 2016; Guo and Wang 2017; Xu et al., 2017); the simulation of ALT changes under future climate change (Zhang and Wu 2012; Chang et al., 2018); the use of radar data to study ALT (Du et al., 2016; Cao et al., 2017; Jia et al., 2017); and the active layer freezing and thawing process (Tian et al., 2009; You et al., 2017; Shen et al., 2018; Yang and Wang 2019).
The Kudryavtsev, Nelson, and Stefan methods are commonly used in calculating ALT (Wang et al., 2009). Based on temperature, the Kudryavtsev method comprehensively considers the influence of snow cover, vegetation, SM, soil thermal properties, and other factors on the active layer, but this method needs more calculation parameters to be accurate, and it is difficult to obtain the data for this method (Anisimov et al., 1997; Shiklomanov and Nelson 1999). The basic principles of the Nelson’s method and Stefan’s method are the same. The difference is that the LST is calculated differently (Nelson et al., 2001). The Stefan equation is a formula expression approximating solution of the Fourier heat conduction equation proposed by Austrian scientist Stefan in 1891. The Stefan equation was originally used to simulate the freezing and thawing process of lake ice in the Arctic region (Stefan 1891). Berggren used it calculate the freezing and thawing of soil layers in 1943, and then it was widely used in the field of cryopedology (Berggren 1943). The Stefan equation has few parameters, a simple form, and a reliable simulation effect. It is one of the commonly used algorithms in the study of glaciology and cryopedology (Nelson et al., 1997; Zorigt et al., 2016; Bai et al., 2018). Klene (2005) considered the thermal performance and topography of the thawing index, soil moisture, and land cover characteristics of a study area, used the Stefan equation to calculate the spatial variation characteristics of ALT in the Arctic urbanization area, and developed it into a regional probability stochastic model of ALT. Zhang and Wu (2012) and Xu et al. (2017) used the Stefan equation based on the thawing index to calculate ALT in order to analyze the permafrost region of the Qinghai-Tibet Plateau. They found that the Stefan equation could better reflect the distribution and spatial variation of ALT on the Qinghai-Tibet Plateau. Cai et al. (2020) used the Stefan equation to simulate ALT in the pan-Arctic region. After comparing the simulation results with the observed data of monitoring stations, it was found that the results were consistent and the simulation results achieved high accuracy.
The freeze-thaw cycle of the active layer of permafrost is a complex process, which is affected by many factors. You et al. (2018) show that the ALT of permafrost in Heilongjiang Province is greatly affected by soil water content and vegetation at the annual scale, while the contribution rate of latent heat and soil water content to the long-term variation of active layer thickness is high at the inter-annual scale. Feng et al. (2016) and Zhang et al. (2013) found that in addition to vegetation conditions, snow depth and soil types also had significant effects on ALT in their studies on the permafrost of the Qinghai-Tibet Plateau. Mölders and Romanovsky (2006) and Nicolsky et al. (2007) studied the ALT in Alaska permafrost and found that the accumulation of topography and soil organic matter had a certain impact on the ALT in high latitude regions. At present, there are hundreds of research methods on spatial differentiation of geographical factors, but the statistical methods for spatial differentiation are very limited (Wang and Xu 2017). Geodetector is a statistical method that can detect the spatial differentiation of geographical factors and their driving factors. Compared with other methods, geodetector has two advantages. On the one hand, geodetector can detect both numerical data and qualitative data. On the other hand, the geodetector can also detect the interaction of two influencing factors on the dependent variable. As long as there is a relationship, it can be displayed through the geodetector (Xu and Bao 2022). Geodector is widely used in research studies related to ecological environment changes and social and economic development (Xie et al., 2020; Guo et al., 2021; Xu and Bao 2022). For example, Heihe-Tengchong Line. The core idea of this method is that if an independent variable has an important influence on a dependent variable, then the spatial distribution of the independent variable and the dependent variable should also be similar (Dong et al., 2017; Xu et al., 2021; Chen et al., 2022).
Although many research studies have shown that the Stefan equation has achieved good results in the estimation of ALT, there are few studies on the application of the Stefan equation to study ALT in the DHLP. Its applicability in the DHLP needs to be further studied. In this study, the MODIS LST product combined with the Stefan equation was used to simulate ALT in the DHLP, and the factor detection and interaction detection functions of geodetector were used to analyze the factors affecting the spatial differentiation of the ALT in the DHLP. The results obtained will be helpful to the application and promotion of the Stefan equation in studying the DHLP and in achieving accurate mapping of ALT for a large area. Moreover, clarifying the spatial differentiation characteristics and influencing mechanisms of ALT can provide reference for the formulation of ecological environmental protection and engineering construction policies in cold regions.
2 Data and method
2.1 Study area
The study area was located at the southeastern margin of the Eurasian tundra (50°12′N–53°34′N, 121°08′E–127°01′E), with an area of about 8.3×10⁴ km2, bordering Russia in the north and connected to Hulun Buir City of Inner Mongolia in the southwest, and straddling Inner Mongolia and the Heilongjiang Province. Due to the complex terrain, high latitude and far away from the ocean, controlled by the Mongolian high pressure, it belongs to the cold temperate continental monsoon climate, with obvious mountain climate characteristics. The annual average temperature is −2°C to −5°C in the southeast, 5°C to −7°C in the north, and the extreme minimum temperature is −52.3°C, which is the lowest temperature record in China. Annual precipitation from south to north from 500 to 700 mm reduced to less than 200 mm (Guo et al., 2017). A large area of continuous permafrost is distributed in the study area, compared with high elevation permafrost, the DHLP permafrost is more susceptible to climate warming (Zhang et al., 2021). The main land cover type is forest (Figure 1).
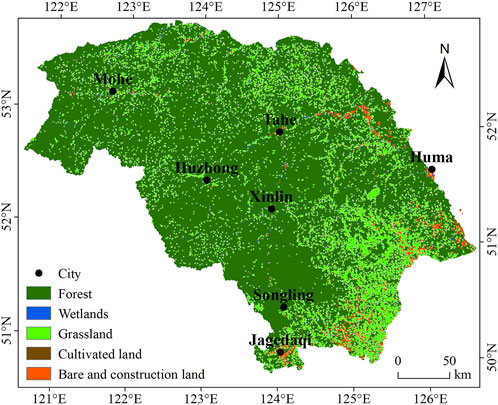
FIGURE 1. Study area.
2.2 Data
2.2.1 Temperature data
The temperature data used in this study was from the MODIS 8-day land surface temperature (LST) product (MOD11A2). The year of data acquisition was 2019, and the spatial resolution used was 1 km. In this paper, LST data were mainly used to calculate the ground surface thawing index (GTI). After preprocessing the LST data, the following formula was used to calculate the day/night surface temperature (Cai et al., 2020):
Where LSTs is the land surface temperature (°C) and PV is the pixel value of the MOD11A2 data.
In order to verify the availability of the MOD11A2 data, the correlation analysis between the LST data of 19 meteorological stations in the DHLP and the MOD11A2 data was conducted; the correlation coefficient R2=0.85 indicated that the correlation reached a high level. Moreover, the slope of the fitted curve was close to one and passed the significance test (p <0.01). The above results showed that it is feasible to use MOD11A2 data to calculate GTI.
2.2.2 Permafrost ALT data
In this study, the permafrost data were mainly from the ALT data gathered from the circum-Arctic region and from the DHLP. Circum-Arctic ALT data were obtained from the Global Terrestrial Network for Permafrost (GTN-P). GTN-P was established in the 1990s to monitor the permafrost ALT and changes in the spatial distribution pattern of permafrost. Due to the lack of 2019 ALT data at some circum-Arctic monitoring stations, so we selected the data of 40 monitoring stations (see Supplementary File SA) in the circum-Arctic region GTN-P for this study after screening. The ALT data in the DHLP were manually measured and sampled in 2019. The spatial locations of the monitoring stations in the circum-Arctic and the sampling points in the DHLP are shown in Figure 2.
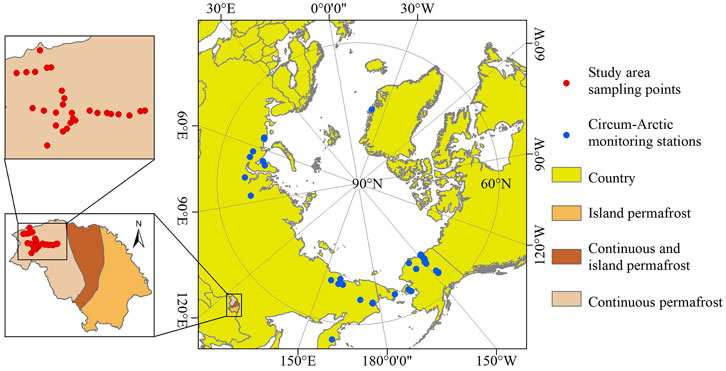
FIGURE 2. Distribution of circum-Arctic monitoring stations and sampling points in the DHLP.
2.2.3 Other data
In this study, global land cover data from the National Geomatics Center of China were obtained with a spatial resolution of 30 m (http://www.globallandcover.com/). This data was provided by China to the United Nations for its first global geographic information product for the public. Elevation data was SRTM (The Shuttle Radar Topography Mission) data obtained from the Geospatial Data Cloud (http://www. gscloud cn/) with a spatial resolution of 90 m; slope and aspect data were extracted from ArcGIS basis of elevation data. The Normalized Difference Vegetation Index (NDVI) data used had a spatial resolution of 1 km and was from the monthly NDVI data product MOD13A3 provided by the NASA website (https://www.earthdata. nasa. gov/). The snow depth data used had a spatial resolution of 0.25° and were obtained from the long-term series of daily snow depth data set in China (1979–2021) provided by the National Tibetan Plateau Data Center (http://data.tpdc.ac.cn). Data on settlements and roads were obtained from the Resource and Environmental Science and Data Center (https://www.resdc.cn/). Surface albedo (ABD), surface sensible heat flux (SSHF), surface latent heat flux (SLHF), and soil moisture (SM) data were obtained from ERA5 (https://cds.climate.copernicus.eu/) with a spatial resolution of 0.125°. The annual mean values of the above data were calculated respectively, and the resolution was uniformly resampled to 0.125°.
2.3 Methodology
2.3.1 Calculation of thawing index
Thawing index (TI) includes the air thawing index (ATI) and ground surface thawing index (GTI). GTI values were calculated from January 1 to December 31 for each year using cumulative values of GST above 0°C over days or months (using units of °C d) (Luo et al., 2018). The formula is as follows:
Where
2.3.2 Simulation of ALT
Stefan’s approximate solution method is the simplest and most commonly used method for calculating the ALT at the regional scale (Zhang et al., 1997; Zhang et al., 2005):
Where E is a new parameter containing various soil parameters, called soil factor or the E factor, kt is the thermal conductivity of thawed soil (W • m−1 •°C−1), nt is the n factor for the thawing season reflecting the relationship between the air and surface freezing/thawing index,
Peng et al. (2018) showed that the inter-annual variation of the E factor was not obvious, and most monitoring stations had a relatively constant E factor. In this study, we use the following formula to obtain the E factors:
Based on the ALT data recorded by the GTN-P monitoring station in the circum-Arctic region and the GTI of the corresponding monitoring station obtained by the MODIS land surface temperature product, the E factors of forest, cultivated land, grassland, wetlands, and construction land were calculated (Table 1). Then, ALT in the DHLP was calculated using these calculated E factors.

TABLE 1. E value of different land cover types.
2.3.3 Accuracy evaluation
In this study, we used root mean square error (RMSE) and mean absolute error (MAE) to evaluate the accuracy of the ALT simulation results. The data used to verify accuracy is DHLP sampled data.
Where Hie and Him are simulated and observed data, respectively, and N is the number of samples.
2.3.4 Pearson correlation analysis
In this study, Pearson correlation analysis method was used to calculate Pearson correlation coefficient to reflect the correlation degree of each influencing factor.
Where R is correlation coefficient; n is the number of samples; xi and yi represent the values of two variables respectively;
2.3.5 Geodetector model
In this study, factor detection and interaction detection in the Geodetector model were used to quantitatively analyze the driving factors of ALT in the DHLP and the influence of interaction between factors on ALT (Wang and Xu 2017). The factor detector can measure the extent to which the factor explains the spatial differentiation of ALT, and the explanation power of the factor is expressed as the q value. The formula is as follows:
where h = 1, ... L is the stratification of the influencing factor; Nh and N are the number of units in layer h and the study area, respectively; and
Interaction detection can identify whether the interaction between two factors increases or decreases the explanatory power of ALT. In other words, it can assess whether independent variables X1 and X2 together increase or decrease the explanatory power of the dependent variable (Y), or whether the effects of independent variables X1 and X2 on dependent variable (Y) are independent of each other (Wang and Xu 2017). There are five interaction types (Table 2).
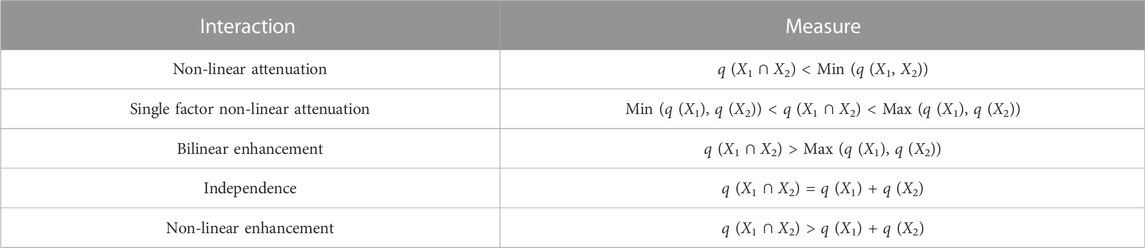
TABLE 2. Types of interaction between two factors.
3 Result
3.1 Comparison of simulated ALT with sampling points data
In order to evaluate the accuracy of the simulated ALT by the MODIS land surface temperature product and the Stefan equation in the DHLP, the ALT data of 28 study area sampling points in 2019 were compared with the simulated values. The results showed that the simulation results were in good agreement with the sampling points data (Figure 3); the determinant coefficient R2 was 0.86, the absolute error distribution range was −24.48 to 26.69 cm, the MAE was 11.25 cm, the RMSE was 13.25 cm, and the simulation accuracy reached a high level. These results support using simulated ALT to reflect the spatial distribution of ALT in the DHLP.
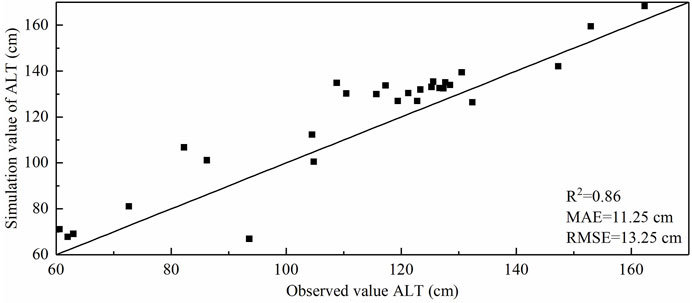
FIGURE 3. Simulated and measured values 1:1 histogram (black solid line is y=x).
3.2 Spatial distribution characteristics of ALT in the DHLP
Figure 4 shows the spatial distribution of ALT in the DHLP for 2019. The ALT in the DHLP ranged from 58.82 to 212.55 cm and showed a general trend of low in the west and high in the southeast. ALT in the eastern Mohe and Huzhong were significantly lower than that in other lower elevation regions, which indicated that elevation may be one of the influencing factors of ALT in the DHLP (Cheng et al., 2019). ALT was higher for the cultivated land and construction land, and the other three land cover types had relatively lower ALT values, among which wetlands had the lowest value. The simulation results showed (Table 3) that the average ALT in the DHLP was 138.83 cm, and the average ALT of construction land was 176.49 cm, which is significantly higher than the average ALT of the whole study area. The min ALT for construction land was 152.91 cm, while the max ALT for wetlands was only 83.70 cm; the min ALT for construction land was 69.21 cm higher than the max ALT for wetlands. The standard deviation (STD) of ALT in the whole study area was ±9.27 cm, which indicated that there was a gap in ALT among different land cover types. Even if the same land cover type was affected by local factors, there would be a certain gap. Among the five land cover types classified in this study, the gap within the wetlands was the smallest, with STD of ±4.86 cm. The gap in the construction land was the largest, with a STD of ±11.36 cm. STD of grassland, forest, and cultivated land are in the middle of the five land cover types. The STD of cultivated land (±6.22 cm) and forest (±6.90 cm) was close to each other, while that of grassland (±11.22 cm) was close to that for the whole study area.
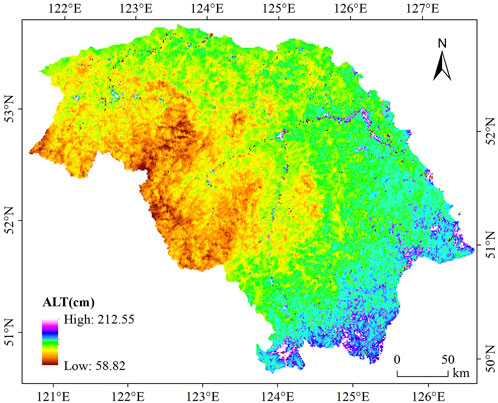
FIGURE 4. Spatial distribution of ALT in the DHLP.
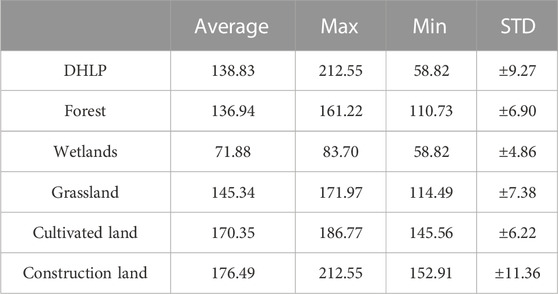
TABLE 3. ALT (cm) of different land cover types in the PRN China.
3.3 Influencing factors of ALT in the permafrost region of northeast China
In this study, 16 influencing factors such as latitude, annual mean LST, summer mean LST, winter mean LST, elevation, slope, aspect, NDVI, SM, soil type, snow depth, ABD, SLHF, SSHF, distance to settlements and distance to roads were selected for study (Figure 5). Correlation analysis and the Geodetector model (factor detection and interaction detection) were used to explore the influencing mechanism of each factor on the permafrost ALT in the DHLP.
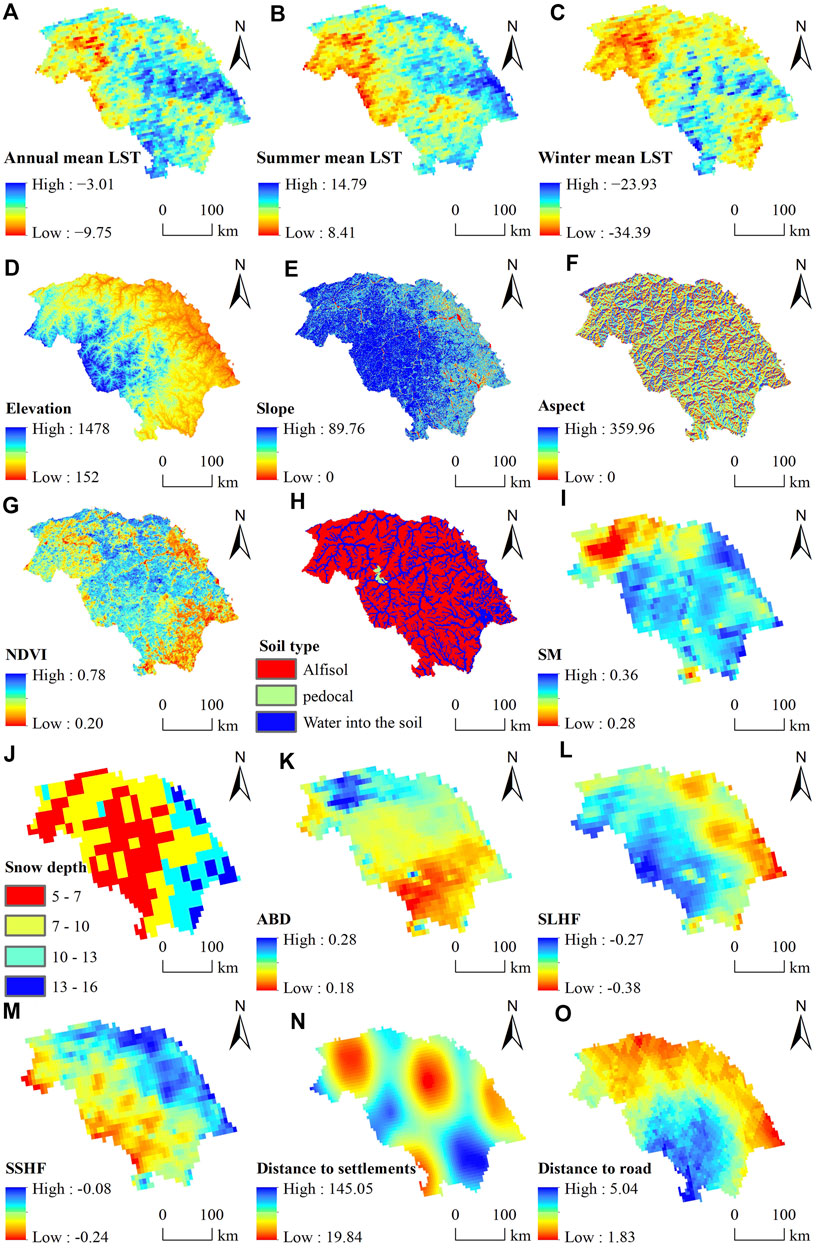
FIGURE 5. Spatial distribution of influencing factors: (A) Annual mean LST (°C), (B) summer mean LST (°C), (C) winter mean LST (°C), (D) Elevation (m), (E) Slope (°), (F) Aspect (°), (G) NDVI, (H) Soil type, (I) SM (%), (J) Snow depth (cm), (K) ABD (%), (L) SLHF (w/m2), (M) SSHF (w/m2), (N) Distance to settlements (km) and (O) Distance to roads (km).
3.3.1 Correlation between the influence factors and ALT and factor detection
It can be seen from Table 4 that most of the influencing factors are negatively correlated with ALT in the DHLP, and only annual, summer and winter mean LST, slope and SSHF show a positive correlation. Among all factors, elevation (R = −0.42) had the highest correlation, followed by summer mean LST (R = 0.40), snow depth (R = −0.40) and SLHF (R = −0.40), latitude (R = −0.39), SM (R = −0.38), etc. In addition to the above natural factors, the distance to settlements (R = −0.39) among the socioeconomic factors was also strongly correlated with ALT. It can be seen that ALT is not only affected by natural factors, but also greatly influenced by human activities, and this influence will gradually deepen with the intensification of human activities (Zhang and Wu 2012). The correlation between winter mean LST, aspect, soil type, SSHF and distance to roads and the ALT was not significant at the 99% and 95% confidence intervals.
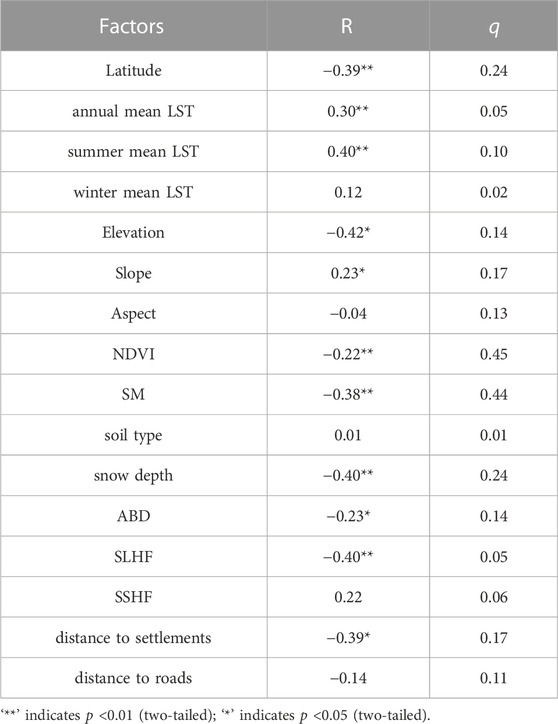
TABLE 4. Correlation coefficients and q values between influence factors and ALT.
The explanatory power q value of each factor on the spatial differentiation of ALT is shown in Table 4. As can be seen from the q value statistics of all factors, the q value of NDVI is the largest, reaching 0.45, which indicates that NDVI can explain the spatial differentiation of ALT in the DHLP to a degree of 45%, followed by SM, snow depth, latitude and distance to settlements, etc. The q values were 0.44, 0.24, 0.24 and 0.17, respectively, which can explain the spatial differentiation of ALT to a certain extent, but the explanatory power of a single factor is not obvious.
3.3.2 Interaction detection
The interaction detector of the Geodetector model can be used to detect the explanatory power of the spatial differentiation of ALT in the DHLP under the interaction of various factors. Table 5 shows the interactive detection results of ALT in the DHLP. As can be seen from the q value in the table, each detected factor is not independent, and the spatial differentiation of ALT is the result of the joint action of many factors, and a single influencing factor does not sufficiently explain the spatial differentiation of ALT.

TABLE 5. Interaction detection of each influence factor.
The 16 influencing factors selected in this study produced a total of 120 interaction detections (Table 5). After the interaction of the two factors, the explanatory power of each pair of influencing factors on ALT spatial differentiation showed an increasing trend, and the interaction q value was higher than that for a single factor. Among the 120 interaction groups, two groups had q≥0.8, 12 groups had 0.7≤q < 0.8, and 21 groups had 0.6≤q < 0.7. After factor interaction, there were two enhancement modes, most of which were non-linear enhancement (88%) and a small part of which were bilinear enhancement (12%). The average q value of the bilinear enhancement is 0.43, and the average q value of the non-linear enhancement is 0.49. In the bilinear enhancement interaction, the explanatory power of NDVI ∩ SM is the highest (0.67), followed by latitude ∩ NDVI (0.65) and NDVI ∩ distance to settlements (0.62), whose q value is above 0.6. In the non-linear enhanced interaction, the explanatory power of slope ∩ snow depth is the highest of 0.83, followed by the elevation ∩ distance to settlements (q=0.81). After the interaction detection of all the influencing factors, NDVI showed the greatest enhancement of the explanatory power of the influencing factors, followed by SM. The average q values of the interaction between NDVI, SM and the other 15 influencing factors were 0.67 and 0.64, respectively, and the explanatory power of all factors was greatly enhanced after superimposed with NDVI and SM. This indicates that NDVI and SM are the dominant factors causing the spatial differentiation of permafrost ALT in the DHLP in 2019. The above results indicate that the spatial differentiation of ALT in the DHLP is not only controlled by one factor but is the result of the joint action of many factors, and there is a complex relationship between each factor. Therefore, the interaction between these factors should be fully considered when formulating relevant ecological and environmental policies.
4 Discussion
4.1 ALT and influence factors
We found that ALT of the DHLP ranges from 58.82 to 212.55 cm, with an average thickness of 138.83 cm. Qin et al. (2017) found that the average ALT on the Qinghai-Tibet Plateau is about 230 cm. Compared with the Qinghai-Tibet Plateau, ALT in the DHLP is thinner. The reason for this gap may be related to the surface conditions. The surface vegetation on the Qinghai-Tibet Plateau is sparse, with less water storage and drier soil, which consumes less heat at the beginning of the seasonal thawing of the active layer, resulting in thicker ALT (Frauenfeld et al., 2005). Wu and Zhang (2010) also confirmed that under the same annual average temperature conditions, the soil in the Qinghai-Tibet Plateau was dry and the average ALT was higher than that in the high latitude region. In the five land cover types divided in this study, the ALT of wetland is significantly lower than that of the other four land cover types. This may be related to the higher soil water content in wetlands (Zorigt et al., 2016). Under the same conditions, soil with higher water content has higher heat capacity and slower temperature change than soil with lower water content, and the thawing process of active layer requires relatively more heat. Therefore, the ALT of wetlands is much lower than that of other land cover types (He et al., 2018). In addition, construction land has the highest ALT. In this paper, construction land mainly refers to settlements. Affected by human activities, the underlying surface properties have changed, which affects the normal infiltration of water and the process of water heat exchange in the active layer (Cai et al., 2020). Meanwhile, the active layer of permafrost absorbs both naturally occurring heat and heat generated by human activities, resulting in a thicker active layer than other land cover types (Luo et al., 2018).
In this study, the factors that have great influence on ALT in the DHLP include elevation, SLHF, summer mean LST, latitude, SM and snow depth. Lü et al. (2007) showed a significant negative correlation between SM and ALT in the Huzhong Nature Reserve, which was supported by the results obtained in this study. However, in their study, elevation was not significantly correlated with ALT, which may be related to the size of the study area and the complexity of the terrain. The Huzhong Nature Reserve with a gentle slope, and the elevation difference is between 400 and 500 m, while the elevation difference in the DHLP is 1,326 m, showing a significant difference between the Huzhong Nature Reserve and DHLP. Cheng et al. (2019) also pointed out that ALT decreases with the increase of elevation. Moreover, Lloyd et al. (2003) found in their study on the relationship between ALT and SM for permafrost in Alaska that the relationship between ALT and SM was not significant, which was different from the results of our study and the study of Lü et al. (2007), which may be a function of the different study areas investigated. Permafrost in Alaska has a continuous distribution, while the permafrost of the DHLP is a more complex type, discontinuous, and not as well developed as it is in Alaska. In terms of factors controlling permafrost development, the climate in Alaska is colder, which is more conducive to the stable existence of continuous permafrost. Additionally, the DHLP is located in the southern edge of the Northern Hemisphere permafrost zone, where the permafrost is extremely unstable and susceptible to other controlling factors, so the influence of SM on permafrost is more prominent.
There is a significant positive correlation between summer mean LST and ALT in the DHLP, while winter mean LST is not significant. This is related to the thawing time of the active layer in the study area. The thawing of active layer mainly occurs in summer, while the winter is the complete freezing period of active layer (Zhang et al., 2005). In addition, there is a significant negative correlation between snow depth and ALT, which may be related to the reflection effect of snow on solar radiation. The deeper the snow depth, the more latent heat it loses when thawing. Under the same conditions, the deeper the snow depth, the slower the thawing rate of the soil, which is more conducive to the development and preservation of permafrost, and the thinner the ALT (You et al., 2018). This also explains the negative correlation between SLHF and ALT to a certain extent. Luetschg et al. (2008) and Frauenfeld et al. (2004) also pointed out that snow depth has the strongest influence on the active layer of permafrost.
4.2 Limitations and future prospects
The Stefan equation, based on the one-dimensional heat conduction equation, is an approximate method for calculating ALT. It is assumed that all the heat absorbed by the ground is used for permafrost thawing, and the temperature change in the thawing area is linear. In reality, the heat transfer of permafrost is controlled by many factors (Li et al., 2011). This theoretical assumption brings some errors to the calculation results, which generally result in being larger than the measured values (Pang et al., 2006). In addition, this paper only calculated ALT in the DHLP in 2019, and the research period was short. Zhao et al. (2010) studies have shown that ALT may change due to the change of temperature, vegetation, and soil conditions in the current year, and there will be a gap between years. Therefore, a long-term series over many years of ALT in the DHLP should be calculated and analyzed in additional research studies to clarify the temporal variation of ALT.
5 Conclusion
In this study, the Stefan equation combined with the MODIS land surface temperature product was used to invert ALT for the DHLP. The correlation between the influencing factors and ALT was calculated, and the explanation degree of the spatial differentiation of ALT by the combination of a single influencing factor (latitude, annual mean LST, summer mean LST, winter mean LST, elevation, slope, aspect, NDVI, SM, soil type, snow depth, ABD, SLHF, SSHF, distance to settlements and distance to roads) and double influencing factors was analyzed by Geodetector. The results show that relatively thick active layer in the DHLP in 2019 was mainly distributed on the cultivated land and construction land in the southeast of the study area, while ALT is relatively thin in the forest and wetlands regions such as those found in the west. In general, ALT in the DHLP in 2019 ranges from 58.82 to 212.55 cm, with an average thickness of 138.83 cm, which was lower than that of the Qinghai-Tibet Plateau (230 cm). The most influential factor on ALT in the DHLP was elevation, followed by summer mean LST, SLHF and snow depth. Through the calculation of Geodetector, when NDVI and SM were superimposed with other factors, the explanatory power of other factors increased the most, indicating that NDVI and SM were the leading factors influencing the thickness variation of the active layer. In the future, the factors NDVI and SM should be further considered in ecological research and engineering construction projects conducted in cold regions.
Data availability statement
The original contributions presented in the study are included in the article/Supplementary Material, further inquiries can be directed to the corresponding author.
Author contributions
DZ: Writing—Original draft preparation and data analysis; ML and SZ: Methodology and Reviewing, Validation and funding support; YX and HM: Data support.
Funding
National Natural Science Foundation of China, No. 41901072; Excellent Young Scholars Program of Natural Science Foundation of Heilongjiang Provincial, No. YQ 2022D009; Joint Key Program of the NSFC and Heilongjiang Province of China, No. U20A2082.
Acknowledgments
The authors would like to thank the reviewers and the support of the Graduate Academic Forum of Harbin Normal University. Meanwhile, thank to data provider (National Geomatis Center of China, NASA, GTN-P, Geospatial Data Cloud, National Tibetan Plateau Data Center, Resource and Environmental Science and Data Center and Copernicus Open Access Hub).
Conflict of interest
The authors declare that the research was conducted in the absence of any commercial or financial relationships that could be construed as a potential conflict of interest.
Publisher’s note
All claims expressed in this article are solely those of the authors and do not necessarily represent those of their affiliated organizations, or those of the publisher, the editors and the reviewers. Any product that may be evaluated in this article, or claim that may be made by its manufacturer, is not guaranteed or endorsed by the publisher.
Supplementary material
The Supplementary Material for this article can be found online at: https://www.frontiersin.org/articles/10.3389/feart.2022.1066662/full#supplementary-material
References
Anisimov, O. A., Shiklomanov, N. I., and Nelson, F. E. (1997). Global warming and active-layer thickness: Results from transient general circulation models. Glob. Planet. Change 15 (3-4), 61–77. doi:10.1016/s0921-8181(97)00009-x
Bai, X. X., Yang, J., Tao, B., and Ren, W. (2018). Spatio-temporal variations of soil active layer thickness in Chinese boreal forests from 2000 to 2015. Remote Sens. 10 (8), 1225. doi:10.3390/rs10081225
Berggren, W. P. (1943). Prediction of temperature-distribution in frozen soils. Trans. AGU. 24 (3), 71–77. doi:10.1029/tr024i003p00071
Cai, H. Y., Han, D. R., Yang, L. S., Chen, M. L., and Yang, X. H. (2020). Spatiotemporal change in permafrost active layer thickness in the Pan- Arctic region. Natl. Remote Sens. Bull. 24 (8), 1045–1057. (in Chinese).
Cao, B., Gruber, S., Zhang, T. J., Li, L., Peng, X., Wang, K., et al. (2017). Spatial variability of active layer thickness detected by ground-penetrating radar in the Qilian Mountains, Western China. J. Geophys. Res. Earth Surf. 122 (3), 574–591. doi:10.1002/2016jf004018
Chang, Y., Lyu, S. H., Luo, S. Q., Li, Z., Fang, X., Chen, B., et al. (2018). Estimation of permafrost on the Tibetan Plateau under current and future climate conditions using the CMIP5 data. Int. J. Climatol. 38 (15), 5659–5676. doi:10.1002/joc.5770
Chapin, F. S., Sturm, M., Serreze, M. C., McFadden, J. P., Key, J. R., Lloyd, A. H., et al. (2005). Role of land-surface changes in Arctic summer warming. science 310 (5748), 657–660. doi:10.1126/science.1117368
Chen, Y., Zhou, Y. Q., Ciren, N., Zhang, H. F., Wang, C. H., Deji, G., et al. (2022). Spatiotemporal variations of surface ozone and its influencing factors across tibet: A geodetector-based study. Sci. Total Environ. 813, 152651. doi:10.1016/j.scitotenv.2021.152651
Cheng, G. D., Zhao, L., Li, R., Wu, X. D., Sheng, Y., Hu, G., et al. (2019). Characteristic, changes and impacts of permafrost on Qinghai-Tibet Plateau. Chin. Sci. Bull. 64, 2783–2795. (in Chinese). doi:10.1360/tb-2019-0191
Dong, Y. X., Xu, Q., Yang, R., Xu, C. D., and Wang, Y. Y. (2017). Delineation of the northern border of the tropical zone of China’s mainland using Geodetector. Acta Geogr. Sin. 72 (1), 135–147. (in Chinese). doi:10.11821/dlxb201701011
Du, E., Zhao, L., Wu, T. H., Li, R., Yue, G., Wu, X., et al. (2016). The relationship between the ground surface layer permittivity and active-layer thawing depth in a Qinghai–Tibetan Plateau permafrost area. Cold Reg. Sci. Technol. 126, 55–60. doi:10.1016/j.coldregions.2016.03.006
Feng, Y. Q., Liang, S. H., Wu, Q. B., Chen, J. W., Tian, X., and Wu, P. (2016). Vegetation responses to permafrost degradation in the Qinghai-Tibetan Plateau. J. Beijing Normal Univ. Sci. 52 (3), 311–316. (in Chinese). doi:10.16360/j.cnki.jbnuns.2016.03.010
Frauenfeld, O. W., Zhang, T., Barry, R. G., and Gilichinsky, D. (2004). Interdecadal changes in seasonal freeze and thaw depths in Russia. J. Geophys. Res. 109 (D5), D05101. doi:10.1029/2003jd004245
Frauenfeld, O. W., Zhang, T. J., and Serreze, M. C. (2005). Climate change and variability using European centre for medium-range weather forecasts reanalysis (ERA-40) temperatures on the Tibetan plateau. J. Geophys. Res. 110 (2), D02101. doi:10.1029/2004jd005230
Guo, D. L., and Wang, H. J. (2017). Simulated historical (1901–2010) changes in the permafrost extent and active layer thickness in the Northern Hemisphere. J. Geophys. Res. Atmos. 122 (22), 12285–12295. doi:10.1002/2017jd027691
Guo, F. Y., Tong, L. J., Qiu, F. D., and Li, Y. M. (2021). Spatio-temporal differentiation characteristics and influencing factors of green development in the eco-economic corridor of the Yellow River Basin. Acta Geogr. Sin. 76 (3), 726–739. (in Chinese). doi:10.11821/dlxb202103016
Guo, J. T., Hu, Y. M., Xiong, Z. P., Yan, X. L., Ren, B. H., and Bu, R. C. (2017). Spatiotemporal variations of growing-season NDVI and response to climate change in permafrost zone of Northeast China. Chin. J. Appl. Ecol. 28 (8), 2413–2422. (in Chinese). doi:10.13287/j.1001-9332.201708.005
He, R. X., Jin, H. J., Chang, X. L., Wang, Y. P., and Wang, L. Z. (2018). Freeze-thaw processes of active-layer soils in the nanweng'he River National natural Reserve in the da xing'anling mountains, northern northeast China. Sci. Cold Arid Regions 10 (2), 104–113. doi:10.3724/SP.J.1226.2018.00104
Hinzman, L. D., Bettez, N. D., Bolton, W. R., Chapin, F. S., Dyurgerov, M. B., Fastie, C. L., et al. (2005). Evidence and implications of recent climate change in northern Alaska and other arctic regions. Clim. change 72 (3), 251–298. doi:10.1007/s10584-005-5352-2
Hou, C. M., Xie, F. J., Li, X. Z., and Xiao, D. N. (2010). Changes of permafrost active layer in greater khingan mountains under fire disturbance. J. Univ. Jinan(Science Technol.) 24 (3), 277–281. (in Chinese). doi:10.3969/j.issn.1671-3559.2010.03.014
Hu, G. J., Zhao, L., Wu, X. D., Li, R., Wu, T. H., Pang, C. W., et al. (2017). Comparison of the thermal conductivity parameterizations for a freeze-thaw algorithm with a multi-layered soil in permafrost regions. Catena 156, 244–251. doi:10.1016/j.catena.2017.04.011
Jeong, J. H., Kug, J. S., Kim, B. M., Min, S. K., Linderholm, H. W., Ho, C. H., et al. (2012). Greening in the circumpolar high-latitude may amplify warming in the growing season. Clim. Dyn. 38 (7), 1421–1431. doi:10.1007/s00382-011-1142-x
Jia, Y. Y., Kim, J. W., Shum, C. K., Lu, Z., Ding, X., Zhang, L., et al. (2017). Characterization of active layer thickening rate over the northern Qinghai-Tibetan plateau permafrost region using ALOS interferometric synthetic aperture radar data, 2007–2009. Remote Sens. 9 (1), 84. doi:10.3390/rs9010084
Klene, A. E. (2005). Urbanization, climate, and frozen ground in Barrow, Alaska. United States: University of Delaware.
Li, R., Zhao, L., Ding, Y. J., Wang, Y. X., Du, E. J., Liu, G. Y., et al. (2011). Impact of surface energy variation on thawing processes within active layer of permafrost. J. Glaciol. Geocryol. 33 (6), 1235–1242. (in Chinese). doi:10.7522/j.issn.1000-0240.2011.0166
Li, R., Zhao, L., Ding, Y. J., Wu, T., Xiao, Y., Du, E., et al. (2012). Temporal and spatial variations of the active layer along the Qinghai-Tibet Highway in a permafrost region. Chin. Sci. Bull. 57 (35), 4609–4616. doi:10.1007/s11434-012-5323-8
Lloyd, A. H., Yoshikawa, K., Fastie, C. L., Hinzman, L., and Fraver, M. (2003). Effects of permafrost degradation on woody vegetation at arctic treeline on the Seward Peninsula, Alaska. Permafr. Periglac. Process. 14 (2), 93–101. doi:10.1002/ppp.446
Lü, J. J., Li, X. Z., Hu, Y. M., Wang, X. W., Liu, H. J., and Bing, L. F. (2007). Factors affecting the thickness of permafrost's active layer in Huzhong National Nature Reserve. Chin. J. Ecol. (9), 1369–1374. (in Chinese).
Luetschg, M., Lehning, M., and Haeberli, W. (2008). A sensitivity study of factors influencing warm/thin permafrost in the Swiss Alps. J. Glaciol. 54 (187), 696–704. doi:10.3189/002214308786570881
Luo, D. L., Jin, H. J., Marchenko, S. S., and Romanovsky, V. E. (2018). Difference between near-surface air, land surface and ground surface temperatures and their influences on the frozen ground on the Qinghai-Tibet Plateau. Geoderma 312, 74–85. doi:10.1016/j.geoderma.2017.09.037
Mölders, N., and Romanovsky, V. E. (2006). Long-term evaluation of the Hydro-Thermodynamic Soil-Vegetation Scheme's frozen ground/permafrost component using observations at Barrow, Alaska. J. Geophys. Res. 111 (4), D04105. doi:10.1029/2005jd005957
Nelson, F. E., Anisimov, O. A., and Shiklomanov, N. I. (2001). Subsidence risk from thawing permafrost. Nature 410 (6831), 889–890. doi:10.1038/35073746
Nelson, F. E., Shiklomanov, N. I., Mueller, G. R., Hinkel, K. M., Walker, D. A., and Bockheim, J. G. (1997). Estimating active-layer thickness over a large region: Kuparuk River basin, Alaska, USA. Arct. Alp. Res. 29 (4), 367–378. doi:10.2307/1551985
Nicolsky, D. J., Romanovsky, V. E., Alexeev, V. A., and Lawrence, D. M. (2007). Improved modeling of permafrost dynamics in a GCM land-surface scheme. Geophys. Res. Lett. 34 (8), L08501. doi:10.1029/2007gl029525
Pang, Q. Q., Li, S. X., Wu, T. H., and Zhang, W. G. (2006). Simulated distribution of active layer depths in the frozen ground regions of Tibetan plateau. J. Glaciol. Geocryol. (3), 390–395. (in Chinese). doi:10.3969/j.issn.1000-0240.2006.03.014
Peng, X. Q., Zhang, T. J., Frauenfeld, O. W., Wang, K., Luo, D., Cao, B., et al. (2018). Spatiotemporal changes in active layer thickness under contemporary and projected climate in the Northern Hemisphere. J. Clim. 31 (1), 251–266. doi:10.1175/jcli-d-16-0721.1
Qin, Y. H., Wu, T. H., Zhao, L., Wu, X., Li, R., Xie, C., et al. (2017). Numerical modeling of the active layer thickness and permafrost thermal state across Qinghai-Tibetan Plateau. J. Geophys. Res. Atmos. 122 (21), 11604–11620. doi:10.1002/2017jd026858
Schuur, E. A., Bockheim, J., Canadell, J. G., Euskirchen, E., Field, C. B., Goryachkin, S. V., et al. (2008). Vulnerability of permafrost carbon to climate change: Implications for the global carbon cycle. BioScience 58 (8), 701–714. doi:10.1641/B580807
Screen, J. A., and Simmonds, I. (2010). The central role of diminishing sea ice in recent Arctic temperature amplification. Nature 464 (7293), 1334–1337. doi:10.1038/nature09051
Serreze, M. C., Walsh, J. E., Chapin, F. S., Osterkamp, T., Dyurgerov, M., Romanovsky, V., et al. (2000). Observational evidence of recent change in the northern high-latitude environment. Clim. change 46 (1), 159–207. doi:10.1023/a:1005504031923
Shen, Y. P., Zuo, R. F., Liu, J. K., Tian, Y., and Wang, Q. (2018). Characterization and evaluation of permafrost thawing using GPR attributes in the Qinghai-Tibet Plateau. Cold Reg. Sci. Technol. 151, 302–313. doi:10.1016/j.coldregions.2018.03.028
Shiklomanov, N., and Nelson, F. (1999). Analytic representation of the active layer thickness field, Kuparuk River Basin, Alaska. Ecol. Model. 123 (2-3), 105–125. doi:10.1016/s0304-3800(99)00127-1
Stefan, J. (1891). Über die Theorie der Eisbildung, insbesondere über die Eisbildung im Polarmeere. Ann. Phys. 278 (2), 269–286. doi:10.1002/andp.18912780206
Tian, K. M., Liu, J. S., Kang, S. C., Campbell, I. B., Zhang, F., Zhang, Q., et al. (2009). Hydrothermal pattern of frozen soil in Nam Co lake basin, the Tibetan Plateau. Environ. Geol. 57 (8), 1775–1784. doi:10.1007/s00254-008-1462-2
Wang, C. H., Jin, S. L., Wu, Z. Y., and Cui, Y. (2009). Evaluation and application of the estimation methods of frozen (thawing) depth over China. Adv. Earth Sci. 24 (2), 132–140. (in Chinese). doi:10.3321/j.issn:1001-8166.2009.02.003
Wang, J. F., and Xu, C. D. (2017). Instrumental networking and social network building: How horizontal networking and upward networking create social capital. Acta Psychol. Sin. 72 (1), 116–134. (in Chinese). doi:10.3724/sp.j.1041.2017.00116
Wu, Q. B., and Zhang, T. J. (2010). Changes in active layer thickness over the Qinghai-Tibetan Plateau from 1995 to 2007. J. Geophys. Res. 115 (D9), D09107. doi:10.1029/2009jd012974
Xie, Z. X., Qin, Y. C., Li, Y., Shen, W., Zheng, Z., and Liu, S. (2020). Spatial and temporal differentiation of COVID-19 epidemic spread in mainland China and its influencing factors. Sci. Total Environ. 744, 140929. doi:10.1016/j.scitotenv.2020.140929
Xu, L., Du, H. R., and Zhang, X. L. (2021). Driving forces of carbon dioxide emissions in China’s cities: An empirical analysis based on the geodetector method. J. Clean. Prod. 287, 125169. doi:10.1016/j.jclepro.2020.125169
Xu, M. T., and Bao, C. (2022). Quantifying the spatiotemporal characteristics of China's energy efficiency and its driving factors: A super-RSBM and geodetector analysis. J. Clean. Prod. 356, 131867. doi:10.1016/j.jclepro.2022.131867
Xu, X. M., Wu, Q. B., and Zhang, Z. Q. (2017). Responses of active layer thickness on the Qinghai-Tibet Plateau to climate change. J. Glaciol. Geocryol. 39 (1), 1–8. (in Chinese).
Yang, K., and Wang, C. H. (2019). Water storage effect of soil freeze-thaw process and its impacts on soil hydro-thermal regime variations. Agric. For. Meteorol. 265, 280–294. doi:10.1016/j.agrformet.2018.11.011
You, M. D., Li, H. B., Ge, M., and Zang, S. Y. (2018). The influence factors of permafrost active layer depth and their annual change in Heilongjiang Province. J. Glaciol. Geocryol. 40 (3), 480–491. (in chinese). doi:10.7522/j.issn.1000-0240.2018.0053
You, Q. G., Xue, X., Peng, F., Dong, S., and Gao, Y. (2017). Surface water and heat exchange comparison between alpine meadow and bare land in a permafrost region of the Tibetan Plateau. Agric. For. Meteorol. 232, 48–65. doi:10.1016/j.agrformet.2016.08.004
Zhang, T. J., Frauenfeld, O. W., Serreze, M. C., Etringer, A., Oelke, C., McCreight, J., et al. (2005). Spatial and temporal variability in active layer thickness over the Russian Arctic drainage basin. J. Geophys. Res. 110 (D16), D16101. doi:10.1029/2004jd005642
Zhang, T., Osterkamp, T., and Stamnes, K. (1997). Effects of climate on the active layer and permafrost on the North Slope of Alaska, USA. Permafr. Periglac. Process. 8 (1), 45–67. doi:10.1002/(sici)1099-1530(199701)8:1<45::aid-ppp240>3.0.co;2-k
Zhang, W., Zhou, J., Wang, G. X., Kinzelbach, W., Cheng, G. D., Ye, B. S., et al. (2013). Monitoring and modeling the influence of snow cover and organic soil on the active layer of permafrost on the Tibetan Plateau. J. Glaciol. Geocryol. 35 (3), 528–540. (in Chinese). doi:10.7522/j.issn.1000-0240.2013.0062
Zhang, Z. H., Rinke, A., and Moore, J. C. (2016). Permafrost dynamic change on the Tibetan Plateau under climatic warming since 1950s. Maejo Int. J. Sci. Technol. 10 (3), 242.
Zhang, Z. Q., Wu, Q. B., Hou, M. T., Tai, B. W., and An, Y. K. (2021). Permafrost change in northeast China in the 1950s–2010s. Adv. Clim. Change Res. 12 (1), 18–28. doi:10.1016/j.accre.2021.01.006
Zhang, Z. Q., and Wu, Q. B. (2012). Predicting changes of active layer thickness on the Qinghai-Tibet Plateau as climate warming. J. Glaciol. Geocryol. 34 (3), 505–511. (In Chinese).
Zhao, L., Liu, G. Y., Jiao, K. Q., Li, R., Qiao, Y. P., and Ping, C. L. (2010). Variation of the permafrost in the headwaters of the urumqi river in the tianshan mountains since 1991. J. Glaciol. Geocryol. 32 (2), 223–230. (in Chinese). doi:10.7522/j.issn.1000-0240.2010.0030
Keywords: active layer thickness, Geodetector, spatial differentiation, Da Hinggan Ling Prefecture, stefan equation
Citation: Zhan D, Li M, Xiao Y, Man H and Zang S (2023) Spatial differentiation and influencing factors of active layer thickness in the Da Hinggan Ling Prefecture. Front. Earth Sci. 10:1066662. doi: 10.3389/feart.2022.1066662
Received: 11 October 2022; Accepted: 30 November 2022;
Published: 20 January 2023.
Edited by:
Dongliang Luo, Northwest Institute of Eco-Environment and Resources (CAS), ChinaReviewed by:
Ruixia He, Northwest Institute of Eco-Environment and Resources (CAS), ChinaWei Shan, Northeast Forestry University, China
Copyright © 2023 Zhan, Li, Xiao, Man and Zang. This is an open-access article distributed under the terms of the Creative Commons Attribution License (CC BY). The use, distribution or reproduction in other forums is permitted, provided the original author(s) and the copyright owner(s) are credited and that the original publication in this journal is cited, in accordance with accepted academic practice. No use, distribution or reproduction is permitted which does not comply with these terms.
*Correspondence: Miao Li, bWxpQGhyYm51LmVkdS5jbg==