 Caiming Wu
 Fumin Ren
 Jing Zhu2
 Peiyan Chen
- 1State Key Laboratory of Severe Weather, Chinese Academy of Meteorological Sciences, Beijing, China
- 2Xiamen Key Laboratory of Straits Meteorology, Xiamen Meteorology Bureau, Xiamen, China
- 3Shanghai Typhoon Institute of China Meteorological Administration, Shanghai, China
This study develops a reconstructed typhoon disaster database over a longer period 1980–2018 and at higher spatial resolution by using the county-level resolution disaster records for the eight coastal provinces of China during the shorter period 2004–2013. Typhoon precipitation and wind data over the shorter period are matched to disaster data and a functional relationship is derived between typhoon meteorological impact and typhoon disaster (direct economic loss). This relationship is used to construct a disaster data set for a longer period. The basic characteristics of the reconstructed database are documented and analyzed. The above analyses show that, firstly, the reconstructed disaster data are consistent with the recorded data due to the highly significant correlation. Secondly, an appropriate reconstruction method is developed, involving three main phases: disaster data expansion for individual stations, establishment of relationships between disaster and typhoon precipitation and wind, and disaster database reconstruction. Thirdly, the annual cumulative damage shows an insignificant downward trend over time. Typhoon damage mainly occurred between July and September each year. Landfalling typhoons that moved northwestward and then turned northward always caused more severe damage in China. In general, the reconstructed disaster database can provides a data basis to typhoon risk and disaster mechanism researches.
1 Introduction
Typhoons, which means tropical cyclones (TC) in this paper, may cause significant damage to surrounding areas (Travis 2005; Pielke et al., 2008; Zahran et al., 2010). For mainland China, typhoons annually affected about 36.7 million people and caused about 254 deaths and CNY 69.5 billion direct economic losses between 2005 and 2016 (Wang et al., 2019). It is accepted internationally that typhoon disasters are generated by a combination of natural and social factors (UN/ISDR 2004; Bjarnadottir et al., 2011) which are often expressed in the form of factors associated with typhoon precipitation and winds (Chen et al., 2019), vulnerability (Cutter et al., 2003; Burton 2010) and resilience (Liu et al., 2009; Davlasheridze 2013). The coastal areas in China are easier impacted by typhoons and suffer relatively heavier damage (Xiao et al., 2011; Lu et al., 2021). The rapid economic development and the more exposure of demographic and wealth to typhoon hazards (Wu et al., 2014; Wang and Zhou, 2016) may increase the probability or severity of disasters in these areas (Dinan 2017).
Studies of the mechanisms of disasters and analysis of disaster risk require an appropriate typhoon disaster database. The establishment of statistical models relies on reliable and abundant typhoon disaster data (Lou et al., 2012; Kim et al., 2016). In addition, the historical data form an important basis for a typhoon pre-assessment model that depend on analysis of historically similar typhoons (Zhang et al., 2012; Lai, 2020). The completeness and accuracy of historical data have a major influence on the accuracy of the assessment process for both understanding and forecasting disaster cases (Downton et al., 2005; Ye et al., 2013; Wu et al., 2022).
There are a number of both international and national typhoon disaster databases. The Emergency Events Database (EM-DAT1) of the Center for Research on the Epidemiology of Disasters (CRED) includes typhoon disaster cases that fulfilled specific standards from 1900 to the present. The damage is recorded as a total in several first-level administrative regions. After the 2014, the spatial resolution of some records could reach up to the second administrative level of a country. The Spatial Hazard Events and Losses Database for the United States (SHELDUS) (Center for Emergency Management and Homeland Security 2022), which had the county (an area comparable to that of China’s third-level administrative divisions) level resolution records, was updated monthly since January 1960. Both databases have been recompiled2, and are more suitable for application than the original data. In addition, countries such as Canada and Japan, also have collected and compiled their typhoon disaster databases3,4. These databases all span more than 50 years and offer basic descriptions of where the disasters occurred.
In China, the collected disaster data in previous studies often focus on independent provinces (Lu 1995; Chen 2007; Shi et al., 2008; Chen and Liu, 2011; Lin and Yang, 2019). The systematic collection of typhoon disaster data for mainland China started in 1984 (Chen et al., 2013). The dataset was collected by the Shanghai Typhoon Institute (STI) and the National Climate Center (NCC) of the China Meteorological Administration (CMA), supported by a national “85” project and a CMA project to disseminate new technology. The data was recorded at the provincial level. In a recent study, the county level typhoon disaster data was mentioned (Lu, 2016). It was provided by the NCC and contained disaster information on the 15 provinces in China. Though this dataset was also relatively reliable, the study period and the number of provinces mentioned in the previous researches were always about 10 years and less than 15 respectively (Lu et al., 2018; Zhu et al., 2021).
In general, typhoon disaster databases with both of the characteristics of large-scale, long-term, high resolution, and widely shareable have been established for some countries. For China, the databases like those have not been mentioned in previous studies. Meanwhile, as the difficulties in obtaining disaster data for disaster assessments, it is required to reconstruct the database by utilizing the limited databases. The research in this paper reconstructs such a disaster database using historical data.
Currently, the period of the available, reliable and county-level resolution disaster records for China’s coastal areas was from 2004 to 2013. Over this period, the typhoon disaster impact (direct economic loss) is fitted through canonical correlation analysis to the typhoon wind and precipitation data (typhoon meteorological impact factor) to establish a relationship between the two, for each station. Based on this relationship, the typhoon wind and precipitation data are used to derive a typhoon disaster data set (direct economic loss) over the longer period 1980–2018. Section 2 introduces the research data and methods, including basic data processing and the procedure for reconstructing the typhoon disaster database. Section 3 documents and evaluates the reconstructed disaster results. Section 4 analyses the basic features of the database. Section 5 summarizes and discusses the results.
2 Data and methodology
2.1 Data sources
(1) To achieve refinement and objectivity for disaster assessment, we focused more on selecting dataset with higher resolution. Due to the difficulty of data acquisition and the time span of the county level records for each province, only 2,346 reliable disaster records at the county level for eight coastal provinces (Shandong, Jiangsu, Shanghai, Zhejiang, Fujian, Guangdong, Guangxi, and Hainan) from 2004 to 2013 were applied in this study. Each disaster record is a non-zero damage record, which includes the county name where the typhoon disaster occurred and the name of the corresponding typhoon case. In this paper, one damage factor, direct economic loss (DEL), was chosen to describe the severity of the disaster.
(2) The National Meteorological Information Center (NMIC) of China Meteorological Administration (CMA) provided observed daily precipitation for the 24-h commencing at 1200 UTC and maximum 2-min average wind speed at 10 m above the surface at 1-h interval for the 505 meteorological stations that match with the 505 county-level regional areas (Figure 1) according to the name and location of stations (i.e., one county simply corresponds to only one meteorological station). Actually, daily maximum of the wind speed data was used in this study. The missing values of wind speed data reduced significantly after 1980 (Chen, 2021). In addition, the difficulty to obtain the wind speed data and the complexity and time consumption of data processing restricted the time period of the study to 1980–2018. All data have been quality controlled (Ren et al., 2010, 2015).
(3) Historical typhoon best tracks comprised of TC position and intensity at 6-h intervals since the 1960s (Ying et al., 2014) were obtained from the Shanghai Typhoon Institute of CMA.
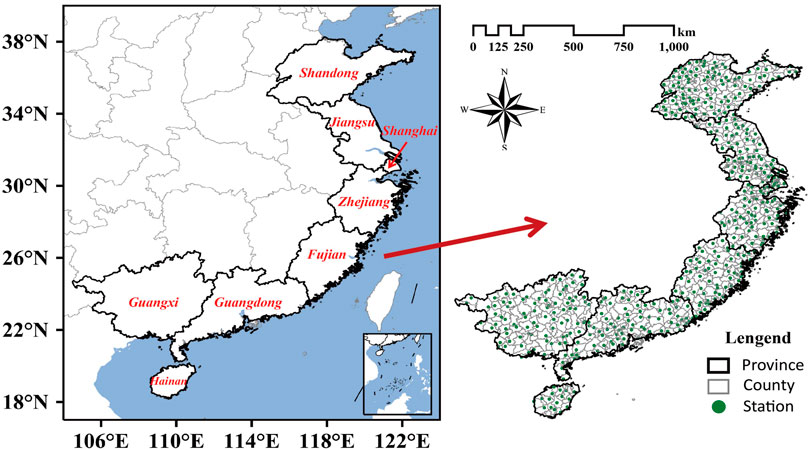
FIGURE 1. Distribution of the 8 coastal provinces in China and the 505 meteorological county-level stations.
2.2 Methods
2.2.1 Basic data processing
2.2.1.1 Adjustment for currency inflation
In order to make the values of damage comparable between different years, the influence, such as inflation or commodity price changes, need to be eliminated. The Consumer Price Index (CPI) from the National Statistics Office was chosen to adjust the damage data. This paper used 2013 as the base year.
where, P1 is a value of the fixed commodity at the current year price; P0 is a value of the fixed commodity at the base year price; CPI1 is the consumer price index at the current year price; CPI0 is the consumer price index at the base year price.
2.2.1.2 Meteorological data interpolation
The number of missing values of daily maximum 2-min average wind speed and daily precipitation data from 1980 to 2018 accounts for 16.11 and 0.49% of the number of total samples respectively, which may affect the utilization of the typhoon disaster records. In order to keep as many records as possible, and considering the continuous feature of meteorological data in time variation and spatial distribution, the inverse distance weighting (IDW) method, which can effectively solve the horizontal uneven distribution of stations, was chosen to calculate the meteorological values to replace missing values. The calculation formula is as follows:
where, w represents the power (usually 2); nn represents the number of neighbouring stations of a target station (here 10); Dis represents the distances between the target station and its neighbouring stations, p represents the meteorological values of neighbouring stations before interpolation; q represents the meteorological values of the target station obtained by interpolation. If the meteorological values of the neighbouring stations are all missing values, then the value of the target station is set to −999.
2.2.1.3 Objective synoptic analysis technique (OSAT)
In this paper, we used the OSAT (Ren et al., 2007) and the improved OSAT (Lu et al., 2016) for partitioning typhoon precipitation and wind data, respectively. For example, for typhoon precipitation, the OSAT simulates the manual separation for typhoon precipitation done by forecasters using synoptic analysis: First, the daily precipitation distribution is split into scattered raining stations and some independent rainbelts based on the structural characteristics. Second, potential typhoon rainbelts are determined based on the distance between the typhoon center and each independent rainbelt. Third, for each scattered raining station, its distance from the typhoon center or a potential typhoon rainbelt determined whether its precipitation is typhoon precipitation. Finally, the whole typhoon rainbelt is the combination of stations with typhoon precipitation and potential typhoon rainbelts with more than three stations.
There existed some unreasonable situations such as binary typhoons. Therefore, just like Typhoon Danas in 2013, a typhoon whose closest distance between the track and the mainland coastline is greater than 450 km need to be removed. In this study, the coastline is a fold line formed by connecting multiple grid points nearest to the actual coastline in a 0.5° × 0.5°latitude/longitude grid (Ren et al., 2008).
Finally, accumulative precipitation, maximum daily precipitation, and maximum 2-min average wind speed for 500 typhoons from 1980 to 2018 were achieved.
2.2.1.4 Matching meteorological data to typhoon disaster records
To facilitate the exploration of the relationship between disaster and typhoon impact factors, only cases affected by typhoon precipitation and wind at the same time are considered. To remove records with damage but without typhoon precipitation and wind, it is necessary to match meteorological data to typhoon disaster records from 2004 to 2013.
Matching was according to the location of the disasters and the name of each typhoon case. The 417 records at the county level that did not correspond to a suitable meteorological station or matched missing or zero meteorological values were discarded. Finally, the 1929 disaster records at the county level remained, which mentioned the 364 counties (from the above-mentioned 505 counties) and the 72 typhoon cases.
2.2.2 Historical disaster database reconstruction
Reconstruction was conducted station-by-station in the study area, and the reconstructed disaster datasets for these stations are aggregated to obtain the whole disaster database. Figure 2 shows the specific procedure for reconstruction, which consists of three main phases: disaster data expansion over 2004–2013 for individual station, the establishment of relationships between disaster and typhoon precipitation and wind, and the use of these derived relationships for disaster database reconstruction over the longer period 1980–2018.
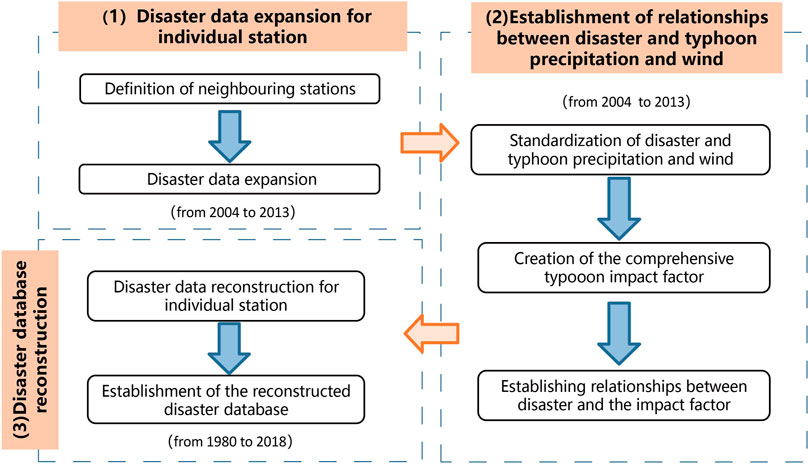
FIGURE 2. Reconstruction flowchart of the typhoon disaster database.
2.2.2.1 Disaster data expansion for individual station
The first phase (top left-hand box of Figure 2) is to expand the disaster data by extrapolating from the disaster data of nearby stations. This is conducted in two steps
2.2.2.2 Establishment of relationships between disaster and typhoon precipitation and wind
2.2.2.3 Disaster database reconstruction
3 Reconstruction results and assessment
3.1 Preliminary results and error correction
In the first phase (top left-hand box in Figure 2), the parameter D defines the threshold distance for neighbouring stations. Reconstruction experiments were carried out with D taken at 50 km intervals in the range of 150–500 km.
Table 1 gives the correlation coefficients between the 1929 individual station-based recorded damage and their corresponding reconstructed damage when the parameter D is taken to different values. All correlation coefficients passed the 0.01 significance tests. When D is 250 km or shorter, the sample size is too short to fit a proper quadratic function and the corresponding correlation coefficient cannot be calculated. The results in Table 1 show that the correlation coefficient decreases as D increases, dropping from 0.52 for D equals 300 km to 0.46 when D is 500 km. Therefore, D taken as 300 km is considered the optimal parameter scheme for the reconstruction.

TABLE 1. Correlation coefficients between reconstructed and recorded damage based on individual station with D taking a certain value, where D is a threshold for defining neighbouring stations.
For the 72 typhoon disaster cases recorded in the period 2004 to 2013, the differences between the reconstructed and recorded damage based on individual station and a typhoon case (corresponding to the damage distribution and the total damage of each typhoon disaster case, respectively) were analyzed, respectively. It is essential to point out that the disaster records only include non-zero damage. To simplify the analysis of the errors, for a typhoon case, the damage of a non-recorded individual station was set to zero.
The mean error between reconstructed and recorded damage for individual station is calculated as follows:
where, Rsta(i) and Losssta(i) are the reconstructed and recorded individual station-based damage, respectively. Num1 refers to the amount of typhoon disaster cases recorded between 2004 and 2013, which is 72 here. Meansta is the corresponding average error between the reconstructed and recorded damage for individual station.
The mean error between reconstructed and recorded damage for each station is given in Figure 3. In general, reconstructed damage is greater than recorded damage with mean errors mainly being CNY 0.50 billion or less. In central and western Hainan, the Pearl River Delta, and northern and southern of coastal Zhejiang, mean errors are more than CNY 0.50 billion. Meanwhile, in southwestern Guangxi, southern of the boundary between Guangdong and Guangxi, and the boundary between Fujian and Zhejiang, mean errors are generally between zero to CNY -0.25 billion.
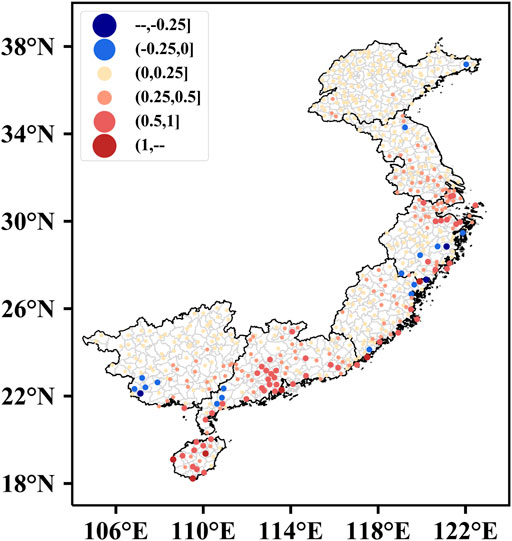
FIGURE 3. Spatial distribution of the mean error between reconstructed and recorded damage (unit: CNY 0.1 billion).
The records during 2004–2013 provide important information on the actual severity and scope of the disaster, so it is require to correct the individual station-based reconstructed damage from 1980 to 2018. The correction for each station was done by using each reconstructed damage in 1980–2018 minus the mean error of this station (given in Figure 3). The negative values of damage have been reset to zero.
Based on the above correction, the corresponding reconstructed typhoon case-based damage is further given in Figure 4. The reconstructed damage is generally larger than the corresponding recorded damage from 2004 to 2013. The average difference between the two variables is calculated using the following equation:
where, MeanTC is the mean error between reconstructed and recorded damage of the 72 typhoon cases. RTC(i) and LossTC(i) are reconstructed (the sum of the 505 corrected individual station-based damage of a typhoon case) and recorded damage based on a typhoon case, respectively. Num1 refers to the amount of typhoon disaster cases recorded between 2004 and 2013, which is 72 here.
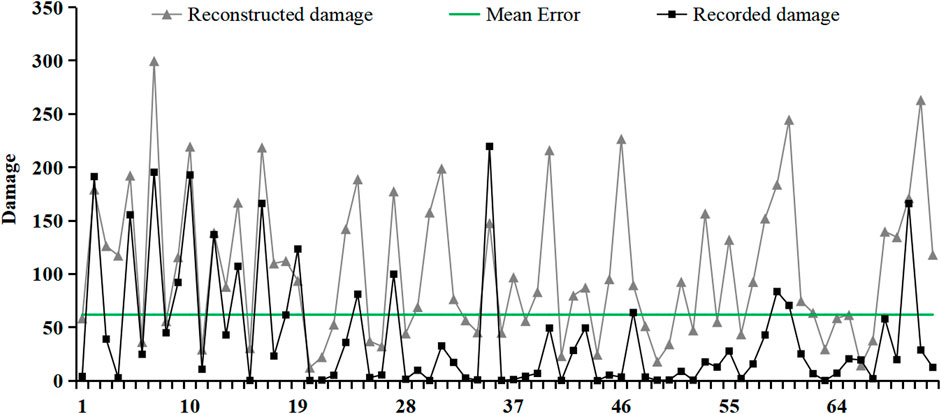
FIGURE 4. Recorded damage of typhoon cases was indicated by black points which were connected by a black line. The reconstructed damage of typhoon cases was shown by gray points and these points were connected with a gray line (unit: CNY 0.1 billion). The green line indicates the level of mean error between reconstructed damage and recorded damage of the 72 typhoon cases. It should be noted that the reconstructed damage based on individual station has been corrected here.
The mean error between reconstructed and recorded damage of the 72 typhoon cases can still reach CNY 6.18 billion, so it is essential to further correct the reconstructed typhoon case-based damage from 1980 to 2018. We can see from Figure 4, if we used the reconstructed damage of each typhoon case in 1980–2018 minus the typhoon case-based mean error, the reconstructed damage of some of the 72 typhoon cases would be negative (some gray points were below the green line in Figure 4). So for any one of the 72 typhoon cases in 2004–2013, once the corrected reconstructed damage of it was negative, the correct value would be adjusted for all typhoon cases from 1980 to 2018. The adjusted correct value is calculated as follows:
where, RTCmin is the minimum of RTC (mentioned in Eq. 8). LossRTCmin is the recorded damage corresponding to RTCmin. C is the adjusted correct value.
The correct value was adjusted to CNY 1.21 billion. The correction was achieved by using reconstructed damage of each typhoon case in 1980–2018 minus the adjusted correct value. The reconstructed data of typhoons with zero or negative reconstructed damage after the correction from 1980 to 2018 were removed. In the end, the disaster information of 442 typhoons was left.
3.2 Assessment of corrected results
The correlation coefficients between the reconstructed and recorded damage based on individual station (the number of the values is 1929) and a typhoon case (the number of the values is 72) are 0.55 and 0.65 respectively, both satisfying the 0.01 significance tests. It indicated that the reconstructed database after correction became more reasonable and accurate.
For disaster records from 2004 to 2013 (Table 2), significant differences are found (the larger value is about 10 times as large as the smaller value between two adjacent thresholds) between the individual station-based damage corresponding to the 10th, 30th, 70th, and 97th percentiles. According to the above percentile selections, thresholds 1, 2, 3, and 4 which represent the severity of the damage from low to high were obtained. According to these thresholds, non-zero individual station-based damage of the reconstructed disaster databases from 2004 to 2013 and 1980 to 2018 was divided into five intervals. The thresholds of the reconstructed databases in the two time periods were generally consistent. Compared to the 10-year disaster records, the reconstructed individual station-based damage is mostly in the range CNY (10.40–96.69) million. Thresholds 1 of reconstructed databases in different periods are all larger, which indicates that the frequency of the reconstructed damage less than or equal to CNY 1.48 million is lower. Thresholds 2 of the reconstructed database are all close to that of the records, meaning that the frequency of the reconstructed damage in the range of less than or equal to CNY 10.40 million is almost the same. Thresholds 3 and 4 are both smaller, indicating that the frequencies of the reconstructed damage in the ranges greater than CNY 96.69 million and CNY 1055.26 million are all lower.
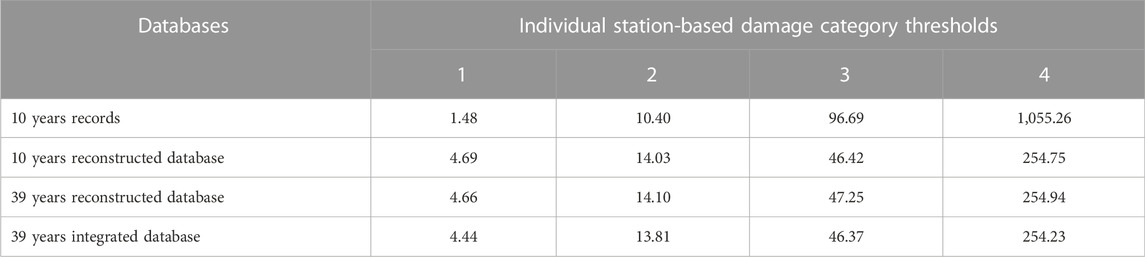
TABLE 2. Individual station-based damage category thresholds (unit: CNY 1 million). The thresholds 1, 2, 3, and 4 from small to large divide damage (greater than zero) into five intervals. For example, threshold 1 means the individual station-based damage in the lowest damage interval is less than or equal to it or the individual station-based damage in the second lowest damage interval is greater than it.
There are still relatively significant differences between recorded typhoon case-based damage corresponding to the 10th, 30th, 70th, and 97th percentiles (Table 3). Therefore, the same percentiles are chosen to obtain the damage category thresholds for typhoon case-based reconstructed damage during 2004–2013 and 1980–2018. The thresholds obtained from the reconstructed databases for the two time periods are also relatively consistent (Table 3). Compared to recorded damage, the corresponding reconstructed damage is mainly in the range of CNY (0.39–4.28) billion. For different periods of the reconstructed databases, thresholds 1 and thresholds 2 are all larger, showing that the frequencies of the reconstructed damage in the ranges less than or equal to CNY 0.02 billion and CNY 0.39 billion are all lower and the bias are more obvious in the less than or equal to CNY 0.02 billion. Thresholds 3 and 4 of the reconstructed database are larger, but, are close to that of the records, suggesting that the frequencies of the reconstructed damage in the range greater than CNY 4.28 billion and CNY 19.28 billion are slightly more.
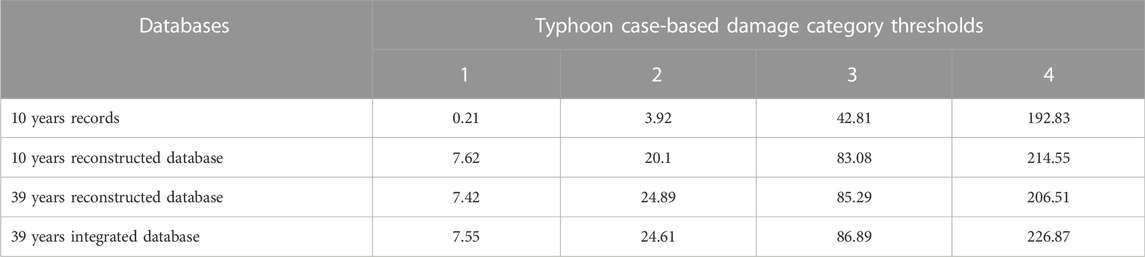
TABLE 3. Typhoon case-based damage category thresholds (unit: CNY 0.1 billion). The thresholds 1, 2, 3, and 4 from small to large divide damage (greater than zero) into five intervals. For example, thresholds 1 mean the typhoon case-based damage in the lowest damage interval is less or equal to it or the typhoon case-based damage in the second lowest damage interval is greater than it.
To realize integration between the reconstructed disaster database from 1980 to 2018 and the disaster records from 2004 to 2013, the 1929 individual station-based recorded damage was substituted for the corresponding reconstructed damage. Further typhoon case-based error corrections were conducted according to Eq. 9 and the correct value was CNY 1.20 billion. In addition, the damage frequency distribution of the integrated database is consistent with that of the reconstructed database during 1980–2018 (Tables 2, 3).
According to the damage corresponding to the 10th, 30th, 70th, and 97th percentiles in the reconstructed disaster database from 1980 to 2018, individual station-based damage and typhoon case-based damage were all divided into five categories and named in order of severity as extremely severe, severe, large, medium, and mild damage (Table 4).
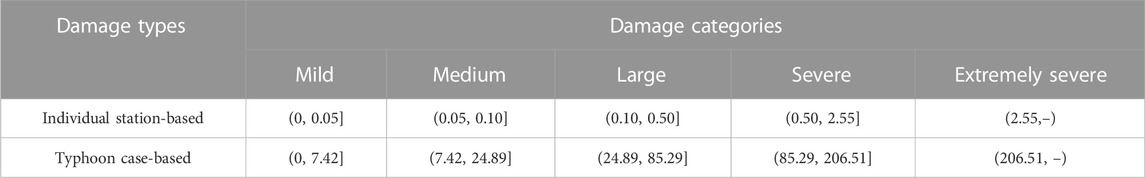
TABLE 4. Damage category standards according to reconstructed individual station-based and typhoon case-based damage from 1980–2018, respectively (unit: CNY 0.1 billion).
We analyzed the characteristics of recorded and reconstructed disaster data from 2004 to 2013. The annual cumulative damage variation of the 1929 reconstructed disaster data is highly consistent with that of the 1929 recorded disaster data (Figure 5A). The correlation coefficient between them was 0.96, which passed the 0.01 significance test. The spatial distribution of the reconstructed damage is always wider than that of the recorded damage for a typhoon case (Figure 5B), and the number of typhoon cases considered for reconstruction is also larger than 72 (Figure 5C). These cause the annual cumulative damage of the whole reconstructed disaster data of the 72 typhoons and of the whole disaster data of all reconstructed typhoon cases with non-zero damage during 2004–2013 are all more severe than that of the records (Figure 5A). In addition, the annual cumulative number of stations with damage greater than zero of the 72 typhoon cases and of all reconstructed typhoon cases with non-zero damage during 2004–2013 show upward trends (Figure 5B). The annual cumulative frequency of the 72 typhoons and of all reconstructed typhoon cases with non-zero damage during 2004–2013 also show upward trends (Figure 5C). As a result, the reconstructed annual cumulative damage of the 72 typhoon cases and of all reconstructed typhoon cases with non-zero damage during 2004–2013 all show upward trends over time (Figure 5A).
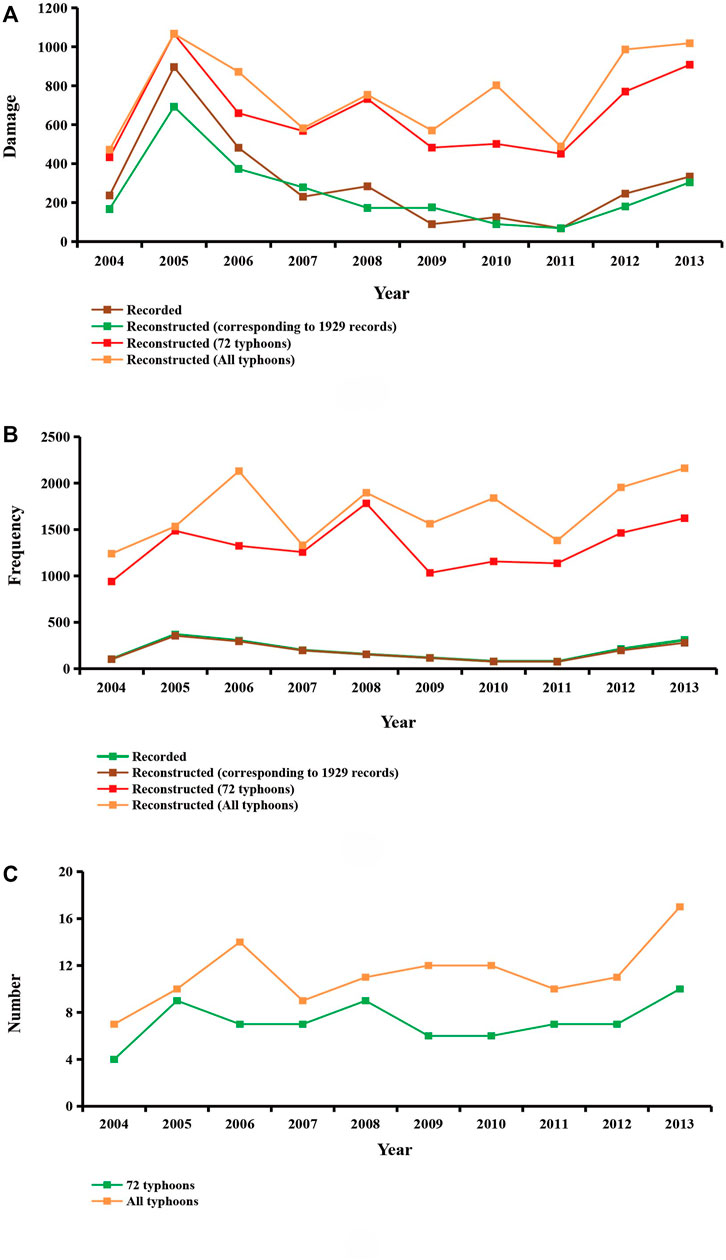
FIGURE 5. Statistics for the variations of the recorded and reconstructed disaster data from 2004–2013. (A) Annual cumulative damage (CNY 0.1 billion); (B) Annual cumulative number of stations with damage greater than zero; (C) Annual cumulative frequency of typhoons that caused damage. The reconstructed disaster data contains three types: 1) the 1929 reconstructed disaster data corresponding to the 1929 records; 2) the whole reconstructed disaster data of the 72 typhoons mentioned in the records; 3) The whole reconstructed disaster data of all reconstructed typhoon cases with non-zero damage during 2004–2013.
Different categories of reconstructed damage with no corresponding recorded damage based on individual station and a typhoon case were further analyzed from 2004 to 2013. In total, there are 15,182 additional individual station-based damage and 41 additional typhoon case-based damage during this period. For the individual station-based damage, the frequencies of the mild, medium, large, severe, and extremely severe damage are 1,752, 1,618, 8,245, 3,330, and 237, respectively. Among them, the frequency of large damage is the highest at 54.31% and the frequency of extremely severe damage is the lowest at 1.56%. The frequencies of the mild, medium, large, severe, and extremely severe damage based on a typhoon case are 8, 20, 10, 3, and 0 respectively. The largest proportion is for medium damage typhoons, at 48.78% and the smallest proportion is for extremely severe damage typhoons, at 0.00%.
Figure 6A is the average annual frequency distribution of the disaster records from 2004 to 2013. The southern of the boundary of Guangdong and Guangxi and the eastern of the boundary of Fujian and Zhejiang are the areas where disasters occur most frequently and the frequency decreases from these regions to the surrounding areas. The average annual frequency correlation coefficients between the reconstructed databases for different periods (2004–2013; 1980–2018) and records during 2004–2013 are 0.45 and 0.43 respectively, both passing the 0.01 test of significance. The results also indicate that the major frequency distribution characteristics of the records can be reflected in the reconstructed databases. However, there are differences between them: generally, the disaster average annual frequencies obtained from the reconstructed databases during different periods are all greater than that from the records and the distribution is broader. The reconstructed disaster frequencies are all significantly higher than those recorded in north-central Guangzhou and southern Fujian (Figures 6B, C).
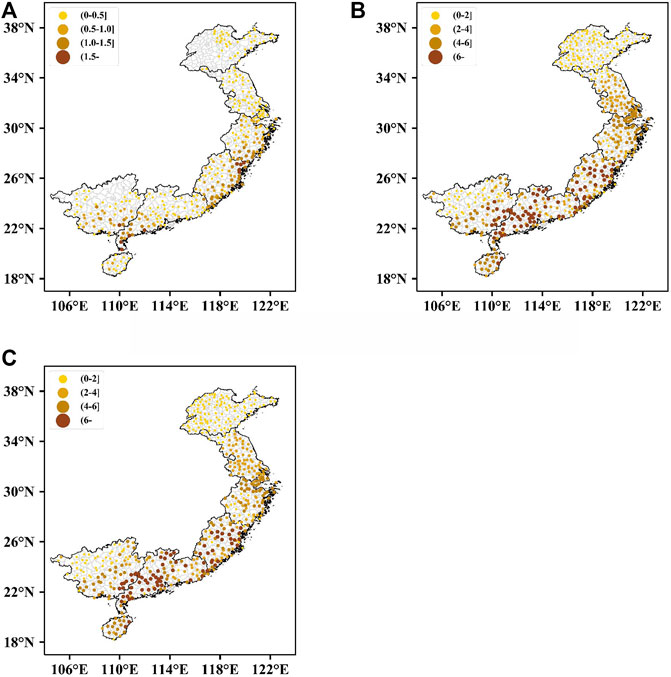
FIGURE 6. Spatial distribution of typhoon disaster average annual frequency. (A) Records from 2004 to 2013; (B) Reconstructed database from 2004 to 2013; (C) Reconstructed database from 1980 to 2018.
It should be noted that the statistical results for the reconstructed disaster databases during the two time periods are similar, particularly in spatial distributions. Due to the large threshold spans in graphs, the relatively small differences can not be reflected. Also, it does not mean that the reconstructed databases during other periods certainly have analogous distribution characteristics.
As for the spatial distribution of recorded average annual accumulative damage, the overall trend during 2004–2013 decreases from coastal to inland areas (Figure 7A). While for some inland areas, the damage can also be more severe, such as in north-central Guangdong and north-western Zhejiang. The correlation coefficients in average annual accumulative damage between the reconstructed disaster databases for different periods (2004–2013; 1980–2018) and records during 2004–2013 were 0.71 and 0.63 respectively, both passing the 0.01 significance test. The results indicated that the reconstructed databases reflect the main damage distribution characteristics of the records. However, the gradient of reconstructed damage between different categories is less obvious. More areas experienced typhoon disasters (Figures 7B, C).
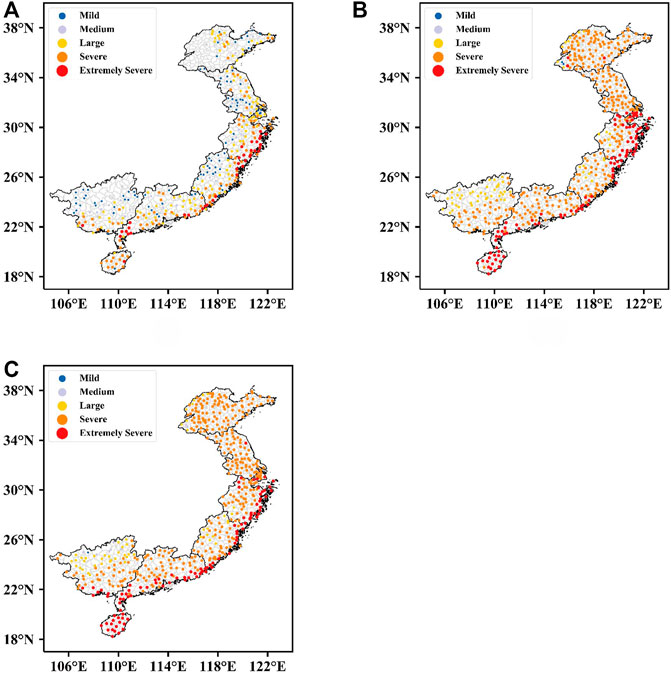
FIGURE 7. Spatial distribution of average annual accumulative damage (unit: CNY 0.1 billion). (A) Records from 2004 to 2013; (B) Reconstructed database from 2004 to 2013; (C) Reconstructed database from 1980 to 2018.
4 Basic characteristics of the reconstructed disaster database between 1980 and 2018
The basic characteristics of the established disaster database which contains 442 typhoon disaster cases from 1980 to 2018 were analyzed.
The time series of annual cumulative damage is given in Figure 8 and showed an insignificant and slight downward trend from 1980 to 2018. The annual cumulative damage presented a significant correlation with the annual cumulative frequency of typhoon disaster cases of the reconstructed disaster database and the correlation coefficient between them was 0.71. The mean annual cumulative damage was about CNY 76.13 billion. Meanwhile, the damage was the highest in 1985 at approximately CNY 159.90 billion and the lowest in 1998 at about CNY 21.10 billion.
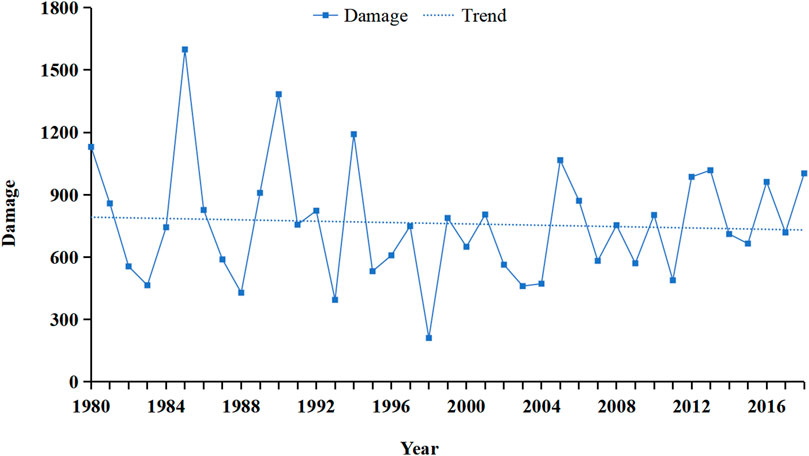
FIGURE 8. Time series of annual cumulative damage from 1980 to 2018 (unit: CNY 0.1 billion).
In addition, the results of analyzing seasonal characteristics of disasters that indicate typhoon disasters mainly occur between April and December each year and are more severe between July and September during July to September.
Table 5 presents the characteristics of typhoons in different damage categories. It shows that the heavier the damage, the greater the percentage of landfalling typhoons. The percentage of landfalling typhoons with extremely severe damage was 100.00%, while only 40.91% of typhoons with mild damage made landfall. Besides that, the percentages of landfalling typhoons with severe, large, and medium damage are 89.17%, 80.68%, and 49.44%, respectively. The average maximum intensity during the period impacted by typhoon precipitation and wind also increases with the damage severity. For example, the average maximum intensity of extremely severe damage typhoons can reach 43.69 m/s, while that of the mild damage typhoons is only 25.75 m/s. Apart from this, the intensities of typhoons with severe, medium, and mild damage are 41.03 m/s, 33.68 m/s, and 28.10 m/s, respectively. In addition, the longer the period of typhoon precipitation and wind effect, the more severe the damage.
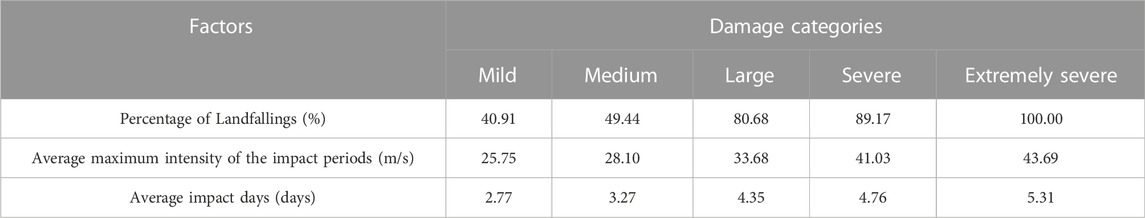
TABLE 5. Characteristics of typhoons with different damage categories from 1980 to 2018.
Figure 9 gives the tracks of sideswiping and landfalling typhoons with different damage categories. Besides the characteristics that are consistent with those described in Table 5 and Figure 9 illustrates additional features. Among the thirteen extremely severe damage-landfalling typhoons, twelve moved northwest before turning and moving northward and making landfall in the eastern China, while the remaining one moved west and made landfall in the southern China (Figure 9I). Twelve of the thirteen sidewiping typhoons with severe damage moved northwest to approach the eastern China, then turned and moved northward to affect the Bohai coastal areas, while only one moved westward to the southern China (Figure 9G). The eighteen mild damage-landfalling typhoons all moved westwards, made landfall in or around the southern China (Figure 9B), and had short tracks on land. Tracks of landfalling typhoons with medium damage a similar to that of landfalling typhoons with mild damage, and they spent more time on land (Figure 9D). The tracks of sidewiping typhoons with large damage are mainly close to the eastern China before turning northward, and the proportion of this track type decreases significantly (Figure 9E).
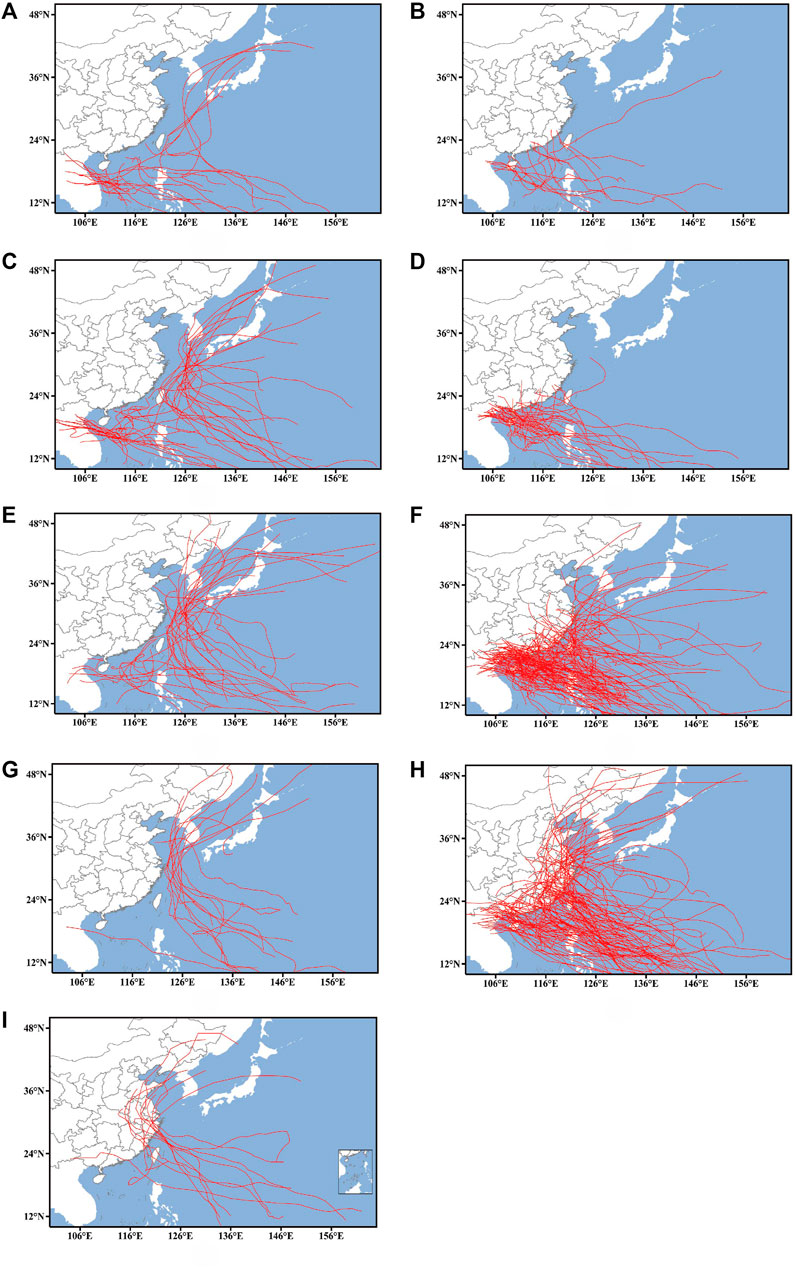
FIGURE 9. Tracks of sideswiping (A,C,E,G) and landfalling (B,D,F,H,I) typhoons with different damage categories (landfalling typhoons are based on Feng et al. (2020)). Mild damage (A,B); Medium damage (C,D); Large damage (E,F); Severe damage (G,H); Extremely severe damage (I).
In addition, among the extremely severe typhoons from 1980 to 2018, the maximum reconstructed damage was CNY 41.20 billion, caused by Typhoon Winnie (1997), while Typhoon Khanun (2005) caused minimum damage, which was CNY 20.73 billion. Similar statistics have been done by using provincial-level disaster data (Lu et al., 2021), where Typhoon Fitow (2013), Winnie (1997), and Haikui (2012) were mentioned. Chen et al. (2019) established three potential risk indexes for landfalling tropical cyclones, including IPT, IWT, and IPWT. The study presented the 10 tropical cyclones with the most potential risk under each index, including Typhoon Winnie (1997), Matsa (2005), Andy (1982), Abe (1990), and Polly (1992).
Moreover, Ren et al. (2011) summarized typical typhoon disaster cases since the 1980s. Nine of these typhoons (81.82%) are mentioned in the reconstructed disaster database and reached severe damage category or above in this study.
The reconstructed damage of typhoon cases sometimes is less than those in previous studies due to the smaller study region in this paper. For the Typhoon Herb in 1996, the accumulative precipitation during 3 days in Hubei, Henan, and Shanxi was over 500 mm (Li et al., 2001; Sun et al., 2006) and caused more than CNY 60 billion damage in inland areas. However, the damage of it in this study is about CNY 17.34 billion. Another example was Typhoon Bilis in 2006, which also caused heavy rainfall in Jiangxi and Hunan and over CNY 30 billion damage in mainland China. However, the reconstructed damage in this study is about CNY 20.65 billion.
5 Summary and discussion
The available county-level resolution typhoon disaster records for eight coastal provinces of China can be obtained only from 2004 to 2013. To provide a better data basis for typhoon disaster assessment work, this study reconstruct a longer period typhoon disaster database by using the limited records and typhoon precipitation and wind data from 1980 to 2018. The main results and conclusions are as follows:
(1) The primary result of the paper is the production of the reconstructed database that can be made available to typhoon risk and disaster mechanism researchers.
(2) The second result is the development of the methodology for reconstruction involving three main phases: disaster data expansion for individual station, establishment of relationships between disaster and typhoon precipitation and wind, and disaster database reconstruction. When the neighbouring station distance parameter D is set at 300 km, this is considered the optimal scheme to conduct reconstruction.
(3) The correlation coefficients between the reconstructed and recorded damage based on individual station and a typhoon case are 0.55 and 0.65 respectively, both significant at the 0.01 level. The spatial distributions of the average annual accumulative damage and of the average annual frequency of typhoon disaster cases in the reconstructed database are all significantly correlated with that in the records. The individual station-based and typhoon case-based damage were all classified into five categories: mild, medium, large, severe, and extremely severe.
(4) The primary features of the reconstructed typhoon disaster database are as follows. The annual cumulative damage presented a significant correlation with the annual frequency of typhoons that caused damage in this study, and it showed an insignificant and slight downward trend. Typhoon damage mainly occurred between July and September each year. For typhoons with different damage categories, the more severe damage, the higher the proportion of landfalling typhoons. All typhoons with extremely severe damage are landfalling typhoons. Additionally, the more severe the damage, the stronger the average maximum intensity during the typhoon impact period and the longer the impact time. Typhoons that moved northwestward before turning northward and making landfall in the eastern China are more likely to cause more severe damage than those that moved westward and made landfall in the southern China.
The above results show that the reconstructed disaster database is meaningful and will be useful to researchers on disaster risk and the forecasting of typhoon disasters.
In this study, the reconstruction was conducted based on the relationship between disaster and typhoon precipitation and wind. The results could be improved if other factors such as vulnerability and exposure be taken into consideration. However, no suitable resolution exposure and vulnerability data is available for this study. In the future, there is plenty of room including developing refine exposure and vulnerability data for improving the reconstruction results. In addition, only 8 coastal provinces in China are considered due to the limited available disaster data. For other regions of China, the assessment of typhoon disasters still faces great challenges.
Meanwhile, only one factor of damage, DEL, was chosen to represent the severity of the disasters caused by typhoons. In the future, the database will be further enriched by introducing more variables, such as the affected crop areas and the affected population.
Data availability statement
The original contributions presented in the study are included in the article/supplementary material, further inquiries can be directed to the corresponding author.
Author contributions
FR and CW designed the research and conceptualized the analysis. CW wrote the manuscript. FR, CW, JZ, PC, and YL were involved in helpful discussions and contributions to the manuscript.
Funding
This work was supported by National Key R&D Program Project (Grant 2019YFC1510205), National Natural Scientific Foundation of China (42275037) and the Jiangsu Collaborative Innovation Center for Climate Change.
Acknowledgments
The authors do appreciate John L. McBride for his constructive suggestions in improving the manuscript.
Conflict of interest
The authors declare that the research was conducted in the absence of any commercial or financial relationships that could be construed as a potential conflict of interest.
Publisher’s note
All claims expressed in this article are solely those of the authors and do not necessarily represent those of their affiliated organizations, or those of the publisher, the editors and the reviewers. Any product that may be evaluated in this article, or claim that may be made by its manufacturer, is not guaranteed or endorsed by the publisher.
Footnotes
1https://www.emdat.be/emdat_atlas/.
2https://www.emdat.be/guidelines;https://sheldus.asu.edu/SHELDUS/.
3The Canadian Disaster Database:https://www.publicsafety.gc.ca/cnt/rsrcs/cndn-dsstr-dtbs/.
4KITAMOTO Asanobu @National Institute of Informatics (NII): http://agora.ex.nii.ac.jp/digital-typhoon/disaster/damage/.
References
Bjarnadottir, S., Yue, L., and Stewart, M. G. (2011). A probabilistic-based framework for impact and adaptation assessment of climate change on hurricane damage risks and costs. Struct. Saf. 33 (3), 173–185. doi:10.1016/j.strusafe.2011.02.003
Burton, C. G. (2010). Social vulnerability and hurricane impact modeling. Nat. Hazards Rev. 11 (2), 58–68. doi:10.1061/(asce)1527-6988(2010)11:2(58)
Center for Emergency Management and Homeland Security (2022). Spatial hazard Events and losses database for the United States, Phoenix, Arizona. Center for Emergency Management and Homeland Security, Arizona State University.
Chen, P. Y., Lei, X. T., and Ying, M. (2013). Introduction and application of a new comprehensive assessment index for damage caused by tropical cyclones. Trop. Cyclone Res. Rev. 2 (3), 176–183. doi:10.6057/2013TCRR03.05
Chen, P. Y., Yu, H., Xu, M., Lei, X. T., and Zhang, F. (2019). A simplified index to assess the combined impact of tropical cyclone precipitation and wind on China. Front. Earth Sci. 13 (4), 672–681. doi:10.1007/s11707-019-0793-5
Chen, S. H., and Liu, X. Q. (2011). Typhoon disaster evaluation model based on discrete Hopfield neural network. J. Nat. Disasters 20 (05), 47–52. doi:10.13577/j.jnd.2011.0507
Chen, X. (2007). Risk assessment and zonation of typhoon disasters in Fujian Province. Chin. J. Ecol. 26 (6), 961–966.
Chen, Y. X. (2021). Research on the dynamical-statistical-analog ensemble forecast model for landfalling typhoon gale (DSAEF_LTG). Chengdu, China: Chengdu University of Information Technology.
Cutter, S. L., Boruff, B. J., and Shirley, W. L. (2003). Social vulnerability to environmental hazards. Soc. Sci. Q. 84 (2), 242–261. doi:10.1111/1540-6237.8402002
Davlasheridze, M. (2013). Hurricane disaster impacts, vulnerability and adaptation: Evidence from US coastal economy. United States, The Pennsylvania State University.
Dinan, T. (2017). Projected increases in hurricane damage in the United States: The role of climate change and coastal development. Ecol. Econ. 138 (C), 186–198. doi:10.1016/j.ecolecon.2017.03.034
Downton, M. W., Miller, J. Z. B., and Pielke, R. A. (2005). Reanalysis of U. S. National Weather Service flood loss database. Nat. Hazards Rev. 6 (1), 13–22. doi:10.1061/(asce)1527-6988(2005)6:1(13)
Feng, T., Ren, F. M., Zhang, D. L., Li, G. P., Qiu, W. Y., and Yang, H. (2020). Sideswiping tropical cyclones and their associated precipitation over China. Adv. Atmos. Sci. 37 (7), 707–717. doi:10.1007/s00376-020-9224-5
Hotelling, H. (1935). The most predictable criterion. J. Educ. Psychol. 2 (03), 139–142. doi:10.1037/h0058165
Kim, J. M., Woods, P. K., Park, Y. J., and Son, K. (2016). Estimating the Texas windstorm insurance association claim payout of commercial buildings from hurricane ike. Nat. Hazards 84 (1), 405–424. doi:10.1007/s11069-016-2425-7
Lai, B. B. (2020). Study on typhoon disaster loss estimation of typhoon similarity. Heilongjiang, China, Harbin Institute of Technology.
Li, Z. N., Zheng, X. J., Zhao, Y. M., and Zhang, M. Y. (2001). Generaion and development of mesoscale cloud on heavy rain belt on the periphery of typhoon 9608 (Herb). J. Trop. Meteorology 7 (1), 102–112. doi:10.3969/j.issn.1006-8775.2001.01.012
Lin, J. H., and Yang, A. M. (2019). Economic loss assessment of typhoon based on BP neural network and VSM. J. Catastrophology 34 (01), 22–26. doi:10.3969/j.issn.1000-811X.2019.01.005
Liu, D. F., Pang, L., and Xie, B. T. (2009). Typhoon disaster in China: Prediction, prevention, and mitigation. Nat. Hazards 49 (3), 421–436. doi:10.1007/s11069-008-9262-2
Lou, W. P., Chen, H. Y., Shen, X. L., Sun, K., and Deng, S. R. (2012). Fine assessment of tropical cyclone disasters based on GIS and SVM in Zhejiang Province, China. Nat. Hazards 64 (1), 511–529. doi:10.1007/s11069-012-0254-x
Lu, W. F. (1995). Assessment and prediction of disastrous losses due to tropical cyclones in Shanghai. J. Nat. Disaster 4 (3), 40–45. doi:10.13577/j.j.nd.1995.0308
Lu, Y., Zhao, H. K., Zhao, D., and Li, Q. (2021). Spatial-temporal characteristic of tropical cyclone disasters in China during 1984-2017. Acta Oceanol. Sin. 43 (06), 45–61. doi:10.12284/hyxb2021080
Lu, Y., Zhu, W., Ren, F., and Wang, X. (2016). Changes of tropical cyclone high winds and extreme winds during 1980-2014 over China. Progress. Inquisitiones De. Mutat. Clim. 12 (05), 413–421. doi:10.12006/j.issn.1673-1719.2016.030
Lu, Y. (2016). Risk assessment and regionalization of tropical cyclone disasters in Zhejiang. Nanjing (CN): Nanjing University of Information Science & Technology.
Pielke, R., Gratz, J., Landsea, C. W., Collins, D., Saunders, M. A., and Musulin, R. (2008). Normalized hurricane damage in the United States: 1900-2005. Nat. Hazards Rev. 9 (1), 29–42. doi:10.1061/(asce)1527-6988(2008)9:1(29)
Ren, F. M., Wang, X. L., Chen, L. S., and Wang, Y. M. (2008). Tropical cyclone landfalling in the mainland, Hainan and Taiwan of China and their interrelations. Acta Meteorol. Sin. 66 (02), 224–235. doi:10.3321/j.issn:0577-6619.2008.02.009
Ren, F. M., Wang, Y. M., Wang, X. L., and Li, W. J. (2007). Estimating tropical cyclone precipitation from station observations. Adv. Atmos. Sci. 24 (4), 700–711. doi:10.1007/s00376-007-0700-y
Ren, F. M., Wu, G. X., Wang, X. L., Wang, Y. M., Dong, W. J., Liang, J., et al. (2011). Tropical cyclones affecting China over the last 60 years. Beijing(CN): China Meteorological Press.
Ren, Z. H., Wang, B. M., and Liu, X. N. (2010). Quality control of meteorological observation data—Surface. Beijing, China, China Meteorological Press.
Ren, Z. H., Zhang, Z. F., Sun, C., Liu, Y. M., Li, J., Ju, X. H., et al. (2015). Development of three-step quality control system of real-time observation data from AWS in China. Meteorol. Mon. 41 (10), 1268–1277. doi:10.7519/j.issn.1000-0526.2015.10.010
Shi, R. R., Lei, Y., Wang, D. F., and Hu, B. (2008). Analysis and assessment of TC disaster influencing Zhejiang province from 1949 to 2007. Bull. Sci. Technol. 24 (05), 612–616. doi:10.3969/j.issn.1001-7119.2008.05.005
Sun, J. H., Qi, L. L., and Zhao, S. X. (2006). A study on mesoscale convective systems of the severe heavy rainfall in north China by “9608” typhoon. ACTA METEOROL. SIN. 64 (1), 57–71. doi:10.3321/j.issn:0577-6619.2006.01.006
Travis, J. (2005). Scientists' fears come true as hurricane floods new orleans. Science 309 (5741), 1656–1659. doi:10.1126/science.309.5741.1656
Un/, I. S. D. R. (2004). Living with risk: A global review of disaster reduction initiatives. Geneva(CH), Switzerland: United Nations.
Wang, H., Xu, M., Onyejuruwa, A., Wang, Y. J., Wen, S. S., Gao, A. E., et al. (2019). Tropical cyclone damages in Mainland China over 2005–2016: Losses analysis and implications. Environ. Dev. Sustain. 21 (6), 3077–3092. doi:10.1007/s10668-019-00481-7
Wang, L., and Zhou, S. F. (2016). Research on spatial feature trend of floating population in costal developed areas-based on data analyses on the fifth and sixth population cencus. J. Zhejiang Univ. Sci. Technol. 28 (02), 87–96. doi:10.3969/j.issn.1671-8798.2016.02.002
Wu, C. M., Ren, F. M., and Zhu, J. (2022). Review of researches on pre-assessment models for tropical cyclone disaster. J. Mar. Meteorology 42 (03), 13–22. doi:10.19513/j.cnki.issn2096-3599.2022.03.002
Wu, J. D., Fu, Y., Zhang, J., and Li, N. (2014). Meteorological disaster trend analysis in China: 1949-2013. J. Nat. Resour. 29 (9), 1520–1530. doi:10.11849/zrzyxb.2014.09.007
Xiao, F. J., Yin, Y. Z., Luo, Y., Song, L. C., and Ye, D. X. (2011). Tropical cyclone hazards analysis based on tropical cyclone potential impact index. J. Geogr. Sci. 21 (5), 791–800. doi:10.1007/s11442-011-0880-3
Ye, X. L., Shi, P., and Kuang, L. (2013). Typhoon disaster loss forecasting model based on particle swarm optimization and BP neural network. J. Catastrophology 28 (4), 1121–1215. doi:10.3969/j.issn.1000-811X.2013.04.003
Ying, M., Zhang, W., Yu, H., Lu, X. Q., Feng, J. X., Fan, Y. X., et al. (2014). An overview of the China Meteorological Administration tropical cyclone database. J. Atmos. Ocean. Technol. 31 (02), 287–301. doi:10.1175/JTECH-D-12-00119.1
Zahran, S., Snodgrass, J. G., Peek, L., and Weiler, S. (2010). Maternal hurricane exposure and fetal distress risk. Risk Anal. 30 (10), 1590–1601. doi:10.1111/j.1539-6924.2010.01453.x
Zhang, G. F., Zhang, J. H., Tian, G. H., Xu, X. C., and Yang, L. R. (2012). Screen. Similar Typhoon Assess. Typhoon Hazard 51 (7), 1334–1337. doi:10.3969/j.issn.0439-8114.2012.07.012
Keywords: China’s coastal area, typhoon, disaster database, county-level resolution, reconstruction
Citation: Wu C, Ren F, Zhu J, Chen P and Lu Y (2023) Reconstruction of a county-level resolution typhoon disaster database from 1980 to 2018 for China’s coastal area. Front. Earth Sci. 10:1062824. doi: 10.3389/feart.2022.1062824
Received: 06 October 2022; Accepted: 13 December 2022;
Published: 13 January 2023.
Edited by:
Jianfeng Li, Hong Kong Baptist University, Hong Kong SAR, ChinaReviewed by:
Sergio Molina-Palacios, University of Alicante, SpainShanshan Wen, Anhui Normal University, China
Copyright © 2023 Wu, Ren, Zhu, Chen and Lu. This is an open-access article distributed under the terms of the Creative Commons Attribution License (CC BY). The use, distribution or reproduction in other forums is permitted, provided the original author(s) and the copyright owner(s) are credited and that the original publication in this journal is cited, in accordance with accepted academic practice. No use, distribution or reproduction is permitted which does not comply with these terms.
*Correspondence: Fumin Ren, Zm1yZW5AMTYzLmNvbQ==