 Yongjiang Yu1
 Jingjing Liu
 Di Wu
Di Wu- 1School of Mining, Liaoning Technical University, Fuxin, China
- 2School of Mechanics and Engineering, Liaoning Technical University, Fuxin, China
Permeability is one of the most important parameters for characterizing fluid flow and production from reservoirs. In this paper, experimental studies on the percolation, permeability, and adsorption of supercritical CO2 in coal seams were carried out, taking into account the effects of injection pressure and temperature, comparing the changes in longitudinal wave velocity of specimens before and after the tests, and analyzing the permeability effect of supercritical CO2 on raw coal specimens. The test results showed that when the volume stress was 36 MPa, the permeability of supercritical CO2 in coal increased by 93%, on average, compared with that of CO2. The modified D-R model was used to fit the adsorption data, and it was found that the excess adsorption capacity of supercritical CO2 by coal decreased with increased pressure, with a maximum value of approximately 8 MPa. When the temperature increased by 10°C, the adsorption capacity decreased by 8.3%, on average. In the subcritical CO2 state, the trend of excess CO2 adsorption in coal was consistent with that of absolute adsorption, which was 16% higher than that of excess adsorption, on average. After the action of supercritical CO2, the propagation velocity of the longitudinal wave in the sample decreased significantly, indicating that supercritical CO2 can effectively promote the development of pores and fractures in the coal sample, with an obvious anti-reflection effect on the coal seam and the best permeability enhancement effect at 35°C.
Introduction
As coal resources continue to decrease, efficient mining of coal-bed methane becomes important (Jia et al., 2012). China’s coal-bed methane resources are mainly located 1,500-3,000 m underground, and existing coal-bed methane mining technology is limited by factors such as high temperature and high ground stress in deep coal seams, although these characteristics are not universal (Feng, 2008). In recent years, methods for the recovery of enhanced stored coal-bed methane using CO2 (CO2 - ECBM) have received increasing attention (Reucroft and Patel, 1986; Reucroft and Sethuraman, 1987; Qin, 2005; Wu and Zhao, 2005). This method is based on good fluidity and zero surface tension of supercritical CO2, which can not only significantly improve the recovery of coal-bed methane but also store CO2 in coal seams to reduce the greenhouse effect.
In recent years, many scholars have studied the seepage and adsorption properties of coal on CO2. (Xu et al., 2017) explored the sensitivity of the response of coal rock permeability to changes in stress by testing CO2 in the coal seam and found that the greater the stress, the less sensitive the corresponding force of coal sample permeability. Through the CO2 isothermal adsorption test, it has been found that the CO2 isothermal adsorption curve reaches a maximum value near the critical pressure (7.38 MPa) and then gradually decreases with increased adsorption pressure (Wu et al., 2019; Wu et al., 2021; Miao et al., 2022). Ma et al. (2015) studied the adsorption capacity of coal for different gases and found that the capacity for adsorption of CO2, CH4, and N2 decreased sequentially. Tang et al. (2004) confirmed the superiority of CO2 in competitive adsorption with CH4 through the experimental study of adsorption isotherms of CO2–CH4 binary gas. He et al. (2018) studied the expansion deformation of CO2 adsorption of coal bodies of different coal grades and concluded that expansion deformation decreased with increased coal grades under the same amount of CO2 adsorption. By comparing multiple adsorption models, it was found that the modified D-R model could better describe the trend of supercritical CO2 adsorption in coal (Sakurovs et al., 2007; Richard et al., 2008; Wu et al., 2018a). Sun et al. (2013) studied the seepage law of coal under the action of supercritical CO2 and demonstrated that, after the action of supercritical CO2, honeycomb-like pore cracks appeared in coal samples and permeability was significantly improved. In a CH4 experiment in supercritical CO2-flooded coal, it was found that the injection of supercritical CO2 into the coal seam can improve the recovery of CH4 and effectively seal in CO2 (Yang et al., 2012; Liang et al., 2014; Wu et al., 2018b).
Scholars at home and abroad have carried out studies of CO2 seepage and adsorption in coal seams, with results indicating that when the temperature exceeds 31.8°C and the pressure exceeds 7.38 MPa, CO2 becomes supercritical and supercritical CO2 has a specific anti-permeability effect on coal seams (Wang and Liang, 2019). Therefore, in this study, nine coal samples from the Xinqiu Mine Area, Fuxin City in the Liaoning Province, China, were tested. Seepage and adsorption experiments of supercritical CO2 injection of raw coal specimens under different injection pressures and temperatures were performed, and the anti-permeability effect of supercritical CO2 on the specimens was studied by comparing the changes in longitudinal wave velocity and permeability before and after supercritical CO2 injection.
Coal sample preparation and test device
Coal sample preparation
Coal samples were taken from the Xinqiu Mine Area, Fuxin City, Liaoning Province. Coring equipment was used to drill the core perpendicular to the bedding direction of the coal seam; the core was then cut into 50 mm*100 mm standard cylindrical specimens. The inclination of the end face was less than 0.1°, as shown in Figure 1. Nine samples with apparent integrity and no visible cracks were selected. The samples were placed in a drying oven at 105°C for 24 h and then covered with cling film after cooling. The specific parameters of the coal samples are shown in Table 1.
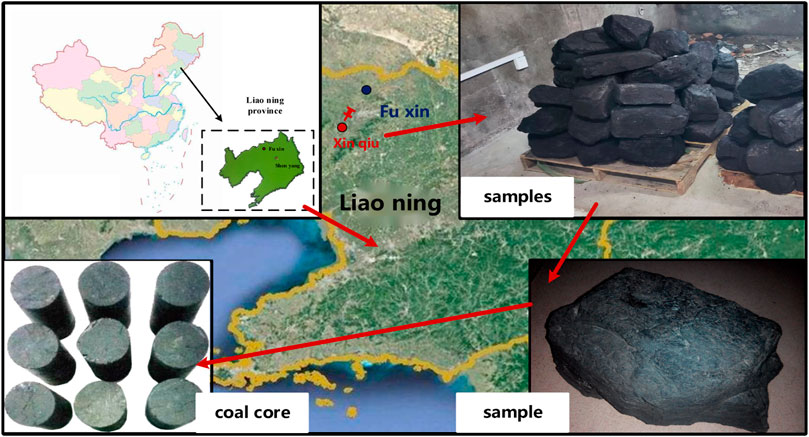
FIGURE 1. Coal samples.
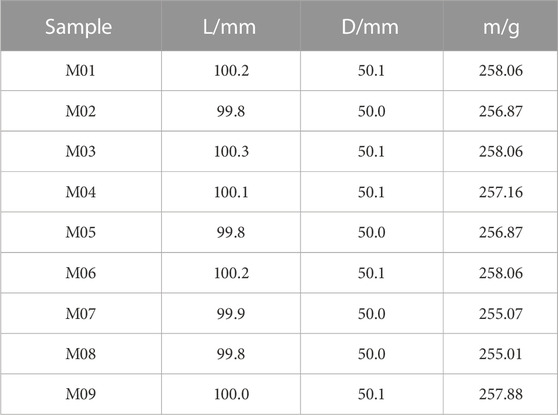
TABLE 1. Basic physical parameters of the specimen.
Experimental device
Permeability experimental device
Permeability measurement was achieved using the steady-state method. The experimental apparatus used to measure permeability is shown in Figure 2. The device included a gas supply, data acquisition, temperature control, and core holder systems. The core holder system included a triaxial core holder, pressure kettle, and flow meter. The gas supply system included high-pressure gas cylinders, booster pumps, air compressors, pressure pumps, and vacuum pumps that provided pressure for the CO2 phase transition to a supercritical state. The data acquisition system consisted of a TP700 data logger and many pressure transducers, each with an accuracy of 0.01 MPa. The temperature control system consisted of a water bath container and many temperature transducers with an accuracy of 0.1°C. The injection pressure was at least 5 MPa lower than the confining pressure to reduce the possibility of hydraulic fracturing within the shales and leakage of liquid from the gap between the rubber sleeve and the sample (Zhang and Yu, 2019).
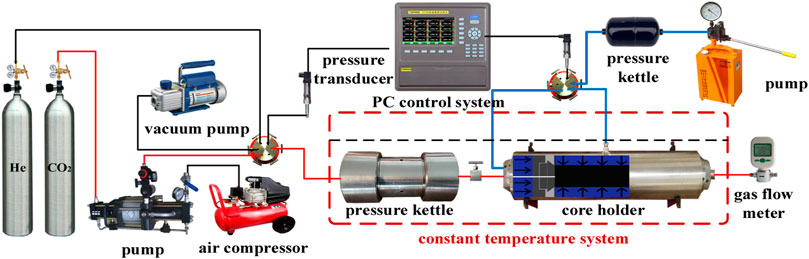
FIGURE 2. Permeability experimental device.
Adsorption experimental device
The experimental apparatus used to measure adsorption is shown in Figure 3. The device included a gas supply system, data acquisition system, temperature control system, and adsorption system. The adsorption system included two high-pressure adsorption chambers, and the pressure of the adsorption tank was 0
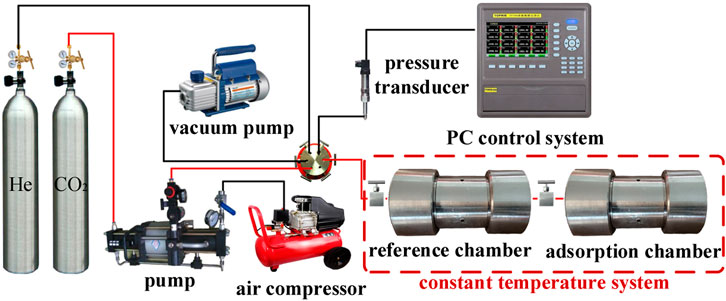
FIGURE 3. Adsorption experimental device.
Permeability experiment
Permeability model
Based on the stable upstream pressure (p1, MPa), downstream pressure (p2, MPa), and volumetric flow rate of the gas (Q, m3/s), the gas permeability was obtained from the expression (Zhao and Yu, 2017):
where K is the permeability, 10–15 m2; p0 is the standard atmospheric pressure, 0.1 MPa; L is the length of the coal sample, cm; A is the cross-sectional area of the coal sample, cm2; Z is the compressibility factor under the experimental conditions; and Za is the compressibility factor at the experimental temperature.
Permeability experiment program and steps
The permeability experiments were divided into three groups according to temperature, including 35, 45, and 55°C. The volumetric stress in the experiment was 36 MPa, the CO2 injection pressure was 4–7 MPa, and the supercritical CO2 injection pressure was 8–11 MPa. The experimental program is shown in Table 2. The specific steps were as follows:
1) The test device was connected and confirmed to be airtight. The sample was sealed with a heat shrink sleeve and put into the core holder. The water bath tank temperature was set to 35°C, and the volume stress was set to 36 MPa. After the temperature and pressure stabilized, the pore pressure was adjusted to 4 MPa by feeding CO2, and test data were recorded after allowing the flow to stabilize. Three sets of data were collected for each experimental group, and the average value was calculated.
2) After testing at one observation point, the CO2 injection pressure was gradually increased until 11 MPa, according to the experimental protocol.
3) The coal sample was replaced according to the experimental protocol, and the test temperature was increased to 45°C and then 55°C, in turn. Steps 1) and 2) were repeated, and the coal sample permeability under different test conditions was calculated using the collected data.

TABLE 2. Permeability experiment program.
Permeability experiment results and discussion
As shown in Figure 4, under the same volumetric stress, pore pressure and temperature had significant effects on the permeability of coal samples. The permeability of coal samples increased with increased pore pressure at the same temperature, and the permeability increased exponentially before the supercritical state. After the critical pressure was exceeded, the permeability had an obvious linear growth trend. By comparing the permeability of coal samples under the two carbon dioxide phase states, it was found that when the carbon dioxide reached the supercritical state, permeability was significantly improved. Comparing permeability at the three temperatures, it was found that coal permeability was highest and had the smallest decrease in permeability over time at 35°C. These results indicate that the volume of pores and cracks in the coal body was limited. With increased temperature, the expansion of the coal body skeleton gradually increases. However, due to the compressive and restrictive effects of effective stress on pore cracks, the volume of pores and fractures gradually decrease with increased expansion of the coal skeleton. The expansion of the coal skeleton will not increase indefinitely with increased temperature. As temperature increases, the rate of change of the expansion of the coal skeleton gradually decreases; i.e., the rate of change of the volume of pores and fractures will gradually decrease. On the other hand, permeability is also related to gas dynamic viscosity. From Eq. 1, the permeability is proportional to the dynamic viscosity of the gas. As shown in Figure 5, comparing the dynamic viscosity of carbon dioxide at three temperatures, it was clear that the dynamic viscosity of CO2 increased with increasing temperature before the supercritical state. The dynamic viscosity of CO2 at 35°C was significantly higher than that at 45°C and 55°C, although, with increased temperature, the viscosity of supercritical CO2 will decrease significantly. The expansion of clay minerals in the coal body plays a leading role in this process (Wu et al., 2018b); therefore, the decrease of permeability will gradually slow down.
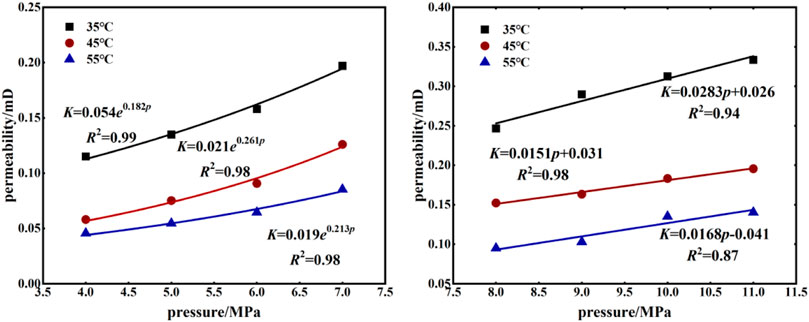
FIGURE 4. Change curves of permeability with an injection of CO2 and SC-CO2 pressure.
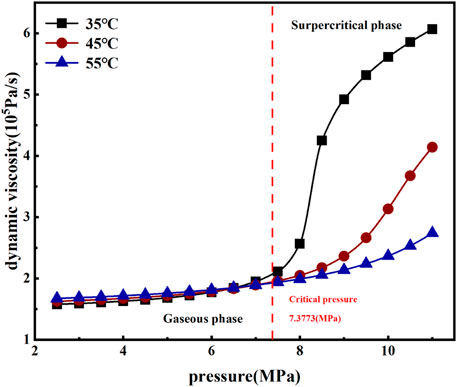
FIGURE 5. Dynamic viscosity of CO2 varies with pressure.
Adsorption experiment
Adsorption capacity model
After measuring the pressure in the adsorption system before and after adsorption equilibrium, the adsorption amount was calculated based on the change in the number of substances converted using the gas state equation. A known amount of adsorption gas was injected into the reference chamber and the adsorption chamber, and after stabilization, the reference chamber pressure, p1, and the adsorption chamber pressure, p2, were recorded. Using the gas compressibility factor equation of state:
In Eq. 2, Gc is the total mass of the coal sample, g.
Adsorption experiment program and steps
Experiments were divided into three groups according to temperatures of 35, 45, and 55°C. The CO2 pressure was gradually increased from 0 MPa to 11 MPa for a total of 11 pressure measurement points, each with a balanced time of not less than 24 h (Tang et al., 2018). The experimental program is shown in Table 3. The specific steps are as follows:
1) Coal samples that had undergone a 35°C seepage test were placed in an adsorption tank, which was heated to 35°C, and then placed in a water bath tank. Helium gas was introduced to bring the pressure in the test system to 11 MPa. Stability of gas pressure was observed for 24 h to ensure the test system was airtight.
2) The volume of free space was measured. Helium gas was passed in to achieve a pressure of 2–3 MPa, and the aforementioned steps were repeated two times. Measurement of free space volume was repeated three times. The difference between the test values of free space volume in the adsorption chamber was less than 0.1 cm3.
3) The vacuum pump was turned on to remove excess gases from the system and vacuum treatment continued for at least 12 h. When the data logger consistently displayed the same data, vacuum treatment was complete.
4) The reference chamber was filled with CO2 gas, and the reference chamber pressure after stabilization was recorded. The balance valve between the reference chamber and the adsorption chamber was opened and kept open for 12 h, and the final balance pressure was recorded. When the adsorption test of one measurement point was completed, introduction of CO2 gas was continued to allow the pressure in the test system to reach 2 MPa, and the aforementioned process was repeated. The test pressure measurement point was 11 MPa, and when the pressure in the test system reached 11 MPa, testing of the group was complete.
5) The test temperature and test specimen were changed and steps 3) and 4) were repeated. The amount of CO2 gas adsorption under different temperature conditions was calculated.
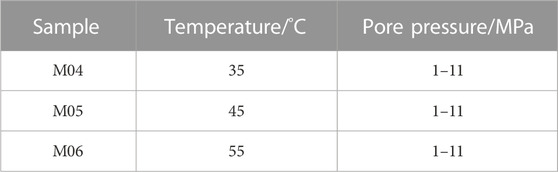
TABLE 3. Adsorption experiment program.
Adsorption experiment results and discussion
As shown in Figure 6, under different temperature conditions, the excess adsorption of CO2 by coal samples first increased with the increase of pore pressure. Then, when the pressure reached 6 MPa, the excess adsorption increase decreased significantly, and, at 7–8 MPa, the excess adsorption reached the maximum and then decreased with increased pore pressure. When the temperature was increased from 35°C to 45°C and then 55°C, the maximum excess adsorption of CO2 in coal samples decreased from 31.96, to 27.86, and 25.6 cm3/g, respectively.
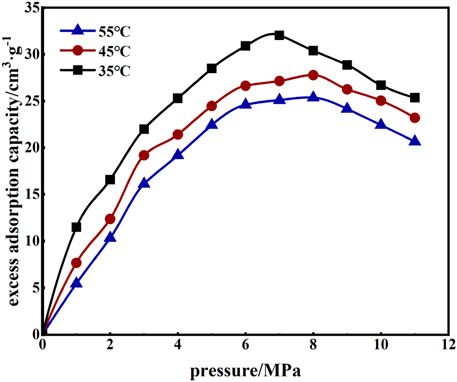
FIGURE 6. Change curves of excess CO2 adsorption with pore pressure.
From the test data, it was found that for every 10°C increase in temperature, the excess adsorption volume decreased by an average of 8.3%. These data demonstrate that with increased temperature, the CO2 molecules had more energy which, when free from the bondage of the adsorption site, resulted in a decreased amount of adsorption.
In the coal sample adsorption CO2 test, the Langmuir adsorption model is commonly used. However, when CO2 reaches a supercritical state, the Langmuir adsorption model fits poorly, and even the fit result does not converge. Therefore, the Sakurovs modified D-R model (Sakurovs et al., 2007) was used in this study, as it can be applied to the adsorption of supercritical CO2 by converting the adsorption pressure to density and adding a correction coefficient. The specific model is as follows:
where V0 is the maximum excess adsorption under ideal conditions, cm3/g; ρg is the density of the adsorbed gas at the corresponding temperature and pressure, kg/m3; ρa is the adsorption phase density, and the current common value is 1028 kg/m3 (Li et al., 2014); D and k are constants. The experimental data were collated and then fit using the model mentioned previously; the results are shown in Figure 7 and Table 4.
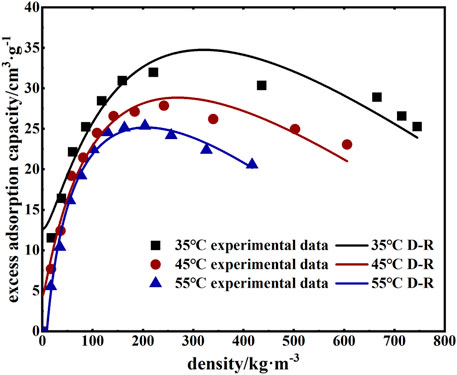
FIGURE 7. D–R model fitted curves of excess CO2 adsorption.
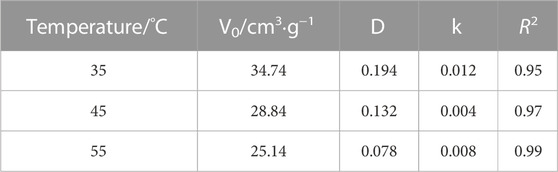
TABLE 4. D-R model fitting parameters.
The fit results demonstrated that the modified D-R model better described the adsorption of supercritical CO2 by coal, with a coefficient of determination R2 that was greater than 0.95 and increased with increasing temperature. The temperature was increased from 35°C to 45°C and then 55°C, corresponding to maximum excess adsorption of 34.74, 28.84, and 25.14 cm3/g, respectively; supercritical CO2 density of 317, 266, and 199 kg/m3, respectively; and supercritical CO2 pressure of 7–9 MPa.
Due to the high test pressure, the excess adsorption does not reflect the true adsorption of CO2 in coal (Yang et al., 2011). Therefore, the absolute adsorption amount Vap was used in this study to describe the amount of CO2 adsorption in coal and was calculated as follows (Moffat and Weale, 1955):
Under different temperature conditions, the excess adsorption of CO2 and the absolute adsorption amount of coal changed with pore pressure, as shown in Figure 8. When CO2 did not reach the supercritical state, the excess adsorption of CO2 and absolute adsorption under different temperature conditions were consistent, and the absolute adsorption was increased by an average of 16% compared with the excess adsorption (Figure 8).
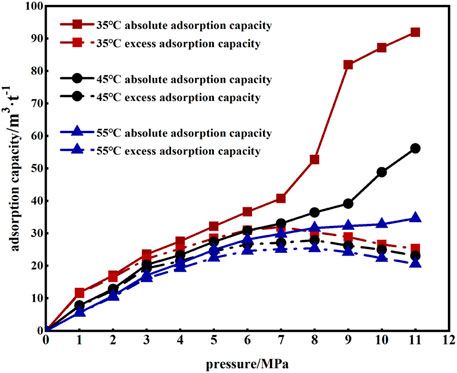
FIGURE 8. Change curves of CO2 adsorption with pore pressure.
When CO2 reached a supercritical state, the excess adsorption amount began to decrease with increased pore pressure. In contrast, the absolute adsorption amount increased with increased pore pressure, and the lower the temperature, the more obvious the increase. The supercritical CO2 pressure was 8–11 MPa, and the absolute adsorption amount was increased by an average of 214%, 79%, and 41% compared with the excess adsorption amount, respectively.
Supercritical CO2 permeability enhancement results and discussion
To better explore the permeability enhancement effect of supercritical CO2 on raw coal samples, the permeability calibration test was applied before and after CO2 treatment, and the change in ultrasonic wave velocity before and after CO2 treatment was assessed.
Permeability enhancement test
The permeability enhancement effect of supercritical carbon dioxide on coal was analyzed by comparing the N2 permeability of coal samples before and after permeability enhancement. The specific test plan is shown in Table 5, and the experimental steps are the same as those described in the Permeability experiment program and steps section. The experimental results are shown in Figure 8.

TABLE 5. Permeability enhancement experiment program.
As shown in Figure 8, the permeability of coal samples before and after permeability enhancement increased exponentially as the pore pressure increased. After using supercritical CO2 to increase the permeability of coal samples, the permeability of coal samples under the same pore pressure conditions was significantly improved, with an average increase of 53.34%. The greater the pore pressure, the greater the permeability of coal samples, indicating that supercritical CO2 had a good permeability enhancement effect on coal samples.
Changes in ultrasonic wave velocity
A non-metal detector was used to measure the propagation velocity of longitudinal waves in coal samples before and after the test, as shown in Table 6. After the action of supercritical CO2, the propagation rate of longitudinal waves in the coal sample was significantly slower, and the wave velocity decreased as humidity increased (Table 6). The propagation speed of ultrasonic waves was different in different media; specifically, the propagation speed of solid media was significantly more than that of gaseous media. After the test, the wave velocity slowed, indicating that the coal sample had either a new pore crack or expansion of the original pore crack after the supercritical CO2 action; the lower the temperature, the more obvious the effect. The aforementioned results show that supercritical CO2 promoted the development of coal-like pore fractures, improved the pore connectivity in the coal sample, changed the seepage path of the fluid in the coal sample, and increased the permeability of the sample. Additionally, supercritical CO2 at 35°C had the best enhancement effect on coal sample permeability.

TABLE 6. Comparison of P-wave velocity VP before and after being subjected to supercritical CO2.
Conclusion
1) Under the condition of constant volume stress, pore pressure and temperature had a significant impact on the permeability of the coal seam. When the pore pressure was fixed, the permeability decreased with increased temperature; when the temperature was fixed, the permeability increased with increased pore pressure. The injection of supercritical CO2 increased permeability by an average of 93% compared to the permeability of coal samples after CO2 injection.
2) Using the modified D-R model, the adsorption data were fitted and the maximum amount of excess adsorption of CO2 by coal was found to be 7–9 MPa. The temperature was increased from 35°C to 45°C and then 55°C, corresponding to maximum excess adsorption of 34.74, 28.84, and 25.14 cm3/g, respectively. For every 10°C increase in temperature, excess adsorption decreased by an average of 8.3%.
3) Excess and absolute adsorption of carbon dioxide in coal were assessed. When the CO2 did not reach the supercritical state, the excess adsorption amount and the absolute adsorption amount change trends were consistent, and the absolute adsorption amount was increased by an average of 16% compared with the excess adsorption amount. When CO2 reached a supercritical state, the excess adsorption amount began to decrease with increased pressure, and the absolute adsorption amount increased with increased pressure; the lower the temperature, the more obvious the effect.
4) In comparing the changes in coal sample permeability before and after supercritical CO2 action, it was found that after supercritical CO2 was injected into the coal sample, the pore cracks inside the sample were further developed and permeability increased by an average of 53.34%. These data indicate that supercritical CO2 had a good permeability enhancement effect on the coal seam.
5) Using a non-metallic detector to measure the change in ultrasonic wave velocity of coal samples before and after supercritical CO2 action, it was concluded that supercritical CO2 at 35°C had the best permeability enhancement effect on coal samples.
Data availability statement
The original contributions presented in the study are included in the article/Supplementary Material; further inquiries can be directed to the corresponding author.
Author contributions
YY: conceptualization. JL: data curation, writing—original draft, software. YY: investigation. DW: project administration. WZ: investigation. FM: investigation.
Funding
This study was supported by the National Natural Science Foundation of China (51974147).
Conflict of interest
The authors declare that the research was conducted in the absence of any commercial or financial relationships that could be construed as a potential conflict of interest.
Publisher’s note
All claims expressed in this article are solely those of the authors and do not necessarily represent those of their affiliated organizations, or those of the publisher, the editors, and the reviewers. Any product that may be evaluated in this article, or claim that may be made by its manufacturer, is not guaranteed or endorsed by the publisher.
References
Feng, Z. (2008). Low permeability of coal seam gas extraction the- ory and application. China, Beijing: Science Press.
He, W., Liang, W., Zhang, B., Li, Z., and Li, L. (2018). Experimental study on swelling characteristics of CO2 adsorption and storage in different coal rank China. Journal of China Coal Society. 43 (5), 1408–1415.doi:10.13225/j.cnki.jccs.2017.1138
Jia, C., Zheng, M., and Zhang, Y. (2012). Unconventional hydrocarbon resources in China and the prospect of exploration and development China. Petroleum Exploration and Development. 39 (2), 129–136.doi:10.1016/s1876-3804(12)60026-3
Li, Q., Ni, X., Wang, Y., and Gang, S. (2014). The experi- mental study on the adsorption/desorption of carbon dioxide in the coal under supercritical condition China. Coal Geology & Exploration. 42 (3), 36–39.
Liang, W., Zhang, B., Han, J., and Yang, D. (2014). Experi- mental study on coal bed displacement and recovery by super crit-ical carbon dioxide injection China. Journal of China Coal Society. 39 (8), 1511–1520.
Ma, L., Li, B., Deng, J., Li, B., and Hu, A. (2015). On the characteristic fea- tures of the adsorption capacity of the coal for the singular compo- nent gases of CH4, CO2, N2 under regular pressures China. Journal of Environment and Safety. 15 (2), 64–67.
Miao, F., Wu, D., Liu, X., Xiao, X., Zhai, W., and Geng, Y. (2022). Methane adsorption on shale under in situ conditions: Gas-in-place estimation considering in situ stress. Fuel 308, 121991. doi:10.1016/j.fuel.2021.121991
Moffat, D. H., and Weale, K. E. (1955). Sorption by coal of methane at high pressures China. Fuel 34, 449–462.
Qin, Y. (2005). Advances in overseas geological research on coalbed gas: Origin and reservoir characteristics of coalbed gas China. Frontiers in Earth Science. 12 (3), 289–298.
Reucroft, P. J., and Patel, H. (1986). Gas-induced swelling in coal. Fuel 65 (6), 816–820. doi:10.1016/0016-2361(86)90075-x
Reucroft, P. J., and Sethuraman, A. R. (1987). Effect of pressure on carbon dioxide induced coal swelling. Energy fuels. 1 (1), 72–75. doi:10.1021/ef00001a013
Sakurovs, S., Day, S., Weir, S., and Duffy, G. (2008). Temperature dependence of sorption of gases by coals and charcoals. International Journal of Coal Geology. 73 (3/4), 250–258. doi:10.1016/j.coal.2007.05.001
Sakurovs, R., Day, S., Weir, S., and Duffy, G. (2007). Application of a Modified Dubinin−Radushkevich Equation to Adsorption of Gases by Coals under Supercritical Conditions. Energy fuels. 21, 992–997. doi:10.1021/ef0600614
Sun, K., Wu, D., Su, A., Chen, Z., Ren, S., Yue, L., et al. (2013). Coupling experimental study of coal permeability with pore pressureeffective volume stresstemperature under supercritical carbon dioxide action China. Chinese Journal of Rock Mechanics and Engineering. 32 (S2), 3760–3767.
Tang, J., Wang, X., Lu, Y., Ao, X., and Han, S. (2018). Experimental study on time effect and deformation anisotropy of shale and coal under CO2 China. Journal of China Coal Society. 43 (8), 2288–2295.
Tang, S., Tang, D., and Qi, Y. (2004). Binary-component gas adsorption isotherm experiments and their significance to ex- ploitation of coalbed methane China. Earth Science (2), 219–223.
Wang, L., and Liang, W. (2019). Experimental study on crack propa- gation of coalrock mass under supercritical CO2 fracturing China. Coal Science Technology. 47 (2), 65–70.
Wu, D., Miao, F., Liu, X., Xiao, X., and Zhai, W. (2021). Prediction of high-pressure adsorption of CH4 and CO2 in shale. International Journal of Greenhouse Gas Control. 110, 103440. doi:10.1016/j.ijggc.2021.103440
Wu, D., Liu, X., Sun, K., Xiao, X., and Xin, L. (2018). Experiments on supercritical CO2 adsorption in briquettes. Energy Sources, Part A: Recovery, Utilization, and Environmental Effects 41 (8), 1005–1011. doi:10.1080/15567036.2018.1523258
Wu, D., Liu, X., Liang, B., Sun, K., and Xiao, X. (2018). Experiments on Displacing Methane in Coal by Injecting Supercritical Carbon Dioxide. Energy fuels. 32 (12), 12766–12771. doi:10.1021/acs.energyfuels.8b03172
Wu, S., and Zhao, W. (2005). Analysis of effective stress in adsorbed methane-coal system China. Chinese Journal of Rock Mechanics and Engineering. 24 (10), 1674–1678.
Wu, S., Tang, D., Song, L. I., and Li, X. (2019). Effect of temperature and pressure on energy parameters of methane supercritical adsorp- tion China. Coal Science. Technology. 47 (9), 60–67.
Xu, J., Chen, Y., Jiang, C., Li, C., and Zeng, C. (2017). Test on carbon dioxide permeability in coal seam China. Ministry of Environment, Forest and Climate Change. 44 (4), 10–13.
Yang, Z., Qin, Y., Gao, D., and Chen, R. (2011). Differences between apparent and true adsorption quantity of coalbed methane under supercritical conditions and their geological significance China. Natural gas in India 31 (4), 13–16.
Yang, T., Nie, B., Yang, D., Zhang, R., and Zhao, C. (2012). Experimental research on displacing coal bed methane with supercritical CO2. Safety. Science. 50 (4), 899–902. doi:10.1016/j.ssci.2011.08.011
Zhang, C., and Yu, Q. (2019). Breakthrough pressure and permeability in partially water-saturated shales using methane-carbon dioxide gas mixtures: An experimental study of Carboniferous shales from the eastern Qaidam Basin, China. Bulletin 103 (2), 273–301. doi:10.1306/07111818018
Keywords: supercritical CO2, permeability, adsorption capacity, longitudinal wave velocity, permeability enhancement
Citation: Yu Y, Liu J, Yang Y, Wu D, Zhai W and Miao F (2023) Experimental study on coal seam permeability enhancement and CO2 permeability caused by supercritical CO2. Front. Earth Sci. 10:1062580. doi: 10.3389/feart.2022.1062580
Received: 06 October 2022; Accepted: 01 December 2022;
Published: 04 January 2023.
Edited by:
Yu Song, China University of Mining and Technology, ChinaReviewed by:
Bo Zhao, Taiyuan University of Technology, ChinaLiu Xueying, Huaqiao University, China
Xin-Bo Zhao, Qingdao University of Technology, China
Copyright © 2023 Yu, Liu, Yang, Wu, Zhai and Miao. This is an open-access article distributed under the terms of the Creative Commons Attribution License (CC BY). The use, distribution or reproduction in other forums is permitted, provided the original author(s) and the copyright owner(s) are credited and that the original publication in this journal is cited, in accordance with accepted academic practice. No use, distribution or reproduction is permitted which does not comply with these terms.
*Correspondence: Di Wu, d3VkaTIwMkAxMjYuY29t