 Ling Zuo
 Lijuan Li
 Bin Wang1,2
 Tao Feng
95% of researchers rate our articles as excellent or good
Learn more about the work of our research integrity team to safeguard the quality of each article we publish.
Find out more
ORIGINAL RESEARCH article
Front. Earth Sci. , 26 January 2023
Sec. Atmospheric Science
Volume 10 - 2022 | https://doi.org/10.3389/feart.2022.1061369
This article is part of the Research Topic Modelling, Simulating and Forecasting Regional Climate and Weather, volume II View all 8 articles
The increase in the average surface air temperature anomaly (SATA) over China is higher than the global average. However, the accurate simulation and attribution of regional SATA evolution remain challenging for current global climate models. This study simulates historical SATA variations over China using the coupled (FGOALS-g3) and uncoupled (atmospheric component, GAMIL3) models and examines their possible causes. Results show that both models reproduce the historical SATA variation with higher correlation coefficients (0.735 and 0.782) than many global climate models (0.25–0.56), although they overestimate or underestimate the changes of SATA to some extent in different periods. The results show that the cooling trend during 1941–1970 is well simulated with the coupled model while poorly presented with the uncoupled model; the coupled simulations particularly produce stronger long-term trends than the uncoupled ones during 1870–2014 considering full interaction among the atmosphere, ocean, and sea ice. In contrast, the uncoupled simulations reproduce better decadal and multi-decadal SATA variations owing to the constraints of the observed sea surface temperature (SST), such as the Atlantic multidecadal oscillation, and sea ice cover. Using Detection and Attribution Model Intercomparison Project (DAMIP) experiments, we found that the warming in the early 20th century and the recent 50 years is mainly driven by natural forcings and greenhouse gases (GHGs), whereas the cooling during 1941–1970 is caused by natural factors and anthropogenic aerosols. The cooling effects of anthropogenic aerosols are mainly attributed from the indirect SST-mediated responses through the atmosphere-ocean interactions in the coupled model.
The Intergovernmental Panel on Climate Change (IPCC) Fifth Assessment Report (AR5) revealed that globally averaged surface air temperature (SAT) has been increasing over the past century (IPCC, 2014). The latest Assessment Report (AR6) from Working Group I (IPCC, 2021) indicated a faster warming trend and reported that the increase in SAT is expected to reach 1.5°C or more within the next 20 years. In particular, the average SAT in some regions has changed faster than the global average; for instance, the SAT over China increased by around 0.9–1.5°C over 100 years (1909–2011), much faster than the global mean (∼0.85°C) (Yan et al., 2020). Rapid increases in global and regional SAT have widespread impacts on human society and ecosystems (Wang et al., 2012; Huang et al., 2013; Yang et al., 2018; Liu et al., 2019); therefore, the change in SAT is both a scientific problem and a challenging societal issue.
The evolution of historical globally averaged SAT over the past century is well simulated by the Coupled Model Intercomparison Project (CMIP) models. For instance, the temporal evolution of SAT simulated by the CMIP Phase 5 (CMIP5) models is in general agreement with the observations (HadCRUT3) equipped with high correlation coefficients (CCs) of 0.70–0.88 (Zhang et al., 2013). The historical evolution of global SAT is generally divided into three stages: a warming term from the 1910s–1940s (0.13–0.15°C/10 a), then a cooling stage from the 1940s–1970s (around −0.1°C/10 a), and an enhanced warming since the 1970s (0.17–0.18°C/10 a). Overall, the warming is underestimated (<0.1°C/10 a) in the first stage and overestimated (∼0.24°C/10 a) in the third stage by CMIP Phase 6 (CMIP6) models, and the cooling is basically reproduced by most models (around −0.05°C/10 a; Fan et al., 2020; Papalexiou et al., 2020). To attribute the SAT changes, experiments were proposed and run forced by one (or more) of the anthropogenic (e.g., greenhouse gases, anthropogenic aerosols, land use) and natural (volcanoes, solar irradiation) forcings (Tett et al., 1999; Stott et al., 2000); these experiments are now included in the CMIP6 as the Detection and Attribution Model Intercomparison Project (DAMIP; Gillett et al., 2016). The conclusions from these experiments are that both natural and anthropogenic forcings contribute to the global SAT change. The warming in the early 20th century is mainly driven by natural forcings, such as the hiatus of volcanic eruptions (Hegerl et al., 2018) as well as the increase of weakly absorbed solar irradiance and natural greenhouse gases (Egorova et al., 2018); the cooling in the middle period is caused by natural factors (∼0.15°C) and anthropogenic aerosols (−0.2 to −0.3°C); and the enhanced warming from 1970 to 2014 is dominated by greenhouse gases (GHGs) (0.5–1.3°C; Stott et al., 2000; Meehl et al., 2007; Man et al., 2012; Kim et al., 2016; Larson et al., 2020). Based on the 14 CMIP6 DAMIP experiments, the SAT changes during 1985–2014 are contributed about −0.61K and 1.22K by the aerosols and GHGs, respectively (Cao et al., 2022).
However, current climate models perform less well over specific regions than the global average. The evolution of SAT over China is similar to that worldwide, although with stronger trends during each period, the CCs between the CMIP5 models and the observations are within 0.25–0.56, much lower and with a more extensive spread than those for the global average (Zhang et al., 2013). The CMIP5 multi-model ensemble performs better than most individual models but still underestimates the 20th-century warming trends (Chen and Frauenfeld, 2014; Zhang et al., 2016). The models perform better for the SAT change after the 1970s than for that in the early 20th century. In particular, the warming peak in the 1940s is only reproduced by 2 out of 25 CMIP5 models (Chen and Frauenfeld, 2014), although the degree of warming is smaller than that in the late 20th century and there is uncertainty between the various observational datasets (Ren et al., 2017). Both anthropogenic and natural forcings and the internal multi-decadal variability of the coupled ocean-atmosphere systems are considered to affect the overall SAT change, but attributing the changes in SAT to these factors remains challenging (Zhao et al., 2005). Xu et al. (2015) and Sun et al. (2016) performed DAMIP-like experiments using coupled models to attribute SAT variation in the past 60 years over China and drew similar conclusions: the warming is mainly caused by anthropogenic forcings with GHGs (0.75–1.76°C) and partly offset by aerosols (−0.63 to −0.24°C), but the effects of natural factors remain unclear, with values of −0.04 to 0.3°C. Natural forcings are usually considered the main reason for the early 20th-century warming though significant discrepancies between different SAT datasets due to the lack of enough observations (Zhou and Zhao, 2007; Man et al., 2012). However, the cooling from 1940 to 1970 (or the warming in the 1940s) is not well reproduced in the majority of CMIP models, and there is disagreement about the roles of natural forcings, anthropogenic aerosols, and internal multi-decadal variations. Li et al. (2007), Zhou and Yu (2006) emphasized the response of atmospheric circulation to anthropogenic aerosols in attributing the cooling in east China using uncoupled models. However, an accurate assessment of the cooling effects for this period is still doubtful. The Atlantic Multidecadal Oscillation (AMO) has also been considered a major contributor to lower temperatures when it is cold phase (Wang L et al., 2013). Zhou and Zhao (2007) revealed that external forcing accounts for 32.5% of the total variance of the 20th-century SAT in China, much lower than the global figure (60.5%), leading to difficulties in regional attribution. The impacts of external forcings on the SAT evolution include two paths: the direct atmospheric responses to radiative changes due to external forcings, and the indirect responses to sea surface temperature (SST) through atmosphere-ocean interactions, i.e., SST-mediated responses (Pan et al., 2017; Wang et al., 2019). Overall, the uncertainties in models, forcings, and the impact of interactions with other regional climates mean that the accurate simulation and attribution of historical SAT variation over China remain a challenge for current climate models with coarse resolution (Chen and Frauenfeld, 2014; Wang and Chen, 2014; Dileepkumar et al., 2018; You et al., 2021).
This study focuses on the evaluation and attribution of changes in the historical SAT anomaly (SATA) over China using coupled and uncoupled (atmospheric component) models with DAMIP-type experiments and clarifies the contribution of SST-mediated responses to historical SATA evolution. The structure is as follows: the observational datasets, climate models, and experimental design are introduced in section 2; section 3 contains the evaluation and analysis of results, and section 4 provides a summary and discussion.
To understand the observational uncertainty, we used five different datasets, i.e., one gridded dataset, two sets of reanalysis data covering 1900–2015, and two reconstructed series. One reconstructed series (“WYG”) covering 1900–2015 is an extension of that described in Wang et al. (1998), created by an area-weighted method; the other is C-LSAT2.0 (China-Land Surface Air Temperature 2.0) covering 1854–2018 and produced by Sun and Li (2021) through merging and homogenizing the global and regional/national sources. The gridded CRUTEM4 is produced by the UK Met Office Hadley Centre and the Climatic Research Unit at the University of East Anglia (Jones et al., 2012), and includes data archived from more than 5500 weather stations with the resolution of 5°
The models employed in this study are the Flexible Ocean–Atmosphere Land System Model: Grid-Point Version3 (FGOALS-g3, Li et al., 2020a) and its atmospheric component, the Grid-point Atmospheric Model of IAP LASG (GAMIL3, Li et al., 2020b), one of the CMIP Phase 6 (CMIP6) models. Besides the GAMIL3 component, FGOALS-g3 consists of a land component (CAS-Land Surface Model, CAS-LSM), ocean component (Version 3 of the LASG-IAP Climate System Ocean Model, LICOM3), and ice component (the Los Alamos sea ice model Version 4.0, CICE4). In FGOALS-g3, GAMIL3 and CAS-LSM have the same horizontal resolution of ∼2° (180 × 80), and LICOM3 and CICE4 have the same horizontal resolution of ∼1° (360 × 218).
The CMIP6 historical experiments (referred to as historical) were performed with five members (r1–r5) using different restart files from the piControl run and forced with the same time-varying external forcings (solar radiation, stratospheric aerosols, ozone, GHGs, and anthropogenic aerosols) recommended by the CMIP6 (Table 1). The Tier 1 DAMIP experiments were performed with three members (r1–r3) by differing the initial state and with different sets of forcings: GHGs-only (hist-GHG), Anthropogenic-aerosols-only (hist-aer), and Natural-only (solar radiation, stratospheric aerosols: hist-nat). To investigate the impact of atmosphere and ocean (ice) interaction, the parallel experiments were conducted using GAMIL3 (amip-hist, amip-GHG, amip-aer, and amip-nat), but with observed sea surface temperature (SST) and sea ice (SIC). Note that in the GAMIL3 experiments, the observed SST and SIC include the signals of all the external forcings.
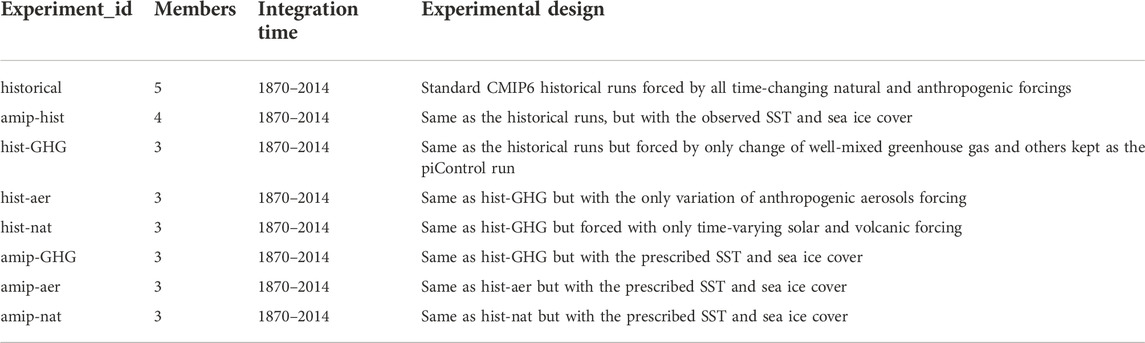
TABLE 1. Experimental design.
The SATA time series across China from one gridded data, two reanalysis datasets, and the two reconstructions covering 1900–2015 are shown in Figure 1. Despite different resolutions, the five different datasets generally show apparent consistency in SATA trends: rising between 1900 and 1940, then cooling slightly during 1941–1970, followed by an enhanced increase since 1970, consistent with the global mean SATA evolution (not shown here). In particular, during 1980–2015, the warming rate over China is ∼0.41°C/10 a, much larger than the global figure (∼0.26°C/10 a) according to the average of the five datasets, again justifying conclusions from many previous studies (Man et al., 2012; Ding and Wang, 2016; Ren et al., 2017).
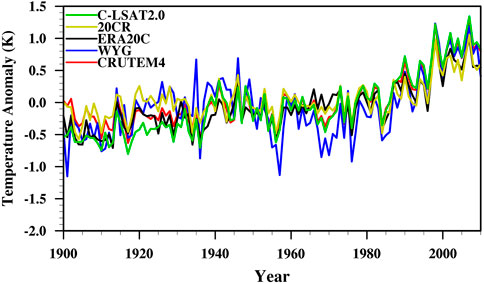
FIGURE 1. Temporal evolutions of the annual mean SAT anomalies (units: K; relative to 1961–1990 mean) averaged in China during 1900–2015 from NOAA_20CR (yellow), ERA20C (black), WYG (blue), CRUTEM4 (red), C-LSAT2.0 (green).
Further, the CCs between the five datasets were calculated (Table 2). All CCs pass the Student’s t-test, implying their general consistency, but discrepancies exist to different degrees. WYG shows the lowest CCs (0.68–0.76) with the other series; CRUTEM4 has the highest CCs (0.74–0.96); two reanalysis datasets and C-LSAT2.0 lie between WYG and CRUTEM4. A significant warming period appears in WYG from 1920 to 1940 that is insignificant in other series (Figure 1); in addition, inconsistency is mainly seen during this stage, which is likely related to the influence of the Arctic (Ding and Wang, 2016). In addition, an unexplained underestimate is seen in WYG compared with others during 1960–1980, which produced a lower consistency. The CRUTEM4 and C-LSAT2.0 present the highest similarity as the former is integrated into the latter (Li et al., 2021). Compared to other series, 20CR and ERA20C show weaker warming after the 1970s although they have different data assimilation schemes and datasets; the weaker SAT trends in reanalysis were reported by Wang J et al. (2013). The systematic bias of the reanalysis compared to the station observations may affect the trends (Zhang et al., 2021).
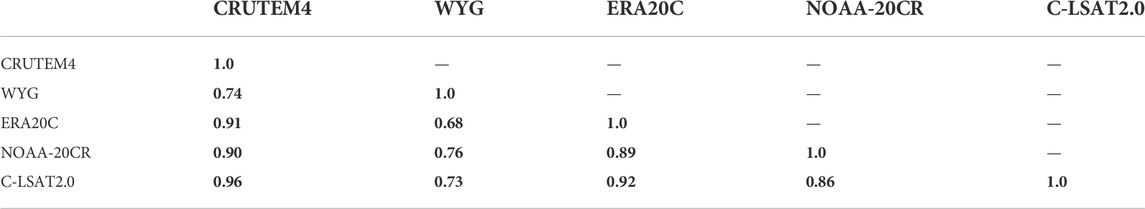
TABLE 2. Correlation analysis of five datasets from 1900 to 2015 (values in bold are significant at the 95% level).
In brief, though the five datasets have apparent discrepancies, they can roughly describe the SATA temporal variations over China with two warming periods and one cooling period. As discussed by Ding and Wang (2016) and Tang et al. (2009), the accuracy of the observation series (WYG included) may be impacted by irregular observation and missing data, which requires further investigation in future studies. Considering the highest CCs and the more available datasets in China before the 1940s (Yin and Sun, 2022), CRUTEM4 was selected as a common observational basis in the following analysis.
The time series of historical SATA simulated by FGOALS-g3 and GAMIL3 over China from 1870 to 2014 are shown in Figure 2. The coupled and uncoupled simulations show similar warming trends and (multi-) decadal variations to the observations, and the ensemble mean performance is overall better than that of each member. The spread of the members is more extensive in the “historical” runs than in the “amip-hist” runs with the observed SST and SIC constraint.
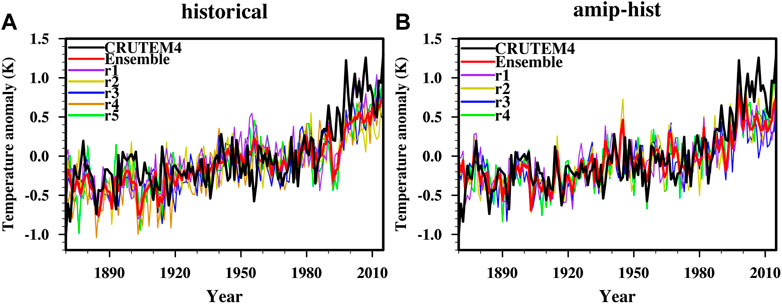
FIGURE 2. Same as Figure 1, but for the (A) coupled model and (B) uncoupled simulations from 1870 to 2014 (units: K; relative to 1961–1990 mean). Black line: CRUTEM4; red line: ensemble mean; other colors: the individual model members.
Unexpectedly, the quantitative performance of the uncoupled simulations is not better than that of the coupled simulations. For instance, the coupled simulations produce more prominent trends (including warming and cooling), closer to CRUTEM4 than the uncoupled simulations with prescribed SST and SIC, except for the period from 1911 to 1940 (Table 3). Although there is a large spread among members, most coupled and uncoupled simulations overestimate (underestimate) the trend during the 20th century in the first (second, third, and total) stages, indicating the difficulty of accurate regional simulation using global climate models. Interestingly, the cooling trend covering the 1940s–1970s is reproduced in most coupled simulations but practically absent in the uncoupled simulations. The CCs of the coupled simulations with CRUTEM4 are generally higher than those of the uncoupled simulations, although there are evident spreads among the members (Table 4).

TABLE 3. Linear trend during the periods of 1911–1940, 1941-1970, 1971-2014 and 1911-2014 for the CRUTEM, historical and amip-hist simulations (Units: K/10 a; values in bold are significant at the 95% level).
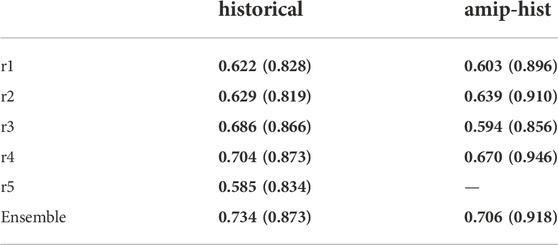
TABLE 4. Correlation coefficients of annual mean SATA (11-year running average in brackets) between CRUTEM4 and coupled and uncoupled simulations from 1870 to 2014 (values in bold are significant at the 95% level).
To remove the effects of interannual variability, we applied an 11-year running average to the SATA time series. The coupled model fails to reproduce the variation around 1930 to 1970 with only one peak compared to the two warming peaks in the observations, but the uncoupled model performs well (Figures 3A,B). The uncoupled simulations also perform better than the coupled simulations with larger CCs (Table 4). The CCs after the running average are also higher than the corresponding values using the original time series (Table 4), implying that the high consistency is from the trend and (multi-) decadal variations in the coupled and uncoupled models. The results are similar when a 5- or 9-year running average is used (figures not shown). Furthermore, the linear trend from 1870 to 2014 of the coupled simulation (ensemble mean: 0.063°C/10 a) is much closer to the CRUTEM4 (0.069°C/10 a) than the uncoupled case (0.051°C/10 a), although both underestimate the trend (Table 5). The AMO index, defined as the annual SST anomalies averaged over the North Atlantic (0 to
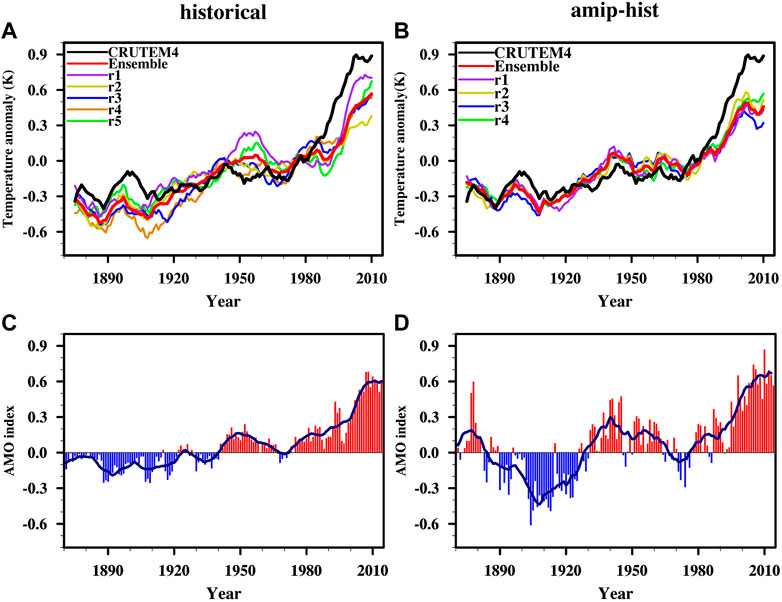
FIGURE 3. Same as Figure 2 but with 11-year running average for the (A) coupled and (B) uncoupled simulations (black line: CRUTEM4; red line: ensemble mean); annual SST anomalies (units: K; relative to 1961–1990 mean) averaged over the North Atlantic (0 to
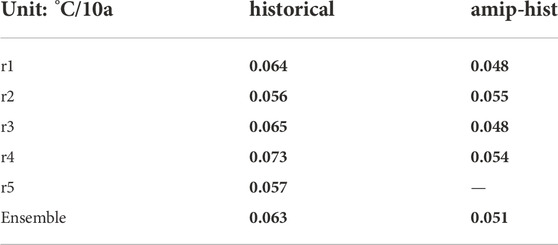
TABLE 5. Same as Table 3, but for the period of 1870–2014 with 11-year running average.
Meanwhile, the trend from the original series in the coupled model is 0.080°C/10 a, still closer to the trend in CRUTEM4 (0.075°C/10 a) than that (0.051°C/10 a; the same trend as with the 11-year running average) in the uncoupled case. From this perspective, the coupled model better simulates the trend, suggesting that the climate system response to external forcings is strengthened through the full interactions among the atmosphere, ocean, and sea ice. Regarding the (multi-) decadal variation of SATA, the uncoupled model, regulated by the prescribed signals from SST and SIC, shows a better correlation with CRUTEM4.
In brief, FGOALS-g3 and GAMIL3 can reproduce the SATA evolution over China but have different strengths. The coupled model performs a stronger long-term trend by allowing all the ocean–sea-ice–atmosphere interactions. The coupled model has a broader spread among different members, indicating that the uncertainty is amplified by interactions between different component systems. However, the uncoupled simulation, restricted by the observed SST and SIC, is the better choice for the decadal and multi-decadal variations.
In the GHG experiments, the increasing SATA throughout the time series is reproduced by both models, implying the positive effects of GHGs (Figures 4A,B). Further, the linear trends are weaker in the coupled model than in the uncoupled one, except during the second period (Table 6). A rapidly increasing trend is produced in the latest 40 years in both models, in line with the effect of a large amount of GHGs emissions on the current SATA change (Tang et al., 2009).
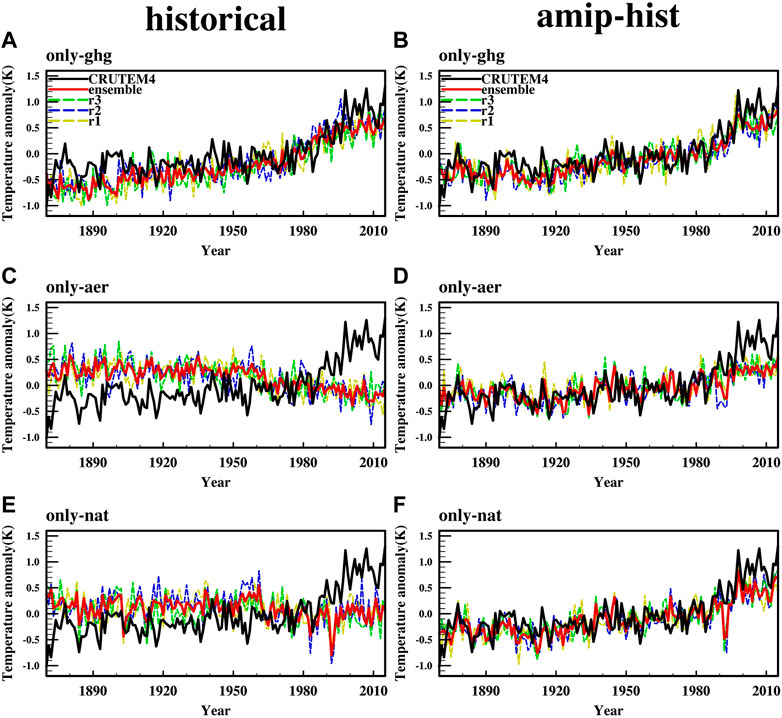
FIGURE 4. Same as Figure 2, but for the simulations with solely time-varying of (A,B) GHG forcing, (C,D) aerosol forcing, and (E,F) natural forcing (units: K; relative to 1961–1990 mean). The left column is for the coupled model (FGOALS-g3) and the right column is for the uncoupled model (GAMIL3). Black line: CRUTEM4; red line: ensemble mean.

TABLE 6. Same as Table 3, but for the simulation with time-varying GHGs-only, anthropogenic aerosols-only and natural-only forcings (values in bold are significant at the 95% level).
Unlike the effect of GHGs, a significant inconsistency exists between the two anthropogenic-aerosols-only simulations, especially in the second and third stages (Figures 4C,D). In the coupled model, the cooling trends are substantial in the last two stages, specifically from 1941 to 1970, as seen in the observations, suggesting a possible reason for SAT cooling. Warming trends are shown in all stages (including slight warming in the second stage) by the uncoupled model even though not significant, implying the response of the pure atmosphere (near the surface) to anthropogenic aerosols is minimal, and the response to observed SST or SIC is dominant. Although the SST-mediated indirect effects could be accurately calculated by designing a set of sensitive experiments (e.g., Wang et al., 2019), they are still roughly estimated by comparing the “hist-aer” and “amip-aer”. Hence it could be concluded that the cooling effects of anthropogenic aerosols in the coupled model are mainly from the indirect SST-mediated responses through atmosphere-ocean interactions (Wang et al., 2019).
In addition to anthropogenic forcings, natural forcings also affect the SATA variation. Increasing SATA is evident in the first and third stages (Figures 4E,F), and the coupled model shows a weaker (not significant) rising tendency than the uncoupled model that responds to the observed SST’s warm signals. Decreasing SATA during 1941–1970 is evident in the coupled simulations despite the uncertainty among the members but absent in the corresponding uncoupled simulations. The warming trend in the first period reproduced by the uncoupled model is always larger than in the coupled case, whatever the forcing. The overestimate of warming with all forcings (Table 3) is mainly due to the observed SST or SIC in the uncoupled model and is driven by the external forcings (mainly GHGs and natural forcings) in the coupled model. In the third stage, the warming is primarily caused by the GHGs and weakly by natural forcings and is partly offset by anthropogenic aerosols. Quantitatively, the relative contributions are 0.17°C/10 a, −0.051°C/10 a, and 0.019°C/10 a by the GHGs, natural forcings, and anthropogenic aerosols (Table 6), close to the corresponding values (0.27°C/10 a, −0.058°C/10 a, and 0.013°C/10 a) from the CMIP6 DAMIP multi-model ensemble mean during the same period (Allabakash and Lim, 2022). The weak warming from GHGs is related to its relatively smaller equilibrium climate sensitivity (about 2.8K) than the mean (3.9K) of CMIP6 models (Wang et al., 2022). However, the cooling trend in the second stage is attributed to anthropogenic aerosols and natural forcings and is partly offset by the GHGs.
Simulation and attribution of the historical SATA over China are of great interest to the modeling and climate change communities. In this study, we analyzed the uncertainty of five datasets by calculating total trends and correlations, then simulated the evolution of SATA using coupled and uncoupled models. In order to attribute SATA changes to specific external factors and the interaction between ocean and atmosphere, the GHGs-, anthropogenic-aerosols-, and natural-only external forcings introduced from DAMIP were utilized in a coupled model and an uncoupled model with prescribed SST and SIC.
The five datasets, including one gridded series (CRUTEM4), two reanalysis datasets (ERA20C, NOAA_20CR), and two reconstructions (WYG and C-LSAT2.0), show general consistency with high CCs among them but with uncertainties, especially from 1920 to 1940. WYG performs less consistently with overestimation (underestimation) over 1920–1940 (1960–1980); two reanalysis datasets show weaker warming after the 1970s, while the highest CCs emerged for the CRUTEM4 and C-LSAT2.0. Both the coupled (FGOALS-g3) and uncoupled (GAMIL3) models reproduced the overall SATA series and the three stages: warming from 1911 to 1940, slight cooling during 1941–1970, then rapid warming since 1970. The coupled model has a higher CC (0.734) with the CRUTEM4 due to its better trend simulation, reflecting the strengthened response of a coupled system to external forcings through the full ocean–sea-ice–atmosphere interactions. The uncoupled model shows better agreement with CRUTEM4 after removing the interannual signals, which is attributed to the long-term internal (such as decadal and multi-decadal) signals constrained by the observed SST and SIC, including the observed AMO.
The warming trend from 1911 to 1940 that is overestimated by both coupled and uncoupled simulations is mainly driven by the GHGs and natural forcings, although there are uncertainties among different observations. The cooling trend during 1941–1970 is reproduced by the coupled simulations despite a large spread among them, but the uncoupled simulations give only a very weak cooling trend. The cooling results are mainly attributed from the indirect effects of anthropogenic aerosols and natural forcings and partly compensated by the GHGs. The enhanced warming trend from 1971 to 2014 is primarily attributed to the GHGs and weakly to the natural forcings and partly offset by anthropogenic aerosols.
However, note that the observed SST and SIC driving the uncoupled model contain the signals of all the external forcings, and there may be double counts in its attribution experiments. Therefore, more investigations are required in which these signals are removed from the SST and SIC, e.g., the SST from the piControl simulations. The weakened warming trend since 1971 in both coupled and uncoupled simulations should be further checked from the models, external forcings, and model response to forcings. The indirect SST-mediated responses of anthropogenic aerosols should be quantified through elaborately experimental designs (Wang et al., 2019). Regional attribution remains challenging in complicated topography (Li et al., 2019). Multimodel-based analysis and many algorithm-based methods, such as the optimal fingerprint, are expected to contribute to further studies (Wallace et al., 2012; Sun et al., 2016; Hu et al., 2018; Gong et al., 2019). We have applied five members at the most in this research, and the spread among members is apparent, especially in the coupled model. A large ensemble simulation could be adopted to improve understanding and quantifying the impact of internal variabilities on forced climate changes.
The “historical” and DAMIP datasets from the coupled model (FGOALS-g3) presented in this study can be found in CMIP6 webset: https://esgfnode.llnl.gov/projects/cmip6/. The datasets of “amip-hist” and DAMIP-type which simulated by the uncoupled model (GAMIL3) can also be found in the Github: https://github.com/Zoo-tech/DAMIP/releases/tag/DAMIP-type.
LZ and LL conceived the main conception, planned and carried out the simulations. LL and BW developed the experimental designs and contributed to the interpretation of the results. TF and YC verified the analytical methods and supervised the findings of this work. LZ and LL wrote the manuscript with conclusions from all authors.
This research was jointly funded by the Special Funds for Creative Research (Grant No. 2022C61540), the Strategic Priority Research Program of the Chinese Academy of Sciences (Grant XDB42010404), the National Natural Science Foundation of China (Grant 42288101), and the National Key Research Project (Grant 2022YFC3104804).
The authors declare that the research was conducted in the absence of any commercial or financial relationships that could be construed as a potential conflict of interest.
All claims expressed in this article are solely those of the authors and do not necessarily represent those of their affiliated organizations, or those of the publisher, the editors and the reviewers. Any product that may be evaluated in this article, or claim that may be made by its manufacturer, is not guaranteed or endorsed by the publisher.
Allabakash, S., and Lim, S. (2022). Anthropogenic influence of temperature changes across East Asia using CMIP6 simulations. Sci. Rep. 1312 (1), 11896. doi:10.1038/s41598-022-16110-9
Cao, J., Wang, H., Wang, B., Zhao, H., Wang, C., and Zhu, X. (2022). Higher sensitivity of Northern Hemisphere monsoon to anthropogenic aerosol than greenhouse gases. Geophys. Res. Lett. 49, e2022GL100270. doi:10.1029/2022gl100270
Chen, L., and Frauenfeld, O. W. (2014). Surface air temperature changes over the twentieth and twenty-first centuries in China simulated by 20 CMIP5 models. J. Clim. 27, 3920–3937. doi:10.1175/jcli-d-13-00465.1
Dileepkumar, R., AchutaRao, K., and Arulalan, T. (2018). Human influence on sub-regional surface air temperature change over India. Sci. Rep. 8, 8967. doi:10.1038/s41598-018-27185-8
Ding, Y., and Wang, H. (2016). Newly acquired knowledge on the scientific issues related to climate change over the recent 100 years in China. Chin. Sci. Bull. 61, 1029–1041. doi:10.1360/n972015-00638
Egorova, T., Rozanov, E., Arsenovic, P., Peter, T., and Schmutz, W. (2018). Contributions of natural and anthropogenic forcing agents to the early 20th century warming. Front. Earth Sci. 6, 206. doi:10.3389/feart.2018.00206
Fan, X., Duan, Q., Shen, C., Wu, Y., and Xing, C. (2020). Global surface air temperatures in CMIP6: Historical performance and future changes. Environ. Res. Lett. 15 (14), 104056. doi:10.1088/1748-9326/abb051
Giese, B. S., Seidel, H. F., Compo, G. P., and Sardeshmukh, P. D. (2016). An ensemble of ocean reanalyses for 1815-2013 with sparse observational input. J. Geophys. Res. Oceans 121, 6891–6910. doi:10.1002/2016jc012079
Gillett, N. P., Shiogama, H., Funke, B., Hegerl, G., Knutti, R., Matthes, K., et al. (2016). The detection and attribution model Intercomparison Project (DAMIP v1.0) contribution to CMIP6. Geosci. Model Dev. 9 (10), 3685–3697. doi:10.5194/gmd-9-3685-2016
Gong, H., Wang, L., Chen, W., and Wu, R. (2019). Attribution of the east asian winter temperature trends during 1979–2018: Role of external forcing and internal variability. Geophys. Res. Lett. 46, 10874–10881. doi:10.1029/2019gl084154
Hegerl, G. C., Brönnimann, S., .Schurer, A., and Cowan, T. (2018). The early 20th century warming: Anomalies, causes, and consequences. Wiley Interdiscip. Rev. Clim. Change 9 (4), e522. doi:10.1002/wcc.522
Hu, K., Huang, G., and Xie, S.-P. (2018). Assessing the internal variability in multi-decadal trends of summer surface air temperature over East Asia with a large ensemble of GCM simulations. Clim. Dyn. 52, 6229–6242. doi:10.1007/s00382-018-4503-x
Huang, B., Thorn, P. W., Banzon, V. F., Boyer, T., Chepurin, G., Lawrimore, J. H., et al. (2017). Extended reconstructed Sea Surface temperatures version 5 (ERSSTv5): Upgrades, validations, and intercomparisons. J. Clim. doi:10.1175/JCLI-D-16-0836.1
Huang, P., Xie, S.-P., Hu, K., Huang, G., and Huang, R. (2013). Patterns of the seasonal response of tropical rainfall to global warming. Nat. Geosci. 6, 357–361. doi:10.1038/ngeo1792
IPCC (2021). Climate change 2021: The physical science basis. Contribution of working Group I. Available at: https://www.ipcc.ch/assessment-report/ar6/.
Jones, P. D., Lister, D. H., Osborn, T. J., Harpham, C., Salmon, M., and Morice, C. P. (2012). Hemispheric and large-scale land surface air temperature variations: An extensive revision and an update to 2010. J. Geophys. Res. 117. doi:10.1029/2011JD017139
Kim, Y.-H., Min, S.-K., Zhang, X., Zwiers, F., Alexander, L. V., Donat, M. G., et al. (2016). Attribution of extreme temperature changes during 1951-2010. Clim. Dyn. 46, 1769–1782. doi:10.1007/s00382-015-2674-2
Larson, E. J. L., Portmann, R. W., Solomon, S., and Murphy, D. M. (2020). Decadal attribution of historic temperature and ocean heat content change to anthropogenic emissions. Geophys. Res. Lett. 47. doi:10.1029/2019GL085905
Li, L., Dong, L., Xie, J., Tang, Y., Xie, F., Guo, Z., et al. (2020b). The GAMIL3: Model description and evaluation. J. Geophys. Res. Atmos. 125. doi:10.1029/2020JD032574
Li, L., Wang, B., and Zhou, T. (2007). Contributions of natural and anthropogenic forcings to the summer cooling over eastern China: An AGCM study. Geophys. Res. Lett. 34, L18807. doi:10.1029/2007GL030541
Li, L., Yu, Y., Tang, Y., Lin, P., Xie, J., Song, M., et al. (2020a). The flexible global ocean–atmosphere–land system model grid-point version 3 (FGOALS-g3): Description and evaluation. J. Adv. Model. Earth Syst. 12. doi:10.1029/2019MS002012
Li, Q., Dong, W., and Jones, P. D. (2019). Continental scale surface air temperature variations: Experience derived from the Chinese region. Earth Sci. Rev. 200, 1204875109. doi:10.1073/pnas.1204875109
Li, Q., Sun, W., Yun, X., Huang, B., Dong, W., Wang, X. L., et al. (2021). An updated evaluation of the global mean land surface air temperature and surface temperature trends based on CLSAT and CMST. Clim. Dyn. 56, 635–650. doi:10.1007/s00382-020-05502-0
Liu, M., Shen, Y., Qi, Y., Wang, Y., and Geng, X. J. A. (2019). Changes in precipitation and drought extremes over the past half century in China. Atmosphere 10, 203. doi:10.3390/atmos10040203
Man, W., Zhou, T., Zhang, L., Wu, B., and Zhang, J. (2012). Contributions of natural and anthropogenic forcing factors to twentieth-century temperature change: Results from the simulation of LASG/IAP climate system model FGOALS_gl. Chin. J. Geophys. 55 (2), 10–22. doi:10.1002/cjg2.1696
Meehl, G. A., Arblaster, J. M., and Tebaldi, C. (2007). Contributions of natural and anthropogenic forcing to changes in temperature extremes over the United States. Geophys. Res. Lett. 34, L19709. doi:10.1029/2007GL030948
IPCC (2014). “Climate change 2014: Synthesis Report,” in Contribution of working groups I, II and III to the Fifth assessment Report of the intergovernmental Panel on climate change core writing team. Editors R. K. Pachauri, and L. A. Meyer (Geneva, Switzerland: IPCC), 151.
Pan, Z., Shi, C., Kumar, S., and Gao, Z. (2017). North pacific SST forcing on the central United States “warming hole” as simulated in CMIP5 coupled historical and uncoupled AMIP experiments. Atmosphere-Ocean 55 (1), 57–77. doi:10.1080/07055900.2016.1261690
Papalexiou, S. M., Rajulapati, C. R., Clark, M. P., and Lehner, F. (2020). Robustness of CMIP6 historical global mean temperature simulations: Trends, long-term persistence, autocorrelation, and distributional shape. Earth's. Future 8. doi:10.1029/2020EF001667
Ren, G. Y., Ding, Y. H., and Tang, G. L. (2017). An overview of mainland China temperature change research. J. Meteorol. Res. 31 (1), 3–16. doi:10.1007/s13351-017-6195-2
Stickler, A., Brönnimann, S., Valente, M. A., Bethke, J., Sterin, A., Jourdain, S., et al. (2014). ERA-CLIM: Historical surface and upper-air data for future reanalyses. Bull. Am. Meteorological Soc. 95 (9), 1419–1430. doi:10.1175/bams-d-13-00147.1
Stott, P. A., Tett, S. F. B., Jones, G. S., Allen, M. R., Mitchell, J. F. B., and Jenkins, G. J. (2000). External control of 20th century temperature by natural and anthropogenic forcings. Science 290, 2133–2137. doi:10.1126/science.290.5499.2133
Sun, W., and Li, Q. (2021). China global land surface air temperature 2.0 during 1850-2020. figshare. Dataset. doi:10.6084/m9.figshare.16968334.v4
Sun, Y., Zhang, X., Ren, G., Zwiers, F. W., and Hu, T. (2016). Contribution of urbanization to warming in China. Nat. Clim. Change 6, 706–709. doi:10.1038/nclimate2956
Tang, G., Ding, Y., Wang, S., Ren, G., Liu, H., and Zhang, L. (2009). Comparative analysis of the time series of surface air temperature over China for the last 100 years. Adv. Clim. Chang. Res. 5 (2), 71–78.
Tett, S. F. B., Stott, P. A., Allen, M. R., Ingram, W. J., and Mitchell, J. F. B. (1999). Causes of twentieth-century temperature change near the Earth's surface. Nature 399, 569–572. doi:10.1038/21164
Wallace, J. M., Fu, Q., Smoliak, B. V., Lin, P., and Johanson, C. M. (2012). Simulated versus observed patterns of warming over the extratropical Northern Hemisphere continents during the cold season. Proc. Natl. Acad. Sci. U. S. A. 109 (36), 14337–14342. doi:10.1073/pnas.1204875109
Wang, H., Li, L., Chen, X., and Wang, B. (2022). Evaluating the nature and extent of changes to climate sensitivity between FGOALS-g2 and FGOALS-g3. JGR. Atmos. 127, e2021JD035852. doi:10.1029/2021JD035852
Wang, H., Sun, J., Chen, H., Zhu, Y., Zhang, Y., Jiang, D., et al. (2012). Extreme climate in China: Facts, simulation and projection. metz. 21 (3), 279–304. doi:10.1127/0941-2948/2012/0330
Wang, H., Xie, S., Kosaka, Y., Liu, Q., and Du, Y. (2019). Dynamics of asian summer monsoon response to anthropogenic aerosol forcing. J. Clim. 32 (3), 843–858. doi:10.1175/jcli-d-18-0386.1
Wang J, J., Yan, Z., Jones, P. D., and Xia, J. (2013). On “observation minus reanalysis” method: A view from multidecadal variability. J. Geophys. Res. Atmos. 118 (14), 7450–7458. doi:10.1002/jgrd.50574
Wang L, J. L., Yang, B., Ljungqvist, F. C., and Zhao, Y. (2013). The relationship between the Atlantic Multidecadal Oscillation and temperature variability in China during the last millennium. J. Quat. Sci. 28, 653–658. doi:10.1002/jqs.2658
Wang, L., and Chen, W. (2014). A CMIP5 multimodel projection of future temperature, precipitation, and climatological drought in China. Int. J. Climatol. 34, 2059–2078. doi:10.1002/joc.3822
Wang, S., Ye, J., Gong, D., Zhu, J., and Yao, T. (1998). Construction of annual mean temperature series for the last one hundred years in China. J. Appl. Meteorol. Clim. 9, 392–401.
Xu, Y., Gao, X., Shi, Y., and Zhou, B. (2015). Detection and attribution analysis of annual mean temperature changes in China. Clim. Res. 63, 61–71. doi:10.3354/cr01283
Yan, Z., Ding, Y., Zhai, P., Song, L., Cao, L., and Li, Z. (2020). Re-assessing climatic warming in China since 1900. J. Meteorol. Res. 34, 243–251. doi:10.1007/s13351-020-9839-6
Yang, Z., Wang, Q., and Liu, P. (2018). Extreme temperature and mortality: Evidence from China. Int. J. Biometeorol. 63 (1), 29–50. doi:10.1007/s00484-018-1635-y
Yin, H., and Sun, Y. (2022). Anthropogenic influence on temperature change in China over the period 1901-2018. J. Clim. 35, 1–31. doi:10.1175/jcli-d-22-0122.1
You, Q., Cai, Z., Wu, F., Jiang, Z., Pepin, N., and Shen, S. S. P. (2021). Temperature dataset of CMIP6 models over China: Evaluation, trend and uncertainty. Clim. Dyn. 57, 17–35. doi:10.1007/s00382-021-05691-2
Zhang, L., Ding, Y., Wu, T., Xin, X., Zhang, Y., and Xu, Y. (2013). The 21st century annual mean surface air temperature change and the 2°C warming threshold over the globe and China as projected by the CMIP5 models. Acta Meteor Sin. 71 (6), 1047–1060.
Zhang, S., Ren, G., Ren, Y., Zhang, Y., and Xue, X. (2021). Comprehensive evaluation of surface air temperature reanalysis over China against urbanization-bias-adjusted observations. Adv. Clim. Change Res. 12 (6), 783–794. doi:10.1016/j.accre.2021.09.010
Zhang, Y., Li, Z., and Xu, Y. (2016). Simulations and projections of the surface air temperature in China by CMIP5 models. Adv. Clim. Change Res. 12 (1), 10–19.
Zhao, Z., Wang, W., Ying, X., Ren, G., Luo, Y., and Gao, X. (2005). Attribution of the 20th century climate warming in China. Clim. Environ. Res. (in Chin. 10 (4), 808–817.
Zhou, T., and Yu, R. (2006). Twentieth-century surface air temperature over China and the globe simulated by coupled climate models. J. Clim. 19, 5843–5858. doi:10.1175/JCLI3952.1
Zhou, T., and Zhao, Z. (2007). Progress in the attribution of climate warming in China for the20th century. Adv. Clim. Chang. Res. 3, 1673–1719.
Keywords: surface air temperature, attribution, coupled model, uncoupled model, anthropogenic aerosols
Citation: Zuo L, Li L, Wang B, Feng T and Chang Y (2023) Evaluation and attribution of historical surface air temperature changes over China simulated by coupled and uncoupled models. Front. Earth Sci. 10:1061369. doi: 10.3389/feart.2022.1061369
Received: 04 October 2022; Accepted: 22 November 2022;
Published: 26 January 2023.
Edited by:
Yinlong Xu, Institute of Environment and Sustainable Development in Agriculture (CAAS), ChinaReviewed by:
Jian Cao, Nanjing University of Information Science and Technology, ChinaCopyright © 2023 Zuo, Li, Wang, Feng and Chang. This is an open-access article distributed under the terms of the Creative Commons Attribution License (CC BY). The use, distribution or reproduction in other forums is permitted, provided the original author(s) and the copyright owner(s) are credited and that the original publication in this journal is cited, in accordance with accepted academic practice. No use, distribution or reproduction is permitted which does not comply with these terms.
*Correspondence: Lijuan Li, bGpsaUBtYWlsLmlhcC5hYy5jbg==
Disclaimer: All claims expressed in this article are solely those of the authors and do not necessarily represent those of their affiliated organizations, or those of the publisher, the editors and the reviewers. Any product that may be evaluated in this article or claim that may be made by its manufacturer is not guaranteed or endorsed by the publisher.
Research integrity at Frontiers
Learn more about the work of our research integrity team to safeguard the quality of each article we publish.