 Xinxin Yu1,2†
 Mingdong Jiang
 Guanyu Zhong
- 1School of Humanities, Social Sciences and Law, Harbin Institute of Technology, Harbin, Heilongjiang, China
- 2Institute of Green and Low Carbon Development, Yancheng Institute of Technology, Yancheng, Jiangsu, China
- 3Business School, Hohai University, Nanjing, Jiangsu, China
- 4College of Environmental Sciences and Engineering, Peking University, Beijing, China
- 5School of Marketing, UNSW Business School, University of New South Wales, Sydney, NSW, Australia
- 6College of Environment, Hohai University, Nanjing, Jiangsu, China
Energy and water resources function as the base for humans’ socioeconomic development, which are closely linked with each other in the production process. With the rapid economic development, the contradiction between the supply and demand of energy and water resources has become acute. Meanwhile, the carbon reduction goals further enhanced the energy and water constraints, which inevitably have a significant impact on economic growth. Exploring the effect of energy and water constraints on the economic growth under climate goals is essential for policy maker to minimize the economic loss during carbon control. To realize this aim, we introduced the modified Romers’ economic growth model to estimate the impact of energy-water constraints on economic growth based on relative data in 30 provinces in China from 2000 to 2019. Then the spatial-temporal characteristics of the energy-water drag effects on China’s economic growth have been analyzed. We further applied scenario analysis method to investigate the changes in growth drag effects of energy and water resources under carbon mitigation goals in 2025 and 2030. The results show that China’s economic growth rate was reduced by 7.72% and 7.99% during the study period due to energy and water resources constraints respectively. In terms of the temporal trend, the energy-water growth drag effect shows a downward trend as a whole during 2000–2019, and the growth drag of energy on economic growth is slightly greater than that of water resources. As to spatial distribution, regions with high constraint effects of energy and water on economic growth are mainly located in the East China, while some north regions feature low energy-water constraints. According to the simulation results, China’s energy-water drag effects on the economic growth are 6.85% and 7.03% respectively, under the baseline and strong carbon control scenarios, higher than the 6.53% under the weak carbon control. Based on this, this paper proposes to design targeted energy-water constraint strategies and promote production efficiency to achieve a win-win situation of economic development and dual-carbon goals.
1 Introduction
Humans’ socioeconomic activities highly depend on energy and water resources, which are closely linked with each other in the production progress. Water supplies basic support for primary energy extraction and secondary energy processing such as thermal power cooling or direct power supply (Murphy and Allen, 2011; Stillwell et al., 2011), while the energy plays an important role in water projects and effluent treatment (Adham et al., 2013; Zak et al., 2013; Li et al., 2018). Due to their interactive and fundamental functions in industrial production and agriculture, these two resources have been excessively abused to promote rapid economic development during the past decades (Tuninetti et al., 2019; Mondal and Yadav, 2021). Total global final consumption of energy increased from 7.00 × 10³ Mtoe in 2000 to 9.98 × 10³ Mtoe in 2019 (Department of Energy Statistics, National Statistics Bureau of China, 2021). And the freshwater withdrawal reached even about 3.96 × 10¹² m3 in 2019, 1.16 times that in 2000 (FAO, 2021). The contradiction between the supply and demand of energy and water resources has become increasingly acute. Hence, the resource consumption control strategy requires more attention, during which energy and water resources in a synergic framework are basically necessary. Otherwise, negative derivative effects may be generated, which will damage the holistic profits.
Recently, the world has come to a united effort for energy saving and carbon reduction through the Kyoto Protocol and the Paris Agreement. The burning of fossil energy is considered the main source of carbon dioxide (Andres et al., 2012). Therefore, to realize the climate goals, the consumption of several energy resources for power generation or direct final use is inevitably limited. Transition to low-carbon energy consumption may further impact the use of water, which is a necessary resource in energy production during power supply, cooling system, and waste disposal. Though water is expected to be saved due to restricted high-carbon energy and improve water use efficiency, the use of cleaner and more efficient new energy will potentially expand power generation capacity, which likely aggregates the total consumptive water use (Cameron et al., 2014; Talati et al., 2016). Since that the recycling of wastewater is always accompanied by large quantities of carbon emissions, which interfere with the realization of climate goals (Nayeb et al., 2019), excessive water consumption is also required to be restricted under the carbon mitigation targets (Wang et al., 2020; Xie et al., 2022).
The impact exerted by climate strategies on the consumption of energy and water, two basic factors for production, will cause further changes in economic development (De Munck et al., 2018), especially for China, the largest emitter in the world (Guan et al., 2012). China has adopted an extensive development mode for a long time, which features high energy and water use (Song et al., 2011). The carbon peaking and carbon neutrality goals put forward then will cause a major blow to the energy-intensive and water-intensive industries (Liu and Wei, 2022), thereby affecting the whole national economic development. However, the protection of the environment cannot be at the cost of excessive economic losses (Peng et al., 2020). Under the premise of strict control of energy and water use, how to minimize the negative impact on economic development requires more attention due to its significance for the realization of sustainable development.
The impact and mechanisms of carbon emission mitigation goals on economic growth also attracted the attention of the academia (Xu et al., 2022; Wang, K et al., 2022; Khan et al., 2021). Several studies have pointed out the relationships between carbon emission reduction, economic growth and energy consumption, such as natural gas (Wu et al., 2021), petroleum (Wesseh and Lin, 2018), or electricity (Zhao et al., 2018). Yang et al. (2017) have estimated the roles of non-fossil and fossil energy in the tradeoff between dual goals of economic growth and carbon emissions reduction. And they found that fossil energy consumption will be reduced under carbon mitigation goals, but will further favor the development of the economy if human capital investment has been promoted. Agboola et al. (2021) have also confirmed the role of energy consumption between carbon emission reduction goals and economic development. It has been reported that there exists a feedback relationship between energy consumption and economic growth and a one-way path between energy consumption and CO2 emission. It can be seen that, even though some scholars have realized that energy use plays an important role in the impact of climate goals on economic development, most of them have ignored the interference of water, another resource closely related to energy production and basic for economic system simultaneously. However, water and energy are closely connected with each other no matter the socio-economic development process or ecological system (Lampert et al., 2016; Wang et al., 2019). Excessive energy consumption will cause carbon emissions, consequently driving the worsening climate changes. Climate changes may probably further aggravate water constraints, which also interferes with economic development (Tra et al., 2018; Brown et at., 2019). Therefore, it is more reasonable to analyze the impact of energy and water on economic growth under the carbon mitigation target simultaneously.
Various tools and methods has been employed to explore how can the above energy or resource constraints affect economic growth. Zhu et al. (2021) induced the constraints of energy consumption into the DEA model to analyze the green growth degree with limited energy. The results reveal that the energy consumption of all industrial sectors is not conducive to achieving effective growth and required to be improved. Nieto et al. (2019) developed a broader system dynamics model (MEDEAS) and input-output method to simulate emissions and GDP growth under energy constraints in different scenarios. The results show that by 2050, efficient economic structure and energy intensity reduce the restraining effect of energy on economic growth, which further boosts energy demands. And as a consequence, GDP growth is hampered under the energy constraints. “Growth drag effects model” is another popular tool to describe the impacts of energy and resources constraints on economic growth (Zhao et al., 2019; Zhang et al., 2022; Zhou et al., 2022). It has first been introduced to explore the impacts of limited ecological factors input on economic issues by Nordhaus (1992). Compared with traditional C-D and CES production functions, this method expands the technological progress neutrality hypothesis and can reflect the mutual substitution relationship among input factors in addition to higher operability of parameter estimation (Wan et al., 2012; Zhang et al., 2022). Xu et al. (2018) employed Romer’s growth drag theory to predict the drag effect of coal consumption on economic growth in China. The results show that the economic growth rate will drop by 2.52% compared to the previous year due to the constraints of coal consumption. Zhang et al. (2011) tested the economic growth drag caused by energy and found that the growth drag of energy during the urbanization process in China is around 0.2692. Taking only one resource into the drag effect model may not be accurate and comprehensive enough to reflect the real impacts of resource constraints on the economic development to some extent.
Until now, even though the relationship between energy or water and economic development has already been a hot topic, scholars have not reached a consensus. Some studies reported that energy and water resources are important driving forces for the economy, and the increasing input will bring corresponding positive economic effects (Fang and Chen, 2017; Adams et al., 2018). Others further proved that the relationship between energy and water resources and economic growth is not a simple linear relationship but an “N” type or an inverted “U” type relationship (Lee and Chang, 2007; Kumar et al., 2020; Hosseinzadeh et al., 2022). The different results can be attributed to distinctive ecological and socio-economic conditions, especially in China, a country with a vast territory. Different areas in China have featured various energy and water endowment, industrial base, and development modes during various periods (Wang, Y et al., 2022; Wang and Wu, 2021; Chen and Wang, 2008). Therefore, the state of decoupling of regional energy or natural resources and economic development shows significant heterogeneity spatially and temporally (Shi et al., 2016; Dong et al., 2019). An et al. (2018) quantitatively analyzed the constraint effect of water consumption on the urbanization of the Yangtze River Economic Belt, and stated that the urbanization process of the Yangtze River Economic Belt has slowed down by 0.574%, due to the constraints of water resources consumption. Zhou et al. (2022) reported that the total drag effect of natural resources on economic growth in the Yellow River Basin is about −0.8347 through the classic panel model estimation. Pan et al. (2021) found that the drag growth effect of water resources in Chongqing was about 0.3%–0.5%, slightly less than the result of Chengdu, which reflected the relatively lower dependence of industrial development in Chongqing on water resources. Since it is impossible to obtain its characteristics and dynamic rules by only studying energy or water resource constraints in a certain time or single region, a detailed analysis of drag effects’ temporal-spatial patterns is necessary.
According to the above literature reviews, rich relevant researches have provided guidance for our study on the drag effect of energy and water constraints on economic growth and its changes under different carbon control scenarios, but there are also some possible gaps to fill: 1) We bring energy and water resources into the same research framework to analyze the comprehensive constraint effect of energy and water resources on economic growth using modified Romer’s economic growth model. 2) China’s carbon peak goal will lead to greater constraints on energy and water, which are necessary elements in production. Harder limitation of them may damage the economy to some extent. To forecast the economic growth paths under China’s energy-water constraints considering the dual-carbon goals, we set the baseline scenario, the strong carbon control scenario, and the weak carbon control scenario in 2030 according to different government regulations on resource consumption. 3) The temporal and spatial changes of the comprehensive constraint effect of energy and water resources on economic growth have been further analyzed. In turn, areas with different types of energy-water damping characteristics are distinguished. Based on the classification, targeted policy implications are put forward to provide theoretical support for balancing the coordinated development of natural resources and the regional economy.
2 Materials and methods
2.1 Construction of the drag model
According to the hypothesis put forward by the new growth theory, due to the shortage of natural resources or people’s over-exploitation, resource utilization per capita will be limited and the economic growth rate will be lower than that without resource constraints. The reduction is called the growth drag or growth tail effect (Romer, 2001). Using Romer’s (2001) economic growth model under environmental constraints, this paper further introduces energy and water resources into the C-D production function and constructs an economic growth damping model with both energy and water resources constraints based on the output growth rate of the unit labor force under energy-water constraints (Pan et al., 2021). At the same time, the assumption of CRS is altered to discuss the drag effect of energy-water resources on economic growth under the condition that the return to scale changes.
2.1.1 Measurement of the growth rate of unit labor output
The basic mathematical formula of the Solow model is Y=Kα(AL)1-α, where K is capital, L is labor, and A represents the level of technological development. The classic Solow model does not take natural resources into consideration. Romer (2001) introduced the impact of resources on economic growth later, which represents as Y=KαResourceβ(AL)1-α-β. In this paper, energy and water are supposed to be taken into the same framework, so we assume that energy and water inputs increase with the growth of the labor force when energy and water are unconstrained with reference to Pan et al. (2021) and Zhang et al. (2022). Based on this, we further divide the resource into energy and water, and a drag model of energy-water on economic growth is constructed, as shown in Eq. 1:
Where Y represents economic output; K, W, A, L, and E are capital, water resources, technological progress, labor, and energy respectively; the product of A and L denotes effective labor; α is the elasticity of capital, β is the elasticity of water, λ is the elasticity of energy and θ is the elasticity of effective labor. Thereinto, θ=1-α-β-λ.
After performing logarithm operations on both sides of Eq. 1, we can obtain Eq. 2.
Then this paper takes the derivative to obtain the relevant formula of the growth rate of each variable (expressed by g):
When economic growth is on a balanced path, the growth rate of output is regarded as equal to the growth rate of capital, expressed as gK(t)=gY(t). So we can get:
where
Then the growth rate of output per unit labor force with or without energy and water resources constraints can be calculated as shown in Eqs 5 and 6.
According to Romer’s model, without the constraints of energy and water resources, the growth rate of energy and water resources is equal to the growth rate of effective labor. That is, in Eq. 7:
So the Eq. 7 can be written as Eq. 8:
2.1.2 Growth drag of energy-water
Based on the definition of growth drag, the drag effect on economic growth caused by energy-water constraints can be obtained according to the growth rate of output per unit of the labor force in the presence and absence of energy-water constraints, namely Eqs 5 and 8. Simultaneously, under the balanced growth path, let {
Where Z is the drag effect of energy-water constraint, n is the growth rate of the labor force, w is the real growth rate of water resources, and e is the real growth rate of energy (Table 1). The greater the Z value, the greater the difference between the growth rate of output per unit of labor with and without restrictions on energy and water, indicating a stronger energy-water constraint. According to the formula, the drag effect is positively correlated with the output elasticity of capital, energy, water resources, and labor productivity, and negatively correlated with the real growth rate of water resources and energy. The same method is adopted to derive the expression of the drag effect of energy and water resources, as shown in Eqs 10 and 11.
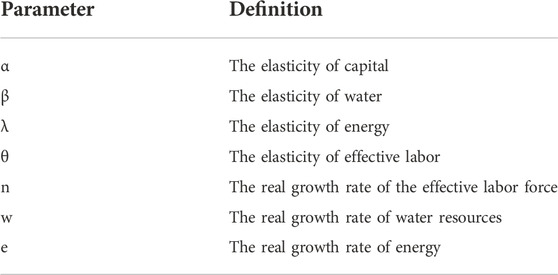
TABLE 1. Parameter definition.
For the calculation of the growth rate of the labor force, water resource consumption, and energy consumption, the method of Mi and Chang (2017) is used for reference. The calculation formulas are shown in Eqs 12–14:
Where Y0 is the value of the variable in the base period, Yt is the value of the variable in the end period, and t-1 is the growth period.
2.2 Data resources
Limited by available data related to energy statistical indicators from Tibet, Hong Kong, Macao, and Taiwan, this paper selects relevant data of 30 provinces from 2000 to 2019. The variables include total output, energy input, water resource input, capital input, labor input, and technological progress (see details in Supplementary Data Sheet 1). Among them, total output and capital input are adjusted using 2000 as the base period. The meanings of the variables are shown in Table 2.

TABLE 2. Variable description.
3 Comprehensive constraint effect of energy and water
In this paper, the energy-water constraint model was first tested for multi-collinearity. The results showed that the variance expansion factor of each variable was greater than 10, indicating that the model had strong multicollinearity. Therefore, we adopted the ridge regression method to obtain more stable regression results by sacrificing unbiasedness (Bin et al., 2013). In this way, the effects of multicollinearity will be eliminated and more accurate regression coefficient values can be acquired to enhance the scientific validity and feasibility of this model.
The regressive results showed that the elasticity coefficient of capital output, water resources output and energy output are 0.413, 0.195, and 0.252 respectively. And the t-test values of each variable are 31.037, 10.962, and 45.234, which all passed the significance test. Then we further worked out the elasticity coefficient of effective labor output, which is about 0.140. From the regression results, we could see that capital had a prominent impact on total output. A change in capital input per unit would cause a change in total output by 0.413 units, which was significantly greater than that caused by the variation of energy and water input per unit.
Additionally, the paper carried out a stationarity test on the residual series to prove that the original data was stable. The adjusted R-squared of our regressive model was 0.99, and the F-value of the model was also significant, which confirmed the stability of the coefficient results and the validity of the model as a whole.
3.1 Analysis of temporal trends
To explore the dynamic evolution trend of energy-water growth drag during the study period, we used ridge regression to measure the energy, water, and energy-water growth drag from 2001 to 2019. The magnitude and dynamic variation trend of each growth drag are shown in Figures 1, 2.
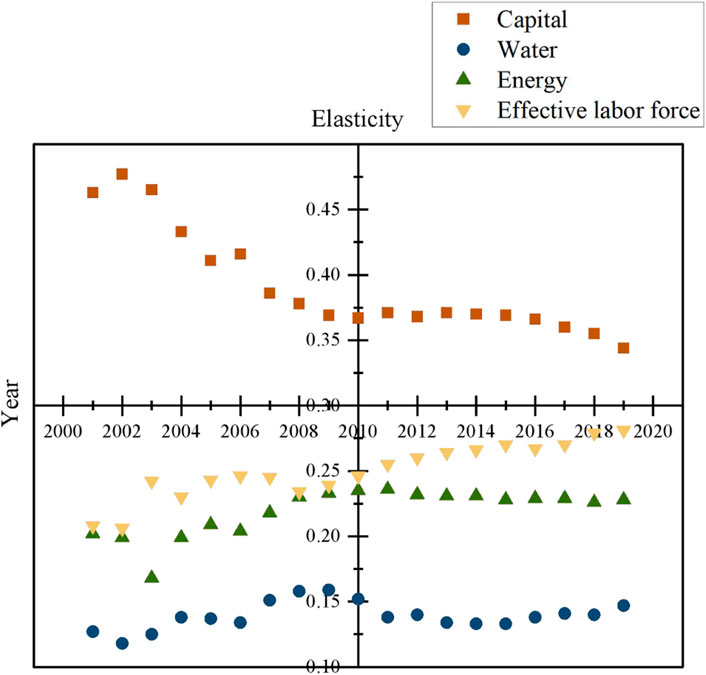
FIGURE 1. Elasticity coefficients variables from 2001 to 2019.
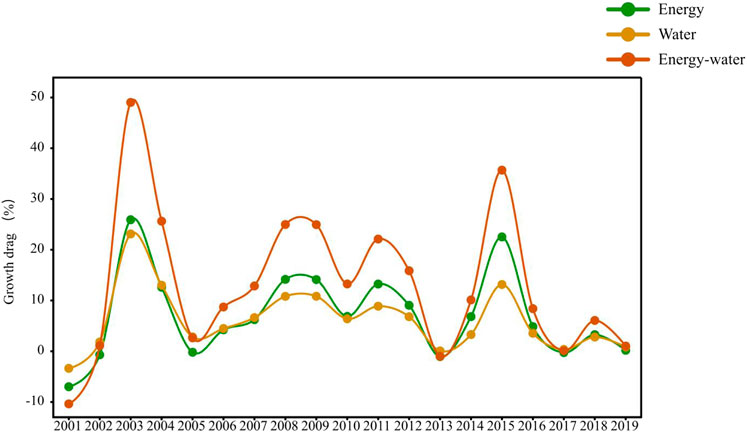
FIGURE 2. Drag effects of China from 2001 to 2019.
In terms of the elasticity coefficient, the energy and water output elasticity coefficients generally increased first and then decreased from 2001 to 2019. The sensitivity of economic development to energy and water inputs peaked around 2009 and 2010. China’s “11th Five-Year Plan for Energy” clearly defined energy conservation targets and limited total energy use around 2010. At the same time, China’s Ministry of Water Resources proposed to initially build a water-saving society target system by 2010. Since that China was devoted to regulating high water and energy-consuming industries, water-energy-extensive development modes has been changed. In this view, economic growth gained new momentum and its reliance on natural resources and energy declined after 2010. Besides, capital still played a dominant role in economic growth but represents a generally downward trend, while the elasticity coefficient of effective labor output on the whole tended to rise. It shows that as the country continued to push for economic development reform, measures like optimizing the structure of human capital and increasing the investment in R&D have led to a continuous improvement in the level of human labor. In this case, the effective labor force kept making an increasing contribution to economic growth. With the demographic dividend turning into the talent dividend step by step, the dependence of economic development on resources and capital got alleviated.
In terms of the drag effects, according to the results of the ridge regression, the total energy-water growth drag of 30 provinces in China from 2000 to 2019 is 15.699%, among which the energy growth drag is 7.715% and the water growth drag is 7.985%. The results indicated that compared with the unconstrained scenario, the rate of economic growth was reduced by 15.699% under the dual constraints of energy and water resources. From the perspective of dynamic changes, the growth drag effects of energy-water overall fluctuated a lot from 2001 to 2019. Its variation trend was generally consistent with that of energy growth drag and water resources growth drag, suggesting that it was influenced by both the two factors to the similar extent. Based on the significant characteristics of the different stages and important policy nodes, the trend of drag growth effect from 2001 to 2019 can be divided into three stages: the early stage (2001–2008), middle stage (2009–2013), and late stage (2014–2019). In the early stage, the growth drag curve of energy-water fluctuated sharply. With the growth drag of energy and water both negative in 2001, energy-water did not form obvious constraints on economic growth in the beginning. However, along with the extensive economic growth, the problem of energy and water scarcity began to emerge. The growth drag of energy-water resources reached a peak of nearly 50% in 2003, indicating that the hindering effect of energy-water resources on China’s economic growth was significant in this period. In the middle stage, under the background of national economic recovery, the development mode was progressively transformed and upgraded. The growth drag curve of energy-water was relatively flat compared with the early and late periods. Its value gradually stabilized below 30%, demonstrating that the constraint effect of energy-water resources on economic development was weakened. In the later stage, Chinese government turned to focus on high-quality development, and the society has been devoted to improving the efficiency of water resource and energy use. Under this background, the constraining effect of energy-water resources on economic growth might be significantly reduced. Hence, the energy-water growth drag curve generally lay below the previous curve. Although in 2015 the curve reached its second peak during the study period, the value was much lower than that in 2003 and the effect stayed below 10% after 2016.
3.2 Analysis of the spatial distribution pattern
In view of the obvious differences in economic structure and development mode among provinces in China, this paper analyzed the spatial distribution pattern of the energy-water growth drag of each province from 2000 to 2019. We took the average value of energy and water growth drag of each province as the standard and then made classifications. Provinces with energy growth drag below 12.82% were classified as low-energy-constrained areas and provinces with water resources growth drag below 11.59% were classified as low-water-constrained areas. There into, low-energy-constrained provinces mean the economic growth rate under energy constraint shows little difference from that with no energy constraint. That is, compared with effective labor growth rate, the relative decrease extent of energy input does not count much for the economic system operation. Similarly, the concept of “low-water-constrained areas” represents a few changes in economic growth rate with or without limited water input. In the following analysis, we simply named the areas with low water and energy constrains on economic growth as “double low” regions, and vice versa. Notably, the drag effect can only reflect the hypothetical dynamic changes in the economic growth caused by different energy and water input, but not the actual economic impacts. On this basis, this paper introduced the average GDP growth rate of each province from 2000 to 2019 to explore the actual impact of different energy-water constraints on regional economic growth. The results are shown in Figure 3.
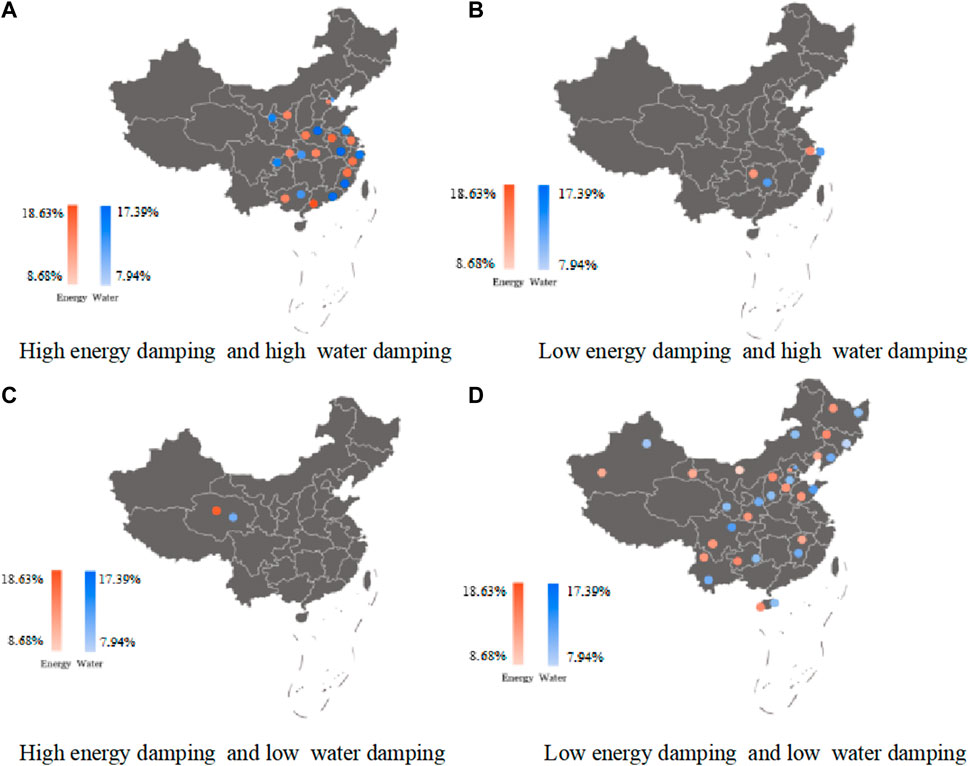
FIGURE 3. Spatial distribution patterns of the growth drag. (A) High energy damping and high water damping. (B) Low energy damping and high water damping, (C) High energy damping and low water damping. (D) Low energy damping and low water damping.
The “double high” regions include Guangdong, Anhui, Fujian, Henan, Zhejiang, Jiangsu, Chongqing, Ningxia, Hubei, Guangxi, and Tianjin, most of which were located in the East China. The eastern regions in China carry the largest population and the most industrial agglomerations. The demands for water and energy in daily life and production raise challenges for the energy and water supply. The contradiction between the high demand for energy and water resources and the tight supply then results in significant energy and water resources constraints. Some of these provinces had high elasticity of capital output, indicating that the capital-driven crude economic growth was more vulnerable to energy and water constraints. However, according to the real GDP growth, the overall economic growth rate of these “double high” regions was higher than the national average level. This means that even though the water and energy inputs are supposed to restrict economic growth, some other factors will drive the economic development at the same time. Therefore, we further tested the contribution of technological progress to the economy. The result show that technological progress may be another key factor to drive economic development and can alleviate partial constraining effect of energy and water on economic growth.
Hunan and Shanghai are areas with low energy constraints and high water constraints on economic growth. As one of the typical cities with quality-induced water shortage in China, Shanghai was economically developed and densely populated. A large amount of wastewater discharged from production and life led to the shortage of freshwater resources. Meanwhile, Shanghai had a high elasticity of water resources output, which contributed prominently to economic development. So, the regional water resources growth drag was higher than the national average. Hunan was a large rice supplier, whose economic development was highly dependent on water resources. But there were always seasonal and regional water shortages and other problems in this region, which created greater restrictions on economic growth and tightened water constraints. In this context, the economies of Shanghai and Hunan maintained steady development. Shanghai’s economic aggregate has ranked first in China for many years and Hunan’s GDP growth rate was also above the national average level. The high water growth drag effect and high economic growth rate meant that Shanghai and Hunan were not as water-dependent as calculated, and improvement of water use efficiency may be key to break the water constraints on economic systems.
Qinghai is the area with high energy constraints and low water constraints. The energy industry was the leading industry that supported the economic development of Qinghai Province. Electric power and petroleum were all its pillar industries. As a result, the energy elasticity coefficient of Qinghai Province ranked second in the study period, and the energy constraint was tight. Abundant water resources made the water growth drag in Qinghai relatively low. The economic development was not obviously constrained by water resources. In addition, Qinghai’s GDP growth rate stayed above the national average. Low water constraints and high economic growth rates suggested that a large amount of water input was an important factor for economic development in Qinghai.
The fourth category is areas with both low energy constraints and low water constraints, including Shandong, Sichuan, Shaanxi, Jiangxi, Yunnan, Beijing, Liaoning, Guizhou, Shanxi, Hainan, Heilongjiang, Hebei, Inner Mongolia, Gansu, Xinjiang, and Jilin. It could be seen that provinces in these areas were mainly concentrated in the northern part of China. The reason was that the north was China’s energy base. The rich coal and mineral energy eased the conflict between energy supply and demand in these areas, thus exerting little constraint on economic growth. In terms of water resource constraints, the region’s dependence on water resources was relatively small as its economic growth relied mainly on energy resources such as oil and coal (Zhang et al., 2020). In addition, due to the measures like developing water-saving irrigation agriculture and strengthening management and control in high water-consuming industries, the elasticity of water resources output in northern China was reduced and the damping value of water resources was low. On the whole, in the areas with both low energy constraints and low water constraints, more than half of the provinces’ GDP growth rates lagged behind the national average level, and the overall economic level also lagged behind that of “double high” regions. This showed that under the relatively sufficient energy and water resources input, provinces in the “double low” regions did not obtain significant economic benefits, indicating that the productivity level of this region was low and in urgent need to carry out productivity reform.
In conclusion, from a nationwide perspective, the constraint effects of different provinces mainly feature “double high” and “double low”. The “double high” areas were mainly in the east while the “double low” areas were mainly in the north. The “double high” areas should continue to maintain and improve the current economic development model and play an exemplary role. The “double low” areas should improve the productivity level on the basis of rational exploitation and utilization of resources.
4 Scenario prediction of energy–water constraint effects
Greenhouse gases from fossil fuels exacerbate global climate change and pose a threat to sustainable development. It has been proposed at the 75th General Debate of the United Nations General Assembly that China strove to reach the carbon peak by 2030 and carbon neutrality by 2060. The dual-carbon targets will have a profound impact on China’s energy structure transformation. Meanwhile, the energy consumption process is closely related to the water resource consumption process. So, to examine the effects of carbon mitigation goals on the growth drag effects of energy and water resources, this paper uses the national data in 2020 as a benchmark and forecast the energy constraint on economic growth in 2025 and 2030 under different carbon control strategies.
4.1 Scenario setting
Carbon peaking is the basis and premise for carbon neutrality to some extent. In the future, whether China is able to reach peak carbon on time largely depends on the strength of government’s regulations on consumptive energy and resource control. That is, under different control strategies, the energy and water constraints on economic growth will also feature various. Therefore, we further set three scenarios to simulate the energy-water constraint effects in China under different development paths, which are based on different levels of government regulation: the baseline scenario, the strong carbon control scenario, and the weak carbon control scenario. Different carbon control levels will affect the growth rates of energy and water resources, which are supposed to be changed in three scenarios referring to Chi et al. (2014). Given that water does not exert a direct impact on carbon emissions, the water resource growth rates remain the same in the three scenarios limited by available data (Figure 3). Additionally, the elasticity of the indicators each year is consistent with the regression results of 30 China’s provinces and cities in 2019.
1) The baseline scenario assumes that China would meet the peak target by 2030 as promised. We first set 2025 baseline scenario to provide a reference for the following analysis. The 14th Five-Year Plan Outline stated that by 2025, the supplies of non-fossil energy will reach 1.1 billion tonnes of standard coal, which might cover 20% of total energy consumption. Then we set the 2030 baseline scenario according to the energy production and consumption revolution strategy (2016–2030), which stated that total energy consumption will be controlled within 6 billion tons of standard coal (Table 3).
2) The strong carbon control scenario assumes that China will achieve the peak goal ahead of schedule. Given that China has promised to go from carbon peak to carbon neutral in a much shorter time than developed countries, the strong carbon control scenario supposes that the government would take more aggressive measures on consumptive energy control. Therefore, in this scenario, we assume that China’s energy consumption in 2030 grows at a rate 0.5% lower than the baseline scenario (Lin and Wu, 2021).
3) The weak carbon control scenario presumes that the peak time in China will be delayed. The transformation of China’s economic development mode might have certain difficulties and the industrial structure adjustment may be slow. The existing industrialization and urbanization model probably has an inertia. Based on this, the changes in the energy consumption growth rate from 2020 to 2030 is set according to the average growth rate from 2016 to 2020 (Xu et al., 2020).
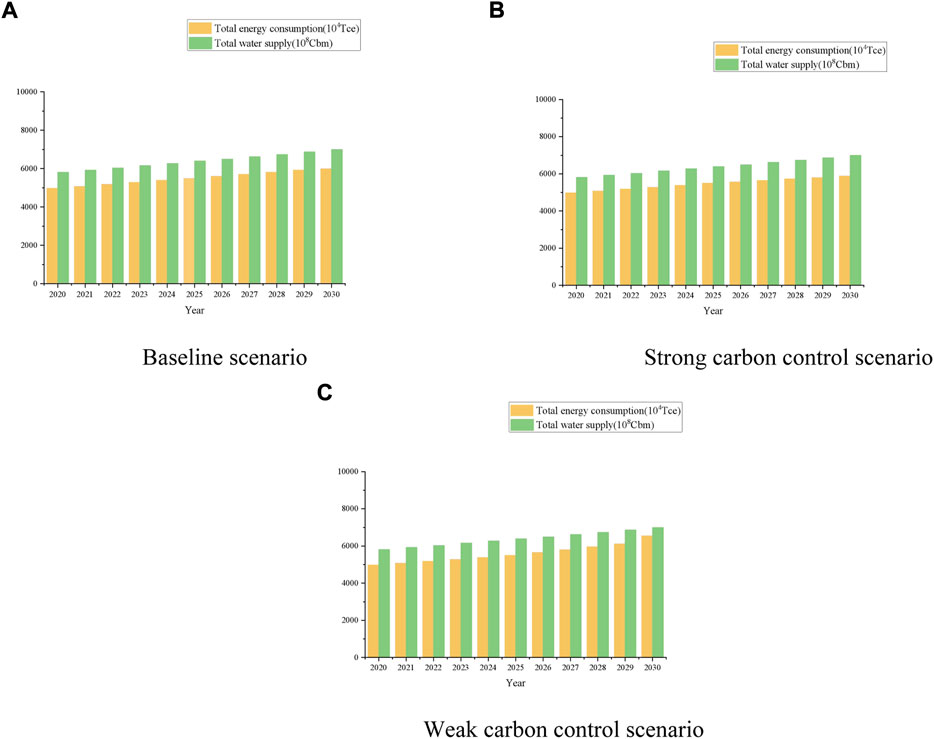
FIGURE 4. Forecast of energy consumption, and water supply in 2030, (A) Baseline scenario. (B) Strong carbon control scenario. (C) Weak carbon control scenario.
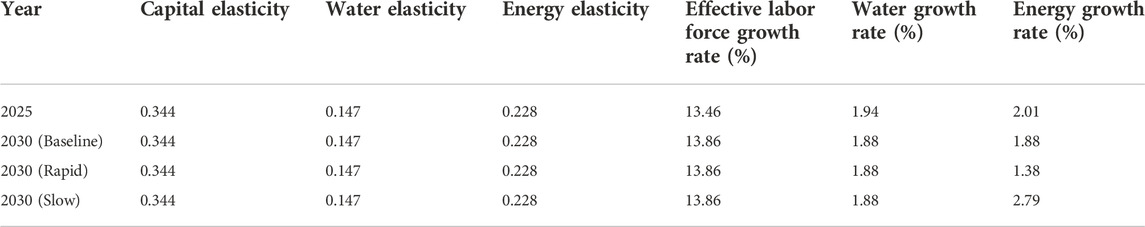
TABLE 3. Variable set.
4.2 Results and analysis
The “14th Five-Year Plan” is the window period for the carbon peak, as well as a critical stage for low-carbon energy transformation. The projections show a significant increase in the growth drag of energy-water resources in 2025 compared to 2019 as the carbon control efforts are enhanced (Table 4). This is because the state has strengthened the control of energy and water resources on the original basis and reduced their growth rate, thus leading to the increase of damping value.
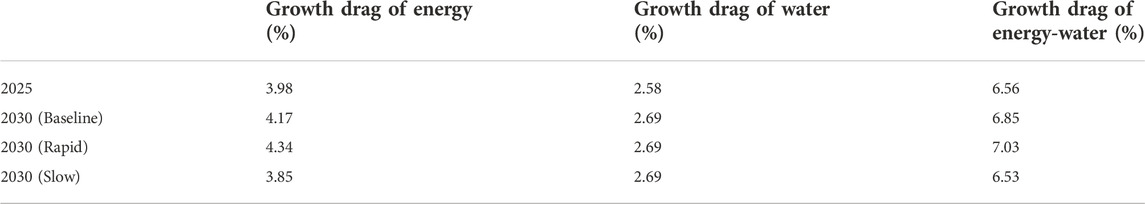
TABLE 4. Results of scenario prediction.
The energy-water constraints are mainly stronger in 2030 than that in 2025. Under the baseline scenario, China might tend to meet its commitment to peak in 2030 as stated in current plans and policies. Through energy reform and ecological civilization development, China would take active measures to reduce carbon emissions and keep energy growth at 1.88%. However, economic development will be negatively affected by 6.85% due to the stranded assets and rising costs in the process of industrial transformation, and the existing energy-water constraints.
Under the strong carbon control scenario, the damping value of energy growth (7.03%) is larger than that in the baseline scenario and the slow-peak scenario. The strict carbon control limited excessive energy consumption, which has a strong negative effect on the traditional energy-extensive economic growth model. Energy constricts will restrict around 7.03% of China’s economic growth rate, which poses a greater economic risk than the baseline scenario.
In the weak carbon control scenario, the government would not deliberately take control of carbon emission, which possibly leads to more energy input. The drag effect of energy-water resources is the lowest (6.53%) among the three scenarios. Although the loose energy-water constraint means small economic losses, the rapid economic growth may cause rapid growth in energy consumption and a large increase in carbon emissions under the existing technical conditions.
5 Discussion
5.1 Synergism and heterogeneity: Characteristics of energy and water resources growth damping
Energy and water resources are closely linked in economic development (Cai et al., 2018). At present, around 15% of the world’s water is utilized for energy, and 8% of the energy consumed worldwide goes toward producing water (Tsolas et al., 2018). On the one hand, the extraction, processing, consumption, and other aspects of energy are inseparable from water resources. On the other hand, energy also plays an important role in the production, use of water resources and wastewater treatment processes. Such a synergistic relationship between them makes energy and water constraints also interact with each other. The strengthening of energy constraints will further affect the normal production and utilization of water resources, thus causing the enhanced water constraints. As Figure 2 shows that, the trend of the energy-water growth drag was generally consistent with that of energy and water growth drag, respectively. This indicates that energy and water constraint keep pace with each other to ultimately have a combined constraint effect on economic growth.
The constraint effects of energy and water resources on economic growth exhibit some heterogeneity, as well. To be specific, firstly, water resources are renewable (Jowsey, 2012), which can alleviate the constraints of water resources on economic growth to a certain extent. While energy is not renewable, and its constraints on economic growth will increase day by day. Therefore, the growth drag of energy from 2001 to 2019 was generally greater than that of water resources. Second, under the premise of the uneven spatial distribution of energy and water resources, water dispatch is costly (Yevjevich, 2001), while energy dispatch is more feasible. Therefore, there are more obvious regional differences in water consumption compared with energy. For example, the measurement results of the overall growth drag of energy-water constraints for each province and city from 2000 to 2019 indicates that the areas with low water constraints are mostly located in water-scarce areas, while the areas with high water constraints are mostly concentrated in water-abundant areas.In water-scarce areas, water resources are scarce and costly to dispatch. The high price of water resources does not have a comparative advantage. Enterprises tend to avoid engaging in or developing water-intensive production activities to reduce the dependence of production on water resources. Therefore, the binding effect of water resources on economic development in the region is relatively weak. The areas with high energy constraints, however, include both energy-rich and energy-deficient areas. On the one hand, energy-deficient areas can satisfy their energy dependence for development through energy dispatch. On the other hand, energy-rich regions such as the west and the north will instead tighten the energy supply for local economic production in order to meet the massive energy demand in the east. With no change in the scale of local production, the binding effect of energy on economic development will be further accentuated. The above shows that the geographical location factor has a stronger influence on the growth drag of water resources.
5.2 Risk and conflict: Necessity to balance economic growth and carbon reduction
Under the dual-carbon target, China’s energy-water constraints will be further strengthened. In the weak carbon control scenario, China will choose to burden small economic losses and relax the control of energy consumption. The economy has a minimal energy-water constraint. However, high energy consumption means high emissions, and it is difficult to achieve the carbon peak as expected. In the strong carbon control scenario, energy-water constraints are the greatest. The government would prioritize the dual-carbon target and might push ahead the peak time with greater economic development risks. It is evident that there is some inner conflict between the dual-carbon goal and economic development. On the one hand, the strengthened control of energy and water resources will guarantee the achievement of peaking carbon dioxide emissions in 2030, but the stronger the carbon control, the stronger the energy-water constraint on economic growth will be. The constraint will also continue to affect the economic growth rate after the peak. On the other hand, China’s per capita GDP is far lower than that of developed countries. Development remains the first priority at this stage. However, accelerated economic growth may put more pressure on natural resources, thus affecting the successful achievement of the peak target. Therefore, China need to take both the goal of reaching the peak and economic development into account and seek a balanced development path between the two.
Therefore, this paper proposes policy implications to alleviate energy-water constraints, ensure economic development and achieve the dual-carbon goal from the following aspects.
1) Trade-off between the energy, water resource constraints, and economic growth under the dual carbon goal requires careful consideration. The dual-carbon goal puts forward strict requirements on energy and water consumption, and the backward industrial structure and energy consumption structure will make the economic loss aggravated. Therefore, it is necessary to promote the transformation and upgrading of the industrial structure and energy consumption structure. The inspection system for energy consumption and energy conservation indicators are encouraged to be implemented. Specifically, we supposed that high-carbon industries need urgent upgrading to eliminate outdated production capacity. At the same time, new energy should be developed and the regional energy consumption structure needs to be optimized. Secondly, a water-saving and energy-saving water price system are suggested to be constructed. It can provide support in regulating resource and energy consumption to eliminate energy-intensive and water-intensive industries. Then the energy and water resource utilization efficiency will increase. Thirdly, it is necessary to integrate the energy and water compensation mechanism. A carbon rights and water rights market system that includes energy consumption and carbon emissions, water resources consumption, and wastewater discharge is necessary. This system can guide the return of capital income from regions rich in resources and energy to improve the local utilization of scarce energy resources. Funds are encouraged to be guided from high-emission and high-consumption areas to flow into environmental protection funds, and achieve economic and ecological complementarity through market-oriented mechanisms.
2) Heterogeneous energy and water constraint strategies need to be implemented catering to the local economic base and resource endowment. For areas with merely high water constraints, such as Hunan and Shanghai, it is important to decrease the dependence of economic production on water resources considering the local condition. Hunan is regarded as a place with seasonal water shortage, so an energy-driven water storage and conditioning system has to be established to meet the constant needs of economic development in four seasons. And due to the quality-induced water scarcity in Shanghai, more funds are appealed to invest in the renovation project of businesses with high water pollutants. Working out the primary water pollutant discharge standard for water-intensive industries also has practical significance to clean production and sustainable development. For the regions with high energy growth damping such as Qinghai, the hydropower sector will serve as an important inflection point for reversing energy constraints. Using water resources to replace energy for power generation can be a feasible measure to disperse the dependence of economic development on energy. What’s more, the cooperation between regions with high water or energy constraints needs to be enhanced. United markets are suggested to be developed, which support cross-regional water and energy use rights displacement. In this case, energy and water resource will be reallocated to meet different manufacturing requirements in various regions.
3) Focus on technological innovation input and improve the quality of the labor force. In the future, the energy and water constraints on economic growth will continue to be strengthened under the dual-carbon target. China needs to strike a balance between economic development and the effectiveness of emission reduction. In order to reduce the economic loss caused by the energy and water constraints in the process of achieving the dual-carbon target, technological innovation is an essential measure. It is necessary to increase the investment in the R&D department and focus on the research of advanced technologies to develop new energy, deal with wastewater, and so on. Hence, the utilization of energy and water resources can be optimized and the utilization efficiency can be improved. In addition, China’s demographic dividend is currently decreasing and the supply of backbone talent is insufficient. So we need to strengthen the training and introduction of talents, promote the integration of research institutes, universities, and enterprises, and speed up the application and transformation of innovation results. In this way, the effective labor force can play a full role in supporting economic growth. Then we can reduce the dependence of economic development on capital, change the crude development model and diminish the impact of carbon emission reduction on China’s economy.
6 Conclusion
This paper incorporated the energy and water resources factors into the C-D production function and combined it with Romer’s damping model. Using panel data of 30 Chinese provinces from 2000 to 2019, this paper studied the temporal and regional differences of energy-water constraints on economic growth. Furthermore, we set different scenarios based on carbon control regulations to investigate the effects of climate goals on the energy and water growth drag effects. The following conclusions are drawn:
1) Both energy and water resources exerted constraint effects on China’s economic growth. Under the joint constraints of them, the economic growth rate decreased by 15.70%, including 7.99% due to the water constraint and 7.72% by the energy constraint from 2000 to 2019. The energy and water resources growth damping shows a significant fluctuating downward trend during the study period. This indicates that though economic growth has been constrained by energy and water resources, it is gradually alleviated.
2) In terms of spatial patterns, the constraint of energy and water resources on economic development represents significant regional heterogeneity. Most eastern regions with relatively advanced economies feature high energy and water resource constraints, while the regions with low energy-water constraints are mainly located in the north. Hence, different energy-water constraint strategy needs to be targeted with reference to local resource endowment and economic conditions. And cooperation between “double high” and “double low” regions is also necessary.
3) Under strong carbon emission reduction efforts, the energy-water damping effects are relatively high. The damping value of energy-water growth in 2025 is 6.56%, and that in 2030 are 6.85%, 7.03%, and 6.53% for the baseline, strong, and weak carbon control scenarios, respectively. The greater the carbon control, the tighter energy limitation during the process, and the more economic losses China will bear to reach the climate target, provided that the technical conditions remain unchanged. Improving the energy and water use efficiency is key to guarantee energy and water inputs and balance carbon reduction and economic growth.
Data availability statement
The original contributions presented in the study are included in the article/Supplementary Material, further inquiries can be directed to the corresponding authors.
Author contributions
YX: Revised opinions, writing-reviewing and editing, validation, writing-original draft preparation. CY: Methodology, software, data curation. JM: Conceptualization, supervision. ZG: Revised opinions, writing-reviewing and editing. XH: Visualization. SX: Validation, supervision. KQ: Editing.
Funding
The authors sincerely acknowledge the support by the Social Science Foundation of Jiangsu Province (22EYA001); Open Project of Yancheng Institute of Green and Low-Carbon Development (21ZD01).
Conflict of interest
The authors declare that the research was conducted in the absence of any commercial or financial relationships that could be construed as a potential conflict of interest.
Publisher’s note
All claims expressed in this article are solely those of the authors and do not necessarily represent those of their affiliated organizations, or those of the publisher, the editors and the reviewers. Any product that may be evaluated in this article, or claim that may be made by its manufacturer, is not guaranteed or endorsed by the publisher.
Supplementary material
The Supplementary Material for this article can be found online at: https://www.frontiersin.org/articles/10.3389/feart.2022.1059903/full#supplementary-material
References
Adams, S., Klobodu, E. K., and Apio, A. (2018). Renewable and non-renewable energy, regime type and economic growth. Renew. Energy 125, 755–767. doi:10.1016/j.renene.2018.02.135
Adham, S., Hussain, A., Matar, J. M., Dores, R., and Janson, A. (2013). Application of membrane distillation for desalting brines from thermal desalination plants. Desalination 314, 101–108. doi:10.1016/j.desal.2013.01.003
Agboola, M. O., Bekun, F. V., and Joshua, U. (2021). Pathway to environmental sustainability: Nexus between economic growth, energy consumption, CO2 emission, oil rent and total natural resources rent in Saudi Arabia. Resour. Policy 74, 102380. doi:10.1016/j.resourpol.2021.102380
An, M., Van, B., He, W., Zhang, Z., Qin, T., Huang, Z., et al. (2018). Drag effect of water consumption on urbanization—A case study of the Yangtze River economic Belt from 2000 to 2015. Water 10 (9), 1115. doi:10.339.0/w10091115
Andres, R. J., Boden, T. A., Bréon, F.-M., Ciais, P., Davis, S., Erickson, D., et al. (2012). A synthesis of carbon dioxide emissions from fossil-fuel combustion. Biogeosciences 9 (5), 1845–1871. doi:10.5194/bg-9-1845-2012
Bin, J., Ai, F. F., Liu, N., Zhang, Z. M., Liu, Y. Z., Shu, R. X., et al. (2013). Supervised principal components: A new method for multivariate spectral analysis. J. Chemom. 27 (12), 457–465. doi:10.1002/cem.2558
Brown, T. C., Mahat, V., and Ramirez, J. A. (2019). Adaptation to future water shortages in the United States caused by population growth and climate change. Earth's. Future 7 (3), 219–234. doi:10.1029/2018EF001091
Cai, J., Yin, H., and Varis, O. (2018). Impacts of urbanization on water use and energy-related CO2 emissions of residential consumption in China: A spatio-temporal analysis during 2003-2012. J. Clean. Prod. 194, 23–33. doi:10.1016/j.jclepro.2018.05.117
Cameron, C., Yelverton, W., Dodder, R., and West, J. J. (2014). Strategic responses to CO2 emission reduction targets drive shift in U.S electric sector water use. Energy Strategy Rev. 4, 16–27. doi:10.1016/j.esr.2014.07.003
Chen, R., and Wang, J. (2008). Characteristics of groundwater markets in northern China:Is it related with the local water endowment? J. Nat. Resour. Policy Res. 23 (6), 981–989. doi:10.11849/zrzyxb.2008.06.004
Chi, Y., Guo, Z., Zheng, Y., and Zhang, X. (2014). Scenarios analysis of the energies’ consumption and carbon emissions in China based on a dynamic CGE model. Sustainability 6 (2), 487–512. doi:10.3390/su6020487
De Munck, C., Lemonsu, A., Masson, V., Le Bras, J., and Bonhomme, M. (2018). Evaluating the impacts of greening scenarios on thermal comfort and energy and water consumptions for adapting Paris city to climate change. Urban Clim. 23, 260–286. doi:10.1016/j.uclim.2017.01.003
Department of Energy Statistics, National Statistics Bureau of China (2021). China Energy Statistical Yearbook 2021. China Statistics Press. Available at: https://data.cnki.net/Trade/yearbook/single/N2022060061?zcode=Z025
Dong, F., Li, J., Wang, Y., Zhang, X., Zhang, S., and Zhang, S. (2019). Drivers of the decoupling indicator between the economic growth and energy-related CO2 in China: A revisit from the perspectives of decomposition and spatiotemporal heterogeneity. Sci. Total Environ. 685, 631–658. doi:10.1016/j.scitotenv.2019.05.269
Fang, Z., and Chen, Y. (2017). Human capital and energy in economic growth -evidence from Chinese provincial data. Energy Econ. 68, 340–358. doi:10.1016/j.eneco.2017.10.007
Fao, (2021). http://www.fao.org/nr/water/aquastat/countries_regions/tanzania/index.stm (Accessed, 2021).
Guan, D., Liu, Z., Geng, Y., Lindner, S., and Hubacek, K. (2012). The gigatonne gap in China’s carbon dioxide inventories. Nat. Clim. Chang. 2 (9), 672–675. doi:10.1038/nclimate1560
Hosseinzadeh, M., Saghaian, S. H., Nematollahi, Z., and Foroushani, N. S. (2022). Water consumption and economic growth: Evidence for the environmental kuznets curve. Water Int. 1, 16. doi:10.1080/02508060.2022.2091398
Jowsey, E. (2012). The changing status of water as a natural resource. Int. J. Sustain. Dev. World Ecol. 19 (5), 433–441. doi:10.1080/13504509.2012.693136
Khan, I., Han, L., and Khan, H. (2021). Renewable energy consumption and local environmental effects for economic growth and carbon emission: Evidence from global income countries. Environ. Sci. Pollut. Res. 29 (9), 13071–13088. doi:10.1007/s11356-021-16651-y
Kumar, R. R., Stauvermann, P. J., and Shahzad, S. J. H. (2020). Nexus between energy consumption, health expenditure and economic growth in Australia. Int. J. Oil Gas. Coal Trans. 24 (4), 543–572. doi:10.1504/IJOGC.T.2020.108053
Lampert, D. J., Cai, H., and Elgowainy, A. (2016). Wells to wheels: Water consumption for transportation fuels in the United States. Energy Environ. Sci. 9 (3), 787–802. doi:10.1039/c5ee03254g
Lee, C. C., and Chang, C. P. (2007). The impact of energy consumption on economic growth: Evidence from linear and nonlinear models in taiwan. Energy 32 (12), 2282–2294. doi:10.1016/j.energy.2006.01.017
Li, Z., Zou, Z., and Wang, X. (2018). Energy efficiency evaluation for wastewater treatment plant. dwt. 119, 276–281. doi:10.5004/dwt.2018.22912
Lin, W., and Wu, Jia. (2021). Discussion on China’s energy transition framework roadmap under carbon neutrality. Price Theory Pract. 8, 100130. doi:10.19851/j.cnki.cn11.1010/f.2021.06.83
Liu, J., and Wei, D. (2022). Analysis on the dynamic evolution of the equilibrium point of “carbon emission penetration” for energy-intensive industries in China: Based on a factor-driven perspective. Environ. Sci. Pollut. Res. Int. 28. doi:10.1007/s11356-022-22546-3
Mi, G., and Chang, Q. (2017). Economic growth “drag” under the energy structure and carbon emission constraint in China. J. Arid Land Resour. Environ. 32 (2), 50–55. doi:10.13448/j.cnki.jalre.2017.043
Mondal, U., and Yadav, G. (2021). Methanol economy and net zero emissions: Critical analysis of catalytic processes, reactors and technologies. Green Chem. 23 (21), 8361–8405. doi:10.1039/d1gc02078a
Murphy, C. F., and Allen, D. T. (2011). Energy-water nexus for mass cultivation of algae. Environ. Sci. Technol. 45 (13), 5861–5868. doi:10.1021/es200109z
Nayeb, H., Mirabi, M., Motiee, H., Alighardashi, A., and Khoshgard, A. (2019). Estimating greenhouse gas emissions from Iran’s domestic wastewater sector and modeling the emission scenarios by 2030. J. Clean. Prod. 236, 117673. doi:10.1016/j.jclepro.2019.117673
Nieto, J., Carpintero, Ó., Miguel, L. J., and de Blas, I. (2019). Macroeconomic modelling under energy constraints: Global low carbon transition scenarios. Energy Policy 137, 111090. doi:10.1016/j.enpol.2019.111090
Nordhaus, W. D., Stavins, R. N., and Weitzman, M. L. (1992). Lethal Model 2: The limits to growth revisited. Brookings Pap. Econ. Act. 2, 1–59. doi:10.2307/2534581
Pan, Y., Li, M., Tang, H., Wu, Y., and Yang, Z. (2021). Land use transitions under rapid urbanization in chengdu-chongqing region: A perspective of coupling water and land resources. Land 10 (8), 812. doi:10.3390/land10080812
Peng, B., Sheng, X., and Wei, G. (2020). Does environmental protection promote economic development? From the perspective of coupling coordination between environmental protection and economic development. Environ. Sci. Pollut. Res. 27, 39135–39148. doi:10.1007/s11356-020-09871-1
Shi, L., Vause, J., Li, Q., Tang, L., and Zhao, J. (2016). Decoupling analysis of energy consumption and economic development in China. Energy Sources, Part B Econ. Plan. Policy 11 (9), 788–792. doi:10.1080/15567249.2011.585372
Song, M., Wang, S., Yu, H., Yang, L., and Wu, J. (2011). To reduce energy consumption and to maintain rapid economic growth: Analysis of the condition in China based on expended IPAT model. Renew. Sustain. Energy Rev. 15 (9), 5129–5134. doi:10.1016/j.rser.2011.07.043
Stillwell, A., King, C., Webber, M., Duncan, I., and Hardberger, A. (2011). The energy-water nexus inTexas. Ecol. Soc. 16 (1). doi:10.5751/ES-03781-160102
Talati, S., Zhai, H., Kyle, G. P., Morgan, M. G., Patel, P., and Liu, L. (2016). Consumptive water use from electricity generation in the Southwest under alternative climate, technology, and policy futures. Environ. Sci. Technol. 50 (22), 12095–12104. doi:10.1021/acs.est.6b01389
Tra, T. V., Thinh, N. X., and Greiving, S. (2018). Combined top-down and bottom-up climate change impact assessment for the hydrological system in the Vu Gia-Thu Bon River Basin. Sci. Total Environ. 630, 718–727. doi:10.1016/j.scitotenv.2018.02.250
Tsolas, S., Karim, M. N., and Hasan, M. M. F. (2018). Optimization of water-energy nexus: A network representation-based graphical approach. Appl. Energy 224, 230–250. doi:10.1016/j.apenergy.2018.04.094
Tuninetti, M., Tamea, S., and Dalin, C. (2019). Water debt indicator reveals where agricultural water use exceeds sustainable levels. Water Resour. Res. 55 (3), 2464–2477. doi:10.1029/2018WR023146
Wan, Y., Dong, S., Wang, J., Mao, Q., and Liu, J. (2012). Damping effects of water and land resources on economic growth in Beijing. Resour. Sci. 34 (3), 475–480.
Wang, K., Zhao, B., Fang, T., and Zhang, J. (2022). Economic growth targets and carbon emissions: Evidence from China. Int. J. Environ. Res. Public Health 19 (13), 8053. doi:10.3390/ijerph19138053
Wang, M., Sun, C., and Wang, X. (2019). Analysis of the water-energy coupling efficiency in China: Based on the three-stage SBM-DEA model with undesirable outputs. Water 11 (4), 632. doi:10.3390/w11040632
Wang, P., and Wu, J. (2021). Impact of environmental investment and resource endowment on regional energy efficiency: Evidence from the Yangtze River economic Belt, China. Environ. Sci. Pollut. Res. 29 (4), 5445–5453. doi:10.1007/s11356-021-15980-2
Wang, X. C., Klemes, J. J., Wang, Y. T., Dong, X. B., Wei, H. J., Xu, Z. H., et al. (2020). Water-energy-carbon emissions nexus analysis of China: An environmental input-output model-based approach. Appl. Energy 261, 114431. doi:10.1016/j.apenergy.2019.114431
Wang, Y., Deng, X., Zhang, H., Liu, Y., Xue, T., and Liu, G. (2022). Energy endowment, environmental regulation, and energy efficiency: Evidence from China. Technol. Forecast. Soc. Change 177, 121528. doi:10.1016/j.techfore.2022.121528
Wesseh, P. K., and Lin, B. (2018). Energy consumption, fuel substitution, technical change, and economic growth: Implications for CO2 mitigation in Egypt. Energy Policy 117, 340–347. doi:10.1016/j.enpol.2018.03.022
Wu, D., Geng, Y., and Pan, H. (2021). Whether natural gas consumption bring double dividends of economic growth and carbon dioxide emissions reduction in China? Renew. Sustain. Energy Rev. 137, 110635. doi:10.1016/j.rser.2020.110635
Xie, Y., Qi, J., Zhang, R., Jiao, X., Shirkey, G., and Ren, S. (2022). Toward a carbon-neutral state: A carbon -energy-water nexus perspective of China’s coal power industry. Energies 15 (12), 4466. doi:10.3390/en15124466
Xu, G., Dong, H., Xu, Z., and Bhattarai, H. (2022). China can reach carbon neutrality before 2050 by improving economic development quality. Energy 243, 123087. doi:10.1016/j.energy.2021.123087
Xu, G., Schwarz, P., and Yang, H. (2020). Adjusting energy consumption structure to achieve China’s CO2 emissions peak. Renew. Sustain. Energy Rev. 122, 109737. doi:10.1016/j.rser.2020.109737
Xu, J., Zhou, M., and Li, H. (2018). The drag effect of coal consumption on economic growth in China during 1953-2013. Resour. Conserv. Recycl. 129, 326–332. doi:10.1016/j.resconrec.2016.08.027
Yang, L., Wang, J., and Shi, J. (2017). Can China meet its 2020 economic growth and carbon emissions reduction targets? J. Clean. Prod. 142, 993–1001. doi:10.1016/j.jclepro.2016.08.018
Yevjevich, V. (2001). Water diversions and interbasin transfers. Water Int. 26 (3), 342–348. doi:10.1080/02508060108686926
Zak, G. M., Ghobeity, A., Sharqawy, M. H., and Mitsos, A. (2013). A review of hybrid desalination systems for co-production of power and water: Analyses, methods, and considerations. Desalination Water Treat. 51, 5381–5401. doi:10.1080/19443994.2013.769697
Zhang, L., Li, J., and Li, Y. (2011). An analysis of growth drag of China’s urbanization caused by energy. Adv. Mat. Res. 353, 3179–3183. doi:10.4028/www.scientific.net/amr.347-353.3179
Zhang, Y., Liu, W. X., Khan, S. U., Swallow, B., Zhou, C. H., and Zhao, M. J. (2022). An insight into the drag effect of water, land, and energy on economic growth across space and time: The application of improved Solow growth model. Environ. Sci. Pollut. Res. 29, 6886–6899. doi:10.1007/s11356-021-16053-0
Zhang, Y., Liu, W., and Zhao, M. (2020). The drag effect of water resources on China’s regional economic growth: Analysis based on the temporal and spatial dimensions. Water 12 (1), 266. doi:10.3390/w12010266
Zhao, C., Wu, Y., Ye, X., Wu, B., and Kudva, S. (2019). The direct and indirect drag effects of land and energy on urban economic growth in the Yangtze River Delta, China. Environ. Dev. Sustain. 21, 2945–2962. doi:10.1007/s10668-018-0168-1
Zhao, W., Cao, Y., Miao, B., Wang, K., and Wei, Y. M. (2018). Impacts of shifting China’s final energy consumption to electricity on CO2 emission reduction. Energy Econ. 71, 359–369. doi:10.1016/j.eneco.2018.03.004
Zhou, Y. J., Li, D., Li, W. F., Mei, D., and Zhong, J. Y. (2022). Drag effect of economic growth and its spatial differences under the constraints of resources and environment: Empirical findings from China’s Yellow River Basin. Int. J. Environ. Res. Public Health 19, 3027. doi:10.3390/ijerph19053027
Keywords: energy-water constraints, economic growth, drag effect model, dual carbon goal, regional heterogeneity
Citation: Yu X, Chen Y, Jiang M, Zhong G, Xu H, Shen X and Kong Q (2023) The drag effects of energy-water constraints on China’s economic growth under carbon mitigation goals. Front. Earth Sci. 10:1059903. doi: 10.3389/feart.2022.1059903
Received: 02 October 2022; Accepted: 01 November 2022;
Published: 13 January 2023.
Edited by:
Hong Chen, Jiangnan University, ChinaReviewed by:
Hui Wang, China University of Petroleum, Huadong, ChinaJinxin Zhu, Sun Yat-sen University, China
Hongtao Chen, Southeast University, China
Copyright © 2023 Yu, Chen, Jiang, Zhong, Xu, Shen and Kong. This is an open-access article distributed under the terms of the Creative Commons Attribution License (CC BY). The use, distribution or reproduction in other forums is permitted, provided the original author(s) and the copyright owner(s) are credited and that the original publication in this journal is cited, in accordance with accepted academic practice. No use, distribution or reproduction is permitted which does not comply with these terms.
*Correspondence: Mingdong Jiang, cGt1am1kQDEyNi5jb20=; Xiaomei Shen, c3htQHljaXQuY24=
†These authors have contributed equally to this work and share first authorship