 Yingsha Jiang
 Yunfa Miao
 Yongtao Zhao2
 Jingjing Liu
 Yanhong Gao
94% of researchers rate our articles as excellent or good
Learn more about the work of our research integrity team to safeguard the quality of each article we publish.
Find out more
ORIGINAL RESEARCH article
Front. Earth Sci., 13 January 2023
Sec. Atmospheric Science
Volume 10 - 2022 | https://doi.org/10.3389/feart.2022.1058275
This article is part of the Research TopicExtreme Precipitation in Arid Regions: Observation, Mechanisms, and SimulationsView all 9 articles
Extreme-wind events not only cause disasters by themselves but can also trigger sandstorms, resulting in significant social and economic losses. Since recent years have experienced more frequent and severe extreme weather events, it is worth to explore how extreme-wind events response to recent climate change and how they impact the sandstorm variation. This work established two indices, EW90 and EW95, to identify extreme-wind events based on the relation between extreme-wind intensity and local-source sandstorm. EW90 and EW95 extreme-wind indices are defined as the daily maximum wind speeds greater than the 90th and 95th quantiles of local long-term historical records. The spatial distributions of EW90 and EW95 extreme-wind events are similar, which is higher in arid and semi-arid and coastal regions, and lower in southern China. Seasonally, extreme-wind events mainly occur in April and May for most areas over China, while they are more frequent from July to August for humid regions. During 1971–2020, both the EW90 and EW95 extreme-wind speeds and annual frequencies have significant decreasing trend (p < 0.01), while the daily mean wind speed does not decrease significantly. Extreme-wind events do not have significant abrupt change as well, while a turning positive trend after 2003 is found for mean wind speed. Moreover, sandstorm days are highly correlated with the EW90 and EW95 extreme-wind events, with linear and partial correlation coefficients around 0.95 and 0.5, respectively, while they do not have significant correlations with mean wind speed. Therefore, the significant reduction of sandstorms over northern China in the past 50 years is mainly due to the substantially decreasing extreme-wind events.
With global warming, the frequency of extreme weather events has increased significantly in recent years, such as the global extreme heatwave in summer 2022 and unusual floods in some regions (Alexander et al., 2006; Sillmann et al., 2013; Yu and Li, 2015). Many previous studies have explored extreme temperature and extreme precipitation events (Alexander et al., 2006; Qian et al., 2019; Russo et al., 2019), with a number of identification indices of extreme temperature and precipitation, but researches on extreme-wind events and related indices are relatively less discussed. In China, recent disasters caused by extreme wind have created a great deal of public concern. For example, in March 2021, northern China was hit by the strongest dust storm in 10 years, which affected 17 Northern provinces (including autonomous regions and municipalities directly under the central government). Extreme-wind events not only cause disasters by themselves easily, destroying roadside plants and buildings, but also trigger sandstorms or are accompanied by other extreme weather events, such as strong precipitation (Vallis et al., 2019; Outten and Sobolowski, 2021; Owen et al., 2021). Thus, forecasting such events is an important part of disaster prevention and control in meteorological administration. Furthermore, fine soil particles transported by extreme wind increase dust particles and reduce snow and ice-albedo feedback (Painter et al., 2007), and so affect regional climate and hydrology (He et al., 2019); on the other hand, they are an important part of the material cycle of the terrestrial ecosystem (Jickells et al., 2005; Yu et al., 2015). Meanwhile, long-term wind erosion also leads to soil coarsening, reduces soil fertility and increases the risk of desertification (Ravi et al., 2011; Li et al., 2018). More importantly, extreme-wind events threaten the security of tall buildings and bridges and the systemic management of wind power (Höltinger et al., 2019; Meng et al., 2019; Gonçalves et al., 2021), so their classification and estimation are also the focus of research field of wind power (Torrielli et al., 2016; Couto et al., 2021). Therefore, wind extremes play an important role in the prevention and control of meteorological disasters and desertification prevention, and control the understanding of the material cycle of the ecosystem and the management of wind power systems.
There are a large number of studies on land-surface wind speed (Pryor et al., 2009; McVicar et al., 2012; You et al., 2014), but only a few of them pay attention to extreme-wind speed. Among the small number of works concerning wind extremes, most of them focus on synoptic or convective extreme-wind events (Gatzen, 2013; De Gaetano et al., 2014; Lombardo and Zickar, 2019; Vallis et al., 2019): several mainly concern the concurrent events of extreme wind and extreme precipitation (Owen et al., 2021; Vignotto et al., 2021; Zhang et al., 2021), and extreme-wind events in the context of cyclones (Messmer and Simmonds, 2021). However, extreme-wind events accompanied by extreme precipitation, thunderstorms or cyclones mainly occur in eastern China (Ma et al., 2019; Zhang et al., 2021) and coastal areas, while extreme-wind events occurring in northern China have received little concern so far. Although a number of studies have found that land-surface wind speed has decreased significantly in recent decades (Pryor et al., 2009; McVicar et al., 2012; You et al., 2014), as well as extreme wind, some studies found that the negative trend of surface wind speed turned to positive around 2010 (Zeng et al., 2019). Zhang et al. (2021) also found a similar shift in 2010 for the concurrent extreme wind and extreme precipitation. Since the northern China is where sandstorms mainly occur, it is important to check if extreme-wind events related to sandstorms experienced similar shifts in this area under climate change.
However, it is still unclear how to identify extreme-wind events relating to sandstorms in northern China. There are mainly two ways to identify extreme-wind events, as described in previous studies. One uses a specific value as the threshold of extreme-wind events, for example, the instantaneous wind speed over 20, 25 or 30 m s−1 (Fei et al., 2016; Ma et al., 2019; Vallis et al., 2019), as shown in Table 1. Another approach is the percentile method, which uses a specific percentile as the threshold of extreme wind, such as the 90th, 95th or 98th percentiles of the daily maximum wind speed (de Brito Neto et al., 2022; Messmer and Simmonds, 2021; Zhang et al., 2021; Table 1). As shown in Table 1, the thresholds of extreme-wind events varying between works, even though they concern similar topics such as thunderstorm extreme-wind events. This indicates that there is still no widely accepted definition of extreme-wind events and their identification indices, let alone sandstorm extreme-wind events. Thus, it is necessary to explore that which kinds of threshold are more appropriate for the identification of sandstorm extreme-events in northern China.
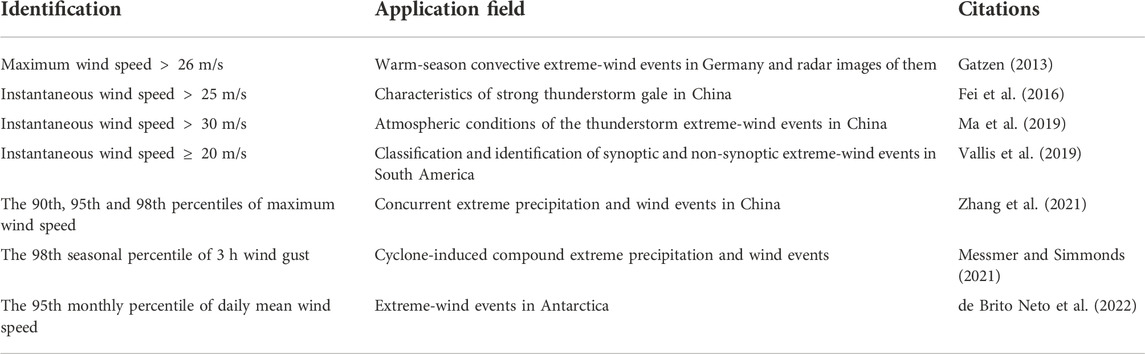
TABLE 1. Identification threshold of extreme events in previous studies. In this table, gale refers to a maximum wind speed higher than 10.8 m s−1, maximum wind speed means the largest 10-min average wind speed in a specific day, instantaneous wind speed can be the average wind speed in 3 s or 2 min.
Another problem with the definition of extreme-wind events is what kinds of wind speed should be used to identify extreme wind—instantaneous, maximum or daily average. This is because the average wind speeds obtained in different time scales show substantial differences. We have found that the half-hour wind speed observed at in situ stations in the central part of the Qinghai–Tibet Plateau is around 20%–30% larger than the daily wind speed, and the difference in annual total days of strong wind between them can reach hundreds (Jiang et al., 2018). That is why the daily maximum wind speed is generally lower than the instantaneous/maximum wind speed in one or two levels.
Aiming at above problems, the key point of this work is to find the most appropriate indices to identify extreme-wind events for northern China, and explore the relations between extreme-wind events and sandstorms. This study first analyzed the daily maximum wind speed when sandstorms occur to establish the extreme-wind index appropriate for northern China using the percentile method. Then, we solved the problem of how to evaluate extreme wind with wind speed at different time scales. Finally, two extreme wind indices were applied to analyze the spatio-temporal distributions and variation trends of extreme-wind events in northern China. The applicability of each extreme wind index is discussed, and conclusions are given in the final section.
We mainly used the observation data from the Chinese national standard meteorological stations, including the daily land-surface observation dataset in China and the strong sandstorms in China. The observation period for the sandstorm dataset was from 1954 to 2007, including the sandstorms with visibility of less than 1 km during this period, the beginning and end times of sandstorms, and the 10-min average (10 min) maximum wind speed and direction when sandstorms occur. Daily land-surface observation in China provides the daily air pressure, air temperature, relative humidity, precipitation, evaporation, wind speed and direction, sunshine and 0 cm ground temperature. Wind speed and direction are observed at 10 m height, and provide daily average wind speed and daily maximum wind speed averaged every 10 min and 2 min, respectively. Considering that the daily 10 min maximum wind speed is relatively more complete than that in 2 min, with much fewer missing data, this work mainly uses the 10 min averaged daily maximum wind speed, which is also the same parameter provided by the sandstorm dataset.
There are many missing data in the observations of daily maximum wind speed, so a series of quality control filters were introduced here. Firstly, to ensure data reliability and integrity for long-term analyses, years with more than 30 missing days were excluded (the whole year was set as missing), and then stations with more than 20% of missing years (10 years here) were excluded. After the first step, there are fewer than 70 observation stations surpassing the quality control standards in China before 1971, and that increases to 299 in 1971, 410 in 1972 and 701 in 1986, while the largest number of observation stations for this dataset is 824 in China. Thus, the daily maximum wind speed observation data from 1971 to 2020 in 628 observation stations after the preliminary screening are used in this paper except Sections 3.1.1, 3.1.2, which used the data in 1954–2007 to keep consistent with the sandstorm observations.
For those missing values within 30 days, according to the meteorological similarity theory, we preferentially used the observations of neighboring stations to fill up the missing data, because of the rapid temporal variation and poor temporal continuity of surface wind speed. The interpolation method is the inverse-distance weight method, so the distances of Earth surface between the station to be interpolated and its neighboring stations were first calculated. Then, we selected the nearest five stations, and the closer points will have the greater weights in the interpolation process. For the few missing data that might have remained after the neighboring interpolation, simple linear interpolation based on time series was used to complete the dataset. The above interpolations did not include the years with more than 30 missing days that were eliminated in the first stage of quality control, which means that the whole-year missing data were not filled.
We also used gridded data of precipitation and land cover types in analyses. The gridded precipitation dataset is the 0.5-degree daily land-surface precipitation in China (V2.0) released by the National Meteorological Science Data Center, which provides the daily cumulative precipitation for the whole country from 1961 to 2012. It is mainly used to divide the climatic regions of China (the annual cumulative precipitation for arid, semi-arid, semi-humid and humid areas is <200 mm, 200–400 mm, 400–800 mm and >800 mm, respectively; Yang et al., 2011). The MODIS land-use types in 2001 (https://modis-land.gsfc.nasa.gov/landcover.html) are used in the analysis for sandstorm extreme-wind events as well. The closest points of the gridded dataset to the observation stations were extracted for use in the stations. Furthermore, the land-use types were reclassified into six categories: bare land, grassland, shrub, farmland, forest and urban.
As mentioned above, two methods have been used to identify extreme-wind events in previous works, mainly using a specific wind speed or a specific percentile as the threshold (Table 1). Figure 1 shows the cumulative frequency of dust storms and the daily maximum wind speed when they occurred from 1954 to 2007. It shows that sandstorms mainly occur in the arid and semi-arid areas of western China, while the large daily maximum wind speed when sandstorms occur is mainly in the northeast of Xinjiang, Inner Mongolia and the middle and eastern part of the Qinghai–Tibet Plateau. This suggests that the sandstorms occur not only in areas that experience high wind speeds but also in areas where the maximum wind speed is fairly low, such as the Tarim Basin. Therefore, using a specific wind speed as the threshold of extreme-wind events is not appropriate for such a large area of northern China.
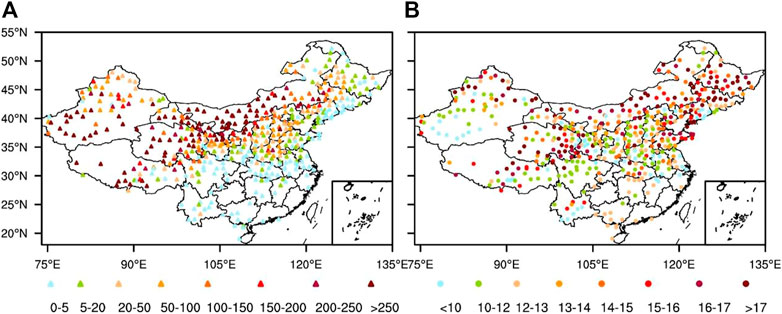
FIGURE 1. Sandstorm frequency (A), and multi-year mean daily maximum wind speed when sandstorm occurs (B), m s−1 in 1954–2007.
Therefore, the percentile method is more appropriate for this study. Extreme weather (climate) event refers to the situation when a weather (climate) event deviates seriously from its average state, and has a low probability of occurring. The percentile method extracts low-probability events with statistical significance according to quantiles such as 95% or 5% in the historical long-term conditions of the research target. For example, the indices of warm days and warm nights (TX90, TN90), recommended by the World Meteorological Organization (WMO), are the days that the maximum/minimum air temperature are greater/lower than 90% of the historical records. Thus, it is a research method developed based on the definition of extreme climate events, and is used in this work to identify sandstorm extreme-wind events.
Using the percentile method, it is first necessary to analyze the long-term historical record, which is usually over 30 years and in this study is 50 years, and then rank its historical sequence according to data value. Finally, the 99th, 95th or 90th quantile values are extracted as the threshold of extreme-weather indices. Taking extreme wind as an example, we first collected all the daily maximum wind speeds in 1971–2020 at each station in China, and then the total 18,263 days was ranked from the lowest to the highest for each station. Finally, the wind speed of the 90th and 95th percentiles were the extreme-wind indices.
Sandstorm observations can be divided into source sandstorms caused by local soil wind erosion, and exogenous sandstorms caused by dust transported by strong passing weather. Soil wind erosion is the movement of local surface soil particles by strong surface wind speed and the unstable stratification of the atmosphere. Thus, the local-source sandstorm is a good indicator of sandstorm extreme-wind events. We first identified the local-source sandstorms according to the time when each sandstorm event occurred. When a sandstorm occurs at a site, if no other sites in China have sandstorms occurring earlier on the same day or the day before, then the sandstorm at this site is considered to be a local-source sandstorm. It is worth noting that only observation stations in China were used here, so for stations close to the national border, especially in Inner Mongolia, sandstorms from neighboring countries that cross the border may be misjudged as local-source sandstorms. Since there are relatively few such observation stations (within 10 stations near the national border in Inner Mongolia), their impact on the overall results is negligible.
Sandstorms from 1954 to 2007 in arid, semi-arid and sub-humid areas (areas with annual total precipitation less than 800 mm) are used in this section. Each sandstorm in 1954–2007 at every station was judged individually, and results are shown in Figure 2A. It shows that most of eastern China did not experience local-source sandstorms, and most semi-humid areas experienced local-source sandstorms fewer than five times in 54 years. The Tarim Basin experienced the most local-source sandstorms, with more than 100 in the central area, followed by the arid regions of Gansu province and Inner Mongolia, and the southern edge of Qaidam Basin in the Qinghai–Tibet Plateau. However, those areas with more local-source sandstorms do not show higher wind speed than other places, especially the Tarim Basin (Figure 2B). This and the Figure 2C both indicate that the strength of wind speed does not have direct relations with the occurrence of local-source sandstorm, but we then found the hidden regular of them in the following section.
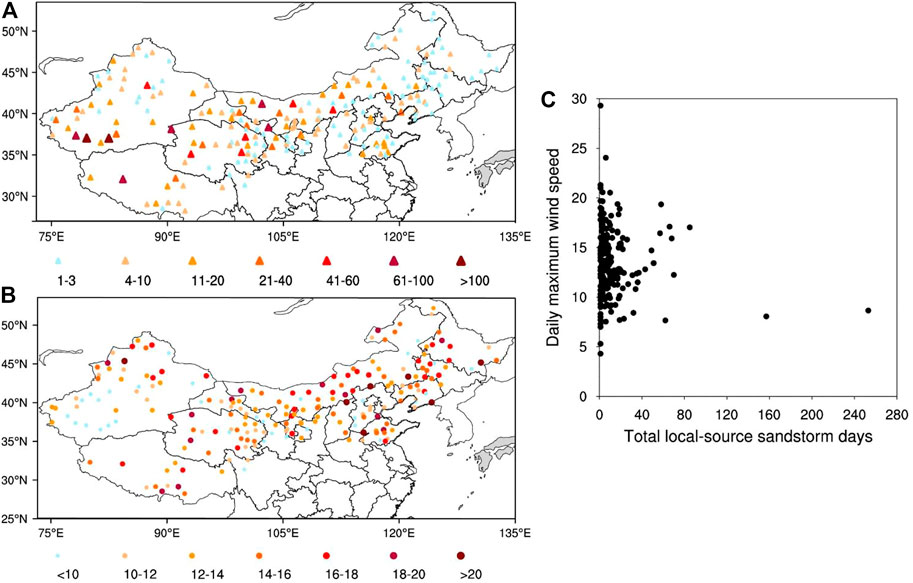
FIGURE 2. Total occurring days of local-source sandstorms during 1954–2007 (A), and the mean daily maximum wind speed when local-source sandstorm occurred (B), and their scatter plot (the local-source sandstorm days versus the daily maximum wind speed, (C)).
To find the relationships between the strength of wind speed and the local-source sandstorms, the percentiles of the daily maximum wind speed when local-source sandstorm occurs in the long-term historical observations are computed. The daily maximum wind speed from 1954 to 2007 was used to be consistent with the local-source sandstorms, as well as the same observation stations. Then, all the daily maximum wind speeds of each observation station in 1954–2007 are ranked and compared with the daily maximum wind speed in each local-source sandstorm to find out their relative quantiles in the ranking. Here and after, the percentile of the daily maximum wind speed of local-source sandstorm in all the observations of daily maximum wind speeds during 1954–2007 is abbreviated as the Pmw (the percentile of maximum wind speed, %). Finally, the multi-year average Pmw at each station, where ever had the local-source sandstorm in 1954–2007, was obtained and shown in Figure 3.
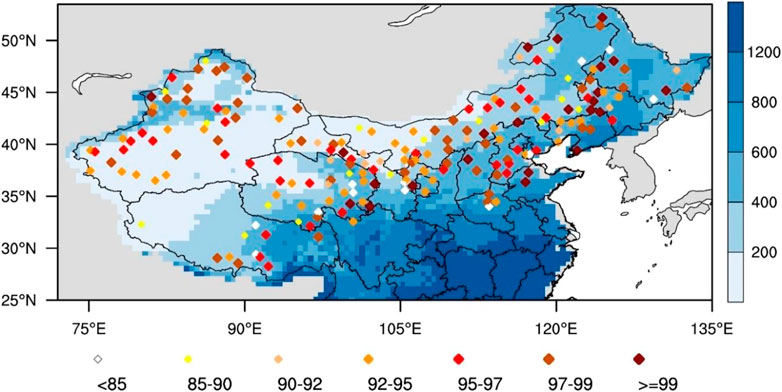
FIGURE 3. Mean percentile of the daily maximum wind speed when the local-source sandstorm occurred (Pmw, %) compared to all daily maximum wind speeds in 1954–2007 for each observation station. The blue shaded areas represent the multi-year mean annual total precipitation (mm).
Figure 3 shows that when the local-source sandstorm occurred, the Pmw for most stations in China is above 90%, and half of them have Pmw above 95% in various regions of northern China. Stations with a Pmw of 80%–90% are only sporicidal, and a few have a Pmw of less than 80%. The Pmw of each station was then classified by the land use types and climatic regions, dividing by the annual cumulative precipitation. Figure 4A shows that the Pmw in different climatic regions is relatively close, while their median value in the semi-humid area is slightly higher. This means that more sites are concentrated in the high-value area of Pmw for semi-humid regions, which indicates that, although the average probability of local-source sandstorms is similar in three climatic regions, the wind speed to trigger local-source sandstorms in semi-humid regions is larger than that in arid and semi-arid regions. Similar conclusions can be drawn from the classification results of Pmw under different land use types. The mean and median Pmw for different types are also similarly around 95%, but roughly increase with increasing vegetation cover. Therefore, the distributions of Pmw generally agree with the results of other studies involving soil wind erosion, that is, regions with higher soil moisture and better vegetation cover require higher threshold wind speeds for wind erosion (Du et al., 2015). The statistical results for semi-humid areas and grasslands show greater uncertainties (the distribution of Pmw values is more scattered), which is probably due to other contributors of wind erosion, such as soil particle size and crust.
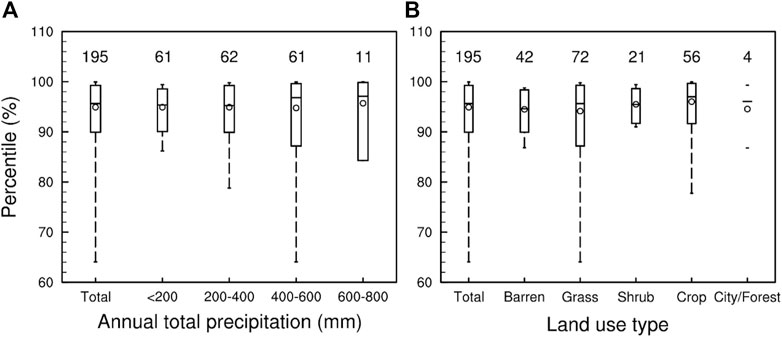
FIGURE 4. Box plots of mean Pmw (%) under different levels of annual total precipitation (A), mm and land use types (B). Five factors of each box from top to bottom are the maximum, 90th percentile, median, 10th percentile and minimum values. The mean value is marked by a small circle, and the numbers listed above the boxes are the number of stations which experienced local-source sandstorms in 1954–2007.
Therefore, the EW90 and EW95 extreme-wind indices can be established based on the above statistical analysis of the 10th quantile and average Pmw, respectively (Figures 4A,B). The 10th quantile of Pmw for all stations over China (the first box in Figures 4A,B) can cover 90% of the local-source sandstorms, and its corresponding Pmw value is 89.9%, so we select the 90th percentile as the EW90 index for our study. The average Pmw is 95.0% and the medium Pmw is 95.8%, so the 95th percentile is used as the EW95 index. Figure 4 also shows that the EW95 index is relatively stable under different climate zones and different vegetation types, and is also widely used in some previous studies of extreme-wind events (Zhang et al., 2021; de Brito Neto et al., 2022). The definition of EW90 and EW95 extreme-wind events can be summarized as a daily maximum wind speed greater than the 90th and 95th quantiles of local long-term historical observations, respectively. According to their definitions and characteristics, the EW90 index is more appropriate for the forecast and early warning of sandstorms caused by extreme wind with lower risk of misreporting, and EW95 index is more appropriate for large-scale analysis of extreme-wind events.
Although we have defined the EW90 and EW95 extreme-wind indices, there is an important debatable point of this defilation about the temporal resolution of source wind speed. As mentioned above, wind speeds averaged in different time intervals have substantial differences, so what is the difference between extreme-wind events judged by different wind speeds? Here, we compared the EW95 extreme-wind index and events based on the daily maximum wind speed averaged in 2 min (2 min-max wind) and the daily maximum wind speed in 10 min (10 min-max wind), which is what we mainly use in this work.
Due to the huge missing observations for the 2 min-max wind speed, fewer than 100 stations with 2 min-max wind speed passed the quality control checks, as outlined in Section 2.1, until the 1990s. For the period from 1971 to 2020, only 32 stations in China met the quality control standards. Therefore, in order to ensure the comparability with the EW95 index defined above, we only use those 32 stations in this section. The EW95 extreme-wind index, speed and days were calculated from the daily 2 min-max and 10 min-max wind speed for those 32 points, respectively. The results show that the differences in the EW95 extreme-wind indices between the 2 min-max and 10 min-max wind speed are relatively stable. The differences of each site for two different extreme-wind indices are all between 5 and 7 m s−1, with an average value of 5.6 m s−1 (Figure 5A). In the wind level system widely used in the field of Chinese meteorology, a difference of two wind levels is also within 5–7 m s−1; for example, the difference between the minimum thresholds of four and six wind levels is 5.3 m s−1, and it is 6.4 m s−1 for the six and eight wind levels. Similarly, the EW95 extreme-wind speeds obtained from the 2 min-max and 10 min-max data also have stable differences with an average value of −6.6 m s−1 (Figure 5B) and very close extreme-wind days (Figure 5C).
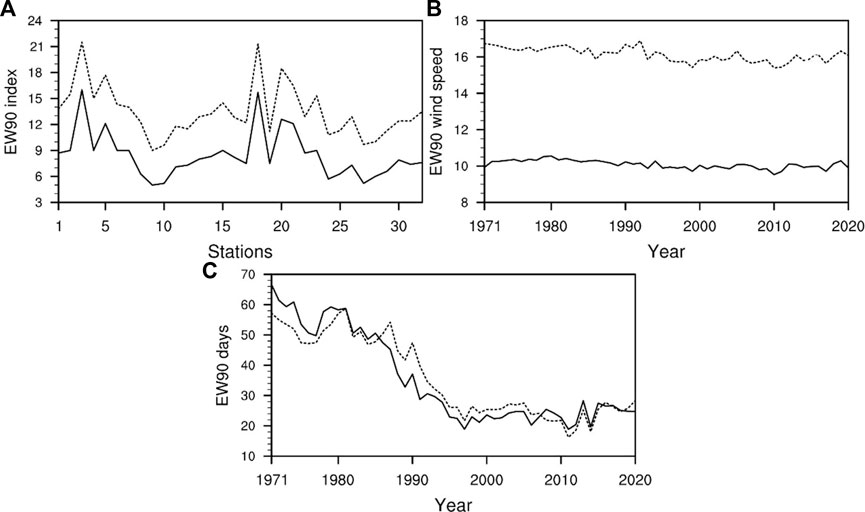
FIGURE 5. EW95 extreme-wind index ((A), m s−1), wind speed ((B), m s−1), and annual total days (C) derived from the daily 2 min-max (solid lines) and 10 min-max (dashed lines) wind speed.
Therefore, wind speed in all kinds of time intervals within a day can be used in the percentile method to identify extreme-wind events once it can represent the maximum value of wind speed on that day. There is no essential difference between the obtained extreme-wind events for different time-interval wind speeds, since their extreme-wind days are equivalent, and extreme wind speeds have stable differences. This is because, taking the 2 min-max and 10 min-max wind speed as an example: 1) both are the maximum value in a day representing the same type of extreme state; 2) the percentile method extracts extreme events with the same probability based on their own historical record, and so actually takes their relative locations instead of their absolute values. Therefore, we can further expand the definitions as: for all kind of temporal resolutions of wind speed within a day, EW90 and EW95 extreme-wind events are the daily maximum wind speeds greater than the 90th and 95th quantiles of local long-term historical records, respectively.
Based on above definitions of EW90 and EW95 extreme-wind indices, extreme-wind events in China and sandstorm extreme-wind events in the northern China are identified. As shown in Figure 6, the sandstorm EW90 and EW95 extreme-wind speeds (accompanied by local-source sandstorm) during 1971–2020 are generally higher than the normal extreme-wind speeds, and mainly distributed in the northern China. This is mainly because local-source sandstorm rarely occurs even when there is extreme wind. The occurrence of local-source sandstorm is not only controlled by extreme wind as the trigger of wind erosion, also by atmospheric and land-surface conditions and erodible materials, such as the updrafts, soil moisture, vegetation cover and biological soil crust. For example, the total local-source sandstorm days are around 10–20 days during the whole past 50 years in most areas of the Inner Mongolia (Figure 2A), while every year could have around 36 days of EW90 extreme-wind days (10% of the total day number). Thus, the frequency of sandstorm extreme-wind events (accompanied by local-source sandstorm) are much less than the normal extreme-wind events, and result in differences in their values and spatial distributions.
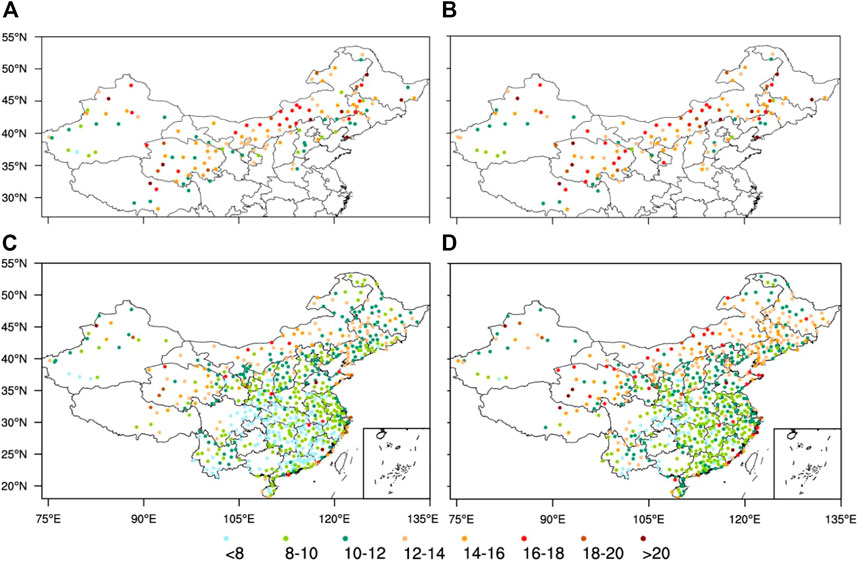
FIGURE 6. The wind speed of sandstorm EW90 (A) and EW95 (B) extreme-wind events (accompanied by local-source sandstorm) in norther China, and the wind speed of all the EW90 (C) and EW95 (D) extreme-wind events in China (regardless the accompanying of sandstorm).
As we mainly focus on the extreme-wind events themselves and their relations between sandstorms, we use the normal extreme-wind events regardless they are accompanied by sandstorm or not in the following analyses. EW90 and EW95 Extreme-wind speeds in China are generally higher in northern and coastal areas and relatively low in southern China (Figures 6C,D). The more obvious spatial distribution is that the extreme-wind speed in the west of the 600 mm line of annual total precipitation is significantly higher than those in the east (Figures 6C,D). In arid and semi-arid areas, the regional average values of extreme-wind speed are higher than those in the semi-humid and humid areas. The regional average values of EW90 and EW95 extreme-wind speed are highest in semi-arid regions, which are 12.6 m s−1 and 14.1 m s−1, respectively, and lowest in humid areas within 10 m s−1. The northwestern Xinjiang province, the central part of Inner Mongolia, and the central Qinghai–Tibet Plateau have the largest extreme-wind speed.
For the seasonal variations, there is no essential difference between the EW90 and EW95 extreme-wind events except for their values for extreme-wind days; therefore, Figure 7 only shows variations of EW90 events. The extreme-wind events in most parts of China mainly occur in spring (March to May); however, in different climatic regions, the months with most extreme-wind events are slightly different. In arid, semi-arid and sub-humid regions, the months with the most extreme-wind days are April and May, while they are March and April in humid regions (Figure 7). In the wettest South China region, extreme-wind events mainly occurred from July to August. This is mainly due to the zonal movements of the westerly belt and the intensity of East-Asian monsoons. The westerly belt in the northern hemisphere moves northward in March and southward in October, and the strongest East-Asian monsoons in China occur from July to August. Therefore, stations located more toward the south tend to have more extreme-wind events in March, while as the westerly wind moves northward, the more northern stations have frequent extreme-wind events later (Figure 7). For southern China and coastal areas that are substantially affected by monsoons and typhoons, extreme-wind events mostly occur in summer, when monsoons are stronger and typhoons are more frequent (Figure 7).
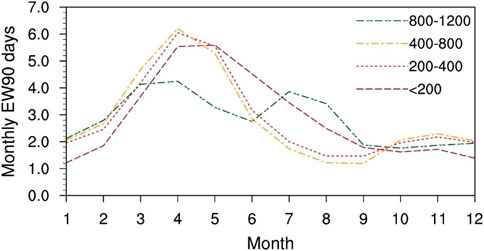
FIGURE 7. Monthly total EW95 extreme-wind days during 1971–2020 in different climatic regions divided by the multi-year mean annual total precipitation within <200 mm, 200–400 mm, 400–800 mm, 800–1,200 mm and >1,200 mm.
From 1971 to 2020, annual wind speeds of EW90 and EW95 extreme-wind events show significant decreasing trends with rates of around −0.029 m s−1a−1 (Figure 8 a1-b1), passing the significance level of 0.01. The variation trends of two indices are very close, and both extreme-wind speeds have decreased around 1.5 m s−1 in recent 50 years. The extreme-wind days of EW90 and EW95 have decreased even more severely by around 70% (Figure 8 a2-b2). The EW90 extreme-wind days have decreased from 70 days to about 20 days, and the EW95 extreme-wind days have reduced from 40 days to around 10 days in 50 years (Figure 8 a2). For comparison, we also provide the interannual variation of the annual mean wind speed derived from daily mean wind speed (Figure 8 c1), as well as the annual total days on which sandstorms occurred (Figure 8 c2). The interannual variation of the daily mean wind speed fluctuates greatly, and its decline rate is fairly low and does not pass the significance test.
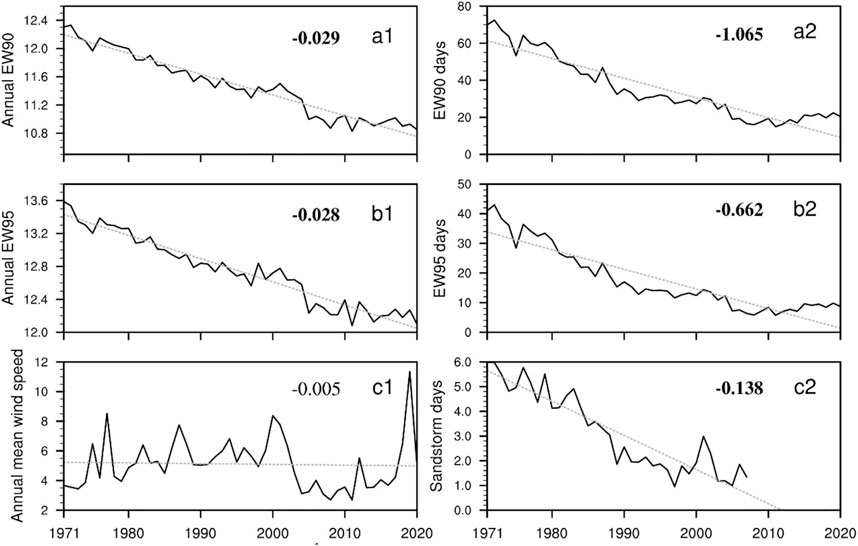
FIGURE 8. Mean wind speed (a1–c1, m s−1) and annual total occurring days (a2–c2, d) of EW90, EW95 and EW99 wind extremes, and annual mean value of daily mean wind speed (d1, m s−1) and sandstorm days (d2, d). Their variation trends (linear regression coefficients) are also marked in the figure, and the regression coefficients passing the 99% significance test are shown in bold.
Moreover, the mean wind speed has an obvious increasing trend after 2003 (Figure 8 c1), and a significant abrupt turning point around 2002 is found by the moving t test (Figure 9A) and Pettitt test (not shown here). A similar increasing trend after 2010 is also found for global average wind speed (Zeng et al., 2019; Deng et al., 2021); Zhang et al. (2021) even found a turning point in 2010 for the concurrent events of extreme wind and extreme precipitation. However, the two types of extreme-wind events did not have similar increasing trends in recent decade (Figure 8 a1-b1, a2-b2), although extreme-wind days show very slight increase. The moving t test of EW90 and EW95 extreme-wind events may not work here, because this test is mainly used in the identification of single turning point, while the significant turning years for them are too many (Figures 9B,C, testing results for EW95 extreme-wind events are similar to those of EW90, so is not shown here). The Pettitt test is also used here, and find that the most significant turning year of EW90 and EW95 extreme-wind speeds are in 1994, while it is 1996 for the extreme-wind days. Beside above methods, Mann-Kendall tests for extreme-wind events are not significant. Considering above conflicts between different methods of abrupt tests and the inter-annual variations of extreme-wind events, there is no significant abrupt change for extreme-wind events.
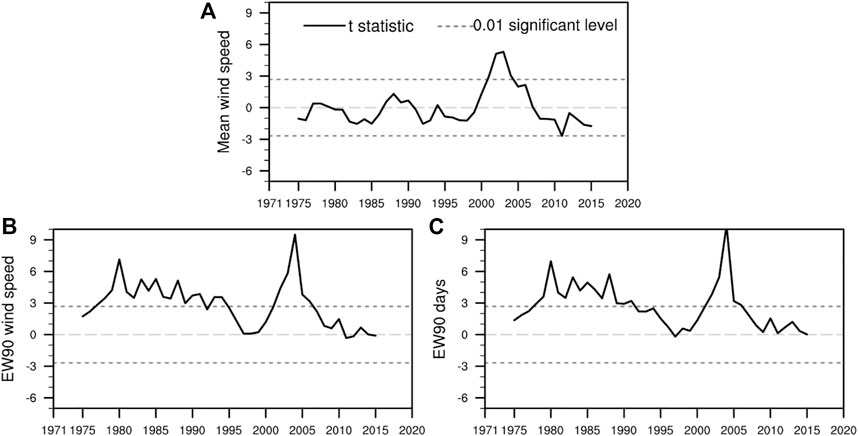
FIGURE 9. The results of moving-T test for the annual mean wind speed (A), EW90 extreme-wind speed (B) and extreme-wind days (C).
The annual total sandstorm days also show a significant decreasing trend in 1971–2007, which is closely related to extreme-wind events, with correlation coefficients around 0.95 (Table 2), substantially higher than that of the mean wind speed. Removing the influences of inter-annual variation trends, the partial correlation coefficients between the EW90 and EW95 extreme events and the sandstorm days are around 0.5, passing the 0.01 significance level (Table 2). Therefore, the significant reduction in sandstorms in northern China is mainly due to the significant decreasing extreme-wind events.
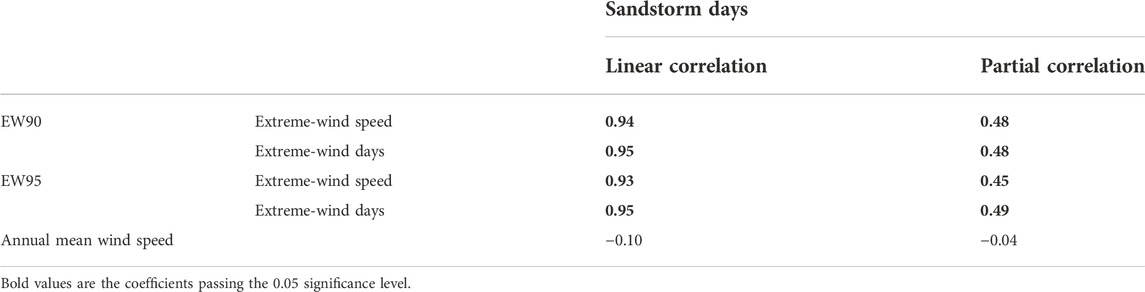
TABLE 2. Pearson sample linear cross correlation and partial correlation coefficients between the sandstorm days and the wind speeds and annual total days of EW90, EW95 extreme-wind events and daily mean wind speed, respectively. Coefficients passing the 0.05 significance level are in bold.
We also provide a figure on variation trends of extreme-wind events in every station to show if there is any principle of spatial distribution for the decline in extreme-wind events. Since two extreme-wind events have similar spatial distribution, the EW90 extreme-wind days are shown here as an example. Figure 10 shows that, in the past 50 years, the extreme-wind days in most parts of China have decreased, significantly passing the 0.01 significance level except for several stations, so there is nothing notable about the special distributions of decreasing extreme-wind events.
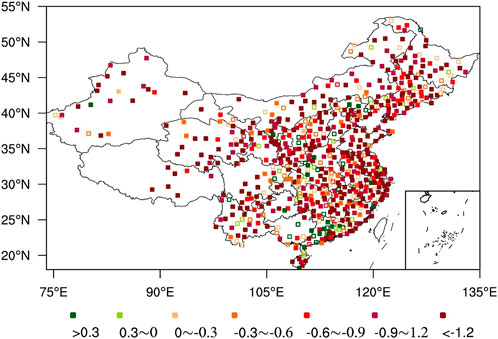
FIGURE 10. Temporal variation trends (linear regression coefficients) of annual total EW95 extreme-wind days in 1971–2020 (d yr-1), the stations represented by solid squares have passed the 0.01 significance level.
This study found extreme-wind indices appropriate for the analysis of sandstorms in northern China, which can provide theoretical support for related research on extreme-wind events under climate change, as well as predicting and warning of severe weather conditions caused by extreme wind. There is another parameter of land-surface wind speed that is closely related to sandstorms: the threshold wind speed used in the process of wind erosion. Wind erosion only occurs when the friction velocity is larger than the threshold friction velocity, and the land-surface wind speed that causes friction velocity to meet this threshold is called the threshold wind speed. Thus, we compared the EW90 extreme-wind index with the threshold wind speed found in previous studies (Table 3). In general, the threshold wind speeds for the sandy regions in the west of Jilin province and southern Horqin (Naiman county) with semi-humid climate and better vegetation are higher than other arid regions, reaching 10 m s−1, and the EW90 indices are also 10–11 m s−1 in these areas (Table 3). The threshold wind speeds in arid regions are relatively low, mostly at 5–6 m s−1, including the sandy region of Hunshandake, the Taklimakan Desert, while the EW90 indices in these areas are significantly higher (Table 3). This indicates that for the arid area with abundant erodible materials, low soil moisture and low vegetation cover, the threshold wind speed is much easier to reach since it is substantially lower than the extreme wind, because extreme wind speed is not the only contributor to wind erosion and sandstorms. However, the EW90 and EW95 indices and their establishing methods can provide another perspective for understanding extreme climate events.
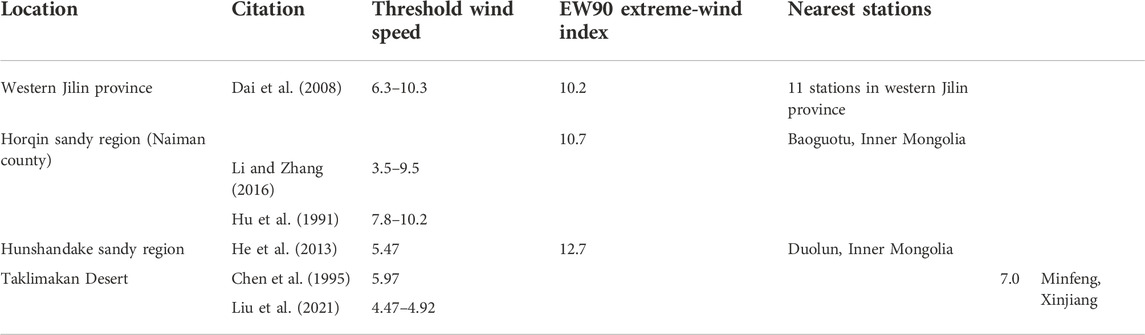
TABLE 3. Threshold wind speed of dust emission (m s−1) in existing studies, and EW90 extreme-wind indices in the nearest meteorological stations.
A number of methods and indices have been developed for extreme climate/weather events in recent two decades with increasing attentions of extreme events under climate change. The most widely used extreme indices are the joint CCl/CLIVAR/JCOMM Expert Team (ET) on Climate Change Detection and Indices (ETCCDI), which are mainly used in the study of extreme temperature and extreme precipitation (Sillmann et al., 2013). Those indices have two methods to identify extreme events, one uses a certain value of temperature or precipitation as the threshold (such as the hot-night days, TR), and the other one is the percentile method used in this work. However, the ETCCDI do not have indices related to extreme-wind events at present, so we established two in this work. The ETCCDI and EW90, EW95 indices are more appropriate to analysis the spatial and temporal distributions and variations of extreme events, while for the attribution analysis and predictions in future climate, the generalized extreme value (GEV) model is more appropriate (Kharin et al., 2007; Li et al., 2014; Wang et al., 2014). Since the GEV model requires high stability of data series which atmospheric data may not meet, the non-stationary GEV model is more widely used in the area of extreme climate/weather events (Van de Vyver and Delcloo, 2011), such as the risk evaluation and prediction of extreme-wind hazard (Wang et al., 2013; Chang, 2018).
Although this paper does not explore the mechanism for the significantly decreasing trends of extreme-wind events, a number of previous studies have proposed several possible reasons. Some studies pointed out that the stilling wind speed is caused by the significantly decreasing high-level wind speed, which is related to the weakening large-scale atmospheric circulation (Gastineau and Soden, 2009), such as atmosphere–ocean circulation (Zha et al., 2021) and Arctic oscillation (AO, Ge et al., 2021). The weakening large-scale circulation may be because high latitudes warm faster and more significantly than other areas, resulting in reduced differences of temperature and pressure between high and low latitudes (Li et al., 2022). Other studies argue that the weakening wind speed is related to significant changes in land–surface conditions, including changes in land-use type (Deng et al., 2021) and urbanization (Wang et al., 2020). Therefore, as part of the land–surface wind speed, the significantly decreasing extreme-wind events could also be related to the above factors. Our own opinion is that the weakening atmospheric circulation may be the main contributor to the decreasing extreme-wind events considering the wide distribution of decreasing trends all over China without any spatial characteristics.
This study identified the local-source sandstorms according to the occurrence time, and analyzed their statistical characteristics to establish the EW90 and EW95 extreme-wind indices. They are defined as: the daily maximum wind speeds greater than the 90th and 95th quantiles of local long-term historical records. We also tested the temporal resolution of source wind used to extract the daily maximum value, and results show limited impact on the derived extreme-wind events with similar extreme-wind days and stable-difference extreme-wind speed.
The sandstorm EW90 and EW95 extreme-wind speed (accompanied by local-source sandstorm) is slightly higher than normal EW90 and EW95 extreme wind, and mainly locates in northern China. Regardless the accompanying of sandstorm, EW90 and EW95 extreme-wind speeds in China are higher in the arid and semi-arid regions, and are relatively lower in the semi-humid and humid regions. The semi-arid region has the highest EW90 and EW95 extreme-wind speeds reaching 12.6 m s−1 and 14.1 m s−1, respectively. For inner-annual changes, extreme-wind events in arid, semi-arid and semi-humid regions mainly occur between April and May, but they are more frequent from July to August for the humid regions in southeastern China.
From 1971 to 2020, the annual wind speed and total days of EW90 and EW95 extreme-wind events show a continuous and significant decreasing trend, which have passed the 0.01 significance level. The reduction rates of EW90 and EW95 extreme-wind speed are both around −0.029 m s−1a−1 averaged over China, and the extreme-wind days of EW90 and EW95 both decreased by over 70% in the last 50 years. These substantial reductions are found in almost all stations in China without a spatial distribution pattern. Furthermore, both extreme-wind events have significant correlations with sandstorm days, with correlation coefficients reaching 0.95 and partial correlation coefficients of around 0.5. However, daily mean wind speed has not shown a significant negative trend over the past 50 years, with a shifting increasing trend in 2003, and it is not significantly correlated with sandstorm days. Therefore, the substantial reduction of sandstorms in the past 50 years is mainly due to the significant decrease in extreme-wind events instead of the variations of mean wind speed.
The original contributions presented in the study are included in the article/supplementary material, further inquiries can be directed to the corresponding author.
Conceptualization, YJ and YM; methodology, YJ; data curation, YZ; writing-original draft preparation, YJ, YZ, and JL; manuscript revising, YJ, YM, YZ, JL, and YG. All authors have read and agreed to the published version of the manuscript.
This work was funded by the National Key R&D Program of China (2020YFA060840X), and the project supported by Key Laboratory of Resource Environment and Sustainable Development of Oasis, Gansu Province (GORS202105).
The authors declare that the research was conducted in the absence of any commercial or financial relationships that could be construed as a potential conflict of interest.
All claims expressed in this article are solely those of the authors and do not necessarily represent those of their affiliated organizations, or those of the publisher, the editors and the reviewers. Any product that may be evaluated in this article, or claim that may be made by its manufacturer, is not guaranteed or endorsed by the publisher.
Alexander, L. V., Zhang, X., Peterson, T. C., Caesar, J., Gleason, B., Klein Tank, A. M. G., et al. (2006). Global observed changes in daily climate extremes of temperature and precipitation. J. Geophys. Res. 111 (5), D05109–D05122. doi:10.1029/2005JD006290
Chang, E. K. M. (2018). CMIP5 projected change in Northern Hemisphere winter cyclones with associated extreme winds. J. Clim. 31 (16), 6527–6542. doi:10.1175/JCLI-D-17-0899.1
Chen, W., Dong, Z., Yang, Z., Han, Z., and Zang, M. (1995). Threshold velocities of sand-deriving wind in the Taklimakan Desert. Acta Geogr. Sin. 50 (4), 360–367. doi:10.11821/xb199504008
Couto, A., Costa, P., and Simões, T. (2021). Identification of extreme wind events using a weather type classification. Energies 14 (13), 3944. doi:10.3390/en14133944
Dai, Q. (2008). Mechanism of soil erosion by wind on sandy land in west Jilin province. Bull. Soil Water Conservation 28 (3). In Chinese. doi:10.13961/j.cnki.stbctb.2008.03.019
de Brito Neto, F. A., Mendes, D., and Spyrides, M. H. C. (2022). Analysis of extreme wind events in the weddell sea region (Antarctica) at belgrano II station. J. S. Am. Earth Sci. 116 (2021), 103804. doi:10.1016/j.jsames.2022.103804
De Gaetano, P., Repetto, M. P., Repetto, T., and Solari, G. (2014). Separation and classification of extreme wind events from anemometric records. J. Wind Eng. Industrial Aerodynamics 126, 132–143. doi:10.1016/j.jweia.2014.01.006
Deng, K., and Yang, S. (2021). Terrestrial stilling will continue during the 21st century. Research Square, 1–14. doi:10.21203/rs.3.rs-288223/v1
Du, H., Xue, X., Deng, X., Zhang, X., and Wang, T. (2015). Wind erosion occurrence probabilities maps in the watershed of the Ningxia-Inner Mongolia reach of the Yellow River, China. Environ. Earth Sci. 75. doi:10.1007/s12665-015-4945-y
Fei, H. (2016). Climatic characteristics and environmental parameters of severe thunderstorm gales in China. Meteorol. Mon. 42 (12). In Chinese. doi:10.7519/j.issn.1000-0526.2016.12.009
Gastineau, G., and Soden, B. J. (2009). Model projected changes of extreme wind events in response to global warming. Geophys. Res. Lett. 36 (10), L10810–L10815. doi:10.1029/2009GL037500
Gatzen, C. (2013). Warm-season severe wind events in Germany. Atmos. Res. 123, 197–205. doi:10.1016/j.atmosres.2012.07.017
Ge, J., Feng, D., You, Q., Zhang, W., and Zhang, Y. (2021). Characteristics and causes of surface wind speed variations in Northwest China from 1979 to 2019. Atmos. Res. 254, 105527. doi:10.1016/j.atmosres.2021.105527
Gonçalves, C., Cavalcante, L., Brito, M., Bessa, R. J., and Gama, J. (2021). Forecasting conditional extreme quantiles for wind energy. Electr. Power Syst. Res. 190 (2020), 106636. doi:10.1016/j.epsr.2020.106636
He, C., Liou, K., Takano, Y., Chen, F., and Barlage, M. (2019). Enhanced snow absorption and albedo reduction by dust-snow internal mixing: Modeling and parameterization. J. Adv. Model. Earth Syst. 11 (11), 3755–3776. doi:10.1029/2019MS001737
He, J. (2013). Research on sand-fixing function of grassland based on threshold wind velocity. Chin. J. Grassl. 35 (5). In Chinese. doi:10.5814/j.issn.1674-764x.2014.02.002
Höltinger, S., Mikovits, C., Schmidt, J., Baumgartner, J., Arheimer, B., and Lindstrom, G. (2019). The impact of climatic extreme events on the feasibility of fully renewable power systems: A case study for Sweden. Energy 178, 695–713. doi:10.1016/j.energy.2019.04.128
Hu, M. (1991). A experimental study in wind tunnel on wind erosion of soil in korqin sandy land. J. Desert Res. 11 (1), 22–29. In Chinese. doi:10.1007/s10661-007-0028-1
Jiang, Y., Gao, Y., Dong, Z., Liu, B., and Zhao, L. (2018). Simulations of wind erosion along the qinghai-tibet railway in north-central tibet. Aeolian Res. 32, 192–201. doi:10.1016/j.aeolia.2018.03.006
Jickells, T. D., An, Z. S., Andersen, K. K., Baker, A. R., Bergametti, G., and Brooks, N. (2005). Global iron connections between desert dust, ocean biogeochemistry, and climate. Science 308 (5718), 67–71. doi:10.1126/science.1105959
Kharin, V. V., Zwiers, F. W., Zhang, X., and Hegerl, G. C. (2007). Changes in temperature and precipitation extremes in the IPCC ensemble of global coupled model simulations. J. Clim. 20 (8), 1419–1444. doi:10.1175/JCLI4066.1
Li, P., Liu, L., Wang, J., Wang, Z., Wang, X., and Bai, Y. (2018). Wind erosion enhanced by land use changes significantly reduces ecosystem carbon storage and carbon sequestration potentials in semiarid grasslands. Land Degrad. Dev. 29 (10), 3469–3478. doi:10.1002/ldr.3118
Li, Q., Huang, J., Jiang, Z., Zhou, L., Chu, P., and Hu, K. (2014). Detection of urbanization signals in extreme winter minimum temperature changes over Northern China. Clim. Change 122 (4), 595–608. doi:10.1007/s10584-013-1013-z
Li, X., Pan, Y., and Jiang, Y. (2022). The analysis of the spatiotemporal variations and mechanisms for the near-surface wind speed over China in the last 40 years. Theor. Appl. Climatol. 148, 1163–1180. doi:10.1007/s00704-022-03991-z
Li, X., and Zhang, H. (2016). A study of determining dust emission thresholds over the Horqin sandy land area in inner Mongolia. Acta Meteorol. Sin. 74 (1), 76–88. In Chinese. doi:10.11676/qxxb2016.008
Lombardo, F. T., and Zickar, A. S. (2019). Characteristics of measured extreme thunderstorm near-surface wind gusts in the United States. J. Wind Eng. Industrial Aerodynamics 193, 103961. doi:10.1016/j.jweia.2019.103961
Lu, Y. (2016). Changes of tropical cyclone high winds and extreme winds during 1980-2014 over China. Clim. Change Res. 12 (5). In Chinese.
Ma, S., Wang, X., and Yu, X. (2019). Environmental parameter characteristics of sever wind with extreme thunderstorm. J. Appl. Meteorological Sci. 30 (3), 292–301. In Chinese. doi:10.11898/1001-7313.20190304
McVicar, T. R., Roderick, M. L., Donohue, R. J., Li, L. T., Van Niel, T. G., and Thomas, A. (2012). Global review and synthesis of trends in observed terrestrial near-surface wind speeds: Implications for evaporation. J. Hydrology 416 (417), 182–205. doi:10.1016/j.jhydrol.2011.10.024
Meng, X., Nguyen, D., Owen, J., Xie, Y., Psimoulis, P., and Ye, G. (2019). Application of GeoSHM system in monitoring extreme wind events at the forth Road Bridge. Remote Sens. 11 (23), 1–19. doi:10.3390/rs11232799
Messmer, M., and Simmonds, I. (2021). Global analysis of cyclone-induced compound precipitation and wind extreme events. Weather Clim. Extrem. 32, 100324. doi:10.1016/j.wace.2021.100324
Outten, S., and Sobolowski, S. (2021). Extreme wind projections over Europe from the Euro-CORDEX regional climate models. Weather Clim. Extrem. 33, 100363. doi:10.1016/j.wace.2021.100363
Owen, L. E., Catto, J. L., Dunstone, N. J., and Stephenson, D. B. (2021). How well can a seasonal forecast system represent three hourly compound wind and precipitation extremes over Europe? Environ. Res. Lett. 16 (7), 074019. doi:10.1088/1748-9326/ac092e
Owen, L. E., Catto, J. L., Stephenson, D. B., and Dunstone, N. J. (2021). Compound precipitation and wind extremes over Europe and their relationship to extratropical cyclones. Weather Clim. Extrem. 33, 100342. doi:10.1016/j.wace.2021.100342
Painter, T. H., Barrett, A. P., Landry, C. C., Neff, J. C., Cassidy, M. P., and Lawrence, C. R. (2007). Impact of disturbed desert soils on duration of mountain snow cover. Geophys. Res. Lett. 34 (12), L12502–L12506. doi:10.1029/2007GL030284
Pryor, S. C., Barthelmie, R. J., Young, D. T., Takle, E. S., Arritt, R. W., and Flory, D. (2009). Wind speed trends over the contiguous United States. J. Geophys. Res. 114 (14), D14105. doi:10.1029/2008JD011416
Qian, C., Zhang, X., and Li, Z. (2019). Linear trends in temperature extremes in China, with an emphasis on non-Gaussian and serially dependent characteristics. Clim. Dyn. 53 (1–2), 533–550. doi:10.1007/s00382-018-4600-x
Ravi, S., D'Odorico, P., Breshears, D. D., Field, J. P., Goudie, A. S., and Huxman, T. E. (2011). Aeolian processes and the biosphere. Rev. Geophys. 49 (3), RG3001–45. doi:10.1029/2010RG000328
Russo, A., Gouveia, C. M., Dutra, E., Soares, P. M. M., and Trigo, R. M. (2019). The synergy between drought and extremely hot summers in the Mediterranean. Environ. Res. Lett. 14 (1), 014011. doi:10.1088/1748-9326/aaf09e
Sillmann, J., Kharin, V. V., Zwiers, F. W., Zhang, X., and Bronaugh, D. (2013). Climate extremes indices in the CMIP5 multimodel ensemble: Part 2. Future climate projections. J. Geophys. Res. Atmos. 118 (6), 2473–2493. doi:10.1002/jgrd.50188
Torrielli, A., Repetto, M. P., and Solari, G. (2016). The Annual Rate of Independent Events for the analysis of the extreme wind speed. J. Wind Eng. Industrial Aerodynamics 156, 104–114. doi:10.1016/j.jweia.2016.07.010
Vallis, M. B., Loredo-Souza, A. M., Ferreira, V., and Nascimento, E. d. L. (2019). Classification and identification of synoptic and non-synoptic extreme wind events from surface observations in South America. J. Wind Eng. Industrial Aerodynamics 193, 103963. doi:10.1016/j.jweia.2019.103963
Van de Vyver, H., and Delcloo, A. W. (2011). Stable estimations for extreme wind speeds. An application to Belgium. Theor. Appl. Climatol. 105 (3), 417–429. doi:10.1007/s00704-010-0365-9
Vignotto, E., Engelke, S., and Zscheischler, J. (2021). Clustering bivariate dependencies of compound precipitation and wind extremes over Great Britain and Ireland. Weather Clim. Extrem. 32, 100318. doi:10.1016/j.wace.2021.100318
Wang, C. H., Wang, X., and Khoo, Y. B. (2013). Extreme wind gust hazard in Australia and its sensitivity to climate change. Nat. Hazards (Dordr). 67 (2), 549–567. doi:10.1007/s11069-013-0582-5
Wang, J., Feng, J., Yan, Z., and Zha, J. (2020). Urbanization impact on regional wind stilling: A modeling study in the beijing-tianjin-hebei region of China. J. Geophys. Res. Atmos. 125 (20), 1–17. doi:10.1029/2020JD033132
Wang, X. L., Feng, Y., and Vincent, L. A. (2014). Observed changes in one-in-20 year extremes of canadian surface air temperatures. Atmosphere-Ocean 52 (3), 222–231. doi:10.1080/07055900.2013.818526
Yang, K., Ye, B., Zhou, D., Wu, B., Foken, T., and Qin, J. (2011). Response of hydrological cycle to recent climate changes in the Tibetan Plateau. Clim. Change 109 (3–4), 517–534. doi:10.1007/s10584-011-0099-4
You, Q., Fraedrich, K., Min, J., Kang, S., Zhu, X., and Pepin, N. (2014). Observed surface wind speed in the Tibetan Plateau since 1980 and its physical causes. Int. J. Climatol. 34 (6), 1873–1882. doi:10.1002/joc.3807
Yu, H., Chin, M., Yuan, T., Bian, H., Remer, L. A., and Prospero, J. M. (2015). The fertilizing role of african dust in the amazon rainforest: A first multiyear assessment based on data from cloud-aerosol lidar and infrared pathfinder satellite observations. Geophys. Res. Lett. 42 (6), 1984–1991. doi:10.1002/2015GL063040
Yu, Z., and Li, X. (2015). Recent trends in daily temperature extremes over northeastern China (1960-2011). Quat. Int. 380–381, 35–48. doi:10.1016/j.quaint.2014.09.010
Zeng, Z., Ziegler, A. D., Searchinger, T., Yang, L., Chen, A., and Ju, K. (2019). A reversal in global terrestrial stilling and its implications for wind energy production. Nat. Clim. Chang. 9 (12), 979–985. doi:10.1038/s41558-019-0622-6
Zha, J., Shen, C., Zhao, D., Wu, J., and Fan, W. (2021). Slowdown and reversal of terrestrial near-surface wind speed and its future changes over eastern China. Environ. Res. Lett. 16 (3), 034028. doi:10.1088/1748-9326/abe2cd
Keywords: extreme-wind events, sandstorm, spatio-temporal distributions, variation trends, percentile methods
Citation: Jiang Y, Miao Y, Zhao Y, Liu J and Gao Y (2023) Extreme-wind events in China in the past 50 years and their impacts on sandstorm variations. Front. Earth Sci. 10:1058275. doi: 10.3389/feart.2022.1058275
Received: 30 September 2022; Accepted: 31 October 2022;
Published: 13 January 2023.
Edited by:
Chenghai Wang, Lanzhou University, ChinaReviewed by:
Feimin Zhang, Lanzhou University, ChinaCopyright © 2023 Jiang, Miao, Zhao, Liu and Gao. This is an open-access article distributed under the terms of the Creative Commons Attribution License (CC BY). The use, distribution or reproduction in other forums is permitted, provided the original author(s) and the copyright owner(s) are credited and that the original publication in this journal is cited, in accordance with accepted academic practice. No use, distribution or reproduction is permitted which does not comply with these terms.
*Correspondence: Yunfa Miao, bWlhb3l1bmZhQGx6Yi5hYy5jbg==
Disclaimer: All claims expressed in this article are solely those of the authors and do not necessarily represent those of their affiliated organizations, or those of the publisher, the editors and the reviewers. Any product that may be evaluated in this article or claim that may be made by its manufacturer is not guaranteed or endorsed by the publisher.
Research integrity at Frontiers
Learn more about the work of our research integrity team to safeguard the quality of each article we publish.