 Nishan Kumar Biswas1,2,3*
 Thomas A. Stanley1,2,3
 Dalia B. Kirschbaum4
 Pukar M. Amatya1,2,3
 Chinaporn Meechaiya5
 Ate Poortinga6
 Peeranan Towashiraporn5
- 1University of Maryland, Baltimore County, Baltimore, MD, United States
- 2Goddard Earth Sciences Technology and Research II, Baltimore, MD, United States
- 3Hydrological Sciences Laboratory, NASA Goddard Space Flight Center, Greenbelt, MD, United States
- 4Earth Sciences Division, NASA Goddard Space Flight Center, Greenbelt, MD, United States
- 5Asian Disaster Preparedness Center, Bangkok, Thailand
- 6Spatial Informatics Group, LLC, Pleasanton, CA, United States
The Lower Mekong region is one of the most landslide-prone areas of the world. Despite the need for dynamic characterization of landslide hazard zones within the region, it is largely understudied for several reasons. Dynamic and integrated understanding of landslide processes requires landslide inventories across the region, which have not been available previously. Computational limitations also hamper regional landslide hazard assessment, including accessing and processing remotely sensed information. Finally, open-source software and modelling packages are required to address regional landslide hazard analysis. Leveraging an open-source data-driven global Landslide Hazard Assessment for Situational Awareness model framework, this study develops a region-specific dynamic landslide hazard system leveraging satellite-based Earth observation data to assess landslide hazards across the lower Mekong region. A set of landslide inventories were prepared from high-resolution optical imagery using advanced image-processing techniques. Several static and dynamic explanatory variables (i.e., rainfall, soil moisture, slope, relief, distance to roads, distance to faults, distance to rivers) were considered during the model development phase. An extreme gradient boosting decision tree model was trained for the monsoon period of 2015–2019 and the model was evaluated with independent inventory information for the 2020 monsoon period. The model performance demonstrated considerable skill using receiver operating characteristic curve statistics, with Area Under the Curve values exceeding 0.95. The model architecture was designed to use near-real-time data, and it can be implemented in a cloud computing environment (i.e., Google Cloud Platform) for the routine assessment of landslide hazards in the Lower Mekong region. This work was developed in collaboration with scientists at the Asian Disaster Preparedness Center as part of the NASA SERVIR Program’s Mekong hub. The goal of this work is to develop a suite of tools and services on accessible open-source platforms that support and enable stakeholder communities to better assess landslide hazard and exposure at local to regional scales for decision making and planning.
1 Introduction
Landslides are one of the most dangerous natural hazards that can cause a sudden loss of human life and substantial property damage. The Lower Mekong Region (LMR) is highly susceptible to landslides (Figure 1) due to steep terrain combined with intense rainfall (Stanley and Kirschbaum, 2017). From the inset plot of the Figure 1, four out of five countries (Cambodia, Myanmar, Vietnam, and Thailand) have well covered medium to high susceptible topography with more than 50 fatalities within 2015–2020.

FIGURE 1. Distribution of reported landslide fatalities across the Lower Mekong Region based on NASA’s Global Landslide Catalog (Kirschbaum et al., 2015), with NASA’s global landslide susceptibility map (Stanley and Kirschbaum, 2017).
For the past few decades, several studies have been performed with various approaches to quantify landslide susceptibility in the LMR region at a mostly regional scale. Those approaches can be classified into different types: 1) Machine learning, deep learning and Artificial Intelligence based methods; 2) Simple GIS analysis-based methods; and 3) Physical model-based methods. In Table 1, a summary of the relevant studies in the different categories is shown. Among the latest methods, Tran et al. (2020) used a machine-learning algorithm to characterize the landslide hazards in the Nam Dam Commune, Vietnam region. Van Dao et al. (2020) found that spatially explicit deep learning (DL) neural network models performed better than other models for the prediction of landslide susceptibility in the Muong Lay district (Vietnam). Bui et al. (2019) compared Deep Learning Neural Network (DLNN) with four different types of machine learning models to produce landslide susceptibility. While all these studies were performed to characterize the landslide susceptibility in the LMR using different approaches, to our best knowledge, no study focused on dynamic landslide hazard assessment in an integrated way for the whole region. A few possible reasons for not having a near-real-time integrated hazard system include: 1) dependability of a specific model/algorithm to produce reliable landslide hazard with spatio-temporal consistency; 2) absence of sufficient landslide inventories; 3) lack of access to or availability of relevant hydrometeorological parameters that are either satellite-based or in situ; 4) limitations associated with the computational resources.
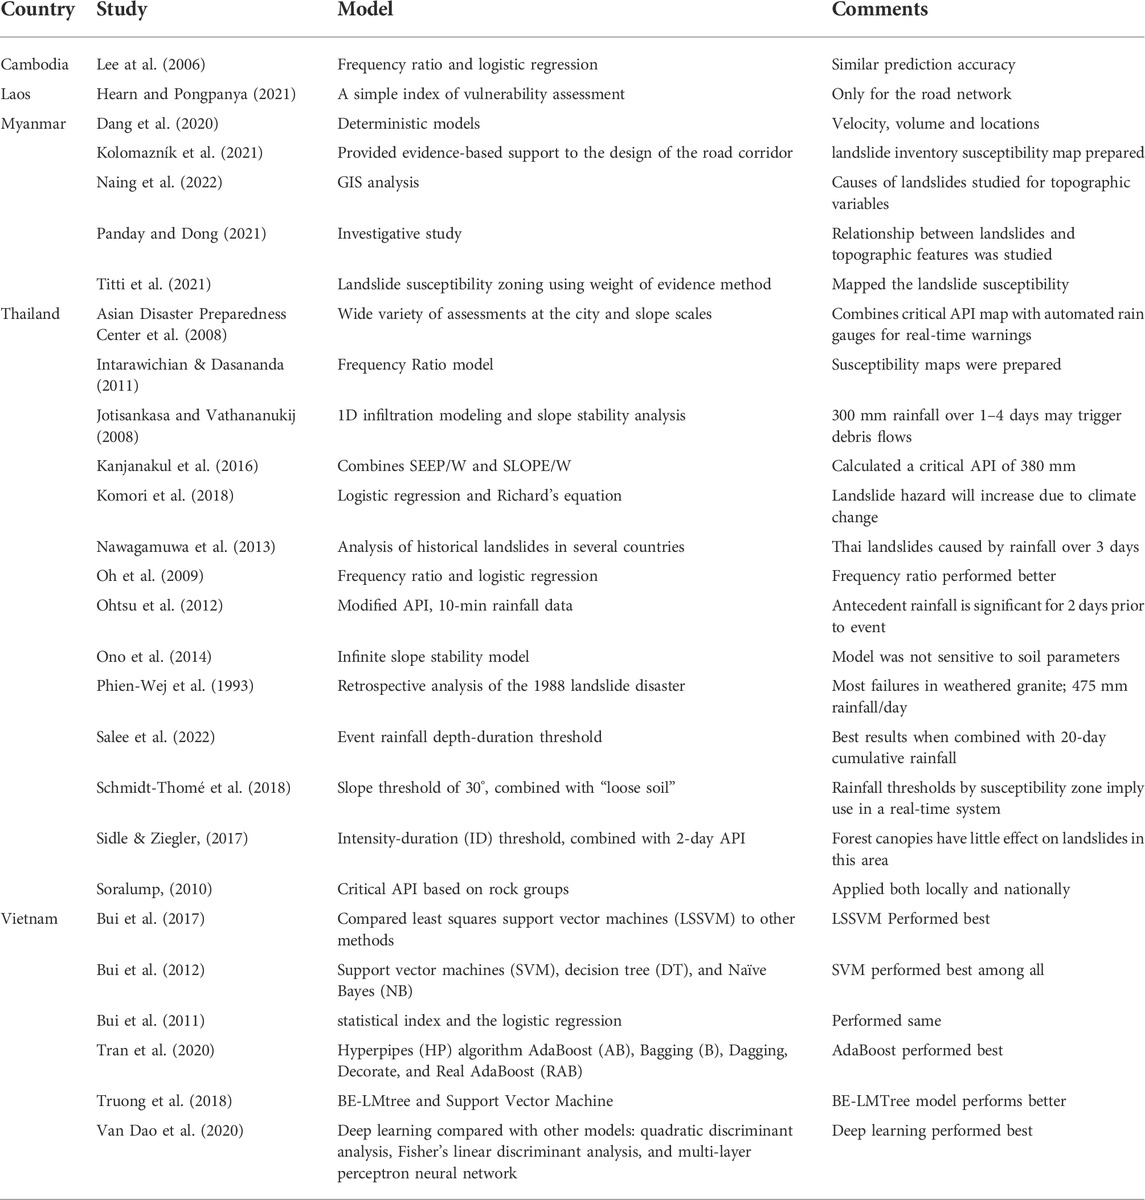
TABLE 1. Geographic region, landslide relevant studies, types, and major findings.
In this study, we focused on minimizing the above-mentioned key issues that hindered near-real-time landslide hazard assessment. To address the first issue, we used a regionalized version of the global Landslide Hazard Assessment for Situational Awareness model (LHASA) (Stanley et al., 2021). LHASA was developed to provide an indication of where and when landslides may be likely around the world. This model uses surface susceptibility (including slope, vegetation, road networks, geology, and forest cover loss) and satellite rainfall data from the Global Precipitation Measurement (GPM) mission to provide near-real-time hazards. The use of machine learning, when combined with other improvements to LHASA, doubled the system’s ability, relative to the prior version (Stanley and Kirschbaum, 2017). Based on this experience, a regional version of the LHASA model was proposed in this study. To address the dearth of published landslide inventories, Amatya et al. (2021b) developed a change detection-based Semi-Automatic Landslide Detection (SALaD-CD) system to detect landslides in the LMR. To address the regional landslide triggering topographic and meteorological data scarcity issue, we used NASA Earth observation datasets, which over the last few decades have demonstrated potential to be used in conjunction with ground-based observations for monitoring water resources and hydroclimatic disasters. Finally, the emergence of cloud computing and advanced IT infrastructure reduces the need for local computational resources, which is helpful for many stakeholder organizations (Biswas and Hossain, 2018; Biswas et al., 2021; Biswas et al., 2020). The freely available framework, Google Earth Engine-GEE (Gorelick et al., 2017), has been widely used for cloud-based scientific analysis and visualization of geospatial datasets by academic, non-profit, business, and government users. It hosts a public data archive that includes a record of more than 4 decades and is increasing every day. This framework has been helping stakeholders and decision makers use a plethora of satellite data without incurring any additional charges and widens the possibilities for developing nations. By integrating the Google Cloud Platform (GCP) with GEE, a regional version of LHASA named LHASA-Mekong was trained, validated, and implemented in this study.
Using LHASA-Mekong, the key research questions addressed in this study are: 1) What level of accuracy can be attained in assessing landslide hazard activity at a regional scale using globally available hydrometeorological and topographical data? and 2) How can a disaster modeling framework be implemented in a cloud environment for near-real-time prediction? In the paper, relevant datasets and methodology of the study are discussed in Section 2, Section 3 emphasizes the results, major findings, and discussion followed by the conclusions and future scope of the study.
2 Data and methodology
2.1 Data
2.1.1 Landslide inventory preparation
The landslide inventories used in this research were mapped utilizing high-resolution satellite imagery from Planet (Planet Team, 2017) using the modified framework of Semi-Automatic Landslide Detection (SALaD) system (Amatya et al., 2021a). The SALaD uses object-based image analysis and machine learning to map landslides. A change detection-based approach was introduced to the SALaD framework (SALaD-CD) utilizing pre- and post-event imagery (Amatya et al., 2021b). The new framework incorporates image normalization, image co-registration, and change detection. In addition to the 22 inventories (2 in Laos, 4 in Myanmar, 1 in Thailand, and 15 in Vietnam) released by Amatya et al., 2021 using SALaD-CD, three new inventories were added in this study (Xam Neua, Laos; Quang Nam, Vietnam; and Sapa, Vietnam). 112 landslides recorded in the Global Landslide Catalog (Kirschbaum et al., 2015) were also included. The map of available landslide inventories and the monthly distribution of these data are shown in Figure 2A.
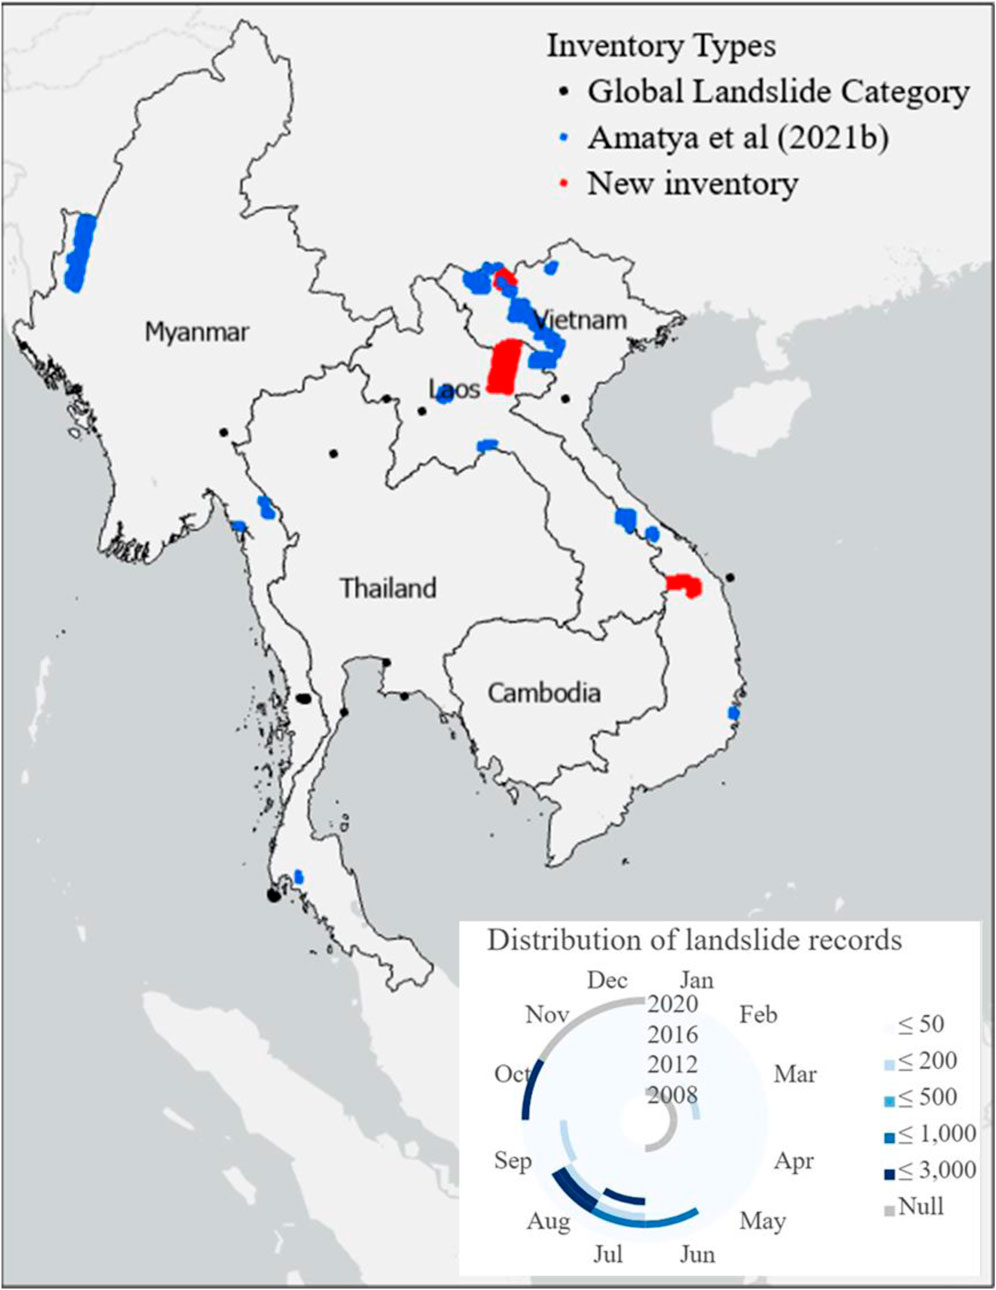
FIGURE 2. Landslide inventory records generated by SaLaD-CD Algorithm over the LMR.
2.1.2 Satellite precipitation estimates
To fill the ground-based observation gap, we depended on satellite-based observations that show reasonable accuracy when compared to the ground-based data. For the precipitation product, we used the Global Precipitation Measurement (GPM) satellite provided Integrated Multi-satellitE Retrievals for GPM (IMERG) version 6 product (Huffman et al., 2015). The IMERG rainfall product was developed using a unified algorithm that provides rainfall estimates by combining data from microwave and infrared instruments on satellites along with precipitation gauge data for calibration. The native spatial resolution of the data is 0.1° by 0.1° (approximately a 10-km by 10-km grid) with a half-hourly temporal resolution. The half-hourly data was converted into 3-day accumulations at the per-pixel basis to feed the model. The mean of 3-day accumulated precipitation is shown in Figure 3B and the 99th percentile of 3-day accumulated precipitation is shown in Figure 3C.
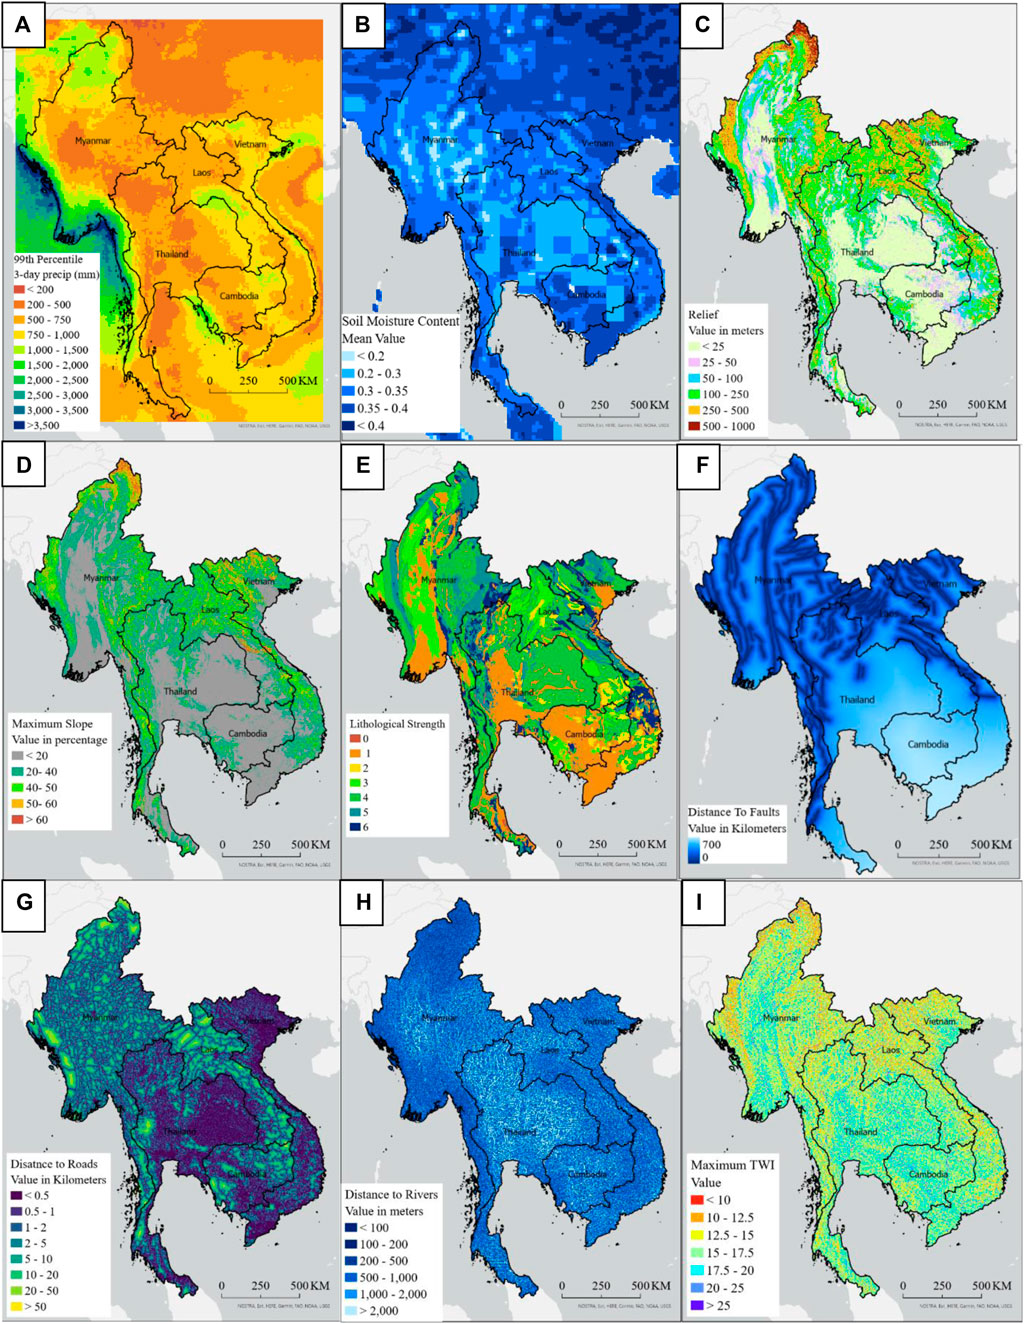
FIGURE 3. Explanatory variables used during the development of LHASA-Mekong Model, (A) 99th percentile of 3-day accumulated precipitation, (B) Mean of CFS soil moisture variable, (C) Relief, (D) Slope, (E) Lithological strength, (F) Distance to faults, (G) Distance to roads, (H) Distance to rivers, and (I) Maximum topographic wetness index (TWI).
2.1.3 Climate forecast system soil moisture
The Climate Forecast System (CFS) version 2 was developed at the Environmental Modeling Center at the National Centers for Environmental Prediction (NCEP) (Saha et al., 2011). It is a fully coupled model representing the interaction between the Earth’s atmosphere, oceans, land, and sea-ice and became operational at NCEP in March 2011. This dataset was chosen because of its acceptability and availability in GEE with the lowest lag-time (earth engine asset id: NOAA/CFSV2/FOR6H). Minimized lag-time and consistent data availability is important for any kind of operational product. The spatial resolution of the data is 0.2° and the variable used in this study was “Volumetric_Soil_Moisture_Content_depth_below_surface_layer_150_cm.” A snapshot of the spatial variability of soil moisture data is shown in Figure 3B.
2.1.4 Static variables
Besides the dynamic variables, several static variables (such as slope, relief, distance to rivers, distance to roads, and lithological strength) were also included in the model. Among the static variables, slope and relief were calculated from the Shuttle Radar Topographic Mission (SRTM) Digital Elevation Model (DEM). The native resolution of the SRTM DEM is 30 m. Lithological strength data were leveraged from the global LHASA model as that was the only consistent and reliable data related to lithological strength for this region. Spatial variability of these parameters is shown in Figure 3. Table 2 summarizes the static variables, and the data sources are mentioned.
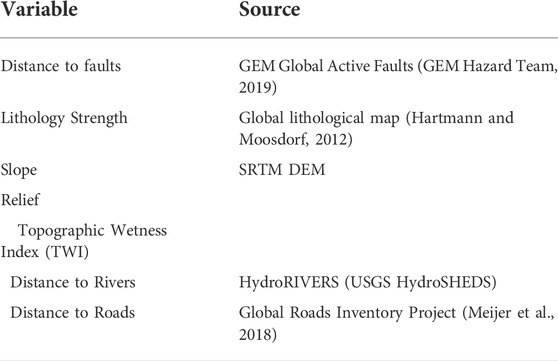
TABLE 2. Static variables and the data sources used in LHASA-Mekong.
2.2 Methodology
The overall methodology of the model development is described in Figure 4.
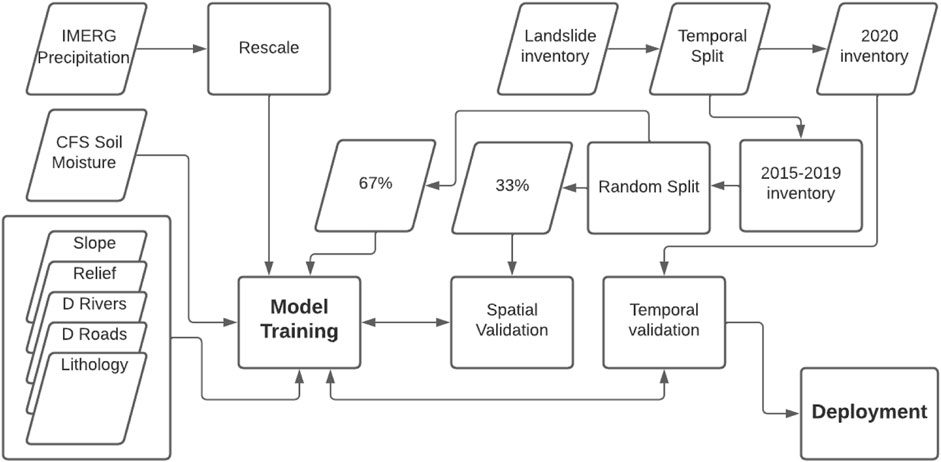
FIGURE 4. Methodology of the development of LHASA-Mekong model.
2.2.1 Rescaling of precipitation
To reflect the climate of each location, we normalized the IMERG 3-day accumulated precipitation data using the 99th percentile of the historical 3-day accumulated precipitation. For each of the pixels within the study area, a log-normal distribution was fitted to the 99th percentile. This was calculated by fitting a log-normal distribution for each pixel from daily rainfall records spanning 2000–2020, then calculating the 99th percentile from the fitted distribution. Finally, this precipitation was used to rescale the 3-day accumulated precipitation and the normalized precipitation was fed into the model framework. A map of the 3-day accumulated precipitation is shown in Figure 3A.
2.2.2 Exploratory data analysis
An exploratory data analysis was performed before training the model. Correlation between some of the most important factors that drive landslide initiation such as precipitation, slope, relief, and soil moisture over the landslide and non-landslide grids is shown in Figure 5.

FIGURE 5. Distributions of the most important variables for landslides (orange) and non-landslide grid cells (blue). The highest correlation (0.45) was between maximum slope and relief.
2.2.3 Model training and validation
Two dynamic variables (precipitation and soil moisture) and five static variables were used to train the model. The landslide inventory was divided into two parts, the 2015–2019 inventory was used to train the model and the 2020 inventory was used for the temporal validation of the model. The 2015–2019 inventory was further split randomly into a part for training the model (67%) and for validating the model (33%). The XGBoost python library was used for training of the model. Based on the global landslide modelling experience, we found that XGBoost model has unique features such as interaction and monotone constraints which makes it more appropriate for landslide hazard quantification (Stanley et al., 2021). Interested users are suggested to see Stanley et al. (2021) and https://xgboost.readthedocs.io/en/stable/to know about the XGBoost model. Model configuration parameters are shown in Table 3. The receiver operating characteristics (ROC) curve was used to quantify the accuracy of the model. In order to generate binary statistics, a probability threshold of 0.08 was chosen based on the 99th percentile of the probability distribution of the non-landslide sample.

TABLE 3. LHASA-Mekong model description with the interaction and monotone constraints.
2.2.4 Python package with google earth engine for operationalization
Upon finalizing the model, it was implemented in Google Cloud Platform (GCP) for the operational prediction. An illustration on implementation of the LHASA-Mekong model in GCP environment is shown in Figure 6. The finalized version of the model was hosted in GCP bucket storage along with the necessary metadata and configuration information. Compute Engine and Notebook API were used together to deploy the model. It was found that the latest IMERG early run precipitation data was not available in GEE. Thus, the notebook API script was used to pull data from the Goddard Earth Sciences Data and Information Services Center server of NASA Goddard Space Flight Center (GSFC). Other dynamic variables (i.e., IMERG late run precipitation data and CFS soil moisture) were captured from GEE. Then the model was imported to make the prediction and the final hazard probability map was pushed back to GCP bucket storage. Finally, the hazard probability map was pushed to GEE as assets from the GCP bucket storage. The hazard probability data can be accessed through GEE and through API services such as Google App Engine.
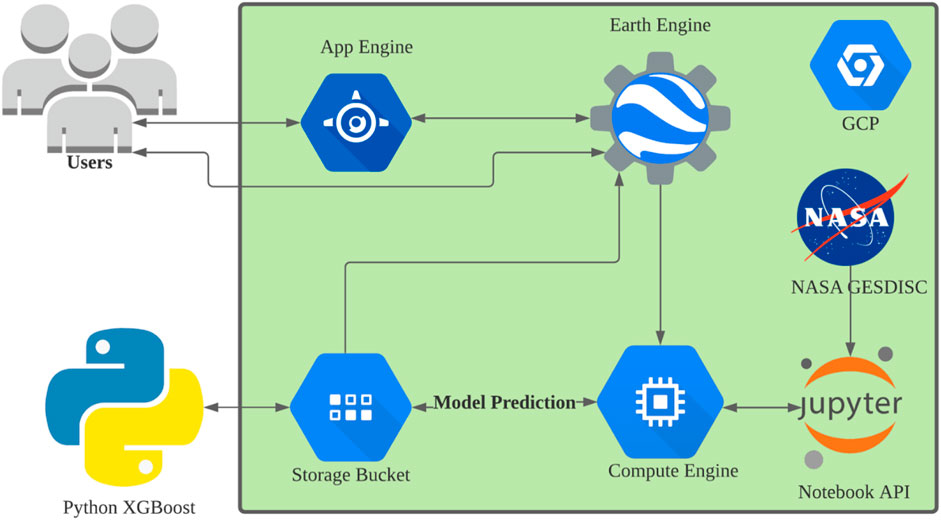
FIGURE 6. LHASA-Mekong Model implementation in Google Cloud Platform (GCP).
3 Results and discussion
3.1 Model training and validation
The Area Under the Curve (AUC) value was 99% in the spatial validation of the model using a random 33% split of the sample data. During the temporal validation of the model, the AUC values were similar to that of the spatial validation. Left panel of Figure 7 shows a feature importance plot combining three different metrics (gain, cover, and weight). Gain is the most relevant attribute to interpret the relative importance of each feature. Cover measures the relative quantity of observations concerned by a feature. Most of the gain was attained by the precipitation and the second-most important variable was maximum slope. Relief also showed similar importance compared to the maximum slope. Soil moisture was incorporated in the model as a dynamic variable, but its importance was quite low compared to the maximum slope and relief. This can be explained by the lower variability and lower accuracy of the variable. The SHapley Additive exPlanations (SHAP) package from python (link: https://shap.readthedocs.io/en/latest/index.html) was also used to explain the feature importance plot of the model, which is shown in right panel of Figure 7. Here it can be seen that precipitation, soil moisture, maximum slope, and relief have a higher positive impact on the predictability of the model. Distance to roads and distance to faults have more negative impacts on the model. Some of the precipitation and soil moisture also have a negative impact on the model due to the frequent occurrence of very moist conditions in flat regions of the LMR.
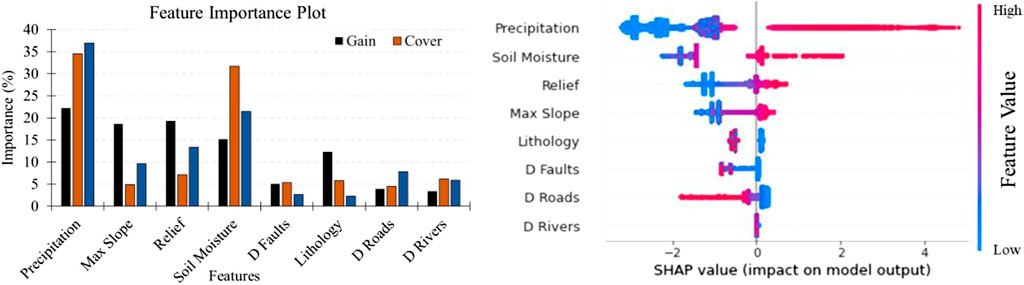
FIGURE 7. Feature importance plot of the LHASA-Mekong model (left) and SHAP value plot (right). Precipitation had the greatest effect on model outcomes, primarily raising hazard values.
3.2 Event-specific assessment
In addition to standard validation metrics, we quantified the model accuracy over six large landslide events. Three events were selected in the different regions from the training period of 2015–2019, and three of the events were picked from the validation period. The news sources for all these events can be found in Amatya et al. (2021). The areas selected from the model training period are: 1) the Hakha-Falam area of Myanmar where a number of landslide events happened on 30 July 2015; 2) the Muong La, Vietnam area for the date of 3 August 2017; and 3) the Xieng Ngeun, Laos area for the date of 31 August 2018. It was found that for the first two events, the true positive rate of the model was higher than 99%. For the third event, it was found that IMERG estimated rainfall underestimated the ground-measured amount of rainfall provided by Mekong River Commission (MRC) and thus the model-generated hazard missed some of the landslide events, reducing the true positive rate to 97%. The model was further validated for the three individual events in 2020 that happened in the Central Vietnam region. Almost all the landslide locations were identified as potentially hazardous (p>0.08), resulting in a true positive rate (TPR) above 90%. Spatial maps of the predictions for all events show a more extensive zone of a hazard than the area known to be affected by landslides (Figure 8).
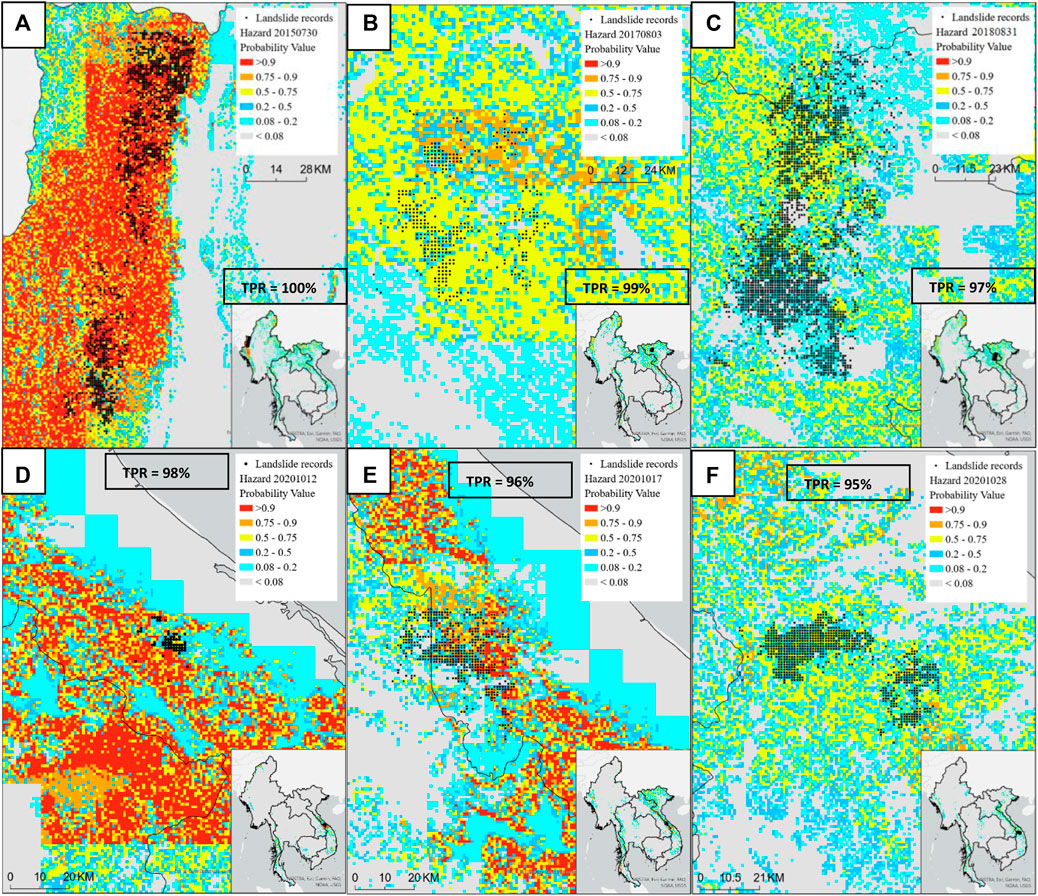
FIGURE 8. Hazard probability map with observed landslide records for different dates, (A) 30 July 2015 over Hakah-Falam, Myanmar; (B) 3 August 2017 over Muong La, Vietnam; (C) 31 August 2018 over Xieng Ngeun, Loas; (D) 12 October 2020 for the Phong Dien, Vietnam event, (E) 17 October 2020 over Huang Hua, Vietnam; and (F) 28 October 2020 for the Quang Nam, Vietnam event. The true positive rate (TPR) for each inventory is shown.
3.3 Retrospective simulation and seasonality analysis
To better understand the seasonal and geographic distribution of landslide hazards across the LMR, the model was run retrospectively for the period 2015–2020. The long-term hazard probability map (Figure 9B) was qualitatively compared with the global landslide susceptibility map (Figure 9A) prepared by Stanley and Kirschbaum (2017) and both maps match quite well, indicating that LHASA-Mekong may correctly reflect the geographic distribution of landslide hazard which is coherence to the locations with higher topographic slope, high amount of rainfall and low lithological strength regions.
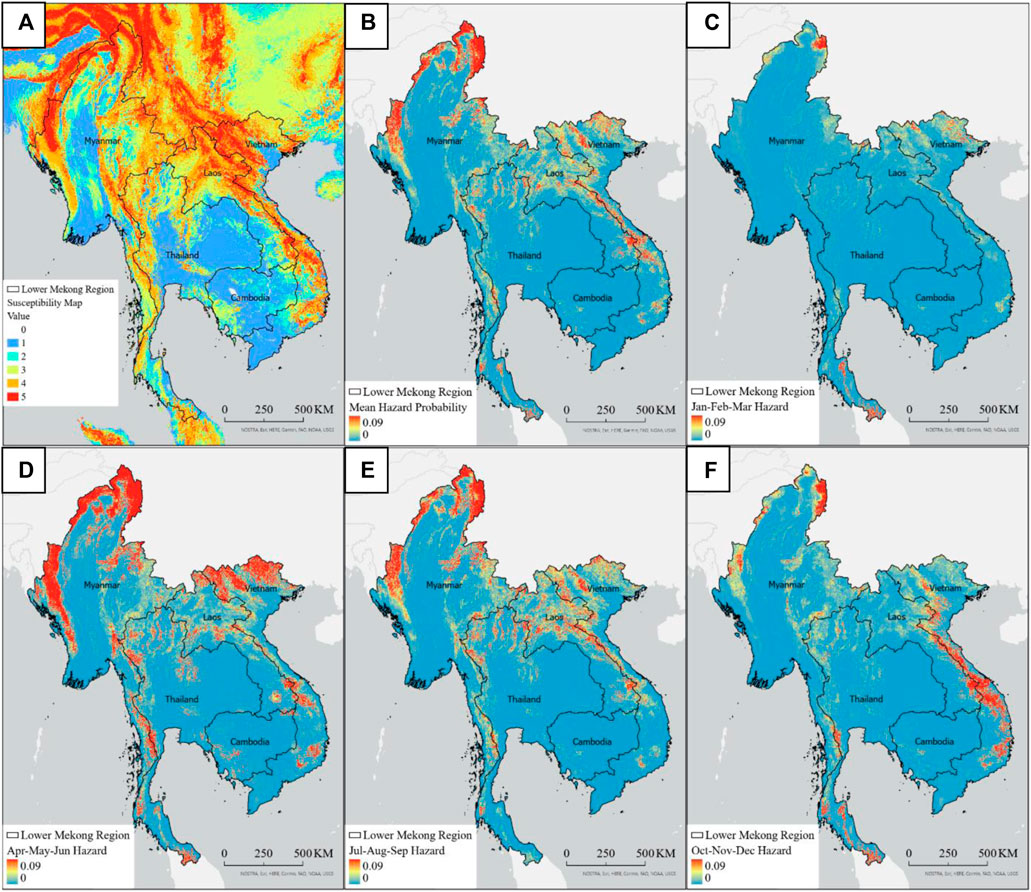
FIGURE 9. The geographic and seasonal distribution of landslide hazard across the LMR; (A) Global susceptibility map, (B) long-term mean hazard probability map, (C) Mean hazard probability map of Jan-March, (D) Mean hazard probability map of April-June, (E) Mean hazard probability map of July-September, (F) Mean hazard probability map of October-December.
The seasonal variation of landslide hazard probabilities is shown in Figures 9C–F. From Figure 7C, the whole LMR had a very low chance of having landslide probability, due to extremely low rainfall that occurs in the dry season. The April-May-June map shows higher probabilities in the western zone of LMR due to the comparatively early arrival of the tropical monsoon period. The same pattern can also be seen in Figures 9E,F with 7f showing very high hazard in the Central Vietnam region due to the late arrival of the monsoon. For the same reason, the Myanmar region showed a very low hazard probability during the same period of the year (October-November-December). When the mean hazard probability was converted into a time-series mean, the seasonality pattern was clearer. In Figure 10, a time-series comparison of weekly precipitation and weekly mean hazard probability (along with range) was shown. From Figure 10, the more frequent occurrence of higher landslide probability corresponds to a higher amount of rainfall. There were a few higher probabilities occurring in the late monsoon and dry season and this was due to the higher rainfall reported by the IMERG precipitation.
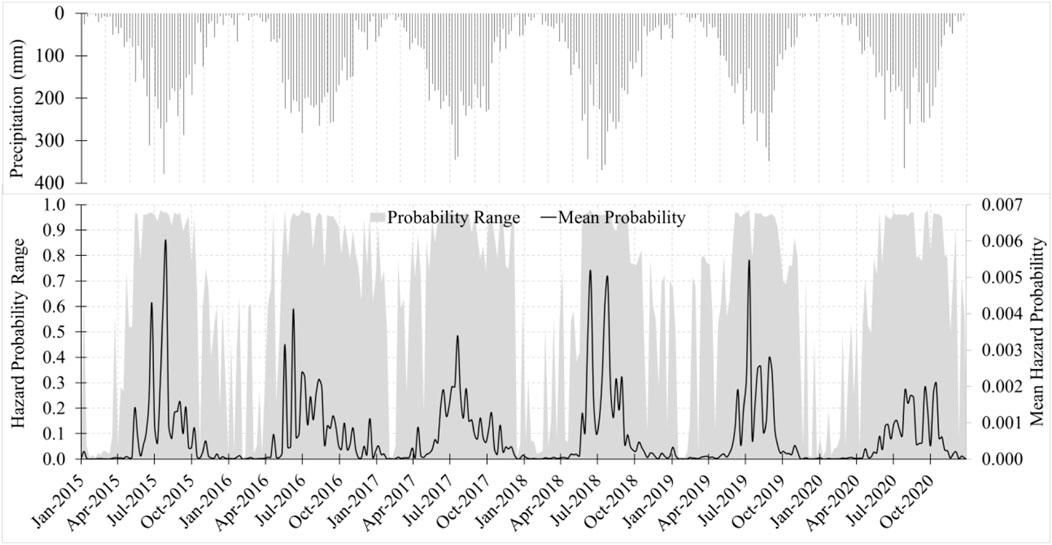
FIGURE 10. Long-term mean hazard probability timeseries at weekly scale with precipitation for the LMR.
3.4 Discussion
The LHASA-Mekong model showed an AUC of 99%, which is sometimes treated as overfitting. To reduce overfitting, we used monotone constraints and interaction constraints that are helpful in reducing this nature of machine learning models. In order to re-validate the applicability of the model, we took the following steps: 1) independently validated the model with the 2020 landslide inventory that was not included in the training sample, 2) checked the model prediction accuracy against eight inventories spanning from 2015–2020, 3) evaluated the predicted hazard outputs at annual and seasonal scale to make sure that the model has reliable and consistent accuracy temporally and spatially.
Model uncertainty also stems from variability and accuracy of the landslide triggering variables selected for the model. The precipitation triggering information from NASA GPM IMERG has known challenges in representing the total rainfall accumulations for short-duration, high intensity events as well as orographically-impacted events. We also consider CFS soil moisture product due to its near-real-time availability; however, the 25 km spatial resolution of the CFS product cannot adequately represent the actual soil moisture content at local spatial scales. Further, in this tropical environment validating this type of product is not feasible due to the dearth of in situ soil moisture information. Among the topographic variables, NASA DEM can be another source of uncertainty that could be propagated to slope and relief features of the model, with more recent topographic changes not accurately resolved in the data source on which the model was trained. Finally, the SALaD algorithm-generated inventory may not robustly cover all cover types where landslides may occur, which may bias the model validation. However, this is a challenge inherent in all data-limited environments and care was taken to ensure that we developed the most comprehensive inventory possible to support this work.
The false alarm rate generated by the model was higher than anticipated but is similar to the trend observed in the case of Global LHASA model. The model solely depends on the triggering variables in estimating the landslide hazard probability. During the model training phase, random grids in the spatial-temporal direction were treated as non-landslide samples; however, the non-landslide areas cannot be corroborated in all cases. As such, the false alarm rate should be regarded as a relative estimate to represent the expansiveness of the potential hazard impact area for situational awareness rather than providing an accurate prediction of landslide events occurring at very fine resolution. Furthermore, the threshold defined in the model to distinguish between landslides and non-landslides played another role in a higher false positive rate for the tradeoffs. A well-established landslide inventory along with further testing on the threshold can minimize the false positive rate.
To reduce the dependency on the local computation resources, the modeling framework was implemented in the Google Cloud Platform. The uniqueness of this framework is that it was developed based on the most updated open-source cloud computing framework. The GCP provides a great opportunity in the terms of deployment, data and application programming interface (API) accessibility, reproducibility, and scalability. The model can be customized according to the available data, retrained and re-deployed to the same bucket in the easiest way just by using a web browser. An ongoing effort has focused on training and capacity building of the regional agencies within the LMR to use LHASA-Mekong in order to harness the power of freely available cloud computing resources and the scalable framework for decision-making and emergency management.
4 Conclusion
Using globally available hydrologic and topographic variables and extensive new landslide inventories, LHASA-Mekong was trained, validated, revalidated, and deployed as part of this study. The model was designed to keep customizability in mind so that end-users can retrain and deploy it based on the accessibility to improved triggering variables and regional data. Currently, the model has been producing nowcast hazard probability, but work is ongoing to explore how forecast precipitation products such as Climate Hazards center InfraRed Precipitation with Station data - Global Ensemble Forecast System (CHIRPS-GEFS, Harrison et al., 2022). Another benefit of this open-source framework with publicly available source data is that it can be used for the other regions. However, care must be taken to ensure that data is sufficient, and the proper training and validation procedures are followed to ensure robust performance. Ultimately, this framework has tremendous potential to generate important landslide hazard assessments for data-sparse regions to inform emergency response, decision making, and planning to mitigate impacts within communities.
Data availability statement
The raw data supporting the conclusion of this article will be made available by the authors, without undue reservation.
Author contributions
DK, TS, PA, and PT contributed to the study conception and design. Material preparation, data collection and analysis were performed by NB, TS, and PA. The first draft of the manuscript was written by NB and all authors commented on previous versions of the manuscript. All authors read and approved the final manuscript. There are no competing interests related to this work.
Funding
This research was funded by the NASA SERVIR Science Team (NNH18ZDA001N-18-SERVIR18_2-0036) and the collaboration with ADPC was supported via the joint United States Agency for International Development (USAID) and NASA initiative SERVIR-Mekong.
Acknowledgments
We would also like to thank SERVIR-Mekong team at ADPC, SERVIR Coordination Office team, and Spatial Informatics Group for their valuable support throughout the study.
Conflict of interest
Author AP was employed by Spatial Informatics Group, LLC.
The remaining authors declare that the research was conducted in the absence of any commercial or financial relationships that could be construed as a potential conflict of interest.
Publisher’s note
All claims expressed in this article are solely those of the authors and do not necessarily represent those of their affiliated organizations, or those of the publisher, the editors and the reviewers. Any product that may be evaluated in this article, or claim that may be made by its manufacturer, is not guaranteed or endorsed by the publisher.
References
Amatya, P., Kirschbaum, D., and Stanley, T. (2021b). Rainfall‐induced landslide inventories for Lower Mekong based on Planet imagery and a semi‐automatic mapping method. Geoscience Data J. doi:10.1002/gdj3.145
Amatya, P., Kirschbaum, D., Stanley, T., and Tanyas, H. (2021a). Landslide mapping using object-based image analysis and open source tools. Eng. Geol. 282, 106000. doi:10.1016/j.enggeo.2021.106000
Asian Disaster Preparedness Center (2008). Department of Mineral Resources, & Geotechnical Engineering Research and Development Center. Landslide Mitigation Demonstration Project for Patong City (Asian Program for Regional Capacity Enhancement for Landslide Impact Mitigation (RECLAIM II)) [Final Report]. Bankok, Thailand.
Biswas, N. K., and Hossain, F. (2018). A scalable open-source web-analytic framework to improve satellite-based operational water management in developing countries. J. Hydroinformatics 20 (1), 49–68. doi:10.2166/hydro.2017.073
Biswas, N. K., Hossain, F., Bonnema, M., Aminul, A., Biswas, R., Buiyan, A., et al. (2020). A computationally efficient flashflood early warning system for a mountainous and transboundary river basin in Bangladesh. J. Hydroinformatics 22 (6), 1672–1692. doi:10.2166/hydro.2020.202
Biswas, N. K., Hossain, F., Bonnema, M., Lee, H., and Chishtie, F. (2021). Towards a global Reservoir Assessment Tool for predicting hydrologic impacts and operating patterns of existing and planned reservoirs. Environ. Model. Softw. 140, 105043. doi:10.1016/j.envsoft.2021.105043
Bui, D. T., Lofman, O., Revhaug, I., and Dick, O. (2011). Landslide susceptibility analysis in the Hoa Binh province of Vietnam using statistical index and logistic regression. Nat. Hazards (Dordr). 59 (3), 1413–1444. doi:10.1007/s11069-011-9844-2
Bui, D. T., Pradhan, B., Lofman, O., Revhaug, I., and Dick, O. B. (2012). Landslide susceptibility mapping at Hoa Binh province (Vietnam) using an adaptive neuro-fuzzy inference system and GIS. Comput. Geosciences 45, 199–211. doi:10.1016/j.cageo.2011.10.031
Bui, D. T., Tuan, T. A., Hoang, N. D., Thanh, N. Q., Nguyen, D. B., Van Liem, N., et al. (2017). Spatial prediction of rainfall-induced landslides for the Lao Cai area (Vietnam) using a hybrid intelligent approach of least squares support vector machines inference model and artificial bee colony optimization. Landslides 14 (2), 447–458. doi:10.1007/s10346-016-0711-9
Dang, K., Loi, D. H., Sassa, K., Duc, D. M., and Ha, N. D. (2020). “Hazard assessment of a rainfall-induced deep-seated landslide in Hakha city, Myanmar,” in Workshop on world landslide forum (Cham: Springer), 249–257. doi:10.1007/978-3-030-60706-7-23
GEM Hazard Team (2019). GEM global active faults. Available at: https://github.com/GEMScienceTools/gem-global-active-faults/tree/master/geopackage (Accessed July 19, 2019).
Gorelick, N., Hancher, M., Dixon, M., Ilyushchenko, S., Thau, D., and Moore, R. (2017). Google earth engine: Planetary-scale geospatial analysis for everyone. Remote Sens. Environ. 202, 18–27. doi:10.1016/j.rse.2017.06.031
Harrison, L., Landsfeld, M., Husak, G., Davenport, F., Shukla, S., Turner, W., et al. (2022). Advancing early warning capabilities with CHIRPS-compatible NCEP GEFS precipitation forecasts. Sci. Data 9, 375–413. doi:10.15780/G2PH2M
Hartmann, J., and Moosdorf, N. (2012). The new global lithological map database GLiM: A representation of rock properties at the earth surface. Geochem. Geophys. Geosyst. 13. doi:10.1029/2012GC004370
Hearn, G. J., and Pongpanya, P. (2021). Developing a landslide vulnerability assessment for the national road network in Laos. Q. J. Eng. Geol. Hydrogeo. 54 (3). doi:10.1144/qjegh2020-110
Huffman, G. J., Bolvin, D. T., Braithwaite, D., Hsu, K., Joyce, R., Xie, P., et al. (2015). NASA global precipitation measurement (GPM) integrated multi-satellite retrievals for GPM (IMERG). Algorithm Theoretical Basis Document (ATBD) version. 4 (26).
Intarawichian, N., and Dasananda, S. (2011). Frequency ratio model based landslide susceptibility mapping in lower Mae Chaem watershed, Northern Thailand. Environ. Earth Sci. 64 (8), 2271–2285. doi:10.1007/s12665-011-1055-3
Jotisankasa, A., and Vathananukij, H. (2008). “Investigation of soil moisture characteristics of landslide-prone slopes in Thailand,“ in International conference on management of landslide hazard in the Asia-Pacific region, November 11–15, 2008, 12
Kanjanakul, C., Chub-uppakarn, T., and Chalermyanont, T. (2016). Rainfall thresholds for landslide early warning system in Nakhon Si Thammarat. Arab. J. Geosci. 9 (11), 584. doi:10.1007/s12517-016-2614-4
Kirschbaum, D., Stanley, T., and Zhou, Y. (2015). Spatial and temporal analysis of a global landslide catalog. Geomorphol. 249, 4–15. doi:10.1016/j.geomorph.2015.03.016
Kolomazník, J., Hlavacova, I., and Schloegl, M. (2021). Supporting disaster risk reduction with satellite Earth Observation Landslide hazard assessment for the Chin road corridor, Myanmar. In EGU General Assembly Conference Abstracts (pp. EGU21-1476). doi:10.5194/egusphere-egu21-14769
Komori, D., Rangsiwanichpong, P., Inoue, N., Ono, K., Watanabe, S., and Kazama, S. (2018). Distributed probability of slope failure in Thailand under climate change. Clim. Risk Manag. 20, 126–137. doi:10.1016/j.crm.2018.03.002
Lee, J. K., Kim, H. S., Kuk, S. H., and Park, S. W. (2006). in Development of an e-Engineering environment based on service-oriented architectures. Cooperative Design, Visualization, and Engineering. Editor Y. Luo. LNCS 4101. doi:10.1007/s00254-006-0256-7
Meijer, J. R., Huijbregts, M. A. J., Schotten, K. C. G. J., and Schipper, A. M. (2018). Global patterns of current and future road infrastructure. Environ. Res. Lett. 13, 064006. doi:10.1088/1748-9326/aabd42
Naing, M. T., Aye, M. M., and Oo, K. L. (2022). Rainfall and landslide susceptibility in Hakha environ in northern chin state, Myanmar. Br. J. Arts Humanit. 4 (1), 01–14. doi:10.34104/bjah.02201014
Nawagamuwa, U. P., Bhasin, R. K., Kjekstad, O., and Arambepola, N. M. S. I. (2013). “Recommending regional rainfall threshold values for early warning of landslides in the asian region,” in Landslide science and practice: Volume 4: Global environmental change. Editors C. Margottini, P. Canuti, and K. Sassa (Springer), 235–241. doi:10.1007/978-3-642-31337-0-30
Oh, H. J., Lee, S., Chotikasathien, W., Kim, C. H., and Kwon, J. H. (2009). Predictive landslide susceptibility mapping using spatial information in the Pechabun area of Thailand. Environ. Geol. 57 (3), 641–651. doi:10.1007/s00254-008-1342-9
Ohtsu, H., Chaleiwchalard, N., Koga, H., and Soralump, S. (2012). “A study on landslide early warning system considering the effect of antecedent rainfall on slope stability,” in The 41st symposium on rock mechanics, 252–257.
Ono, K., Kazama, S., and Ekkawatpanit, C. (2014). Assessment of rainfall-induced shallow landslides in Phetchabun and Krabi provinces, Thailand. Nat. Hazards (Dordr). 74 (3), 2089–2107. doi:10.1007/s11069-014-1292-3
Panday, S., and Dong, J. J. (2021). Topographical features of rainfall-triggered landslides in Mon state, Myanmar, August 2019: Spatial distribution heterogeneity and uncommon large relative heights. Landslides 18 (12), 3875–3889. doi:10.1007/s10346-021-01758-7
Phien-Wej, N., Nutalaya, P., Aung, Z., and Zhibin, T. (1993). Catastrophic landslides and debris flows in Thailand. Bull. Int. Assoc. Eng. Geol. 48 (1), 93–100. doi:10.1007/bf02594981
Saha, S., Moorthi, S., Wu, X., Wang, J., Nadiga, S., Tripp, P., and Becker, E. (2011). NCEP climate forecast system version 2 (CFSv2) 6-hourly products. Res. Data Archive A. T. Natl. Cent. Atmos. Res. Comput. Inf. Syst. Laboratory 10. doi:10.5065/D61C1TXF
Salee, R., Chinkulkijniwat, A., Yubonchit, S., Horpibulsuk, S., Wangfaoklang, C., and Soisompong, S. (2022). New threshold for landslide warning in the southern part of Thailand integrates cumulative rainfall with event rainfall depth-duration. Nat. Hazards (Dordr). 113, 125–141. doi:10.1007/s11069-022-05292-0
Schmidt-Thomé, P., Tatong, T., Kunthasap, P., and Wathanaprida, S. (2018). Community based landslide risk mitigation in Thailand. Episodes 41 (4), 225–233. doi:10.18814/epiiugs/2018/018017
Sidle, R. C., and Ziegler, A. D. (2017). The canopy interception–landslide initiation conundrum: Insight from a tropical secondary forest in northern Thailand. Hydrol. Earth Syst. Sci. 21 (1), 651–667. doi:10.5194/hess-21-651-2017
Soralump, S. (2010). Geotechnical approach for the warning of rainfall-triggered landslide in Thailand considering antecedence rainfall data. International Conference on Slope 2010: Geotechnique and Geosynthetics for Slopes, Chiangmai, Thailand
Stanley, T., and Kirschbaum, D. B. (2017). A heuristic approach to global landslide susceptibility mapping. Nat. Hazards 87 (1), 145–164. doi:10.1007/s11069-017-2757-y
Stanley, T. A., Kirschbaum, D. B., Benz, G., Emberson, R. A., Amatya, P. M., Medwedeff, W., et al. (2021). Data-driven landslide nowcasting at the global scale. Front. Earth Sci. (Lausanne). 378. doi:10.3389/feart.2021.640043
Titti, G., Borgatti, L., Zou, Q., Cui, P., and Pasuto, A. (2021). Landslide susceptibility in the belt and road countries: Continental step of a multi-scale approach. Environ. Earth Sci. 80, 630. doi:10.1007/s12665-021-09910-1
Tran, Q. C., Minh, D. D., Jaafari, A., Al-Ansari, N., Minh, D. D., Van, D. T., et al. (2020). Novel ensemble landslide predictive models based on the hyperpipes algorithm: A case study in the nam dam commune, vietnam. Appl. Sci. 10 (11), 3710. doi:10.3390/app10113710
Truong, X. L., Mitamura, M., Kono, Y., Raghavan, V., Yonezawa, G., Truong, X. Q., et al. (2018). Enhancing prediction performance of landslide susceptibility model using hybrid machine learning approach of bagging ensemble and logistic model tree. Appl. Sci. 8 (7), 1046. doi:10.3390/app8071046
Keywords: Landslides, lower mekong countries, google earth engine (GEE), XGBoost (extreme gradient boosting), machine learning, satellite earth observation, LEWS
Citation: Biswas NK, Stanley TA, Kirschbaum DB, Amatya PM, Meechaiya C, Poortinga A and Towashiraporn P (2022) A dynamic landslide hazard monitoring framework for the Lower Mekong Region. Front. Earth Sci. 10:1057796. doi: 10.3389/feart.2022.1057796
Received: 30 September 2022; Accepted: 21 October 2022;
Published: 09 November 2022.
Edited by:
Wei Zhao, Chinese Academy of Sciences (CAS), ChinaReviewed by:
Veronica Pazzi, University of Trieste, ItalyIonut Cristi Nicu, Norwegian Institute for Cultural Heritage Research, Norway
Copyright © 2022 Biswas, Stanley, Kirschbaum, Amatya, Meechaiya, Poortinga and Towashiraporn. This is an open-access article distributed under the terms of the Creative Commons Attribution License (CC BY). The use, distribution or reproduction in other forums is permitted, provided the original author(s) and the copyright owner(s) are credited and that the original publication in this journal is cited, in accordance with accepted academic practice. No use, distribution or reproduction is permitted which does not comply with these terms.
*Correspondence: Nishan Kumar Biswas, bi5iaXN3YXNAbmFzYS5nb3Y=